cost of winning: what contributing factors play the most ... · neither regular season winning...
TRANSCRIPT

Cost of Winning: What contributing factors play the most significant roles in increasing the winning percentage of a major league baseball
team?
The Honors Program Senior Capstone Project
Student’s Name: Patrick Tartaro Faculty Sponsor: Betty Yobaccio
April 2012

Table of Contents Abstract ..................................................................................................................................... 1 Introduction ............................................................................................................................... 1 Literary Review ......................................................................................................................... 3 Methodolgy ............................................................................................................................. 10 Results ..................................................................................................................................... 13 Discussion…………………………………………………………………………………….21 Conclusion……………………………………………………………………………………28 References ............................................................................................................................... 30

Cost of Winning: What contributing factors play the most significant roles in increasing the winning percentage of a major league baseball team? Patrick Tartaro
- 1 -
ABSTRACT Over the past decade, discussions of competition disparity in Major League Baseball have been brought to the forefront of many debates regarding the sport. The belief that "large market" teams such as the New York Yankees buy their championships through acquiring star talent at high prices has become a common belief of many followers of the game. This research will answer the pressing question, "What are the most significant factors that correlate to a Major League Baseball Team’s winning percentage?”. I used stepwise regression to identify factors significantly related to winning percentage. Interestingly enough, payroll is not a significant factor in the best model. Its high correlation with several other model variables may explain this.
INTRODUCTION
Dating back to early times, sport has been an integral part of our society and culture.
Only in recent history has the idea of sports and competition been transformed into a business.
Ranging from college athletics to professional sports, important business decisions must be
made by both individuals and entire organizations in order to be successful in the industry.
Young high school athletes must now investigate financial components of selecting a school,
instead of focusing solely on the sport itself. Every day one can turn on the news and see
another professional athlete in a contract dispute with his team. As sports grow increasingly
popular in America, the correlation between money and sports will also be impacted. Owners
continue to find new ways to make money, including team merchandise sales, which also
serve as an effective marketing strategy for their sports teams. Professional sports have truly
become a business, with money and financial decisions becoming an ever-growing part of
daily team decisions. All these examples display particular evidence to prove how financial
components of running a team are just as crucial as the athlete’s performance on the field.
In any type of business, ranging from companies such as Wal-Mart and McDonald’s,
all the way to Major League Baseball, effectively allocating capital is critical to business
success. Owners and general managers of major league baseball clubs must find the most

Cost of Winning: What contributing factors play the most significant roles in increasing the winning percentage of a major league baseball team? Patrick Tartaro
- 2 -
effective level of allocations to players, coach, and executive salaries, concession costs,
stadium maintenance and staff, among countless other expenses. With this is in mind, it is
important to understand the effectiveness of each of these components on the overall
profitability of the team. Clubs must analyze statistics on each of these components and rank
which play the most crucial role in generating the most success for the team. Knowing the
correlation and impact that player salaries and other contributing factors have on win
percentage is required knowledge to Major League Baseball owners. Obtaining this
knowledge will greatly affect important decisions of baseball clubs as they will need to
evaluate which approach they want to take for their team: either attempt to buy star players
when they become available (e.g. New York Yankees) or have “home grown talent” where
players are brought up through the farm systems with minimal costs (e.g. Tampa Bay Rays).
Particularly in Major League Baseball, disparity in team salaries has been portrayed by
many as a major defect in the sport today, as there is no current salary cap. A salary cap
allows the league to place a limit on the amount of money a club can spend on player salaries
and/or team payrolls (Candela, 2011). Without one, some owners, players, reporters, and fans
believe that teams with the highest overall salaries effectively have the highest winning
percentages. The main appeal and virtue of all sports, whether at the high school, collegiate,
or professional level of competition, is the idea that any team can win at anytime. The idea
that winning is directly related to the level of funds owned by the team completely shatters
this idea of contest, and playing the sport itself would prove to be irrelevant.
This study will analyze whether the overall payroll of a team is a significant factor in
increasing a team’s winning percentage, or are other financial or performance factors more
significant. Potential factors that affect winning percentage include: performance factors,
such as home and road wins and losses, fielding percentage, runs per game allowed, total
earned runs allowed, earned run average of pitchers, strikeouts, walks, errors, runs per game
scored, total runs scored, hits, home runs, runs batted in, stolen bases, batting average, on base
percentage, slugging percentage, as well as factors with financial implications, such as total

Cost of Winning: What contributing factors play the most significant roles in increasing the winning percentage of a major league baseball team? Patrick Tartaro
- 3 -
fan attendance and stadium capacity. This study will use regression analysis to identify the
most significant factors contributing to a team’s winning percentage.
LITERATURE REVIEW
With this topic being such a controversial topic amongst baseball fans, there are many
views and research on what factors actually impact a team’s winning percentage.
Conventional wisdom indicates that the higher the team salary, the greater the winning
percentage, and the better the fan attendance will be. However, evidence from the Tampa Bay
Rays runs contrary to this, as they are one of the few teams with an extremely low payroll,
and a very high winning percentage, reaching the playoffs three times in the last four years.
However, this has not resulted in increased fan attendance. It is no wonder that during the
2011 MLB Playoffs, the Tampa Bay Rays expressed sincere displeasure with their fan base,
particularly related to their overall attendance. After selling out game 3 with 32,828 fans, fan
attendance dropped to only 28,299 in game 4 when the Rays were ultimately eliminated.
Tampa Bay’s owner Stuart Sternberg showed his displeasure in a statement, “Were four years
into winning. We’re getting to the point where we don’t control our own destiny. This is an
untenable as a model” (Caple, 2011). According to the Cot’s Baseball Contracts site, the
Rays’ payroll is lower this year than it was three years ago, and $30 million lower than last
year. Ray’s superstar Evan Longoria expressed this same concern with the fans three years
prior in a statement, “They've wanted to watch a contender. And for us to play good baseball
for three years now, and for us to be in a spot to clinch again and go to the playoffs, we're all
confused as to why it's only 15,000 to 20,000 in the building” (Caple, 2011).
Despite this, the team is still winning. Mr. Sternberg’s frustration comes from the
recurrent idea that higher payrolls inducing more winning. Being one of the most successful
teams in recent years, while at the bottom of the league in payroll year after year, leaves
Sternberg questioning whether spending more money on players will help lead to a
championship. He states, “When you're sitting here at this point and you lost by a run, you

Cost of Winning: What contributing factors play the most significant roles in increasing the winning percentage of a major league baseball team? Patrick Tartaro
- 4 -
know another X dollars might have changed things," Sternberg said. "Three or five million
wouldn't have changed things necessarily but 15 to 30 might have. That's where we were. And
for the foreseeable future that's what we've got" (Caple, 2011). This is exactly the question
my study attempts to answer: does increasing a team’s payroll really increase a team’s ability
to win, or are other factors more significant? For example, should owners focus on obtaining
players who hit home runs or, players who steal bases? Or maybe hitters are not important at
all and he should focus on obtaining an excellent pitching staff.
With a more league-based approach, Major League Baseball as an entity must monitor
and evaluate the effects of disparities in spending throughout the league to maintain the
competitive integrity of the sport. A major issue taking the forefront in recent years has been
the idea of implementing a salary cap into Major League Baseball similar to that used in the
National Football League. Bud Selig, Major League Baseball Commissioner, is faced with
this challenge, which could change the sport forever. The difficulty lies with the fact that
each team has varying financial situations based on many factors such as owner net worth,
city size, and media market, among others. A team such as the New York Yankees has much
more financial leverage than a team such as the Seattle Mariners. The market size of these
two cities varies greatly, as does the winning percentage of the two teams. In Michael
Lewis’s (2008) study, he analyzes the growing concern of different size markets and the effect
market size has on the competition in sports. Lewis highlights how popular sports are
becoming in America, in particular baseball, where attendance at games increased from 55.5
million to 70 million people in only 25 years (Lewis, 2008). Analyzing all the factors that
contribute to a successful franchise and weighing the importance of each can give Bud Selig a
more substantial understanding of the effectiveness of the possible solutions he will
implement.
Many studies, as is the case with Schwartz and Zarrow, believe that payroll is a
significant factor in the winning percentage of a major league team. In their study, they
identified specific errors in baseball from 1997 to 2008 and attempted to determine payrolls
effect on both regular season wins and post season wins. In regards to the regular season,
their findings concluded that since the free agency era, the ability to purchase talent on the

Cost of Winning: What contributing factors play the most significant roles in increasing the winning percentage of a major league baseball team? Patrick Tartaro
- 5 -
open market diminished the random elements of professional competition, leading to
expanded effects of team payroll on winning percentage in regular season games (Schwartz &
Zarrow, 2009). Interestingly enough, the study determined that in the postseason, there was
no statistically significant relationship between wins and payroll. It even identified that
neither regular season winning percentage, performance over the final month of the season,
nor do a team’s pitching statistics seem to be related to a team’s post season success. With
that said, compared to other professional sports leagues, Major League Baseball in fact has a
strong competitive balance according to the study. While having a high payroll in the regular
season may allow some of the same teams to be perennial playoff teams, since 2000, eight
different teams have won a World Series championship (Schwartz & Zarrow, 2009). Moving
forward, this study raises even more questions about disparity in baseball and whether or not
certain limitations such as a salary cap or luxury tax would further improve competitive
balance in baseball.
A variation of this study was analyzed in a recent Time magazine article based on the
2011 movie Moneyball, where each team’s cost per win versus their OPS (on-base percentage
plus slugging percentage) was examined to see which team plays most efficiently. In Time’s
research, it was discovered that perennial winners such as the New York Yankees, Boston
Red Sox, and Philadelphia Phillies spend over $1.5 million dollars per victory. In correlation
with these types of spending, only the Yankees and Red Sox have team OPS’s above .790.
Almost all of the other teams spending over $1.5 million per win have worse team OPS’s than
many of the lower market teams, many of which spend less than $1 million per win. Billy
Beane, coach of the Oakland A’s in the early 2000s overcame his lack of high payroll by
seizing undervalued talent (Gregory, 2011). This has become a common practice of many
teams today as many franchises do not have the type of funding to keep up with the spending
of high market ball clubs. This study shows supports the idea that there can also be other
factors besides payroll that exhibit strong relationships with winning percentage.
As aforementioned, one potential solution to baseballs competitive disparity that has
been implemented is the luxury tax placed on teams with high player salaries. Because there

Cost of Winning: What contributing factors play the most significant roles in increasing the winning percentage of a major league baseball team? Patrick Tartaro
- 6 -
is no salary cap in baseball as there is in other sports such as football, the league places a tax
on teams whose payroll exceeds $178 million for the 2011 season. The fines vary based on
the number of offences, but to date there has only been four teams who have paid the tax. The
league takes the money into an industry growth fund that is used to fund baseball programs in
developing countries with limited availability to equipment and playing fields (Dietl, Lang, &
Werner, 2008). However, some people, such as Michael Lewis (2008), argue that the luxury
tax is not effective in leveling the playing field, as statistics show that only three teams with
payrolls under $100 million have won a World Series in the past ten years. As discussed by
Schwartz and Zarrow, while having a large payroll may not necessarily ensure a World Series
victory, statistics show that it does have an extremely high correlation with the amount of
playoff berths a team has (Schwartz & Zarrow, 2009).
Another potential solution that has been investigated in order to solve baseball’s
perceived competitive disparity issue is the idea of creating a worldwide draft. Currently, the
collective bargaining agreement in place states that teams can only draft players from the
United States, Canada, Puerto Rico, and other U.S. territories. With that said, players from
other places around the world are not included in this draft. The problem here is the issue that
major league baseball has rules dictating how much a drafted player should be compensated,
yet if a player signs as a free agent, the player has more control over the team he signs with,
his salary, and contract terms (Pollock, 2010). This creates league competition disparity, as
teams with high payrolls are able to acquire high caliber talent from other countries such as
Japan at very high prices, while lower market teams may only be able to acquire talent from
the draft. A perfect example of this occurred in 2012 in the deal that brought Japanese
pitching sensation Yu Darvish to the Texas Rangers. The deal for Darvish was so expensive
that the Rangers had to pay $51 million to his old team the Nippon Ham-Fighters to even
negotiate with Darvish and then an additional $60 million to sign him to their team (Short,
2012). These astronomical figures are unthinkable for most clubs, and continue to put low
market teams at a disadvantage for acquiring talent from around the world.
Cost of Winning: What contributing factors play the most significant roles in increasing the winning percentage of a major league baseball team? Patrick Tartaro
- 7 -
Furthermore, the market and city size of a Major League Baseball team is another
interesting factor in determining what best drives a team’s winning percentage. Different
cities have extremely large baseball cultures such as New York and Boston, while others like
Tampa Bay have trouble gaining a large fan base. In J.C. Bradbury’s book, he discusses this
issue and concludes from his regression that variance in city size accounts for 40 percent of
the variance in winning percentage, which seems to be a rather impactful component
(Bradbury, 2007). The size of the city as a whole will be another component to look at to
determine whether the sheer size of the city, or population, plays a role on fan attendance.
This idea is becoming a growing concern in baseball about the small market teams and
their corresponding enviornments. Teams such as the Cleveland Indians, typically with a
great fan base, is being limited by the city of Cleveland’s economy. In addition, possibly one
of the most troubling cases is the Tampa Bay Rays who only two years ago went on a
“cinderella type” run all the way to the World Series. As stated by respected analyst Peter
Gammons, “The Rays are stuck in a ballpark and location that Peter Ueberroth once predicted
would suit only tractor pulls” (Gammons, 2010). These teams further support the idea that
building a sucessful team has much more to it than simply payroll. With that said, the model
that will be analyzed in this study will include fan attendence as a potential variable that may
have a strong correlation with a team’s winning percentage.
In addition, there are some owners that have the potential capital structure to sign big
talent and necessary players, yet refuse to do so as they choose to allocate their money and
revenues on expenses other than increasing their team’s payroll and signing new players. A
recent Sports Illustrated article by Joe Sheehan (2012) entitled “Memo to Owners: Spend
Money!,” highlights the spending trends of two major league baseball owners: including the
Detroit Tigers owner Mike Ilitch, and Kansas City Royals owner David Glass. With the 2012
season beginning teams have many needs to fill as they attempt to bring a championship to
their city. In the case of the Tigers, an injury to one of their star players left a gaping need for
a power hitter for the upcoming season. Contrarily, the Royals are a team loaded with hitters
and need a strong starting pitcher. So what happened? The Tigers made one of the biggest
Cost of Winning: What contributing factors play the most significant roles in increasing the winning percentage of a major league baseball team? Patrick Tartaro
- 8 -
deals in baseball history, signing superstar Prince Fielder to $214 million deal, while the
Royals passed on pitcher Edwin Jackson who could have made the Royals a playoff contender
for the first time since 1985. These two owners represent two different personalities, one who
“wants to win more than the next dollar,” and one who treats their team as if they “are the
corner grocery, with the need to stay in the black for the next month, next quarter, next year
the primary goal, and winning a secondary one” (Sheehan, 2012). As you can see, knowing
the tendencies of owner spending on payroll is a crucial factor to a team winning, and cannot
be definitively expressed in my model.
All in all, there are many studies and opinions on whether in fact winning percentage
is a result of the amount of money spent on a team’s payroll. A study conducted by Dave
Studeman (2012), highlights the idea that within the sports realm there is no certainty.
Studeman looked at this comparison from 1976 to 2011 utilizing regression analysis and
correlations to determine the trends of this relationship over the time period. The following
depiction from his study depicts the year-by-year correlation between payrolls and wins over
this time span.

Cost of Winning: What contributing factors play the most significant roles in increasing the winning percentage of a major league baseball team? Patrick Tartaro
- 9 -
As you can see, there is no distinct or apparent trend in the results obtained from this
correlation graph. In some years such as the mid to late 70’s or the late 90’s winning
percentage seems to be extremely highly correlated with a team’s payroll. These fluctuations
are rational can be explained by structural changes within the game itself. For example in the
latter half of the 70’s, free agency was in its first few years and teams were taking advantage
of new opportunities by signing top talent for high prices (Studeman, 2012). On the contrary
in almost every other time span this correlation seems to be average indicating that this truly
cannot be the most determining factor in winning, even today. While studies on this type of
research in regards to competition disparity are constantly discussed and argued; maybe there
are in fact no statistical measures to predict the mystery of sports and competition.

Cost of Winning: What contributing factors play the most significant roles in increasing the winning percentage of a major league baseball team? Patrick Tartaro
- 10 -
METHODOLOGY
Inevitably, there are countless factors that go into establishing a winning baseball team
from the owners down to the players. In this study, the research attempted to answer the
question of what factors are most impactful on a team’s winning percentage. The model that
was utilized will have winning percentage as the dependent variable. Various independent
variables were analyzed in this study, including: home and road wins and losses, fielding
percentage, runs per game allowed, total earned runs allowed, earned run average of pitchers,
strikeouts, walks, errors, runs per game scored, total runs scored, hits, home runs, runs batted
in, stolen bases, batting average, on base percentage, slugging percentage, total fan attendance
and stadium capacity.
To accomplish this research, I utilized a multiple regression equation that includes all
of the different factors contributing to winning percentage, and the relevance of each to
winning percentage. The equation model will be as follows:
Winning Percentage = b0+ b1 (total payroll) +b2 (home wins) + b3 (home losses) + b3 (road
wins) + b4 (road losses) + b5 (fielding percentage) + b6 (runs per game allowed) + b7 (total
earned runs allowed) + b8 (earned run average of pitchers) +b9 (strikeouts) + b10 (walks) + b11
(errors) + b12 (runs per game scored) + b13(total runs scored) + b14 (hits) + b15 (home runs) +
b16 (runs batted in) +b17 (stolen bases) + b18 (batting average) + b19 (on base percentage) + b20
(slugging percentage) + b21(total fan attendance) + b22 (stadium capacity)
Where b stands for the respective coefficients of each variable that will be determined from
the regression analysis.
.
The purpose of a regression analysis was to investigate the relationship between
variables. In this case, my regression model attemped to understand the causal effect of all of
the independent variables previously mentioned on the dependent variable of winning

Cost of Winning: What contributing factors play the most significant roles in increasing the winning percentage of a major league baseball team? Patrick Tartaro
- 11 -
percentage. The regression allows the user to estimate the quantitative effect of the causal
variables upon the variable they influence and assesses the statistical significance of the
estimated relationships, or the degree of confidence that the true relationship is close to the
estimated relationship (Skykes, 1991).
In the beginning stages of attempting to discover the most prevalent and influential
factors on a major league baseball team’s winning percentage, a large sample of data and
statistics must first be collected. For each of the 30 major league teams, data was collected
over a 10 year span dating back to 2002 ranging from financial data, on the field performance
measures, and environmental factors. The original set of variables that would be identified
and measured as contributors to winning percentage included: total payroll, home wins and
losses, road wins and losses, city size (population), fan attendance, stadium capacity, errors,
fielding percentage, runs allowed per game, total earned runs, earned run average for pitching
staff, strikeouts, walks, runs per game scored, total runs scored, hits, home runs, runs batted
in, stolen bases, batting average, on base percentage, and slugging percentage. These factors
were all components that I believed to be significant to the success of a typical major league
baseball team, and would serve as the best predictors of winning percentage.
With the variables and data entered into an Excel document, the next step was to
create a stacked file to be analyzed using the regression functionality of Excel. Stacking the
data simply require moving each of the ten years of statistics to one master file from which
the regression would. The first problem that I encountered in attempting to analyze the data
was the limitation in Excel that only allows for 16 variables to be considered in the regression.
Originally, I was considering 24 variables in my model, yet due to this constraint, the next
step was to eliminate eight of the variables that were least significant to predicting winning
percentage, creating a more focused model. The first four variables that were eliminated from
the model were home wins, home losses, road wins, and road losses. Because these variables
directly depict winning percentage (in other words by adding up home and road wins/losses
you can derive the winning percentage) they can be disregarded from the model.

Cost of Winning: What contributing factors play the most significant roles in increasing the winning percentage of a major league baseball team? Patrick Tartaro
- 12 -
Furthermore, the problem still exists that I must eliminate four more variables from
the model so that the variables can be run through Excels regression tool. The first step in
completing this task was to create a correlation matrix for the data. A correlation matrix can
be created using Excel, and provides statistical measurements for the relationships between
two variables. Correlations can range from +1 to -1 where a +1 relationship means that both
variables move in the same direction together, while -1 shows a perfectly inverse relationship.
A correlation of zero represents that there is no relationship. A correlation matrix uses these
principles and compares all of the variables to each other, creating a table to be analyzed
(Cherry, 2012). Creating a matrix in regards to this study identify variables that are so closely
related that one of them can be removed from the model.
After analyzing the correlation matrices, it was determined that runs scored per game,
total runs scored, earned run average, and total earned runs could be removed from the model.
From there, the regression analysis was run based on the 16 variables that would impact
winning percentage.
After running the standard regression model, the capabilities to utilize a stepwise
regression program became a variable where all of the original variables could be run,
excluding home/road wins and losses.
Finally, after analyzing the results from the stepwise regression, more questions were
raised from the results and a new model placing total payroll as the dependent variable was
created. This new model was created to determine which of the same factors used in the
original model would be most significant in regards to impacting a team’s payroll. With the
results from these two models complete, conclusions can be drawn for owners to determine
what factors influence winning percentage, and what variables are most important to invest in.

Cost of Winning: What contributing factors play the most significant roles in increasing the winning percentage of a major league baseball team? Patrick Tartaro
- 13 -
RESULTS The first obstacle to obtaining definitive results for our model was the need to
determine the final four variables to be removed from the model. It is important to eliminate
variables that have a strong correlation with each other. If two variables are highly correlated,
one variable could be removed while its “identity” remains encompassed and accounted for in
the interrelated variable. In order to establish which of these variables are most closely
related, a correlation matrix must be created with all the variables as indicated below:

Cost of Winning: What contributing factors play the most significant roles in increasing the winning percentage of a major league baseball team? Patrick Tartaro
- 14 -
Table 1: Correlation Matrix 1
Win Pct.
Total Payroll
Road- W
Road-L
Fan Attendance
RPG Allowed
Total ER ERA
RPG Batting
Total Runs Hits HR RBI SB BA OBP SLG
Win Pct. 1.0000 Total Payroll 0.4132 1.0000
Road- W 0.8444 0.3600 1.0000
Road-L -
0.8492 -0.3702 -
0.9908 1.0000 Fan
Attendance 0.5182 0.7591 0.4487 -
0.4619 1.0000 RPG
Allowed -
0.6488 -0.2610 -
0.5563 0.5682 -0.3483 1.0000
Total ER -
0.6176 -0.2395 -
0.5341 0.5457 -0.3188 0.9874 1.0000
ERA -
0.6336 -0.2456 -
0.5562 0.5675 -0.3279 0.9871 0.9975 1.0000
RPG Batting 0.5701 0.3003 0.4568 -
0.4475 0.3263 0.1098 0.1349 0.1160 1.0000
Total Runs 0.5701 0.3007 0.4566 -
0.4470 0.3269 0.1095 0.1351 0.1158 0.9998 1.0000
Hits 0.3846 0.2554 0.3240 -
0.3206 0.3089 0.1685 0.1956 0.1754 0.7943 0.7951 1.0000
HR 0.4115 0.2259 0.3682 -
0.3497 0.2097 0.1254 0.1370 0.1185 0.7122 0.7122 0.3620 1.0000
RBI 0.5718 0.3067 0.4598 -
0.4498 0.3280 0.1077 0.1323 0.1127 0.9960 0.9961 0.7808 0.7344 1.0000
SB 0.1316 0.0819 0.1516 -
0.1514 0.0548 -0.1473 -
0.1327 -
0.1368 -0.0353 -
0.0339 -
0.0186 -
0.1364 -
0.0485 1.0000
BA 0.4121 0.2592 0.3237 -
0.3207 0.3246 0.1353 0.1627 0.1503 0.7909 0.7912 0.9830 0.3391 0.7746 -
0.0015 1.0000
OBP 0.5374 0.3249 0.4230 -
0.4172 0.3631 0.0449 0.0718 0.0551 0.8782 0.8778 0.7894 0.4874 0.8690 -
0.0272 0.8162 1.0000
SLG 0.4915 0.2386 0.4015
-0.3868 0.2651 0.1544 0.1738 0.1564 0.9128 0.9126 0.7304 0.8624 0.9207
-0.1065 0.7286 0.7616 1.0000

Cost of Winning: What contributing factors play the most significant roles in increasing the winning percentage of a major league baseball team? Patrick Tartaro
- 15 -
From this matrix, I identified six variables that showed a strong relationship with each other.
These inputs included runs scored per game, total runs scored, runs batted in, runs allowed per
game, earned run average, and total earned runs allowed. The next step in eliminating four of
these variables is to determine which of these variables have the strongest relationship or
impact on a team’s winning percentage. By pulling from the data in the matrix, it was
determined that runs scored per game and total runs scored were encompassed through runs
batted in, which showed a stronger relationship with winning percentage than the others. In
addition, the data showed that earned run average and total earned runs allowed were not as
significant as runs allowed per game. As a result, the two variables that remained in the
model were runs batted in and runs allowed per game while the others were eliminated.
To further investigate the significance of these six variables and ensure that the correct
inputs are included in the model, the values from the correlation were converted to t-stat
values using the following conversion formula:
t=𝑟𝑥1𝑦√𝑛−2
�1−𝑟𝑥1𝑦2
As seen below, a similar matrix was developed using the values obtained from the formula.

Cost of Winning: What contributing factors play the most significant roles in increasing the winning percentage of a major league baseball team? Patrick Tartaro
- 16 -
Table 2: Correlation Matrix 2
Win Pct.
Total Payroll
Road- W
Road-L
Fan Attendance
RPG Allowed
Total ER ERA
RPG Batting
Total Runs Hits HR RBI SB BA OBP
Win Pct.
Total Payroll 7.832
5
Road- Wins 27.21
4 6.661905
Road-Loss -27.76 -
6.878422 -126.1 Fan Attendance
(Total) 10.46 20.13247 8.6672 -8.99
RPG Allowed -14.72 -
4.667603 -11.56 11.92 -6.414836668
Total ER -13.56 -
4.258267 -10.91 11.242 -5.805592888 107.75966
ERA -14.14 -
4.373313 -11.55 11.898 -5.991183149 106.25387 244.58
RPG Batting 11.97
8 5.434326 8.8653 -8.637 5.958699924 1.9068089 2.3502 2.016
Total Runs 11.97
8 5.441919 8.8604 -8.627 5.971147086 1.9019509 2.353 2.013 868.4398
Hits 7.192
4 4.560343 5.9128 -5.842 5.607418859 2.9508744 3.4424 3.076 22.57123 22.6307
HR 7.793
7 4.002377 6.8356 -6.444 3.702833521 2.1811385 2.3871 2.060 17.51227 17.5137 6.703
RBI 12.03
1 5.56193 8.9372 -8.693 5.993602662 1.8704979 2.3033 1.957 191.3188 195.541 21.57 18.68
SB 2.292 1.417979 2.6468 -2.644 0.94729058 -
2.5711838 -
2.3118 -2.384 -0.608968 -
0.58531 -
0.321 -
2.377 -0.838
BA 7.807
3 4.632214 5.9052 -5.845 5.924002457 2.357879 2.8465 2.623 22.31434 22.3328 92.44 6.222 21.14 -0.025
OBP 11 5.929438 8.059 -7.924 6.72811086 0.776525 1.2419 0.952 31.69494 31.6334 22.19 9.635 30.31 -0.469 24.38
SLG 9.743
7 4.241953 7.5667 -7.24 4.746291447 2.6969661 3.0475 2.733 38.57836 38.5297 18.45 29.40 40.73 -1.848 18.36 20.29

Cost of Winning: What contributing factors play the most significant roles in increasing the winning percentage of a major league baseball team? Patrick Tartaro
- 17 -
In reviewing the outputs from the new matrix, the results were confirmed through the t-stat
values associated with winning percentage. Consistent with the previous conclusion, runs
batted in and runs allowed per game remain in the model, while the other four variables were
removed.
With the variables and inputs defined, a regression analysis was run and the results
were sorted based on ascending P-values:
Table 3: Regression 1 Results
Coefficients t Stat P-value Runs/Game Allowed -0.08841932 -16.94312418 5.54799E-45 RBI 0.000505619 6.516248447 3.27534E-10 HR 0.000576289 3.102890093 0.002109516 Walks -9.79662E-05 -3.094455313 0.002168386 Fan Attendance (Total) 9.18959E-09 2.310968319 0.021550836 Stolen Bases 0.000123855 2.272631524 0.0237957 Batting Average 2.31411985 2.137985895 0.033371407 Slugging Percentage -0.75874036 -2.073797718 0.038999233 Errors -0.001126866 -1.659810953 0.098056234 Hits -0.000207211 -1.588107328 0.113374722 Total Payroll -1.13998E-10 -1.572172591 0.117023907 Intercept 6.555707657 1.555588776 0.120919549 Fielding Percentage -6.092224229 -1.44964163 0.14826185 Stadium Capacity -2.09532E-07 -0.567218591 0.571013743 Strikeouts 8.49967E-06 0.432767788 0.665511935 OBP 0.116280602 0.367707907 0.713364928
The regression statistics show that the input variables for this model are extremely effective in
predicting a team’s winning percentage. The adjusted R square value of .8533 shows that
85% of what comprises a team’s winning percentage is accounted for by the variables in the
model, which is a significant portion. To determine if a variable is in fact significant, its
corresponding P-value must be less than .05. As seen in the regression outputs above, runs
per game allowed and runs batted in are the top two most significant indicators of a team’s
winning percentage. All of the variables below slugging percentage in the chart above would
be removed from the model as they serve to be insignificant variables. In addition, it is
Cost of Winning: What contributing factors play the most significant roles in increasing the winning percentage of a major league baseball team? Patrick Tartaro
- 18 -
important to notice that while some variables are very significant predictors, not all are
positively associated with winning percentage. For example, while runs per game allowed is
the most significant variable from the regression results, it also depicts a very high negative t-
stat, which determines that the more runs an opponent scores, the more likely a team is going
to lose games.
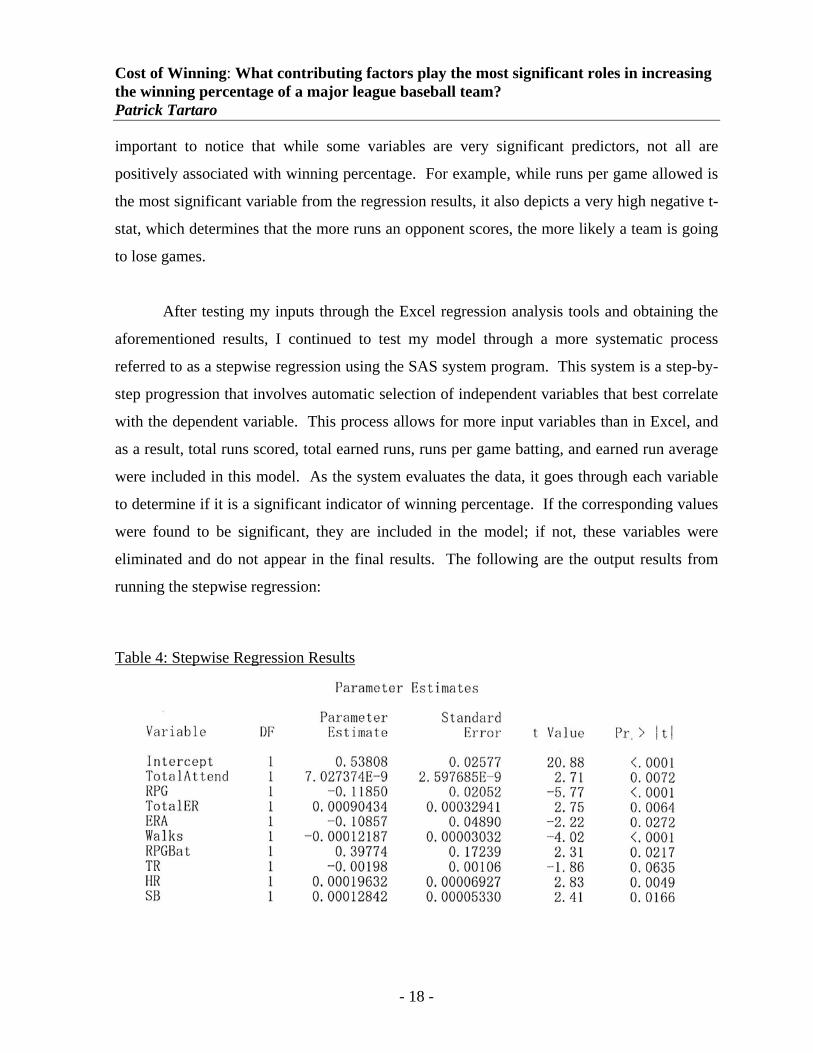
After testing my inputs through the Excel regression analysis tools and obtaining the
aforementioned results, I continued to test my model through a more systematic process
referred to as a stepwise regression using the SAS system program. This system is a step-by-
step progression that involves automatic selection of independent variables that best correlate
with the dependent variable. This process allows for more input variables than in Excel, and
as a result, total runs scored, total earned runs, runs per game batting, and earned run average
were included in this model. As the system evaluates the data, it goes through each variable
to determine if it is a significant indicator of winning percentage. If the corresponding values
were found to be significant, they are included in the model; if not, these variables were
eliminated and do not appear in the final results. The following are the output results from
running the stepwise regression:
Table 4: Stepwise Regression Results

Cost of Winning: What contributing factors play the most significant roles in increasing the winning percentage of a major league baseball team? Patrick Tartaro
- 19 -
To maintain continuity between the standard regression analysis previously conducted
and the stepwise analysis, the outputs from the stepwise regression had to be altered slightly.
When the stepwise regression produces its results, the corresponding outputs are based on F
values, or the fixation index. An F-test is simply another statistic that helps to identify which
components of a model are most correlated with the dependent variable. In this case, I am
looking to get the P-values of each variables so the regression must be conducted again using
the nine variables that the stepwise regression deemed to be significant: total attendance, runs
per game, total earned runs allowed, earned run average, walks, runs scored per game, total
runs scored, home runs, and stolen bases.
After running the regression model with this new group of variables the following
statistics were determined:
Table 5: Stepwise Regression: P-value
Coefficients Standard Error t Stat P-value Runs/Game Allowed -0.1185 0.02052 -5.77 0.0001 Walks -0.00012187 0.00003032 -4.02 0.0001 Home Runs 0.00019632 0.00006927 2.83 0.0049 Total Earned Runs 0.00090434 0.00032941 2.75 0.0064 Total Atendence 7.03E-09 2.60E-09 2.71 0.0072 Stolen Bases 0.00012842 0.0000533 2.41 0.0166 Runs/Game Scored 0.39774 0.17239 2.31 0.0217 ERA -0.10857 0.0489 -2.22 0.0272
The preceding chart is sorted based on ascending P-value scores, which allowed me to
determine the level of significance of each variable. As the results show, runs per game
allowed, walks and home runs are the three most significant determinants of a team winning
baseball games. This model further supports the conclusion of the stepwise regression, as
each of the variables included did in fact turn out to be significant, while maintaining a strong
adjusted R-squared value of .8545.

Cost of Winning: What contributing factors play the most significant roles in increasing the winning percentage of a major league baseball team? Patrick Tartaro
- 20 -
Potentially the most intriguing outcome recognized from this data analysis is the fact
that a team’s payroll was found to be insignificant in all of the models tested. In the original
model tested, the regression results showed team payroll having an insignificant P-value of
0.117023907, and in the stepwise regression analysis, team payroll did not even make it into
the model. This outcome is surprising and goes against the conventional wisdom that when
teams spend more money, they will be more successful. This discovery raises even more
questions in regards to which factors teams are spending the most money on, and if in fact
they are allocating these resources in ways that put the teams in the best position to win.
To begin analyzing this idea, another regression was run to determine which of the
variables used in the previous models are significant in determining a team’s payroll. In other
words, the model will show which of these inputs teams are spending the most money on.
The same sixteen variables were utilized as were used in the first regression analysis run. The
following are the regression outputs computed for this model:
Table 6: Payroll Regression Analysis
Coefficients t Stat P-value Fan Attendance (Total) 34.48497952 13.51714834 1.74698E-32 SLG -851997001 -2.877564566 0.004311726 HR 431780.169 2.845715206 0.004753857 Strikeouts 29160.04939 1.832257996 0.067960023 RBI 120990.5963 1.79496298 0.073722813 Win Pct. -75687221.42 -1.572172591 0.117023907 Errors -753049.9127 -1.359122406 0.175186098 Intercept 4572291741 1.330000649 0.184585179 Fielding Percentage -4532085966 -1.322672613 0.187008354 Runs/Game Allowed -6309570.838 -1.048422773 0.29533526 SB 40453.25118 0.904100721 0.366708258 OBP 175112199.7 0.679984115 0.497068419 Stadium Capacity -171.5555876 -0.569959211 0.569155951 BA 349896179.2 0.393682649 0.694110754 Walks 7188.471323 0.274118251 0.78419302 Hits 26292.41535 0.246241233 0.805673376

Cost of Winning: What contributing factors play the most significant roles in increasing the winning percentage of a major league baseball team? Patrick Tartaro
- 21 -
After reviewing the results obtained from the data analysis, it can be seen that fan attendance,
slugging percentage, and home runs were the only significant factors that help to comprise a
team’s payroll. The output shows a P-value of 1.74698E-32 for fan attendance, which is
extremely significant and logical, as the more fans who attend games, owners receive
additional revenue, which can in turn be spent on player salaries. The other two variables
make sense as well in that most fans want to see the “big” hits such as home runs, triples, and
doubles when they attend games, so it is reasonable to believe that these variables would be
significant in the model. With that said, the outputs show that winning percentage is slightly
insignificant, which is an unexpected outcome. Conventional wisdom would state that
winning more games would draw more revenues for the team, which in turn could be used on
payroll. While this is surprising, it is a common occurrence with many clubs today as
highlighted by the Tampa Bay Rays.
DISCUSSION
All in all, this study set out to answer an extremely prevalent question in the world of
major league baseball today: is a team’s total payroll the greatest predictor for a team’s
winning percentage, or are other alternative factors more significant? In recent years, it has
been the common belief of almost all major league baseball followers that the more money a
team spends on players, the more successful the team will be. If one were to look historically
at the past World Series winners, one might think the answer to this question is obvious.
Furthermore, over the last 16 years, of the World Series winners, 62.5% of them were top ten
in the league in payroll. While, 64% of the worst five teams in baseball over the last five
years have been within the bottom ten teams in payroll (Stransky, 2011). While these figures
make this question seem crazy, the results from this study may surprise many people in the
baseball world.
It is important to note that when conducting a statistical analysis, in particular when
dealing with a topic such as sports, there are countless factors that play large roles in the
outcome of a team’s season. Human nature is an almost impossible measure to quantify

Cost of Winning: What contributing factors play the most significant roles in increasing the winning percentage of a major league baseball team? Patrick Tartaro
- 22 -
empirically, and as a result the outcomes produced by this model are based on quantitative
statistics associated with major league baseball teams. A variety of factors including injuries,
team chemistry, coaching tendencies, among many others are virtually immeasurable and
would clearly alter the results concluded throughout this study.
With that said, this study used a model that included 16 variables, ranging from fan
attendance to batting average in the attempt to determine which factors were significant, and
which were not. After the regression analysis was completed on the variables included in the
first model using Excel, it was determined that the following factors were the only significant
variables in regards to winning percentage.
Table 7: Regression Analysis 1 Rankings Rank Coefficients t Stat P-value
#1 Runs/Game Allowed -0.08841932 -16.94312418 5.54799E-45
#2 RBI 0.000505619 6.516248447 3.27534E-10
#3 HR 0.000576289 3.102890093 0.002109516
#4 Walks -9.79662E-05 -3.094455313 0.002168386
#5 Fan Attendance (Total) 9.18959E-09 2.310968319 0.021550836
#6 SB 0.000123855 2.272631524 0.0237957
#7 BA 2.31411985 2.137985895 0.033371407
#8 SLG -0.75874036 -2.073797718 0.038999233 The outcomes from the first regression analysis are fairly consistent with what one could
expect, except for the absence of total payroll which will be discussed later. Runs per game
allowed by teams are consistent with the age-old belief in almost all sports that “defense wins
championships.” It is completely logical that when a team gives up less runs than their
opponent, they are more likely to win games as evident by the extremely significant P-value.
Some of the other variables are more interesting to see, including walks, fan attendance, and
stolen bases, which all have very similar P-values. A high number of walks indicate a high
significance level with winning baseball games. As my high school baseball coach used to

Cost of Winning: What contributing factors play the most significant roles in increasing the winning percentage of a major league baseball team? Patrick Tartaro
- 23 -
say, “A leadoff walk scores over 80% of the time.” If this is true, then it makes sense that the
more times a team puts runners on base for “free,” the more likely chance they have of
scoring more runs and winning games. Similarly, stolen bases seems like another logical
indicator of getting wins, as the more stolen bases a team has, the more likely they are to be in
“scoring position” when a player gets a hit.
One of the more surprising results from this regression analysis is the high
significance of fan attendance on a team’s ability to win. It is interesting to see that fan
attendance is substantially more significant than other variables naturally seen as being
extremely important, such as batting average or strikeouts. I believe the significance of this
variable comes from the issue discussed before about human competitive nature, in particular
professional athletes. To be a successful athlete, throughout one’s career dating back to little
league, an athlete always has fans watching games and evaluating their performance. It can
be assumed that the miniscule percentage of these players who are good enough to make to
the major leagues thrive under pressure and enjoy displaying their exceptional talents to the
public. Also, it is a competitor’s natural instinct to practice and play harder when they feel
something is on the line or people will be evaluating them. This is depicted well by the
Tampa Bay Ray’s star Evan Longoria who expressed his displeasure with fans in recent years
as fan attendance has been very low despite the team winning many games. This model
suggests that if these types of teams do not maintain a solid fan attendance, performance in
the future may be impacted.
In addition to the simple regression model conducted using Excel, I conducted a
second regression using an SAS System program that conducts a stepwise regression analysis.
With this type of analysis, I can input all of the original 20 variables selected, and the analysis
added only the variables that are significant indicators of winning percentage. The results
from this analysis are as follows:

Cost of Winning: What contributing factors play the most significant roles in increasing the winning percentage of a major league baseball team? Patrick Tartaro
- 24 -
Table 8: Stepwise Regression Rankings
Rank Coefficients t Stat P-
value #1 Runs/Game Allowed -0.1185 -5.77 0.0001 #2 Walks -0.00012187 -4.02 0.0001 #3 Home Runs 0.00019632 2.83 0.0049 #4 Total Earned Runs 0.00090434 2.75 0.0064 #5 Total Attendance 7.03E-09 2.71 0.0072 #6 Stolen Bases 0.00012842 2.41 0.0166 #7 Runs/Game Scored 0.39774 2.31 0.0217 #8 ERA -0.10857 -2.22 0.0272
After running this second regression analysis, again we see many of the same significant
variables as previously determined. The results from running the two regressions are
extremely similar, in that five of the eight variables from the previous model are seen as
significant in this model as well. The only variables that are included in the second regression,
but not in the first, are total earned runs, runs per game scored, and earned run average, as all
of these were removed from the previous model due to high correlations with other variables.
Ultimately, the five most significant factors in increasing the winning percentage of a
major league baseball team in order are:
Table 9: Final Results vs Winning Percentage Rank
#1 Runs/Game Allowed
#2 Walks
#3 Home Runs
#4 Fan Attendance (Total)
#5 Stolen Bases
As mentioned previously, all of these contributing factors make logical sense in their
association with winning percentage, but their significance over other variables may be

Cost of Winning: What contributing factors play the most significant roles in increasing the winning percentage of a major league baseball team? Patrick Tartaro
- 25 -
surprising to some around the baseball world. One would be hard pressed to find a baseball
analyst who would state that fan attendance is the fourth most contributing factor to a team
winning games throughout a season.
With this information now known, owners and general managers whose focus is to
bring championships to their cities should focus most of their time obtaining players whose
skill set matches the variables expressed above. In looking at the results, it seems that the two
most significant factors affecting winning percentage come from the defensive side of the
game, in particular, pitching. Knowing this, I believe it would best suit a major league
baseball team to primarily allocate their team’s resources in obtaining pitchers who allow the
fewest runs per game. Players such as the Tampa Bay Ray’s Jeremy Hellickson, who allowed
only 64 runs in 189 innings pitched and cost the team only $418,400 when the league average
salary reached a staggering $3.44 million (Baseball's Average Salary Hits $3.4m, 2012). In
addition, it was found that pitchers who allow the fewest walks to their opponents should be
targeted as well. A player that resembles this most closely is Doug Fister, who allowed one of
the league’s best 37 walks in 216 innings and only cost the Seattle Mariners $436,500 in
2011 (2011 Leage Pitching).
On the offensive side of the plate, teams should focus on players who hit the most
home runs and steal the most bases. The correlation between home runs and wins can easily
be seen by the top three teams who hit the most home runs in 2011: the Yankees, Rangers,
and Red Sox, all perennial playoff teams. While finding a player who hits home runs is one
of the more expensive tasks for a general manager in the major leagues, there are in fact
players such Giancaro Stanton of the Florida Marlins who hit 34 home runs and only cost his
team $416,000. In addition, stolen bases is another attribute a manager should look for when
acquiring talent for his ball club. A player who matches the qualities portrayed by Drew
Stubbs of the Cincinnati Reds should be particularly interesting for teams, as he stole 40 bases
in 2011 while accumulating 15 home runs at a salary of only $450,000 (2011 Major League
Baseball Standard Batting, 2011). From the data compiled from the study, and the availability
Cost of Winning: What contributing factors play the most significant roles in increasing the winning percentage of a major league baseball team? Patrick Tartaro
- 26 -
of cheap players who demonstrate the skills described above, it is in fact possible for teams to
win games without extremely high payrolls.
Finally, because fan attendance was one of the significant factors that motivate a
baseball team to win, owners and the marketing sector of the clubs must seriously focus on
providing a unique and enjoyable experience in their ballparks. People come to see baseball
games not only for the game itself, but for the experience. The age old song, “Take me out to
the ball game” encompasses this idea of an enjoyable fan experience. More so now than in
the past, new ballparks are being created that have activities for children and adults to do
before, during, or after games. For example, the New York Mets home Citi Field has video
games, a wiffle ball field, and pitching practice than fans can partake in while at the game. As
the regression results show, fan attendance is a very significant factor in winning games, so
funds must be allocated appropriately, just as they would for a big time superstar.
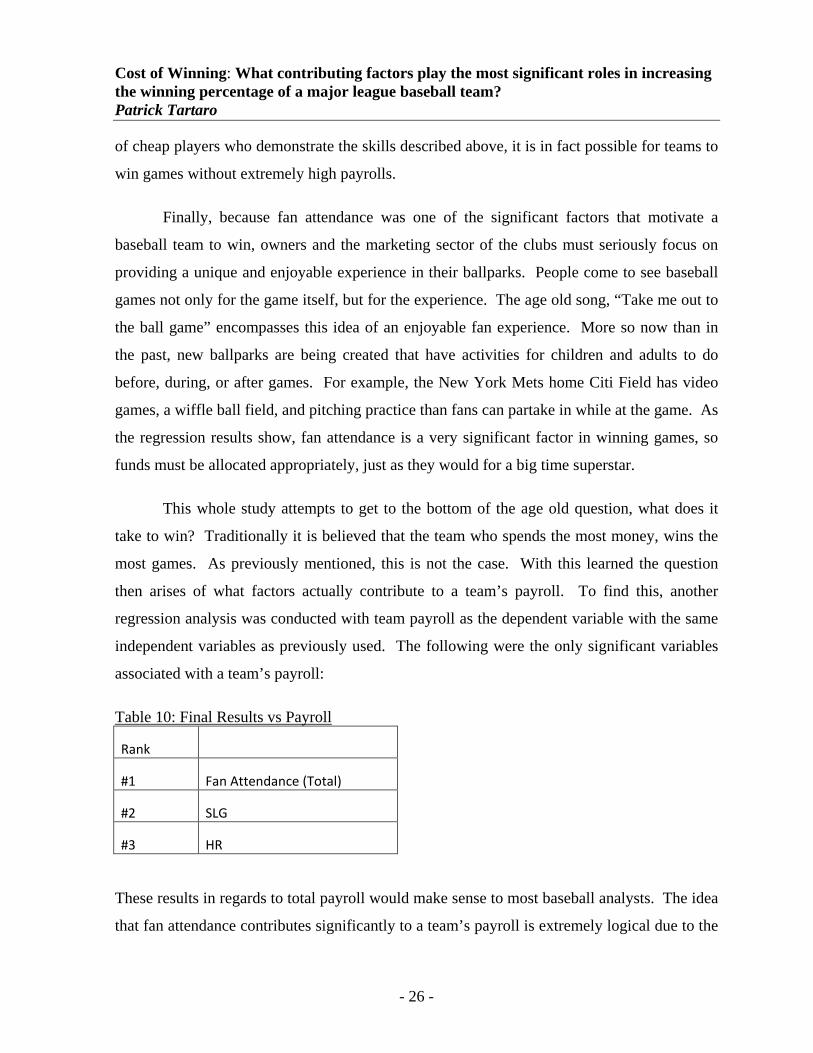
This whole study attempts to get to the bottom of the age old question, what does it
take to win? Traditionally it is believed that the team who spends the most money, wins the
most games. As previously mentioned, this is not the case. With this learned the question
then arises of what factors actually contribute to a team’s payroll. To find this, another
regression analysis was conducted with team payroll as the dependent variable with the same
independent variables as previously used. The following were the only significant variables
associated with a team’s payroll:
Table 10: Final Results vs Payroll
Rank
#1 Fan Attendance (Total)
#2 SLG
#3 HR
These results in regards to total payroll would make sense to most baseball analysts. The idea
that fan attendance contributes significantly to a team’s payroll is extremely logical due to the

Cost of Winning: What contributing factors play the most significant roles in increasing the winning percentage of a major league baseball team? Patrick Tartaro
- 27 -
fact that the more fans who attend games, the more revenues that is brought in by the club
through ticket sales and concession stands. With this additional revenue, owners have the
ability to increase the amount of money they are willing to spend on buying players for their
team. Similarly, slugging percentage and home runs are also reasonable results as players
who hit home runs and extra base hits tend to be the most expensive players in the league.
Last year’s home run champion Jose Bautista of the Toronto Blue Jays is set to make $14
million next year, and runner up Curtis Granderson of the Yankees is set to make $10 million
(2011 Major League Baseball Standard Batting, 2011). Typically, fans love seeing exciting
players who hit home runs and leg out triples, so owners in turn are willing to pay more for
these hitters.
Finally, there are limitations for this study including a variety factors that may not be
measurable in a quantitative manner. The impact of coaching on a team’s ability to perform
at high levels clearly plays a tremendous role on a team’s ability to accumulate wins
throughout a baseball season. Different factors regarding coaches cannot be measured in a
systematic way including the coach’s experience in the league, tenure with the team, total
number of wins including individual winning percentage for their career, as well as the salary
they received. Even a coaches personality, past coaching experiences, assistants, and their
ability to gain the support of the players on their club all play roles on the actions of a baseball
manager. This types of factors are important in regards to the cost of winning, in that if a
team has a coach such as Billy Bean who can train and groom talent, they can pass up buying
high priced star talent. If a coach is not suitable to manage players with undervalued skill,
then the club may have to spend more money finding players who are already solidified in the
league at higher costs. While these factors deal a lot with human nature and are virtually
immeasurable, it is still important to note that this study does not include these types of
variables in the model.
Similarly, other such limitations include the financial decisions and actions of the
ownership as they have ultimate control over where to allocate the teams financial resources.
Some owners, like is the case with the Steinbrenner’s and the Yankees, have a win now

Cost of Winning: What contributing factors play the most significant roles in increasing the winning percentage of a major league baseball team? Patrick Tartaro
- 28 -
mentality, and will spend as much money as it takes to bring the best talent and coaches to the
Bronx. Others in the league have a low budget mentality due to playing in small markets
where they are more likely to develop players in the farm systems and groom them into stars
at relatively cheaper prices.
Moreover, the demographics of where a particular team exists are other functions of
winning percentage that would be difficult to quantitatively identify and examine. The
climate and region where a team plays may provide an important correlation to winning
percentage. Some teams play in cold rainy weather during late August, while other teams
experience warm weather almost year round. It is much more difficult for players to hit in
cold weather, and as a result teams in cold weather regions may tend to focus on their pitching
staffs, while warm weather clubs may attempt to compile a high quality lineup. In addition,
the Colorado Rockies, who play almost a mile above sea level, have different air pressures,
causing teams to hit balls a greater distances, which further indicates the importance of
examine the regions in which teams play. A study conducted by Zahari and Mustafa (2007),
they determined that while climate did not have a strong influence on winning it could play
some role in the process (Zahari, 2007). While this factor may not have as big an impact on
winning percentage as others in that on a given night two teams play in the same game
environment, it is important to recognize this factors impact on a club will be and how they
will allocate its resources on certain players.
CONCLUSION All in all, while the results show what statistical areas owners should allocate most of
their resources to win the most games, nothing in sports is guaranteed. As much analysis is
done, nothing can truly depict how many games a team will win in a season due to the
incredible uncertainty of human nature and potential accidents. Teams who spend all their
money on increasing fan attendance and buying shutdown pitchers do not guarantee
championships. With that said, this study set out to determine the best model for owners to
allocate their financial resources in the most economic way possible to position their club for
Cost of Winning: What contributing factors play the most significant roles in increasing the winning percentage of a major league baseball team? Patrick Tartaro
- 29 -
success. It also disproved the common belief that the more money a team spends on its
players, the more successful they will be, which will help Pirate fans rest easier when they
walk into Yankee stadium for a matchup with the Bronx Bombers

Cost of Winning: What contributing factors play the most significant roles in increasing the winning percentage of a major league baseball team? Patrick Tartaro
- 30 -
BIBLIOGRAPHY (2011). Retrieved from Baseball Reference: http://www.baseball-
reference.com/leagues/MLB/2009-misc.shtml
2011 Leage Pitching. (2011). Retrieved from Baseball-Reference.com: http://www.baseball-
reference.com/leagues/AL/2011-standard-pitching.shtml
2011 Major League Baseball Standard Batting. (2011). Retrieved from Baseball-
Reference.com: http://www.baseball-reference.com/leagues/MLB/2011-standard-
batting.shtml
Baseball's Average Salary Hits $3.4m. (2012, April 6). Retrieved April 6, 2012, from The
Inquisitr: http://www.inquisitr.com/216460/baseballs-average-salary-hits-3-4m/
Bradbury, J. (2007). The Baseball Economist: The Real Game Exposed. New York: Penguin
Group.
Candela, S. (2011). Baseball Salary Cap Information. Retrieved February 22, 2011, from
eHow: http://www.ehow.com/facts_5775542_baseball-salary-cap-information.html
Caple, J. (2011, October 5). Owner frustrated by Rays' financials. Retrieved October 5, 2011,
from ESPN: http://espn.go.com/mlb/story/_/id/7061072/tampa-bay-rays-owner-says-
current-business-model-untenable
Cherry, K. (2012). Psychology. Retrieved from About.com:
http://psychology.about.com/od/cindex/g/def_correlation.htm
Clem, A. (2010). Baseball Cities: Population and Attendence. Retrieved from Clems
Baseball: http://www.andrewclem.com/Baseball/Baseball_cities.html
Davis, M. C. (2007). The Interaction between Baseball Attendance and Winning. Retrieved
February 20, 2011, from
http://umresearchboard.org/resources/davis/Baseball_Attendance_Winning.pdf
Dietl, H., Lang, M., & Werner, S. (2008). The Effect of Luxury Taxes on Compeitive
Balance, Club Profits, and Social Welfare in Sports Leagues. North American
Association of Sports Economists .
Cost of Winning: What contributing factors play the most significant roles in increasing the winning percentage of a major league baseball team? Patrick Tartaro
- 31 -
Elanjian, M. R., & Pachamanova, D. A. (2009). Is Revenue Sharing Working for Major
League Baseball? A Historical Perspective. The Sport Journal , XII.
Fry, B. (2010). Saleries vs Performance. Retrieved February 18, 2011, from Ben Fry:
http://www.benfry.com/salaryper/
Gammons, P. (2010, January 18). Revenue Gap Widening. Retrieved February 23, 2011, from
MLB.com:
http://mlb.mlb.com/news/article.jsp?ymd=20100118&content_id=7934432&vkey=per
spectives&fext=.jsp&c_id=mlb
Gregory, S. (2011, September 26). A's for Effort. How to play moneyball and win. Time
Magazine .
Levy, R. (2006, April 20). Dispute: A Salary Cap in Major League Baseball. Retrieved March
2, 2011, from http://tamu-and-baseball.com/pdf/mlbsalarycap.pdf
MLB Attendence Report. (2010). Retrieved February 26, 2011, from ESPN:
http://espn.go.com/mlb/attendance/_/year/2001
Pollock, K. A. (2010, November 12). Should Baseball have a Worldwide Draft? Retrieved
March 6, 2012, from Baseball Law: http://baseballlaw.blogspot.com/2010/11/should-
baseball-have-worldwide-draft.html
Schwartz, N. L., & Zarrow, J. M. (2009). An Analysis of the Impact of Team Payroll on
Regular Season and Postseason Success in Major League Baseball. Undergraduate
Economic Review .
Sheehan, J. (2012, February 6). Memo to owners: spend money! Retrieved March 12, 2012,
from Sports Illustrated:
http://sportsillustrated.cnn.com/2012/writers/joe_sheehan/02/06/owners.money/index.
html
Sheehan, J. (2002, February 19). Salary Cap. Retrieved March 2011, 2, from Baseball
Prospectus: http://www.baseballprospectus.com/article.php?articleid=1345
Short, D. (2012, January 20). Details of Yu Darvish's contract with the Rangers. Retrieved
March 11, 2012, from NBC Sports:
http://hardballtalk.nbcsports.com/2012/01/20/details-of-yu-darvishs-contract-with-the-
rangers/

Cost of Winning: What contributing factors play the most significant roles in increasing the winning percentage of a major league baseball team? Patrick Tartaro
- 32 -
Skykes, A. O. (1991). An Introduction to Regression Analysis. Retrieved from Chicago
Working Paper in Law & Economics:
http://www.law.uchicago.edu/files/files/20.Sykes_.Regression.pdf
Standings. (2011). Retrieved February 25, 2011, from Major League Baseball:
http://mlb.mlb.com/mlb/standings/index.jsp?ymd=20101003
Stransky, J. (2011, November 30). Payroll vs. Success: How Much Does Money Matter?
Retrieved March 22, 2012, from Field of Ignorance:
http://www.fieldofignorance.com/2011/11/payroll-vs-success/
Studeman, D. (2012, February 7). Money and Wins. The Hardball Times .
Zahari, B. (2007). The Effects of Climate in Major League Baseball.