cost of operating smsfs 2020 - rice warner
TRANSCRIPT

SMSF ASSOCIATION22 NOVEMBER 2020
Cost of Operating SMSFs 2020

The SMSF Association’s vision is to enable Australians to take greater control of their financial future through a sustainable Self Managed Super Fund (SMSF) community. We believe that every Australian has the right to a good quality of life in retirement and the right to control their own destiny. Further to this, we believe that better outcomes arise when professional advisors and trustees are armed with the latest information, especially in the growing and sometimes complex world of self managed super funds.
This research report co-presented by Rice Warner and the SMSF Association, proudly supported by SuperConcepts, aims to educate, inform and assist existing and potential SMSF investors decide if an SMSF is a suitable and effective retirement savings vehicle for them.
This report provides valuable insights to guide potential SMSF advice and can be used as a key reference point for all involved in the decision-making process. It is crucial SMSF investors have up to date knowledge and adequate education to be engaged and legally responsible to control their Self Managed Super Fund, ideally in partnership with an independently accredited SMSF Specialist Advisor. Over 1 million Australians have already made this important choice and our aim is to help those who are considering an SMSF for their retirement, to make informed and appropriate choices.
We hope you find the report findings a useful resource.
John Maroney CEO SMSF Association

1. Executive summary 21.1 Our brief 21.2 Our approach 31.3 The SMSF market 31.4 Costs of SMSFs 51.5 Costs of APRA regulated funds 71.6 Actual expenses of SMSFs 91.7 Growth and termination of funds 91.8 Analysis and commentary 111.9 Other considerations 131.10 Acknowledgements 13
2. Overview of the SMSF Market 152.1 Numbers and sizes 162.2 Investment allocations 192.3 Investment returns 212.4 Growth and termination of funds 23
3. Costs for SMSFs 273.1 Costs of establishment 273.2 Annual compliance costs 273.3 Non-standard assets 293.4 Full administration 293.5 Investment management 293.6 Advice 313.7 Insurance 313.8 Winding up an SMSF 31
Table of Contents
4. Actual expenses of SMSFs 33
5. Costs for APRA regulated funds 38
6. Analysis and commentary 436.1 Accumulation accounts 436.2 Pension accounts 466.3 Actual expenses of SMSFs 486.4 Commentary 49
7. Other considerations 527.1 Time and expertise 527.2 Guarantee 527.3 Fee subsidies 527.4 Asset allocations 527.5 The age and growth prospects for the SMSF 527.6 Smaller balances at older ages 53
Appendix A SMSF Expense analysis 55
SMSF Association Level 3, 70 Pirie Street Adelaide SA 5000 P: 08 8205 1900 F: 08 8212 5993
smsfassociation.com smsfconnect.com
Super Concepts Level 17, Chifley Tower, 2 Chifley Square, Sydney NSW 2000 AUSTRALIA
superconcepts.com.au
Rice WarnerSYDNEY Level 1 2 Martin Place Sydney NSW 2000P +61 2 9293 3700 F +61 2 9233 5847
Rice WarnerMELBOURNELevel 20, Tower 5 727 Collins StreetMelbourne VIC 3008P +61 3 8621 4100www.ricewarner.comABN 35 003 186 883AFSL 239 191


Cost of Operating SMSFS 2020 SMSF Association
1. Executive summary
The SMSF Association has retained Rice Warner to update its report prepared for the Australian Securities and Investments Commission (ASIC) in May 2013, Costs of Operating SMSFs, in the context of ongoing public debate regarding the appropriate minimum size for a Self Managed Superannuation Fund (SMSF) and ASIC advice regarding fees paid by SMSF Trustees.
1.1 Our brief
The research will assist to determine the minimum cost-effective balance for SMSFs. It should aim to:— Provide insights into the true costs of running an SMSF.— Allow industry to compare appropriate estimates of fees
for differing SMSF balances. — Review the comparable costs of holding superannuation
in an Australian Prudential Regulation Authority (APRA) regulated fund.
— Consider the various products issued by APRA regulated funds, including default options and likely MySuper costs.
— Consider the situations where there is more than one member in an SMSF (which would result in multiple accounts in an APRA-approved product).
— Consider the opportunity cost of the time spent by an SMSF trustee in managing the fund.
— Have some regard to the fact that the SMSF cost-effectiveness debate must extend beyond an analysis of costs to consider the different and varied motivations that SMSF members have in wanting to have their superannuation in an SMSF. For instance: control, asset allocations, age and growth prospects, Capital Gains Tax (CGT) rollover costs, difference in cost methodologies, etc.
— Provide case studies of SMSFs starting small and growing over time.
The SMSF market is a complex market with not only a range of sizes for the funds, but also a range of motivations for the Trustees who manage those funds. These motivations drive the types of services that the Trustees outsource to the market and consequently the costs that they incur. The approach we used for our 2013 report to ASIC was designed to deal with the breadth and complexity of the market and we agree that a similar approach should be used for this work.
The research should establish the size at which a fund becomes viable and then assess implications for funds which are below this threshold. The same approach from the 2013 research is appropriate to be retaken.
https://download.asic.gov.au/media/1336058/cp216-RiceWarner-cost-of-operating-smsfs.pdf
2
Cost of Operating SMSFS 2020 SMSF Association
1.2 Our approach
The analysis for our 2013 report was based on the statutory costs and fee structures for SMSF service providers in comparison to the fee structures of APRA regulated funds. The analyses were therefore based on potential fees. We have repeated that analysis.
For this report we have also been given access to anonymised expense, cash flow and balance information for approximately 100,000 SMSFs. This has allowed us to also consider actual costs incurred.
In assessing the minimum viable or cost-effective size of an SMSF, there are several factors to consider. These include:
— The likely pattern of future contributions (nil once all members are fully in pension phase), including any large non-concessional amounts.
— The current size of the fund and future cash flows (earnings plus contributions less expenses, tax, and withdrawals).
— The asset allocation and whether this can be replicated more cost-effectively in an APRA regulated fund.
— Whether the trustee(s) is self-directed or will rely on external advice (which will add to costs).
We separated the SMSF segment into funds of different types - including separation into funds by number of members, funds in accumulation and/or pension phase, and funds by size of investments.
From the segmentation, we considered comparable APRA regulated products and have modelled their fees to show at what size a cost saving can be made via an SMSF. These fees include investment and administration components.
We have considered investment structures which cannot be replicated easily under an APRA regulated product. For example, an SMSF might hold a direct property. Under these structures, the cost is less important than the required investment strategy.
Using this analysis, backed by modelling, we have established the size at which a fund becomes a viable alternative and then assessed implications for funds which are below this threshold.
Our analysis has not considered small APRA regulated funds. These funds are similar in size to SMSFs but operate under the control of an external, licensed Trustee generally because their members are unable to act as trustees due to reasons like incapacity, insolvency, or living overseas for extended periods. The external trusteeship of these funds leads to them not being representative of the cost structures or investment philosophies of SMSFs.
1.3 The SMSF market
Section 2 (Overview of the SMSF Market) presents an overview of the SMSF market which continues togrow strongly. Table 1 shows the growth in the number of funds over recent years. The number of wind-ups in 2020 will grow as there is a lag in processing these.
The growth in the number of funds has been accompanied by a commensurate growth in the total assetsheld within SMSFs as shown in Graph 1.
Of particular interest for this report, is the breakdown of SMSFs by fund size as is presented in Table 2.
3

Cost of Operating SMSFS 2020 SMSF Association
Financial Year 2015 2016 2017 2018 2019 2020
Establishments 33,379 32,790 30,333 25,359 20,371 21,303
Wind Ups 13,664 13,465 14,632 24,093 15,677 2,763
Net Establishments 20,075 19,325 15,701 1,266 4,694 18,540
Total number 533,849 553,174 568,875 570,141 574,835 593,375 of funds
Total number 1,010,602 1,042,220 1,072,140 1,069,076 1,072,701 1,107,268 of members
Table 1 - Establishments of SMSFs
Graph 1 - Growth in SMSFs assets800,000
Total Assets ($m)
Jun
15
Aug
15
Oct
15
Dec
15
Feb
16
Apr
16
Jun
16
Aug
16
Oct
16
Dec
16
Feb
17
Apr
17
Jun
17
Aug
17
Oct
17
Dec
17
Feb
18
Apr
18
Jun
18
Aug
18
Oct
18
Dec
18
Feb
19
Apr
19
Jun
19
Aug
19
Oct
19
Dec
19
Feb
20
Apr
20
Jun
20
700,000
600,000
500,000
400,000
300,000
200,000
100,000
0
4

Cost of Operating SMSFS 2020 SMSF Association
Asset Ranges Percentage
$0-$50,000 5.70
>$50,000 $100,000 2.70
>$100,000 $200,000 6.50
>$200,000 $500,000 21.70
>$500,000 $1m 25.10
>$1m $2m 20.80
>$2m $5m 13.70
>$5m 3.80
Total 100%
Table 2 - Proportion of SMSFs by fund size (2018-19 financial year)
Table 3 - Range of annual compliance administration costs
Table 4 - Range of annual full administration costs
This analysis shows that some 16% of SMSFs hold less than $200,000 in assets with 8.5% holding less than $100,000. For our 2013 report, 22% of SMSFs held less than $200,000 in assets and 11% held less than $100,000.
1.4 Costs of SMSFs
We have estimated the range of costs for the setup and running of SMSFs, from the marketing material of, and interviews with, several suppliers of SMSF administration services, accountants, and auditors. As would be expected with a dynamic market, there is a range of costs that reflect the range of complexity of the SMSFs themselves. Costs for simple funds with little complexity and the trustee seeking only transactional services will generally be at the low end of the range. Funds with more complexity and/or where the trustee requires more assistance will generally be at the high end of the range.
The full analysis is presented in Section 3 (Costs for SMSFs).
The underlying costs of operating an SMSF are the costs of providing the services and reports required by regulation. These are the costs that cannot be avoided as they comprise statutory fees and the necessary provision of professional services. They are summarised in Table 3.
Should the trustees not wish to be involved at all in the administration of the fund, they will necessarily incur higher fees for a full administration service including investment administration and reporting. These fees are shown in Table 4.
Fee Low Mid High
Annual ASIC fee (special purpose company) $55 $55 $55
ATO supervisory levy $259 $259 $259
Audit fee $350 $495 $639
Financial Statement and Tax Return $525 $880 $1,500
Total accumulation $1,189 $1,689 $2,453
Actuarial certificate $110 $176 $285
Total Pension (no certificate) $1,189 $1,689 $2,453
Total Pension (with certificate) $1,299 $1,865 $2,738
Fee Low Mid High
Full administration Fee $1,200 $1,820 $2,760
ASIC fee and ATO levy $314 $314 $314
Total accumulation $1,514 $2,134 $3,074
Actuarial certificate $110 $176 $285
Total Pension (no certificate) $1,514 $2,134 $3,074
Total Pension (with certificate) $1,624 $2,310 $3,359
5

Cost of Operating SMSFS 2020 SMSF Association
Table 6 - SMSF yearly investment management fees
Fund Balance ($) Investment management fee ($)
Low Mid High
$50,000 0 3 9
$100,000 1 9 33
$150,000 2 17 62
$200,000 4 27 100
$250,000 5 36 133
$300,000 7 45 169
$400,000 10 67 249
$500,000 14 92 342
6
Direct Investment fees have been excluded from this analysis as they are dependent on the specific asset types chosen by specific SMSFs and cannot be estimated for a generic fund for comparison purposes. The fees incurred by SMSFs from investment in Managed Funds can be determined and are considered to ensure a fair comparison with APRA regulated funds. The allocation to Managed Funds is not high and ranges from 1% for the smallest funds up to 4% for those funds with assets of $500,000. This is a marked reduction from our 2013 report when the allocations ranged from 4% to 12%. The impost from these fees is therefore modest.
In keeping with the methodology of our 2013 report, we have determined the range of fees likely to be paid by SMSFs. We believe that a reasonable estimate of the average investment management fee paid for these assets is:
Table 5 - Investment fee range
Fee level Fee
Low 0.07% pa
Mid 0.47% pa
High 1.75% pa
These fees represent the range that is encountered in the market for products ranging from simple index funds to actively managed funds for speciality assets. Some Exchange Traded Funds have even lower fees than the Low fee shown so the Low estimate is conservative.Based on these fees and the asset allocations shown in Table 15, the extra yearly costs that should be considered for SMSFs are:
(as shown in table 6)
Advice fees, because they are paid on a fee-for-service basis, have also been excluded.
It is noticeable that, apart from statutory fees that are indexed, fees across the market have fallen since our 2013 report. These reductions, which are more pronounced for larger SMSFs, make the SMSF sector more competitive against the APRA regulated sector.

Cost of Operating SMSFS 2020 SMSF Association
1.5 Costs of APRA regulated funds
In considering the fees charged by APRA regulated funds, we have relied on the Rice Warner Galaxy database of Product Disclosure Statements, APRA statistics and annual reports. More details are presented in Section 5 (Costs for APRA regulated funds).
We have determined the costs for APRA regulated funds on the basis that the asset balance at various levels is held by one or two members. These costs are shown in Table 7 to Table 9.
As anticipated in our 2013 report, fees charged by Retail providers have reduced and fees charged by Industry funds have increased, so that today they are comparable. Advice fees are now charged on a fee-for-service basis by all providers. The result of these changes is that, in aggregate, APRA regulated funds are more competitive in comparison with SMSFs for smaller accounts because the very high fees that were being charged by Retail funds have been removed.Whilst Advice fees have been excluded from the comparison of fees because they are charged on a fee-for-service basis, it should be noted that most Industry funds provide Intra-fund Advice within the fees detailed below.
Table 7 - Range of annual costs Industry fund ($) – Accumulation account
Balance One member Two members
Low Mid High Low Mid High
$50,000 $442 $607 $804 $503 $685 $998
$100,000 $802 $1,138 $1,488 $863 $1,216 $1,682
$150,000 $1,155 $1,668 $2,164 $1,216 $1,746 $2,358
$200,000 $1,504 $2,198 $2,850 $1,566 $2,276 $3,044
$250,000 $1,880 $2,728 $3,530 $1,942 $2,806 $3,724
$300,000 $2,240 $3,240 $4,202 $2,301 $3,318 $4,396
$400,000 $2,951 $4,240 $5,537 $3,013 $4,318 $5,731
$500,000 $3,663 $5,240 $6,861 $3,725 $5,318 $7,055
7

Cost of Operating SMSFS 2020 SMSF Association
Table 8 - Range of annual costs of Retail Master Trusts ($) – Accumulation account
Table 9 - Range of annual costs of Retail Personal Superannuation – Accumulation account
Balance One member Two members
Low Mid High Low Mid High
$50,000 $445 $573 $850 $501 $660 $1,012
$100,000 $786 $1,054 $1,595 $842 $1,142 $1,757
$150,000 $1,137 $1,537 $2,349 $1,192 $1,624 $2,511
$200,000 $1,471 $2,019 $3,103 $1,526 $2,107 $3,265
$250,000 $1,805 $2,502 $3,857 $1,860 $2,589 $4,019
$300,000 $2,139 $2,984 $4,594 $2,195 $3,072 $4,756
$400,000 $2,736 $3,949 $5,945 $2,792 $4,037 $6,107
$500,000 $3,386 $4,899 $7,296 $3,442 $4,986 $7,458
Balance One member Two members
Low Mid High Low Mid High
$50,000 $403 $572 $729 $462 $654 $872
$100,000 $706 $1,033 $1,379 $764 $1,116 $1,522
$150,000 $1,008 $1,486 $2,057 $1,067 $1,568 $2,200
$200,000 $1,311 $1,938 $2,790 $1,369 $2,021 $2,933
$250,000 $1,613 $2,391 $3,565 $1,672 $2,473 $3,708
$300,000 $1,916 $2,844 $4,161 $1,974 $2,927 $4,304
$400,000 $2,521 $3,725 $5,344 $2,579 $3,807 $5,487
$500,000 $3,105 $4,575 $6,602 $3,163 $4,657 $6,746
8

Cost of Operating SMSFS 2020 SMSF Association
1.6 Actual expenses of SMSFs
We also examined the expenses incurred by a sample of approximately 100,000 anonymised SMSFs. Commentary and analysis is presented in Section 4 (Actual expenses of SMSFs) and detailed tables are presented in Appendix A (SMSF Expense analysis). Expenses were aggregated into three categories:
— Management and administration.— Audit.— Investment.
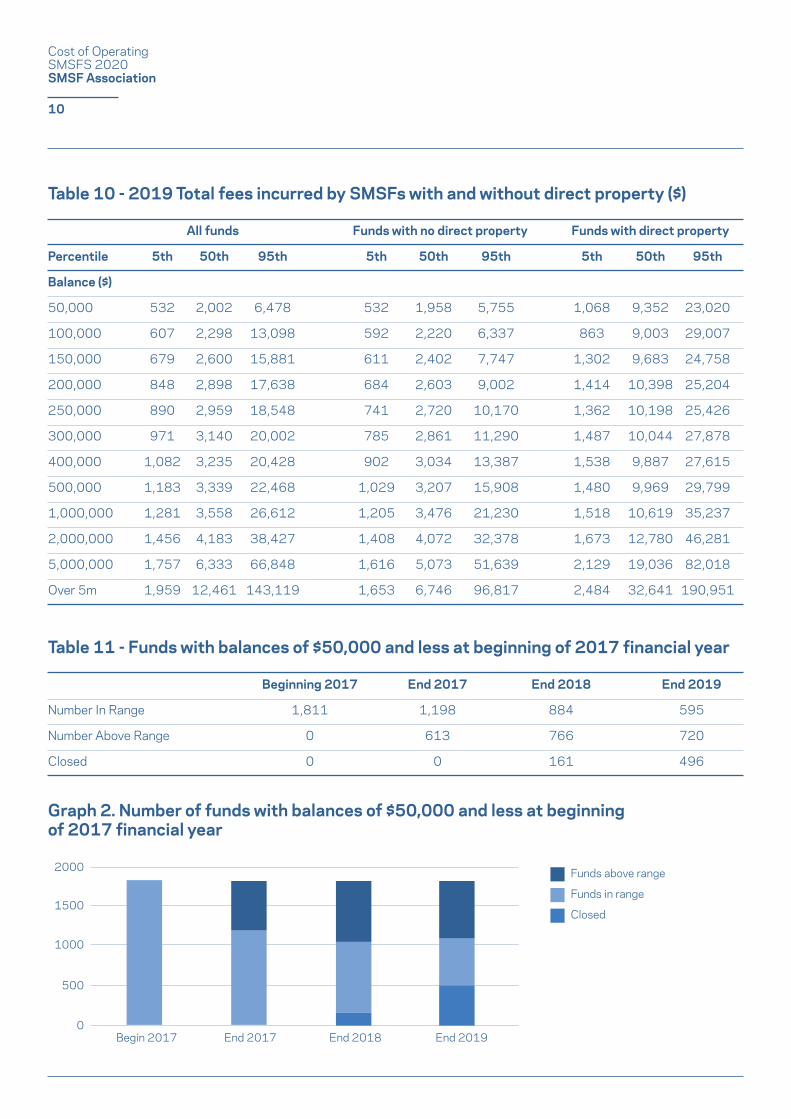
We have analysed these fees at the 5th, 50th (Median) and 95th Percentile levels as points of comparison with the Low, Mid and High fees for the APRA regulated funds and SMSF fee scales. The overall results of the analysis are shown in Table 10.
The analysis, which is presented in detail in Section 4 (Actual expenses of SMSFs), shows that:
— Expenses at the 5th Percentile level for the smaller funds are markedly lower than what could be expected from the fee scales of the various service providers. This partly reflects the simple investment holdings of these funds, but also indicates that some service providers are only charging nominal fees to these funds, possibly because they are a small part of a much larger business relationship.
— Expenses for funds with direct property are distinctly higher than for funds without direct property. This undoubtedly relates to the higher investment costs of servicing direct property and higher administration costs for accounting and related services.
— Funds with only pension accounts have equivalent expense levels to funds with only accumulation accounts. This is, at least in part, due to pension only funds having simpler investment arrangements when compared to funds with accumulation accounts and, for the most part, not investing in expensive direct property.
— The expenses at the 95th Percentile should not be taken as indicative of regular annual costs because they are biased by significant establishment costs for complex investments and direct property. These high costs occur each year, but they are for a different group of SMSFs in different years. This means that the expenses presented in the Australian Taxation Office (ATO) Statistical Tables for investment costs should be treated with some caution because they are not necessarily an accurate reflection of regular annual costs being incurred by SMSFs.
1.7 Growth and termination of funds
Our brief includes a specific request to consider the situation of SMSFs that start small and grow over time. We have used the sample of 100,000 funds to examine the experience of these small funds from the beginning of the 2017 financial year until the end of the 2019 financial year. Full details are presented in Section 2.4 (Growth and termination of funds).
Table 11 and Graph 2 show the experience of the smallest funds, those with balances of $50,000 and less, over this three-year period.
Of the 1,811 funds of this size at the beginning of 2017, 720, or 40% had grown and moved outside this range by the end of 2019 with 33% moving above the range in the first year. 27% of the funds were closed during the period and 33% remained within the range.
These results show that only a small number of these smallest funds remain as such over time. The majority grow quickly via contributions and roll-ins or are closed. For the group that remained within the range, expense data showed that they were generally charged very low fees and would appear to be remnant funds. The fee levels are presented in more detail in Section 4 (Actual expenses of SMSFs).
These funds are small primarily because they are either new and growing or are being prepared to be shut down. There is no evidence that they are being exploited via high fees.
9
Cost of Operating SMSFS 2020 SMSF Association
Table 10 - 2019 Total fees incurred by SMSFs with and without direct property ($)
All funds Funds with no direct property Funds with direct property
Percentile 5th 50th 95th 5th 50th 95th 5th 50th 95th
Balance ($)
50,000 532 2,002 6,478 532 1,958 5,755 1,068 9,352 23,020
100,000 607 2,298 13,098 592 2,220 6,337 863 9,003 29,007
150,000 679 2,600 15,881 611 2,402 7,747 1,302 9,683 24,758
200,000 848 2,898 17,638 684 2,603 9,002 1,414 10,398 25,204
250,000 890 2,959 18,548 741 2,720 10,170 1,362 10,198 25,426
300,000 971 3,140 20,002 785 2,861 11,290 1,487 10,044 27,878
400,000 1,082 3,235 20,428 902 3,034 13,387 1,538 9,887 27,615
500,000 1,183 3,339 22,468 1,029 3,207 15,908 1,480 9,969 29,799
1,000,000 1,281 3,558 26,612 1,205 3,476 21,230 1,518 10,619 35,237
2,000,000 1,456 4,183 38,427 1,408 4,072 32,378 1,673 12,780 46,281
5,000,000 1,757 6,333 66,848 1,616 5,073 51,639 2,129 19,036 82,018
Over 5m 1,959 12,461 143,119 1,653 6,746 96,817 2,484 32,641 190,951
Beginning 2017 End 2017 End 2018 End 2019
Number In Range 1,811 1,198 884 595
Number Above Range 0 613 766 720
Closed 0 0 161 496
Table 11 - Funds with balances of $50,000 and less at beginning of 2017 financial year
Graph 2. Number of funds with balances of $50,000 and less at beginning of 2017 financial year
0Begin 2017 End 2017 End 2018 End 2019
Closed
Funds above range
Funds in range
500
1000
1500
2000
10
Cost of Operating SMSFS 2020 SMSF Association
1.8 Analysis and commentary
The reductions in fees for SMSFs and Retail funds and the increase in fees for Industry funds since our 2013 report have changed the relative competitiveness of SMSFs in comparison to the APRA regulated funds. It is also clear that fees considerably lower than those on pricing schedules are being charged to some SMSFs which means that they are competitive even at small sizes. The full analysis is presented in Section 6 (Analysis and commentary).As there is a range of costs for all fund types, the costs for each type overlap with the costs of the others. It is therefore not possible to fix on a specific set of costs and say that one product is cheaper than another for some specified balance. We therefore present the range of costs for SMSFs of various size balances and indicate whether the fee is:
— Above the range of fees for equivalent balances held in industry or Retail funds – i.e. that it is above the High fee for that account balance.
— Within the range of fees for equivalent balances held in industry or Retail funds – i.e. that it is between the Low and High fee for that account balance.
— Below the range of fees for equivalent balances held in industry or Retail funds – i.e. that it is below the Low fee for that account balance.
Table 12 shows these comparisons for SMSFs that outsource only their compliance administration and for those that outsource all their administration.
Comparing the fees of SMSF service providers and the fees of Industry and Retail Funds, we can observe the following:
— SMSFs with less than $100,000 are not competitive in comparison to APRA regulated funds:
— SMSFs with less than $50,000 are more expensive than all alternatives.
— Between $50,000 and $100,000 the cheapest SMSFs become cheaper than only the most expensive APRA regulated funds.
— SMSFs of this size would only be appropriate if they are expected to grow to a competitive size within a reasonable time. The analysis of these small funds over time, see Section 2.4 (Growth and termination of funds), shows that the majority of these funds do, in fact, grow.
— This assessment is consistent with our 2013 assessment.
— SMSFs with $100,000 to $150,000 are competitive with APRA regulated funds provided the Trustees use one of the cheaper service providers or undertake some of the administration themselves:
— The Low and Mid fees for SMSFs for Compliance Administration and for Full Administration are in the ranges of fees for APRA regulated funds. It would therefore be possible for members with balances of these sizes to obtain a modest reduction in costs by moving to an SMSF provided the Trustees avoid the more expensive SMSF providers.
— This assessment is different from our 2013 assessment which found that only the cheapest Compliance Administration fees were lower than the most expensive Retail fund fees. Industry funds and, the then new, personal superannuation products were a cheaper alternative.
— SMSFs with $200,000 or more are competitive with both Industry and Retail funds even for full administration:
— The Low fees for SMSFs for Compliance Administration are lower than the fees for Industry and Retail funds.
— Members moving to SMSFs from Industry or Retail funds with balances at this level could obtain equivalent or cheaper fees.
— This assessment is different from our 2013 assessment which found that SMSFs of this size were only competitive provided the Trustees carried out the broader investment administration functions because full administration fees were not competitive.
— For balances of $250,000 or more SMSFs become the cheapest alternative provided the Trustees undertake some of the administration, or, if seeking full administration, choose one of the cheaper services.
— SMSFs requiring full services:
— Can be competitive with APRA regulated funds provided they use a lower cost supplier and their balance is at least $150,000 of assets.
— Can be the cheapest alternative provided they use a lower cost supplier and their balance is at least $200,000 of assets.
11

Cost of Operating SMSFS 2020 SMSF Association
Table 12 - Comparison of annual costs of SMSFs ($) - Accumulation accounts
Balance SMSF Compliance Admin SMSF Full Admin
Low Mid High Low Mid High
$50,000 $1,189 $1,689 $2,453 $1,514 $2,134 $3,074
$100,000 $1,190 $1,690 $2,454 $1,515 $2,135 $3,075
$150,000 $1,191 $1,691 $2,455 $1,516 $2,136 $3,076
$200,000 $1,193 $1,693 $2,457 $1,518 $2,138 $3,078
$250,000 $1,194 $1,694 $2,458 $1,519 $2,139 $3,079
$300,000 $1,196 $1,696 $2,460 $1,521 $2,141 $3,081
$400,000 $1,199 $1,699 $2,463 $1,524 $2,144 $3,084
$500,000 $1,203 $1,703 $2,467 $1,528 $2,148 $3,088
SMSF Fee above range for Retail and Industry funds
SMSF Fee within range for Retail and Industry funds
SMSF Fee below range for Retail and Industry funds
— At sizes of $500,000 and above, SMSFs are generally the cheapest alternative:
— For SMSFs with only accumulation accounts, the fees at all levels are lower than the lowest fees of APRA regulated funds.
— For SMSFs with pension accounts, only the highest full administration fees exceed the lowest fees of APRA regulated funds.
— This assessment is different from our 2013 assessment which found that SMSFs of this size were only competitive (ie within the range of fees for APRA regulated funds) , but not cheapest, on a full-service basis and only cheapest if the Trustees undertook some or all of the administration functions.
— The comparisons for SMSFs paying pensions are very similar to those for accumulation funds.
— The comparisons for funds comprising two members are little different from the comparisons for funds comprising a single member. The extra per member fees for the APRA regulated funds are generally small in relation to the total fees charged.
— SMSFs with multiple members and a combination of accumulation and pension accounts are competitive from balances as low as $100,000 and can be the cheapest alternative from balances of $150,000 provided the Trustees undertake some or all the administration functions.
Comparing the actual costs paid by SMSFs and the fees of Industry and Retail Funds, we can observe the following:
— The Low fees being paid are cheaper than fee schedules indicate.
— These Low fees are cheaper than the APRA regulated alternatives for balances of $100,000 and above.
— Median fees for SMSFs without direct property are competitive for balances of $200,000 and above.
— Median and High fees for SMSFs with direct property are higher than the highest fees for APRA regulated funds for all balance sizes, but are in respect of investments that are not available through APRA regulated funds.
In summary:
— SMSFs with balances of $200,000 or more provide equivalent value to Industry and Retail funds at all levels of administration.
— SMSFs with balances of $500,000 or more are generally the cheapest alternative.
— The majority of SMSFs with low balances either grow to competitive size or are closed. Those that remain are generally remnant funds on low fees.
12
Cost of Operating SMSFS 2020 SMSF Association
1.9 Other considerations
Whilst this report focuses on the costs of operating SMSFs, costs are not the only consideration when making the decision as to whether to invest in an SMSF or an APRA regulated fund. These issues are discussed in detail in Section 7 ( Other considerations) and include:
— The time available to and the expertise of the Trustees.
— The guarantee available to members of APRA regulated funds.
— Asset allocations, especially the use of direct property and non-standard assets.
— Fee subsidies which can reduce the costs to members of APRA regulated funds.
— The age and growth prospects of the SMSF.
— Dealing with falling balances at older ages.
1.10 Acknowledgements
We would like to acknowledge the assistance of BGL Corporate Solutions and SuperConcepts in the provision of anonymised SMSF records without which our analysis would not have been possible.
This report was prepared for SMSF Association by the following consultants.
Prepared by
Alun Stevens Senior Consultant & Authorised Representative Telephone: (02) 9293 3700 [email protected]
Peer Reviewed by
Michael Rice AOExecutive Director & Authorised Representative Telephone: (02) 9293 [email protected]
22 November 2020
13

Cost of Operating SMSFS 2020 SMSF Association
SMSFs with $200,000 or more are competitive with both Industry and Retail funds even for full administration
Cost of Operating SMSFS 2020 SMSF Association
2. Overview of the SMSF Market
To provide a context for the analysis of the costs of operating an SMSF, we have prepared an overview of the market. The statistics have been extracted from the Self managed super fund statistical report - June 2019 produced by the ATO. It should be noted that not all statistical items are updated to June 2020 in this report. For some, the most recent reporting date is June 2019.
15
Cost of Operating SMSFS 2020 SMSF Association
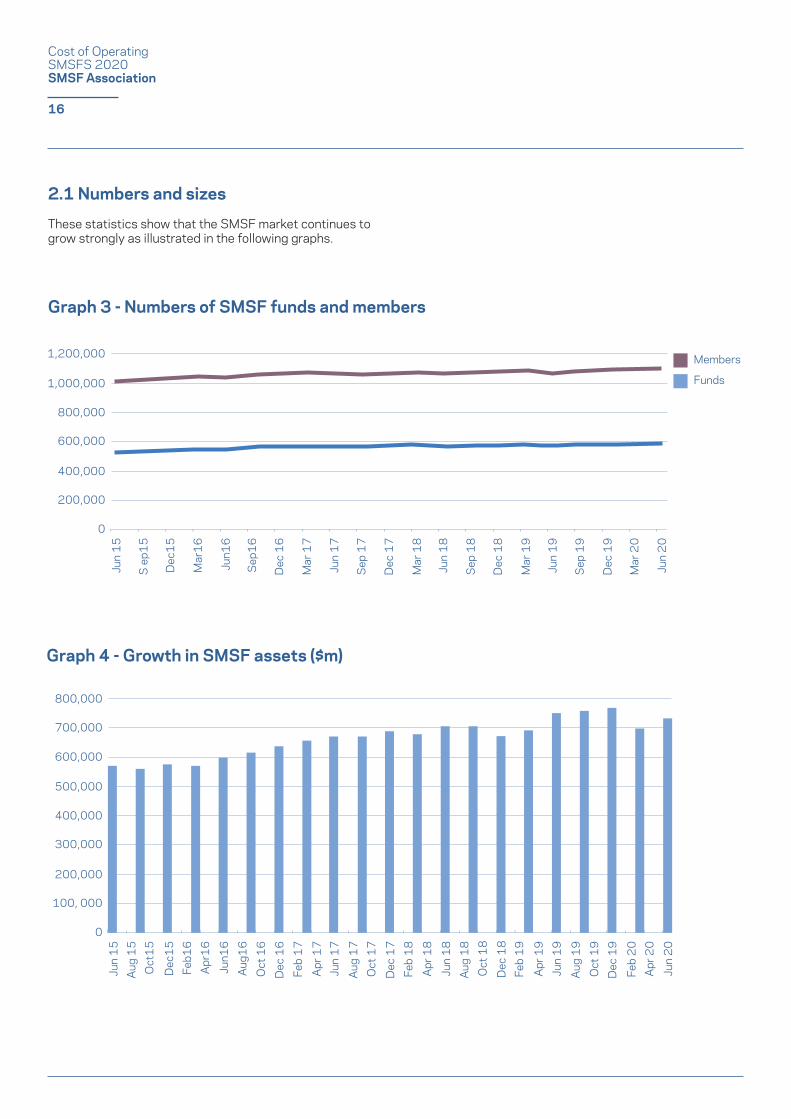
Graph 3 - Numbers of SMSF funds and members
Graph 4 - Growth in SMSF assets ($m)
2.1 Numbers and sizes
These statistics show that the SMSF market continues to grow strongly as illustrated in the following graphs.
16
0
200,000
400,000
600,000
800,000
1,000,000
1,200,000
Jun
15
S e
p15
Dec
15
Mar
16
Jun1
6
Sep
16
Dec
16
Mar
17
Jun
17
Sep
17
Dec
17
Mar
18
Jun
18
Sep
18
Dec
18
Mar
19
Jun
19
Sep
19
Dec
19
Mar
20
Jun
20
Members
Funds
0
100, 000
200,000
300,000
400,000
500,000
600,000
700,000
800,000
Jun
15
Aug
15
Oct
15
Dec
15
Feb1
6A
pr1
6
Jun1
6A
ug1
6O
ct 1
6D
ec 1
6Fe
b 1
7
Jun
17
Apr
17
Aug
17
Oct
17
Dec
17
Feb
18
Apr
18
Jun
18
Aug
18
Oct
18
Dec
18
Feb
19
Apr
19
Jun
19
Aug
19
Oct
19
Dec
19
Feb
20
Jun
20
Apr
20

Cost of Operating SMSFS 2020 SMSF Association
The establishments over recent years are provided in Table 13 which shows the number of funds established and terminated for the financial years 2015 to 2020.
The 2020 statistics are subject to change. Experience indicates that the number of Wind Ups will be revised upwards thus reducing the number of Net Establishments. Nonetheless, there is continuing strong demand for the establishment of SMSFs.
The distribution of SMSFs by asset size is relevant to this study. Table 14 and Graph 5 illustrate the proportion of funds by size for the 2018-19 financial year. These statistics show that approximately 15% of funds have less than $200,000 of assets. This is a lower proportion than was the case at the time of our 2013 report when 22% of funds had less than $200,000 of assets.
Financial Year 2015 2016 2017 2018 2019 2020
Establishments 33,379 32,790 30,333 25,359 20,371 21,303
Wind Ups 13,664 13,465 14,632 24,093 15,677 2,763
Net Establishments 20,075 19,325 15,701 1,266 4,694 18,540
Total number of funds 533,849 553,174 568,875 570,141 574,835 593,375
Total number of 1,010,602 1,042,220 1,072,140 1,069,076 1,072,701 1,107,268 members
Table 13 - Establishments of SMSFs
17
Table 14 - Proportion of SMSFs by fund size (2018-19 financial year)
Asset Ranges Percentage
$0-$50,000 5.70
>$50,000 $100,000 2.70
>$100,000 $200,000 6.50
>$200,000 $500,000 21.70
>$500,000 $1m 25.10
>$1m $2m 20.80
>$2m $5m 13.70
>$5m 3.80
Total 100%

Cost of Operating SMSFS 2020 SMSF Association
Graph 5 - Proportion of SMSFs by fund size (2018/19 financial year)
18
>$1m - $2m20.8%
>$500,000 - $1m25.1%
>$200,000 - $500,00021.7%
$100,00 - $200,0006.5%
$50,000 - $100,0002.7%
$0 - $50,0005.7%
>$5m3.8%
>$2m - $5m13.7%

Cost of Operating SMSFS 2020 SMSF Association
2.2 Investment allocations
The data presented in Table 15 show distinct differences in asset allocations for small and large funds. Graph 6 compares the asset allocation of funds with assets of $50k to $100k to funds with assets of $1 million to $2 million.
Small funds have much greater allocations to Cash and Term Deposits and lower allocations to Australian Shares, Property and Managed Assets. This, in part, reflects the greater capacity of larger funds to diversify their assets and to invest in assets (like property) that require larger holdings.A material proportion of the small funds are young funds still holding Cash and related assets as they seek to invest in the higher yielding asset classes. There is also a material proportion holding only Cash and related assets because they are preparing to close. These movements in funds are discussed in detail in Section 2.4 (Growth and termination of funds).
These differences in asset allocations result in quite different investment returns for smaller and larger funds, but also provide a basis for lower fees for smaller funds. The smaller number of asset holdings and simpler products held by smaller funds make for simpler accounting and cheaper administration.
19

Cost of Operating SMSFS 2020 SMSF Association
Asset type $1 >$50k >$100 >$200 >$500k >$1- >$2 All - - - - - - - >$5m SMSF $50k $100k $200k $500k $1m $2m $5m
Australian 23.8 25.0 26.8 27.9 31.2 35.6 36.6 35.6 32.0 Listed Assets
Cash and TDs 52.6 45.4 42.3 28.9 23.6 22.9 20.4 17.1 21.3
Real Property 1.8 3.9 6.2 10.9 12.6 13.8 14.7 14.1 15.4
Managed Assets 1.1 2.5 3.0 3.8 4.6 5.6 5.7 5.4 5.1
Debt and Loans 1.7 3.0 2.5 1.4 1.5 1.9 2.4 2.9 2.3
Overseas (all) 1.4 2.1 2.0 1.2 1.1 1.3 1.7 2.5 1.6
Collectibles 0.5 0.5 0.4 0.1 0.1 0.0 0.0 0.0 0.0
Unlisted Assets 17.0 17.5 15.9 11.3 11.1 13.1 15.5 19.0 15.4 and Other
Limited 0.0 0.2 1.1 14.5 14.2 5.9 3.2 3.5 6.9 Recourse Borrowing
TOTAL 100 100 100 100 100 100 100 100 100
Table 15 - Asset allocation by size of SMSFs (%) - 2018/19 Financial Year
20
Graph 6 - The average asset allocation of SMSFs
>$50k - $100k >$1m - $2m
Australian Listed Assets
Debt and Loans
Limited recourse borrowing
Real Property Collectibles
Cash and TDs
Overseas (all)
Managed Assets
Unlisted Assets and Other
0%
5%
10%
15%
20%
25%
30%
35%
40%
45%
50%
Cost of Operating SMSFS 2020 SMSF Association
2.3 Investment returns
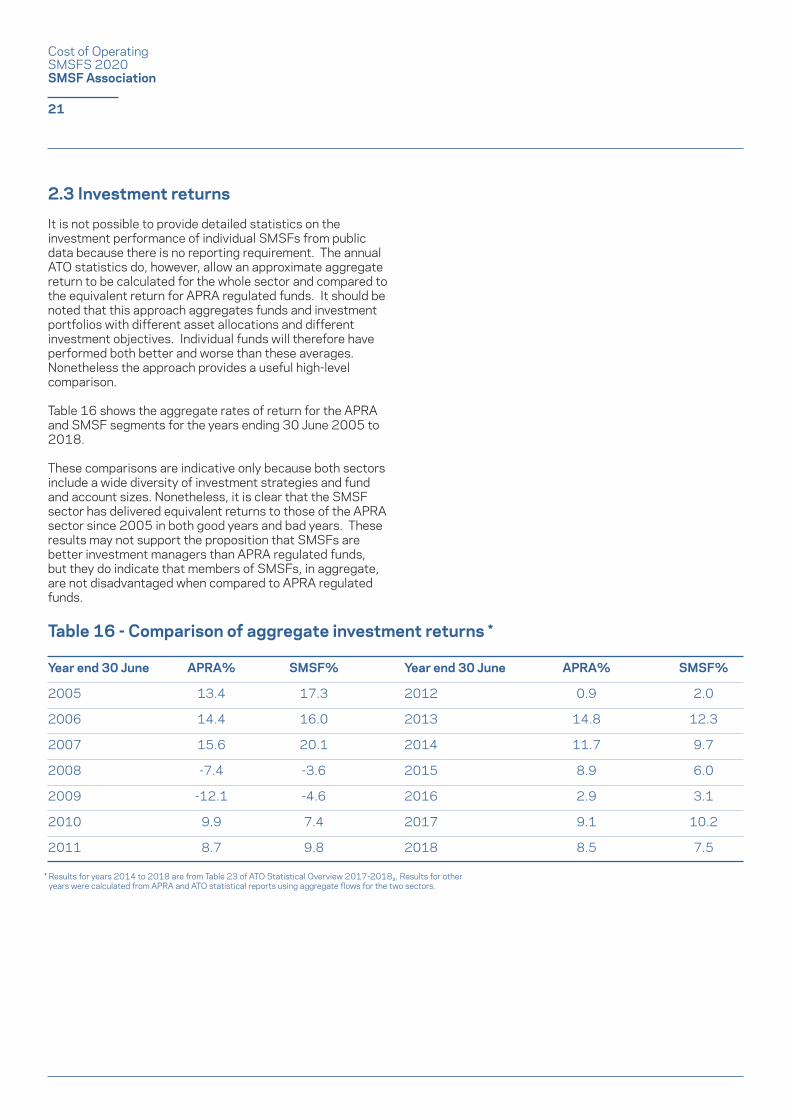
It is not possible to provide detailed statistics on the investment performance of individual SMSFs from public data because there is no reporting requirement. The annual ATO statistics do, however, allow an approximate aggregate return to be calculated for the whole sector and compared to the equivalent return for APRA regulated funds. It should be noted that this approach aggregates funds and investment portfolios with different asset allocations and different investment objectives. Individual funds will therefore have performed both better and worse than these averages. Nonetheless the approach provides a useful high-level comparison.
Table 16 shows the aggregate rates of return for the APRA and SMSF segments for the years ending 30 June 2005 to 2018.
These comparisons are indicative only because both sectors include a wide diversity of investment strategies and fund and account sizes. Nonetheless, it is clear that the SMSF sector has delivered equivalent returns to those of the APRA sector since 2005 in both good years and bad years. These results may not support the proposition that SMSFs are better investment managers than APRA regulated funds, but they do indicate that members of SMSFs, in aggregate, are not disadvantaged when compared to APRA regulated funds.
Year end 30 June APRA% SMSF% Year end 30 June APRA% SMSF%
2005 13.4 17.3 2012 0.9 2.0
2006 14.4 16.0 2013 14.8 12.3
2007 15.6 20.1 2014 11.7 9.7
2008 -7.4 -3.6 2015 8.9 6.0
2009 -12.1 -4.6 2016 2.9 3.1
2010 9.9 7.4 2017 9.1 10.2
2011 8.7 9.8 2018 8.5 7.5
Table 16 - Comparison of aggregate investment returns *
* Results for years 2014 to 2018 are from Table 23 of ATO Statistical Overview 2017-20182. Results for other years were calculated from APRA and ATO statistical reports using aggregate flows for the two sectors.
21

Cost of Operating SMSFS 2020 SMSF Association
Asset Ranges Investment Returns (%) Investment Returns (%) Investment Returns (%) 2017 2018 2019
$0-$50,000 2.52% 2.26% 1.95%
>$50,000-$100,000 2.53% 2.29% 2.42%
>$100,000-$200,000 4.56% 3.86% 4.30%
>$200,000-$500,000 7.07% 6.02% 6.43%
>$500,000-$1m 8.64% 7.00% 7.76%
>$1m-$2m 9.16% 7.57% 8.15%
>$2m-$5m 10.28% 8.11% 8.49%
>$5m 11.83% 8.35% 8.47%
Table 17. Median investment returns of SMSFs by fund size (2017-2019)
2 Australian Taxation Office: Self-managed super funds: A statistical overview 2017–18; https://www.ato.gov.au/About-ATO/Research-and-statistics/In-detail/Super-statistics/SMSF/Self-managed-super-funds--A-statistical-overview-2017-18/
22
As part of this report we were provided with anonymised and summarised data for approximately 100,000 SMSFs for the 2017, 2018 and 2019 financial years. This allowed us to calculate rates of investment return for these funds accord-ing to the size of the funds. The results we obtained are shown in Table 17. These returns are before tax and expens-es. The larger funds enjoy higher rates of return than the smaller ones, reflecting their more extensive and diversified investment portfolios.
Most of these median investment returns are higher than the comparable average returns presented in Table 24 of the ATO Statistical Overview 2017-2018. This is probably the result of our analysis being based on a sample rather than the whole market; the use of medians instead of averages; and the fact that extreme outliers were removed from our sample.

Cost of Operating SMSFS 2020 SMSF Association
2.4 Growth and termination of funds
We have also examined the dynamics of the smaller funds to determine whether they are stagnating or growing. The concern is that small funds could be caught in a trap of low returns and high fees and would be better transferred to an APRA regulated fund. This analysis required the sample of 100,000 funds. We examined funds from the beginning of the 2017 financial year until the end of the 2019 financial year. We tracked funds within various balance ranges to determine whether they grew to move above their initial range, contracted to fall below that range, remained in that range or were closed. The results are shown in Table 18 to Table 20 and Graph 7 to Graph 9 for fund balances up to $200,000.
Table 18 - Funds with balances of $50,000 and less at beginning of 2017 financial year
Graph 7 - Number of funds with balances of $50,000 and less at beginning of 2017 financial year
Beginning 2017 End 2017 End 2018 End 2019
Number In Range 1,811 1,198 884 595
Number Above Range 0 613 766 720
Closed 0 0 161 496
0Begin 2017 End 2017 End 2018 End 2019
500
1000
1500
2000
For the smallest funds, those with balances of $50,000 or less, 40% had grown and moved outside this range; 27% had been closed; and 33% were still of this size at the end of the three years; 33% of the starting funds had moved above the range within the first year.
For funds with balances between $50,000 and $100,000 at the beginning, 46% had moved above this range; 25% were still of this size; 6% had declined below the range; and 22% had closed. 31% had moved above the range within the first year.
23
Closed
Funds above range
Funds in range
Funds below range

Cost of Operating SMSFS 2020 SMSF Association
Graph 7 - Number of funds with balances of $50,000 and less at beginning of 2017 financial year
Graph 8 - Number of funds with balances of $50,000 to $100,000 at beginning of 2017 financial year
Table 19 - Funds with balances of $50,000 to $100,000 at beginning of 2017 financial year
Beginning 2017 End 2017 End 2018 End 2019
Number In Range 2,530 1,580 1,036 650
Number Above Range 0 806 1,138 1,166
Number Below Range 0 144 183 161
Closed 0 0 173 553
24
3000
2500
2000
1500
1000
500
0Begin 2017 End 2017 End 2018 End 2019
Closed
Funds above range
Funds in range
Funds below range

Cost of Operating SMSFS 2020 SMSF Association
For funds with balances between $100,000 and $200,000 at the beginning, 40% had moved above this range; 34% were still of this size; 6% had declined below the range; and 20% had closed. 24% had moved above the range within the first year.
These results show that only a small number of funds in the smallest category (Balances ≤$50,000) remain there over time. The majority grow quickly via contributions and roll-ins or are closed. For the group that remained within the range, expense data showed that they were generally charged very low fees and would appear to be remnant funds. The fee levels are presented in more detail in Section 4 (Actual expenses of SMSFs).
These funds are small primarily because they are either new and growing or are being prepared to be shut down. There is no evidence that they are being exploited via high fees.
Table 20 - Funds with balances of $100,000 to $200,000 at beginning of 2017 financial year
Beginning 2017 End 2017 End 2018 End 2019
Number In Range 8,043 5,785 4,160 2,740
Number Above Range 0 1,909 2,959 3,208
Number Below Range 0 349 460 481
Closed 0 0 464 1,614
Graph 9 - Number of funds with balances of $100,000 to $200,000 at beginning of 2017 financial year
25
0
1000
2000
3000
4000
5000
6000
7000
8000
Begin 2017 End 2017 End 2018 End 2019
Closed
Funds above range
Funds in range
Funds below range

Cost of Operating SMSFS 2020 SMSF Association
>$250,000 SMSFs become the cheapest
alternative provided the Trustees undertake
some of the administration, or, if seeking full administration,
choose one of the cheaper services

Cost of Operating SMSFS 2020 SMSF Association
3. Costs for SMSFs
There is a wide range of service providers to the SMSF market including:— accountants— financial advisers— lawyers— administrators.The use that SMSF Trustees make of these service providers, and hence the costs they pay, depends on the preferences and capabilities of the Trustees. Some choose to carry out as much of the administration and accounting as they can themselves and only use advisers for the services they cannot carry out, such as audits and tax lodgements. Others rely on service providers for all functions.
Time spent on administration by Trustees can potentially be considered an opportunity cost. These opportunity costs have been ignored because their value is different for individual Trustees and impossible to estimate. By choosing a minimal service offering, Trustees indicate that the opportunity cost is worth the fee saving.
We have estimated the range of costs for the setup and running of SMSFs, through the marketing material of, and interviews with several suppliers of SMSF administration services, accountants, and auditors. As would be expected with a dynamic market, there is a range of costs that reflect the range of complexity of the SMSFs themselves. Costs for simple funds with little complexity and the Trustee seeking only transactional services will generally be at the low end of the range. Funds with more complexity and/or where the Trustee requires more assistance will generally be at the high end of the range.
It is noticeable that, apart from statutory fees that are indexed, fees across the market have fallen since our 2013 report. These reductions, which are more pronounced for larger funds, make the SMSF sector more competitive against the APRA regulated sector. The reductions have also narrowed the difference between full service and minimal service offerings
At the time of our 2013 report, there were no statistics available to allow us to determine the range of costs actually incurred by individual funds. We therefore presented High, Low and Mid-point costs in each category. We have repeated that methodology because these are the costs that Trustees would use to make decisions on whether to start or continue an SMSF.
For this report, however, we also have actual expense data for approximately 100,000 anonymised SMSFs. This is presented in Section 4 (Actual expenses of SMSFs).
3.1 Costs of establishment
Members can simply join a Retail or Industry superannuation fund, but if they wish to operate an SMSF the fund needs to be formally established. The costs associated with these establishments include:
— The legal and related costs of establishing and registering the superannuation trust including:
— trust deed
— ATO application forms
— Cash management account application
— provision of binding death nomination forms
— sample investment strategy
— notice of election to become a regulated fund
— general trust advice.
— The legal and related costs of establishing and registering the corporate Trustee for those SMSFs that choose this route in preference to having individual Trustees including:
— searches and reservations of company names
— preparation of company constitutions and Memoranda and Articles of association
— incorporation and registration of the entity
— general Corporations Law advice.
The most common recommendation to those seeking to establish an SMSF is that they use a corporate Trustee because it provides for simpler succession of Trustees, inclusion of new members and the ownership of assets. It is also common for those, like small business operators, who already have a company to establish a Trustee company separate from their business. The costs of establishing the corporate Trustee are therefore commonly incurred. The range of these costs is shown in Table 21.
3.2 Annual compliance costs
There is a range of fees that are necessarily incurred in operating an SMSF as they are either government charges or require professional support. We refer to these as the annual compliance administration costs and they include costs for:— statutory charges— financial statements and tax return— audit.
27

Cost of Operating SMSFS 2020 SMSF Association
Fee Low Mid High
SMSF Setup $330 $488 $695
Setup of corporate Trustee
ASIC fee $507 $507 $507
Service provider fee $704 $895 $1,257
Total $1,541 $1,890 $2,459
Fee Low Mid High
Annual ASIC fee (special purpose company) $55 $55 $55
ATO supervisory levy $259 $259 $259
Audit fee $350 $495 $639
Financial Statement and Tax Return $525 $880 $1,500
Total accumulation $1,189 $1,689 $2,453
Actuarial certificate $110 $176 $285
Total Pension (no certificate) $1,189 $1,689 $2,453
Total Pension (with certificate) $1,299 $1,865 $2,738
Table 21 - Range of costs for establishment of an SMSF
Table 22 - Range of annual compliance administration costs
The range of costs are shown in Table 22. Simpler funds will generally incur costs at the low end of the range and more complex funds at the high end. It is also the case that the service providers considered generally charge a higher fee if the fund is paying pensions, to cover the larger number of transactions and the extra compliance related to pension payments. Table 22 therefore shows the range of costs for both funds that are accumulation only and for those that pay pensions.
If a fund paying pensions also has accumulation accounts and does not segregate assets for the two categories, it needs to allocate its income between the two categories for tax purposes and for this it requires an actuarial certificate.
28

Cost of Operating SMSFS 2020 SMSF Association
3.3 Non-standard assets
Most providers also levy extra charges for these services if the fund holds non-standard assets or borrows to finance an asset purchase. The application of these extra fees to specific asset types varies between the service providers as does the level of the fees. We have excluded them from the comparison of costs because their application is very specific to particular funds and because the smaller funds, which are our primary focus, do not make much use of these asset classes, see Table 15.
Table 23 provides a indicative example of the application and size of these fees.
3.4 Full administration
Many service providers offer other services in addition to the basic requirement of compliance administration. These services include investment accounting, access to online investment platforms and investment analysis and reporting. The range of costs for the full administration service (including all services of compliance administration) is presented in Table 24.
These are the ranges of standard fees for up to two members, 10 to 15 investments, and no direct property. Individual funds may, therefore, pay fees more than the High fees shown here because of the complexity of their investment portfolios. These fees are, however, suitable for comparison with APRA regulated funds because those funds do not offer direct property, or other complex assets.
3.5 Investment management
Investment management expenses for SMSFs are difficult to quantify because they are quite specific to the assets and asset mixes chosen by Trustees. Those investing in direct property, for instance, will incur regular ongoing fees for property maintenance and rental and tenant management. Those utilising private trust structures for other directly held assets, will incur legal and accounting costs for these. Direct and complex assets will also generally incur legal and other costs for establishment.
These fees have been excluded from this analysis but would need to be considered by a Trustee wishing to invest in these asset types.
Trustees investing only in tradeable instruments (eg Australian Shares), Cash, Term Deposits and other simple financial products would not incur investment management charges.
Fees incurred directly by Trustees in managing investments are reflected in fund accounts, but fees incurred within
any Managed Fund investment are not, because they are deducted at source prior to the distribution of dividends. In order to provide a fairer comparison with APRA regulated funds, we have included an allowance for the investment management fees within Managed Funds. The allocation of SMSFs to Managed Funds is modest as is shown in Table 15.
The allocation to Managed Funds for the SMSFs considered in this report, namely those with asset balances up to $500,000, range from 1% for the smallest funds to 4% for the largest. This is a significant reduction in the allocation to Managed Funds revealed in our 2013 report which showed allocations for these small funds ranging from 4% to 12%.There is a wide range of investment management fees charged in the market. We have estimated the range of fees likely to be paid by SMSFs as:
Table 25 - Investment fee range
Fee level Fee
Low 0.07% pa
Mid 0.47% pa
High 1.75% pa
These fees represent the range that is encountered in the market for products ranging from simple index funds to actively Managed Funds for speciality assets. Some Exchange Traded Funds have even lower fees than the Low fee shown so the Low estimate is conservative.On the basis of these fees and the asset allocation shown in Table 15, the extra yearly indirect costs that should be considered for SMSFs are:
Table 26 - SMSF yearly investment management fees
Fund Balance Investment management fee ($)
Low Mid High
$50,000 0 3 9
$100,000 1 9 33
$150,000 2 17 62
$200,000 4 27 100
$250,000 5 36 133
$300,000 7 45 169
$400,000 10 67 249
$500,000 14 92 342
29

Cost of Operating SMSFS 2020 SMSF Association
Asset type Annual fee
Real Property $220 p.a. per property
Borrowing arrangement $352 p.a. per borrowing arrangement
Unlisted shares $220 p.a. per unlisted shares
In-house assets $220 p.a. per in-house asset
Derivatives Trading Account $220 p.a. per trading unit
Plant, equipment, and capital improvements $88 p.a. (e.g. renovations, appliances etc.)
Table 23 - Example of additional charges for non-standard assets3
Table 24 - Range of annual full administration costs
Fee Low Mid High
Full administration Fee $1,200 $1,820 $2,760
ASIC fee and ATO levy $314 $314 $314
Total accumulation $1,514 $2,134 $3,074
Actuarial certificate $110 $176 $285
Total Pension (no certificate) $1,514 $2,134 $3,074
Total Pension (with certificate) $1,624 $2,310 $3,359
30
3 http://www.superconcepts.com.au/fees-and-charges

Cost of Operating SMSFS 2020 SMSF Association
3.6 Advice
Apart from Intra-fund Advice, Advice fees are incurred on a fee-for-service basis. This makes it impossible to determine an allowance to include in the comparison for both SMSFs and APRA regulated funds. As a result, we have excluded the costs of general and strategic financial and investment advice from the comparison. It is also the case that those seeking to establish SMSFs can in the main be regarded as engaged investors. Their choice of superannuation vehicle is, therefore, unlikely to alter their level of engagement nor the level or types of financial and investment advice they seek.
The analysis of actual expenses incurred by SMSFs presented in Section 4 (Actual expenses of SMSFs), however, does include the cost of Advice.
3.7 Insurance
The provision of life insurance is a fundamental part of both APRA regulated funds and SMSFs. The costs of life insurance have been excluded from our analysis for the following reasons:
— Life insurance premiums are not one of the costs of operating SMSFs.
— Premiums are dependent on the level and type of cover
selected by the member. — A comparison including life insurance would, of necessity,
require an analysis of the benefit designs and value of these benefit designs. This is a complex task beyond the scope of this project.
We do, however, note that life insurance provided by an APRA regulated fund is likely to be cheaper for the same level of cover because the insurance is arranged on a group basis which offers economies of scale. Life insurance provided within SMSFs, on the other hand, is likely to be more specifically tailored to individual circumstances.
3.8 Winding up an SMSF
The costs of winding up an SMSF are not directly relevant to a comparison of the operating costs of SMSFs with the costs of APRA regulated accounts but are still something that should be considered by Trustees. They are listed here for completeness.There are several reasons why an SMSF will be wound up including:
— Marital breakdowns.
— Migration out of Australia.
— The desire to stop administering the SMSF and to transfer the benefits of an APRA regulated fund.
The process for winding up the fund includes:
— Preparing final financial statements for the fund.
— Having the fund audited.
— Lodging tax returns.
— Paying all levies.
— Paying or transferring benefits.
— Closing accounts.
— Notifying the ATO of the wind up.
— Deregistering any corporate Trustee.
The work required for these tasks is equivalent to the work required for the annual compliance administration of the fund. The levies are also equivalent to those required for the annual operation of the fund. The final year costs for the SMSF will therefore be within the ranges specified for the operation of the funds.
A difference when compared to normal operation of the fund will be the need to realise assets. This will incur transaction costs dependent on the particular asset being disposed of. In some cases, the benefit to members may be paid or transferred ‘in specie’ thereby avoiding some or all these transaction costs. The disposal or transfer will, however, be a CGT event and CGT may be payable. If there are accumulated losses at the time of the wind-up, these will not be able to be carried forward and will be lost.
31

Cost of Operating SMSFS 2020 SMSF Association
Fees (excluding statutory fees) have fallen over the past 7 years. Technology
improves, competition improves!

Cost of Operating SMSFS 2020 SMSF Association
4. Actual expenses of SMSFs
The analysis in Section 3 (Costs for SMSFs) presents the potential fees facing SMSF Trustees according to the fee structures of service providers. It is not possible from this to determine what any specific SMSF will be paying, which is why the fees are shown as a range. To understand these individual experiences, we were provided with an extract of 100,506 summarised and anonymised fund accounts.In this extract, expenses were aggregated into three categories:
— Management and Administration: this comprised all expenses not regarded as Audit or Investment expenses and included items like the ATO Supervisory Levy, ASIC fees (if any), and actuarial fees.
— Audit: this comprised fees designated as being for auditing.
— Investment: this comprised fees designated as being in relation to managing investments and included costs such as real estate agent fees, valuations, and the cost of model portfolios.
These categorisations, unfortunately, are not rigorous because we were dependent on the categorisations chosen by those recording the transactions. For some funds, all expenses other than the ATO Supervisory Levy have been classified as Investment expenses whilst for others, expenses clearly related to managing assets have been classified as Management and Administration.
We did not separate out funds in their first year which were likely to have incurred establishment costs. We also did not separate out funds closed in the year which were likely to have incurred wind-up costs. Start-up and wind-up funds will likely have extended the upper end of the expense distributions.
Advice fees are also included in this analysis, but it was not possible to separate them. Advice fees for some funds have been entered under Management and Administration and for others have been entered under Investment, and for some funds there are no Advice fees. Fees, at least in the lower half of the ranges for Management and Administration and Investment, do not appear to include Advice fees. If they do, the Advice fees are modest.
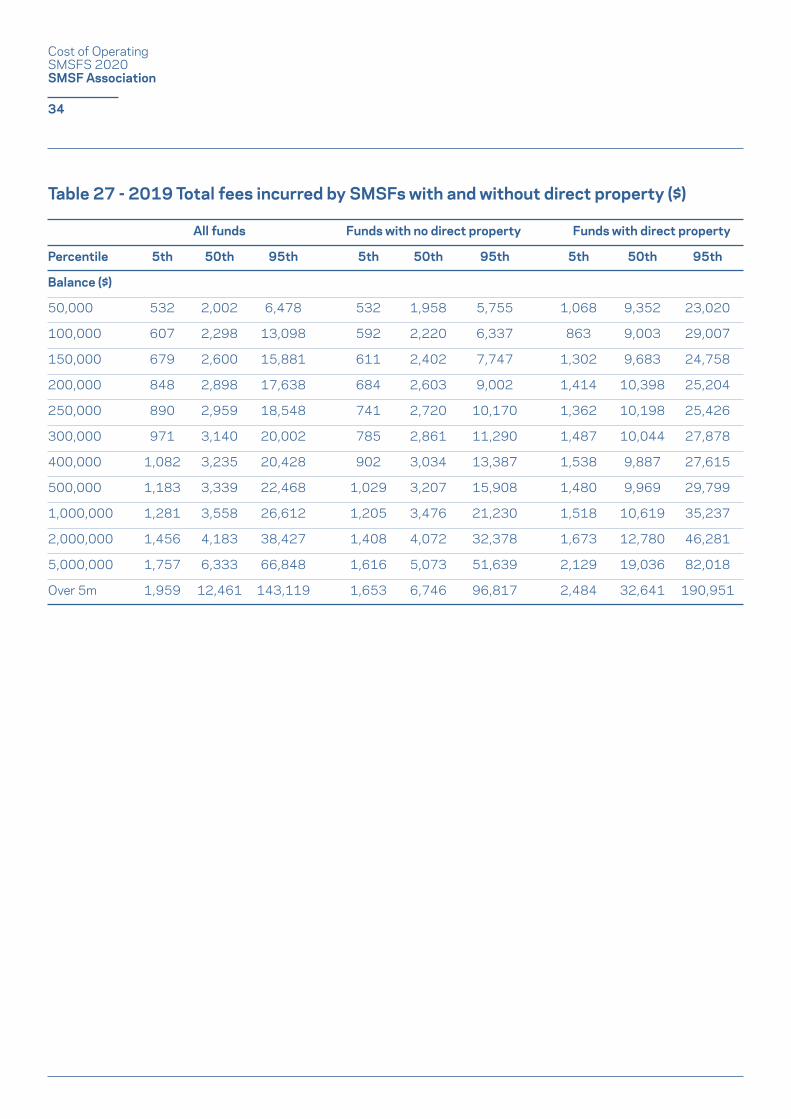
Table 27 shows the total fees incurred by funds of different balances for the 2019 Financial Year. A detailed presentation of the results is presented in Appendix A (SMSF Expense analysis) showing the breakdown between expense categories.
Table 27 and Table 28 show the overall experience for funds for the 2019 Financial Year. All funds shows the results for the full sample of 100,506 funds. Separate results are also shown for the 70,478 funds that did not hold any direct property and the 30,028 funds that did hold direct property. The expenses are shown at the 5th, 50th (Median) and 95th percentile levels within the sample to illustrate Low, Medium, and High fees.
The expenses for the sample funds have been reconciled to the expense data published by the ATO in their report Self-managed super funds: A statistical overview 2017–184. The expenses for the sample range from approximately 5% higher than those published by the ATO for balances of $50,000 to approximately 3% lower for balances of $500,000.
As expected, the fees rise with the size of the total balance held by the funds, although there are some anomalies due to the sampling. Unsurprisingly, funds with holdings of direct property are more expensive. Funds with property have higher Investment fees because of the costs of administering properties, and generally also higher Management and Administration costs due to the extra complexities of record keeping and accounting.
4 https://www.ato.gov.au/About-ATO/Research-and-statistics/In-detail/Super-statistics/SMSF/Self-managed-super-funds--A-statistical-overview-2017-18/
33
Cost of Operating SMSFS 2020 SMSF Association
Table 27 - 2019 Total fees incurred by SMSFs with and without direct property ($)
All funds Funds with no direct property Funds with direct property
Percentile 5th 50th 95th 5th 50th 95th 5th 50th 95th
Balance ($)
50,000 532 2,002 6,478 532 1,958 5,755 1,068 9,352 23,020
100,000 607 2,298 13,098 592 2,220 6,337 863 9,003 29,007
150,000 679 2,600 15,881 611 2,402 7,747 1,302 9,683 24,758
200,000 848 2,898 17,638 684 2,603 9,002 1,414 10,398 25,204
250,000 890 2,959 18,548 741 2,720 10,170 1,362 10,198 25,426
300,000 971 3,140 20,002 785 2,861 11,290 1,487 10,044 27,878
400,000 1,082 3,235 20,428 902 3,034 13,387 1,538 9,887 27,615
500,000 1,183 3,339 22,468 1,029 3,207 15,908 1,480 9,969 29,799
1,000,000 1,281 3,558 26,612 1,205 3,476 21,230 1,518 10,619 35,237
2,000,000 1,456 4,183 38,427 1,408 4,072 32,378 1,673 12,780 46,281
5,000,000 1,757 6,333 66,848 1,616 5,073 51,639 2,129 19,036 82,018
Over 5m 1,959 12,461 143,119 1,653 6,746 96,817 2,484 32,641 190,951
34

Cost of Operating SMSFS 2020 SMSF Association
Table 28 - 2019 Total fees incurred by SMSFs with and without pension accounts ($)
All funds Funds with no direct property Funds with direct property
Percentile 5th 50th 95th 5th 50th 95th 5th 50th 95th
Balance ($)
50,000 821 2,409 6,842 613 2,177 5,923 532 1,936 6,542
100,000 772 2,960 8,950 540 2,447 7,921 608 2,250 13,289
150,000 862 2,785 9,137 672 2,373 8,012 677 2,611 16,307
200,000 1,082 2,850 12,171 704 2,601 9,649 848 2,919 18,098
250,000 987 3,137 13,347 830 2,908 10,809 891 2,959 18,933
300,000 796 3,194 17,257 1,236 2,939 12,439 913 3,182 20,732
400,000 1,061 3,327 16,613 1,236 3,174 13,790 1,045 3,295 21,861
500,000 1,116 3,472 19,808 1,367 3,230 16,661 1,139 3,502 24,642
1,000,000 1,334 3,773 25,694 1,375 3,464 22,727 1,211 3,905 28,673
2,000,000 1,593 4,479 39,867 1,471 3,949 34,241 1,338 5,127 40,692
5,000,000 1,905 6,583 68,339 1,447 4,730 52,681 1,473 7,011 70,631
Over 5m 2,116 12,452 139,881 5,079 10,949 82,363 1,464 12,919 148,004
Table 28 shows the total expenses incurred by SMSFs in the sample subdivided according to whether they had pension accounts, accumulation accounts or both. Funds with both pension and accumulation accounts are more expensive to operate than funds with only pension or accumulation accounts. Interestingly, funds with only pension accounts have equivalent expense levels to funds with only accumulation accounts. This is partly due to pension only funds having simpler investment arrangements when compared to funds with accumulation accounts and, for the most part, not investing in expensive direct property.
35

Cost of Operating SMSFS 2020 SMSF Association
36
The striking feature of these results is that fees at the 5th Percentile level for the smaller funds are markedly lower than what could be expected from the various fee scales of SMSF service providers. The 5th Percentile fee for funds with balances less than $50,000, for instance, is only $532, which only provides a margin of $273 above the ATO Supervisory Levy. This partly reflects the very simple investment holdings of these funds, many with only Cash, but also shows that some service providers are only charging nominal fees for these funds, possibly because they are only a small part of a much larger business relationship.
The 95th percentile fees are above the fees that could be expected from the various fee scales of SMSF service providers as analysed in Section 3 (Costs for SMSFs). This is primarily because of Investment fees which were not included in that analysis because of their individual nature.
There is also a hidden feature of the statistics that biases these 95th percentile fees upwards. Taking a point-of-time snapshot, as we have here, shows the fees incurred in a particular year. Expensive establishment fees for more complex assets, including directly held property, will probably only be incurred in one year, but will show as a 95th percentile fee for that year. An analysis for the subsequent year will also show similar expensive Investment fees at the 95th percentile, but they will be for a different group of SMSFs.
Whilst it is reasonable to take the 5th Percentile and Median fees as indicative of regular annual costs incurred by SMSFs, it is not sound to take the 95th Percentile fees as indicative of regular annual costs.

Cost of Operating SMSFS 2020 SMSF Association
Cost of Operating SMSFS 2020 SMSF Association
5. Costs for APRA regulated funds
In considering the fees charged by APRA regulated funds, we have relied on the Rice Warner Galaxy database of Product Disclosure Statements, APRA statistics and annual reports.We define superannuation fees to be the amounts charged to members for the costs of managing the fund. Several items are excluded, including:
— Taxes and insurance premiums.
— Fee subsidies made by employers and not charged to the fund.
— Fees for personal financial advice which are paid directly by members and not taken out of fund fees.
The fees included in our comparison include components for:
— Operating fees – these are typically called administration fees by the Industry. In the Retail sector, they often include platform fees, platforms being the portals set up for multiple investments and which provide consolidated reporting to a member and their adviser. They also include the costs of providing intra-fund advice.
— Investment management – this is the cost of investing and includes the costs of asset consultants and in-house investment teams.
These fees include provisions for Intra-fund Advice which is most of the advice provided to Industry fund members.
We have considered the fees for Industry funds, Retail personal superannuation products, Retail corporate master trusts and Retail post retirement (pension) products. For the Accumulation phase we have considered MySuper products. Choice products will generally be more expensive, but some Industry funds offer Member Direct Investment options that can be cheaper but are subject to special fees and conditions.
It is notable, in comparison to our 2013 report for ASIC, that the fees for Industry funds have risen and the fees for Retail funds have fallen so that today there is little to separate them. This was anticipated in our 2013 report.
The result of these changes is that, in aggregate, APRA regulated funds are more competitive in comparison with SMSFs for smaller accounts because the very high fees that were being charged by Retail funds have been removed.
Part of the reason for the fall in fees for Retail funds is that all allowances for commission have now been removed from the fees charged. The operators of Retail fund services have also worked to reduce their fees in the face of competition from Industry funds, but a significant component in the reduction in fees is a reduction in investment management fees due to the adoption of index investing and lifecycle funds.
Industry funds, on the other hand, have moved to higher service models including the provision of intra-fund advice and have adjusted their fees upwards in response.
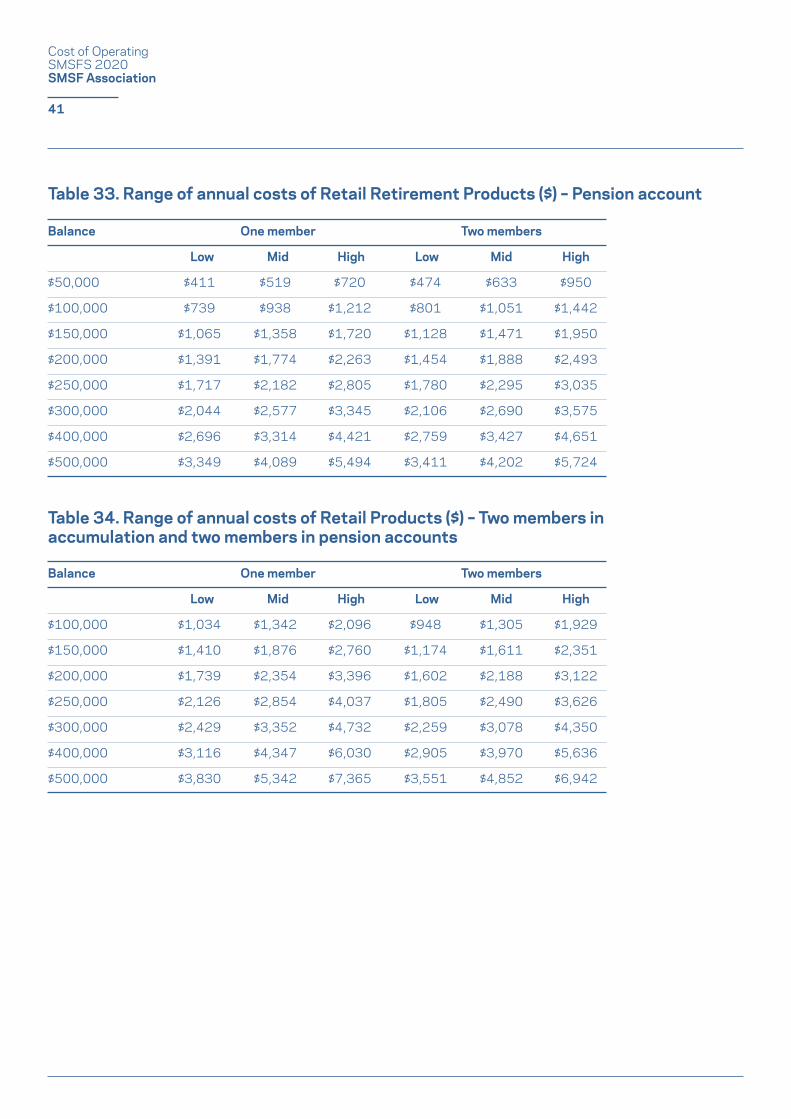
The range of annual fees of Industry and Retail funds by account balance is shown in Table 29 to Table 33. Fees are quoted based on the balance being held by either one or two members. This is to allow comparison with SMSFs which most frequently have two members and an average membership of 1.9.
With the advent of the $1.6 million pension transfer balance cap, it is now common for SMSF members drawing a pension to also have a taxable, accumulation account. Single member funds, therefore, can also have two accounts and funds with two members receiving pensions, can have four accounts. For this reason, Table 34 shows the costs of an arrangement that has four accounts, two accumulation and two pensions.
38

Cost of Operating SMSFS 2020 SMSF Association
Table 29 - Range of annual costs Industry fund ($) – Accumulation account
Table 30 - Range of annual costs Industry fund ($) – Pension account
Balance One member Two members
Low Mid High Low Mid High
$50,000 $442 $607 $804 $503 $685 $998
$100,000 $802 $1,138 $1,488 $863 $1,216 $1,682
$150,000 $1,155 $1,668 $2,164 $1,216 $1,746 $2,358
$200,000 $1,504 $2,198 $2,850 $1,566 $2,276 $3,044
$250,000 $1,880 $2,728 $3,530 $1,942 $2,806 $3,724
$300,000 $2,240 $3,240 $4,202 $2,301 $3,318 $4,396
$400,000 $2,951 $4,240 $5,537 $3,013 $4,318 $5,731
$500,000 $3,663 $5,240 $6,861 $3,725 $5,318 $7,055
Balance One member Two members
Low Mid High Low Mid High
$50,000 $465 $564 $865 $530 $658 $1,098
$100,000 $811 $1,044 $1,481 $876 $1,138 $1,714
$150,000 $1,148 $1,512 $2,142 $1,213 $1,606 $2,375
$200,000 $1,486 $1,977 $2,753 $1,551 $2,071 $2,986
$250,000 $1,823 $2,442 $3,408 $1,888 $2,536 $3,641
$300,000 $2,161 $2,907 $4,063 $2,226 $3,001 $4,295
$400,000 $2,823 $3,796 $5,381 $2,887 $3,890 $5,613
$500,000 $3,484 $4,706 $6,698 $3,549 $4,800 $6,931
39

Cost of Operating SMSFS 2020 SMSF Association
Table 31 - Range of annual costs of Retail Master Trusts ($) – Accumulation account
Table 32 - Range of annual costs of Retail Personal Super ($) – Accumulation account
Balance One member Two members
Low Mid High Low Mid High
$50,000 $445 $573 $850 $501 $660 $1,012
$100,000 $786 $1,054 $1,595 $842 $1,142 $1,757
$150,000 $1,137 $1,537 $2,349 $1,192 $1,624 $2,511
$200,000 $1,471 $2,019 $3,103 $1,526 $2,107 $3,265
$250,000 $1,805 $2,502 $3,857 $1,860 $2,589 $4,019
$300,000 $2,139 $2,984 $4,594 $2,195 $3,072 $4,756
$400,000 $2,736 $3,949 $5,945 $2,792 $4,037 $6,107
$500,000 $3,386 $4,899 $7,296 $3,442 $4,986 $7,458
Balance One member Two members
Low Mid High Low Mid High
$50,000 $403 $572 $729 $462 $654 $872
$100,000 $706 $1,033 $1,379 $764 $1,116 $1,522
$150,000 $1,008 $1,486 $2,057 $1,067 $1,568 $2,200
$200,000 $1,311 $1,938 $2,790 $1,369 $2,021 $2,933
$250,000 $1,613 $2,391 $3,565 $1,672 $2,473 $3,708
$300,000 $1,916 $2,844 $4,161 $1,974 $2,927 $4,304
$400,000 $2,521 $3,725 $5,344 $2,579 $3,807 $5,487
$500,000 $3,105 $4,575 $6,602 $3,163 $4,657 $6,746
40
Cost of Operating SMSFS 2020 SMSF Association
Table 33. Range of annual costs of Retail Retirement Products ($) – Pension account
Table 34. Range of annual costs of Retail Products ($) – Two members in accumulation and two members in pension accounts
Balance One member Two members
Low Mid High Low Mid High
$50,000 $411 $519 $720 $474 $633 $950
$100,000 $739 $938 $1,212 $801 $1,051 $1,442
$150,000 $1,065 $1,358 $1,720 $1,128 $1,471 $1,950
$200,000 $1,391 $1,774 $2,263 $1,454 $1,888 $2,493
$250,000 $1,717 $2,182 $2,805 $1,780 $2,295 $3,035
$300,000 $2,044 $2,577 $3,345 $2,106 $2,690 $3,575
$400,000 $2,696 $3,314 $4,421 $2,759 $3,427 $4,651
$500,000 $3,349 $4,089 $5,494 $3,411 $4,202 $5,724
Balance One member Two members
Low Mid High Low Mid High
$100,000 $1,034 $1,342 $2,096 $948 $1,305 $1,929
$150,000 $1,410 $1,876 $2,760 $1,174 $1,611 $2,351
$200,000 $1,739 $2,354 $3,396 $1,602 $2,188 $3,122
$250,000 $2,126 $2,854 $4,037 $1,805 $2,490 $3,626
$300,000 $2,429 $3,352 $4,732 $2,259 $3,078 $4,350
$400,000 $3,116 $4,347 $6,030 $2,905 $3,970 $5,636
$500,000 $3,830 $5,342 $7,365 $3,551 $4,852 $6,942
41

Cost of Operating SMSFS 2020 SMSF Association
Cost of Operating SMSFS 2020 SMSF Association
6. Analysis and commentary
As there is a range of costs for all fund types, the costs for each type overlap with the costs of the others. It is therefore not possible to fix on a specific set of costs and say that one product is cheaper than another for some specified balance. We therefore present the range of costs for SMSFs of various size balance and indicate whether the fee is:— Above the range of fees for equivalent balances held in
Industry or Retail funds – i.e. that it is above the High fee for that account balance.
— Within the range of fees for equivalent balances held in Industry or Retail funds – i.e. that it is between the Low and High fee for that account balance.
— Below the range of fees for equivalent balances held in Industry or Retail funds – i.e. that it is below the Low fee for that account balance.
We present comparisons for SMSFs that outsource only their compliance administration and for those that outsource all their administration.
We then comment on these comparisons.
43
6.1 Accumulation accounts
Table 35 provides the comparison of the costs of operating an SMSF that has only accumulation benefits with the comparable costs in Industry and Retail funds. Table 36 shows the costs within Industry and Retail funds should the relevant account balance be held by one member and Table 37 shows the equivalent costs should the account balance be held by two members.
The colour coding of the cells indicates whether the SMSF costs lie above, within or below the range of the costs for Industry and Retail funds..

Cost of Operating SMSFS 2020 SMSF Association
Table 35 - Comparison of annual costs of SMSFs ($) - Accumulation accounts
Balance SMSF Compliance Admin SMSF Full Admin
Low Mid High Low Mid High
$50,000 $1,189 $1,689 $2,453 $1,514 $2,134 $3,074
$100,000 $1,190 $1,690 $2,454 $1,515 $2,135 $3,075
$150,000 $1,191 $1,691 $2,455 $1,516 $2,136 $3,076
$200,000 $1,193 $1,693 $2,457 $1,518 $2,138 $3,078
$250,000 $1,194 $1,694 $2,458 $1,519 $2,139 $3,079
$300,000 $1,196 $1,696 $2,460 $1,521 $2,141 $3,081
$400,000 $1,199 $1,699 $2,463 $1,524 $2,144 $3,084
$500,000 $1,203 $1,703 $2,467 $1,528 $2,148 $3,088
SMSF Fee above range for Retail and Industry funds
SMSF Fee within range for Retail and Industry funds
SMSF Fee below range for Retail and Industry funds
Table 36 - Cost of APRA regulated funds ($) – Accumulation accounts (Single member)
Balance Industry Master Trusts
Low Mid High Low Mid High
$50,000 $442 $607 $804 $420 $573 $794
$100,000 $802 $1,138 $1,488 $746 $1,038 $1,495
$150,000 $1,155 $1,668 $2,164 $1,077 $1,508 $2,215
$200,000 $1,504 $2,198 $2,850 $1,397 $1,983 $2,959
$250,000 $1,880 $2,728 $3,530 $1,717 $2,458 $3,722
$300,000 $2,240 $3,240 $4,202 $2,036 $2,933 $4,394
$400,000 $2,951 $4,240 $5,537 $2,659 $3,834 $5,668
$500,000 $3,663 $5,240 $6,861 $3,273 $4,722 $6,976
44

Cost of Operating SMSFS 2020 SMSF Association
Table 37 - Cost of APRA regulated funds ($)– Accumulation Accounts (Two members)
Balance Industry Master Trusts
Low Mid High Low Mid High
$50,000 $503 $685 $998 $474 $672 $979
$100,000 $863 $1,216 $1,682 $800 $1,137 $1,680
$150,000 $1,216 $1,746 $2,358 $1,132 $1,607 $2,399
$200,000 $1,566 $2,276 $3,044 $1,451 $2,082 $3,144
$250,000 $1,942 $2,806 $3,724 $1,771 $2,557 $3,907
$300,000 $2,301 $3,318 $4,396 $2,090 $3,032 $4,579
$400,000 $3,013 $4,318 $5,731 $2,713 $3,933 $5,853
$500,000 $3,725 $5,318 $7,055 $3,327 $4,821 $7,161
45

Cost of Operating SMSFS 2020 SMSF Association
6.2 Pension accounts
Table 38 provides a comparison of the costs of operating an SMSF that has pension benefits with the comparable costs in Industry and Retail funds of pension accounts shown in Table 39 and Table 40.
Table 38 - Comparison of annual costs of SMSFs ($) - Pension Accounts
SMSF Fee above range for Retail and Industry funds
SMSF Fee within range for Retail and Industry funds
SMSF Fee below range for Retail and Industry funds
Balance SMSF Compliance Admin SMSF Full Admin
Low Mid High Low Mid High
$50,000 $1,299 $1,865 $2,738 $1,624 $2,310 $3,359
$100,000 $1,300 $1,866 $2,739 $1,625 $2,311 $3,360
$150,000 $1,301 $1,867 $2,740 $1,626 $2,312 $3,361
$200,000 $1,303 $1,869 $2,742 $1,628 $2,314 $3,363
$250,000 $1,304 $1,870 $2,743 $1,629 $2,315 $3,364
$300,000 $1,306 $1,872 $2,745 $1,631 $2,317 $3,366
$400,000 $1,309 $1,875 $2,748 $1,634 $2,320 $3,369
$500,000 $1,313 $1,879 $2,752 $1,638 $2,324 $3,373
Table 39 - Cost of APRA regulated funds ($) – Pension accounts (Single member)
Balance Industry Master Trusts
Low Mid High Low Mid High
$50,000 $465 $564 $865 $411 $519 $720
$100,000 $811 $1,044 $1,481 $739 $938 $1,212
$150,000 $1,148 $1,512 $2,142 $1,065 $1,358 $1,720
$200,000 $1,486 $1,977 $2,753 $1,391 $1,774 $2,263
$250,000 $1,823 $2,442 $3,408 $1,717 $2,182 $2,805
$300,000 $2,161 $2,907 $4,063 $2,044 $2,577 $3,345
$400,000 $2,823 $3,796 $5,381 $2,696 $3,314 $4,421
$500,000 $3,484 $4,706 $6,698 $3,349 $4,089 $5,494
46

Cost of Operating SMSFS 2020 SMSF Association
Table 40 - Cost of APRA regulated funds ($) – Pension accounts (Two members)
Table 41 - Range of annual costs of Retail Products ($) – Two members in accumulation and two members in pension accounts
Note: The range of balances starts at $100,000 as this is the combination of two pairs of accounts at the lowest level of $50,000 in Table 37 and Table 40.
Balance Industry Master Trusts
Low Mid High Low Mid High
$50,000 $530 $658 $1,098 $474 $633 $950
$100,000 $876 $1,138 $1,714 $801 $1,051 $1,442
$150,000 $1,213 $1,606 $2,375 $1,128 $1,471 $1,950
$200,000 $1,551 $2,071 $2,986 $1,454 $1,888 $2,493
$250,000 $1,888 $2,536 $3,641 $1,780 $2,295 $3,035
$300,000 $2,226 $3,001 $4,295 $2,106 $2,690 $3,575
$400,000 $2,887 $3,890 $5,613 $2,759 $3,427 $4,651
$500,000 $3,549 $4,800 $6,931 $3,411 $4,202 $5,724
Balance Industry Master Trusts
Low Mid High Low Mid High
$100,000 $1,034 $1,342 $2,096 $948 $1,305 $1,929
$150,000 $1,410 $1,876 $2,760 $1,174 $1,611 $2,351
$200,000 $1,739 $2,354 $3,396 $1,602 $2,188 $3,122
$250,000 $2,126 $2,854 $4,037 $1,805 $2,490 $3,626
$300,000 $2,429 $3,352 $4,732 $2,259 $3,078 $4,350
$400,000 $3,116 $4,347 $6,030 $2,905 $3,970 $5,636
$500,000 $3,830 $5,342 $7,365 $3,551 $4,852 $6,942
47

Cost of Operating SMSFS 2020 SMSF Association
6.3 Actual expenses of SMSFs
The analyses in Section 4 (Actual expenses of SMSFs) provided the range of fees incurred by the sample of funds in the 2019 Financial Year. In Table 42 and Table 43, these actually incurred expenses are compared to the fees for APRA regulated funds and ranked as to whether they are cheaper, equivalent or more expensive.
Whilst it is reasonable to take the 5th Percentile and Median fees as indicative of regular annual costs incurred by SMSFs, it is not sound to take the 95th Percentile fees as indicative of regular annual costs.
The SMSF fees include the cost of Advice. The fees for APRA regulated funds to which they are being compared do not.
Table 42 - 2019 Total fees incurred by SMSFs with and without direct property
SMSF Fee above range for Retail and Industry funds
SMSF Fee within range for Retail and Industry funds
SMSF Fee below range for Retail and Industry funds
All Funds Funds with no direct property Funds with direct property
Percentile 5th 50th 95th 5th 50th 95th 5th 50th 95th
Balance
$50,000 532 2,002 6,478 532 1,958 5,755 1,068 9,352 23,020
$100,000 607 2,298 13,098 592 2,220 6,337 863 9,003 29,007
$150,000 679 2,600 15,881 611 2,402 7,747 1,302 9,683 24,758
$200,000 848 2,898 17,638 684 2,603 9,002 1,414 10,398 25,204
$250,000 890 2,959 18,548 741 2,720 10,170 1,362 10,198 25,426
$300,000 971 3,140 20,002 785 2,861 11,290 1,487 10,044 27,878
$400,000 1,082 3,235 20,428 902 3,034 13,387 1,538 9,887 27,615
$500,000 1,183 3,339 22,468 1,029 3,207 15,908 1,480 9,969 29,799
48

Cost of Operating SMSFS 2020 SMSF Association
Table 43 - 2019 Total fees incurred by SMSFs with and without pension accounts
SMSF Fee above range for Retail and Industry funds
SMSF Fee within range for Retail and Industry funds
SMSF Fee below range for Retail and Industry funds
Funds with pensions & accumulation Funds with only pensions Funds with only accumulation
Percentile 5th 50th 95th 5th 50th 95th 5th 50th 95th
Balance
$50,000 N/A N/A N/A 613 2,177 5,923 532 1,936 6,542
$100,000 772 2,960 8,950 540 2,447 7,921 608 2,250 13,289
$150,000 862 2,785 9,137 672 2,373 8,012 677 2,611 16,307
$200,000 1,082 2,850 12,171 704 2,601 9,649 848 2,919 18,098
$250,000 987 3,137 13,347 830 2,908 10,809 891 2,959 18,933
$300,000 796 3,194 17,257 1,236 2,939 12,439 913 3,182 20,732
$400,000 1,061 3,327 16,613 1,236 3,174 13,790 1,045 3,295 21,861
$500,000 1,116 3,472 19,808 1,367 3,230 16,661 1,139 3,502 24,642
6.4 Commentary
The reductions in fees for SMSFs and Retail Funds and the increase in fees for Industry Funds since our 2103 report have changed the relative competitiveness of SMSFs in comparison to the APRA regulated funds. It is also clear that fees considerably lower than those on pricing schedules are being charged to some SMSFs which means that they are competitive even at small sizes.
Comparing the fees of SMSF service providers and the fees of Industry and Retail Funds, we can observe the following:
— SMSFs with less than $100,000 are not competitive in comparison to APRA regulated funds:
— SMSFs with less than $50,000 are more expensive than all alternatives.
— Between $50,000 and $100,000 the cheapest SMSFs become cheaper than only the most expensive APRA regulated funds.
— SMSFs of this size would only be appropriate if they are expected to grow to a competitive size within a reasonable time. The analysis of these small funds over time, see Section 2.4 (Growth and termination of funds), shows that the majority of these funds do, in fact, grow.
— This assessment is consistent with our 2013 assessment.
— SMSFs with $100,000 to $150,000 are competitive with APRA regulated funds provided the Trustees use one of the cheaper service providers or undertake some of the administration themselves:
— The Low and Mid fees for SMSFs for Compliance Administration and for Full Administration are in the ranges of fees for APRA regulated funds. It would therefore be possible for members with balances of these sizes to obtain a modest reduction in costs by moving to an SMSF provided the Trustees avoid the more expensive SMSF providers.
— This assessment is different from our 2013 assessment which found that only the cheapest Compliance Administration fees were lower than the most expensive Retail fund fees. Industry funds and, the then new, personal superannuation products were a cheaper alternative.
— SMSFs with $200,000 or more are competitive with both Industry and Retail funds even for full administration:
— The Low fees for SMSFs for Compliance Administration are lower than the fees for Industry and Retail funds.
— Members moving to SMSFs from Industry or Retail funds with balances at this level could obtain equivalent or cheaper fees.
49

Cost of Operating SMSFS 2020 SMSF Association
— This assessment is different from our 2013 assessment which found that SMSFs of this size were only competitive provided the Trustees carried out the broader investment administration functions because full administration fees were not competitive.
— For balances of $250,000 or more SMSFs become the cheapest alternative provided the Trustees undertake some of the administration, or, if seeking full administration, choose one of the cheaper services.
— SMSFs requiring full services:
— Can be competitive with APRA regulated funds provided they use a lower cost supplier and their balance is at least $150,000 of assets.
— Can be the cheapest alternative provided they use a lower cost supplier and their balance is at least $200,000 of assets.
— At sizes of $500,000 and above, SMSFs are generally the cheapest alternative:
— For SMSFs with only accumulation accounts, the fees at all levels are lower than the lowest fees of APRA regulated funds.
— For SMSFs with pension accounts, only the highest full administration fees exceed the lowest fees of APRA regulated funds.
— This assessment is different from our 2013 assessment which found that SMSFs of this size were only competitive (ie within the range of fees for APRA regulated funds), but not cheapest, on a full service basis and only cheapest if the Trustees undertook some or all of the administration functions.
— The comparisons for SMSFs paying pensions are very similar to those for accumulation funds.
— The comparisons for funds comprising two members are little different from the comparisons for funds comprising a single member. The extra per member fees for the APRA regulated funds are generally small in relation to the total fees charged.
— SMSFs with multiple members and a combination of accumulation and pension accounts are competitive from balances as low as $100,000 and can be the cheapest alternative from balances of $150,000 provided the Trustees undertake some or all the administration functions.
50
Comparing the actual costs paid by SMSFs and the fees of Industry and Retail Funds, we can observe the following:
— The Low fees being paid are cheaper than fee schedules indicate.
— These Low fees are cheaper than the APRA regulated alternatives for balances of $100,000 and above.
— Median fees for SMSFs without direct property are competitive for balances of $200,000 and above.
— Median and High fees for SMSFs with direct property are higher than the highest fees for APRA regulated funds for all balance sizes, but are in respect of investments that are not available through APRA regulated funds.
In summary:
— SMSFs with balances of $200,000 or more provide equivalent value to Industry and Retail funds at all levels of administration.
— SMSFs with balances of $500,000 or more are generally the cheapest alternative.
— The majority of SMSFs with low balances either grow to competitive size or are closed. Those that remain are generally remnant funds on low fees.

Cost of Operating SMSFS 2020 SMSF Association

Cost of Operating SMSFS 2020 SMSF Association
7. Other considerations
There are several other issues that could influence the com-parison of costs and there are issues beyond costs that should also be considered.7.1 Time and expertise
The commentary in Section 6.4 (Commentary) has highlight-ed the differences in costs facing those Trustees who carry out some of the administration functions and those who outsource them all to third party suppliers. The decision to take on or outsource these functions will generally depend on two factors:
— Whether the Trustee has the time to carry out the func-tions, or, whether their time is worth the extra cost of outsourcing; and
— Whether the Trustee feels they have the expertise to carry out the function.
These decisions will naturally be personal matters. The differences between the full service and limited service fees provide an indication of the opportunity cost that individual Trustees must consider when making their decision in this regard.
7.2 Guarantee
Members of APRA regulated funds enjoy a guarantee of their benefits which members of SMSFs do not. The collapse of Trio Capital in 2009 provides an example where members of APRA regulated funds who had invested in Trio investment vehicles were compensated, but SMSF Trustees who had in-vested in the same vehicles were not. Members contemplat-ing transfers to an SMSF must therefore determine whether the extra control and flexibility they will enjoy compensate for the lack of guarantee.
7.3 Fee subsidies
Members of corporate master trusts, corporate superan-nuation funds, public sector and some Industry funds may receive a subsidy from their employer for the fees incurred in respect to the provision of their superannuation. These subsidies were not considered in our analysis. The extent of fee subsidies would increase the minimum balance at which an SMSF would be a competitive alternative.
7.4 Asset allocations
As noted in Section 3.3 (Non-standard assets), funds that invest in non-standard assets will incur extra administration costs and these non-standard assets may also have high investment costs. Investment in these assets, for instance directly held property, is generally not possible in APRA regulated funds so a direct comparison is not possible. The return generated from these assets should compensate for the extra costs to justify their inclusion.
On the other hand, funds may confine their investments to simple assets like Term Deposits. These funds should be incurring fees at the low end of the ranges identified. Fees in the upper part of the ranges for funds with simple assets, would not be justified.
7.5 The age and growth prospects for the SMSF
This was a concern at the time of our 2013 report. Two issues were considered.
Firstly, the potential for small balance funds to stagnate and decline. The analysis presented in Section 2.4 (Growth and termination of funds) makes it clear that this is not a problem. The bulk of small funds either grow quickly or are closed. Those that persist as small funds pay low fees and appear to be remnant funds.
Secondly, at that time SMSFs enjoyed an advantage over APRA regulated funds of being able to move from accumu-lation phase to pension paying without incurring CGT. APRA regulated funds require the realisation of accumulation ac-count assets and their transfer to a pension account and this triggers the provisions for incurred, but unpaid CGT within the unit prices. There was therefore a financial incentive, which could outweigh operating cost disadvantages, for moving smaller balances to an SMSF.
This advantage for SMSFs has been partly removed because most APRA regulated funds now provide so-called pen-sion bonuses for transfers from accumulation accounts to pension accounts within the same fund. The bonus provides partial compensation for the CGT margin in the unit prices.
52

Cost of Operating SMSFS 2020 SMSF Association
7.6 Smaller balances at older ages
SMSFs in the post retirement drawdown phase can be expected to have reducing asset balances especially at older ages where the minimum drawdown required rises to 10% and later 14% of the balance. Some of these funds will undoubtedly reduce to below the economic levels indicated by the analysis at a time when their asset allocation is likely to be weighted to simple Cash and Fixed Interest products.
The size thresholds discussed in Section 6 (Analysis and commentary) are more significant for funds in the drawdown phase when compared to those in the accumulation phase. They will generally be getting even smaller from year to year whereas the funds in accumulation phase would generally be getting bigger. SMSFs in drawdown phase will therefore tend to become less competitive to APRA regulated funds over time.
This loss of competitiveness will be compounded by the ageing of the membership who will generally become less in-terested and able to manage their SMFS over time probably resulting in them seeking greater external assistance and needing to pay higher fees. At this stage, the complex and expensive compliance structures of an SMSF may well not be justifiable.
53


Cost of Operating SMSFS 2020 SMSF Association
Appendix A SMSF Expense analysis
The analysis presented in this Appendix is based on a sample of 100,506 SMSFs for the 2019 Financial Year. Table 44 details the overall expense levels for the sample in aggregate. Subsequent tables analyse the expenses for subsets of this data.
— Table 45: Shows expenses for funds without investments in direct property. This includes funds with accumulation accounts, pension accounts or both.
— Table 46: Shows expenses for funds with investments in direct property. This includes funds with accumulation accounts, pension accounts or both.
— Table 47: Shows expenses for funds with pension and accumulation accounts. This includes funds with and without direct property holdings.
— Table 48: Shows expenses for funds with only pension accounts. This includes funds with and without direct property holdings.
— Table 49: Shows expenses for funds with only accumula-tion accounts. This includes funds with and without direct property holdings.
Where Median (50th Percentile) fees are zero, it is because more than half the sample has a zero fee.
55
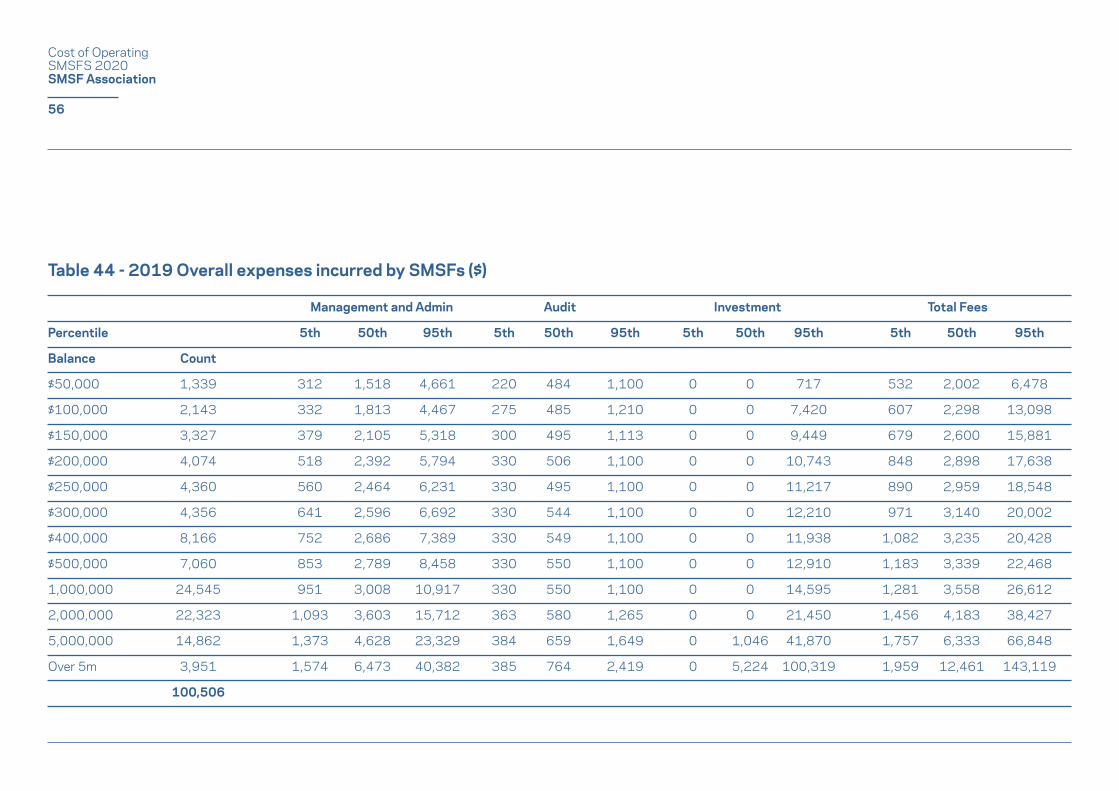
Cost of Operating SMSFS 2020 SMSF Association
Management and Admin Audit Investment Total Fees
Percentile 5th 50th 95th 5th 50th 95th 5th 50th 95th 5th 50th 95th
Balance Count
$50,000 1,339 312 1,518 4,661 220 484 1,100 0 0 717 532 2,002 6,478
$100,000 2,143 332 1,813 4,467 275 485 1,210 0 0 7,420 607 2,298 13,098
$150,000 3,327 379 2,105 5,318 300 495 1,113 0 0 9,449 679 2,600 15,881
$200,000 4,074 518 2,392 5,794 330 506 1,100 0 0 10,743 848 2,898 17,638
$250,000 4,360 560 2,464 6,231 330 495 1,100 0 0 11,217 890 2,959 18,548
$300,000 4,356 641 2,596 6,692 330 544 1,100 0 0 12,210 971 3,140 20,002
$400,000 8,166 752 2,686 7,389 330 549 1,100 0 0 11,938 1,082 3,235 20,428
$500,000 7,060 853 2,789 8,458 330 550 1,100 0 0 12,910 1,183 3,339 22,468
1,000,000 24,545 951 3,008 10,917 330 550 1,100 0 0 14,595 1,281 3,558 26,612
2,000,000 22,323 1,093 3,603 15,712 363 580 1,265 0 0 21,450 1,456 4,183 38,427
5,000,000 14,862 1,373 4,628 23,329 384 659 1,649 0 1,046 41,870 1,757 6,333 66,848
Over 5m 3,951 1,574 6,473 40,382 385 764 2,419 0 5,224 100,319 1,959 12,461 143,119
100,506
Table 44 - 2019 Overall expenses incurred by SMSFs ($)
56
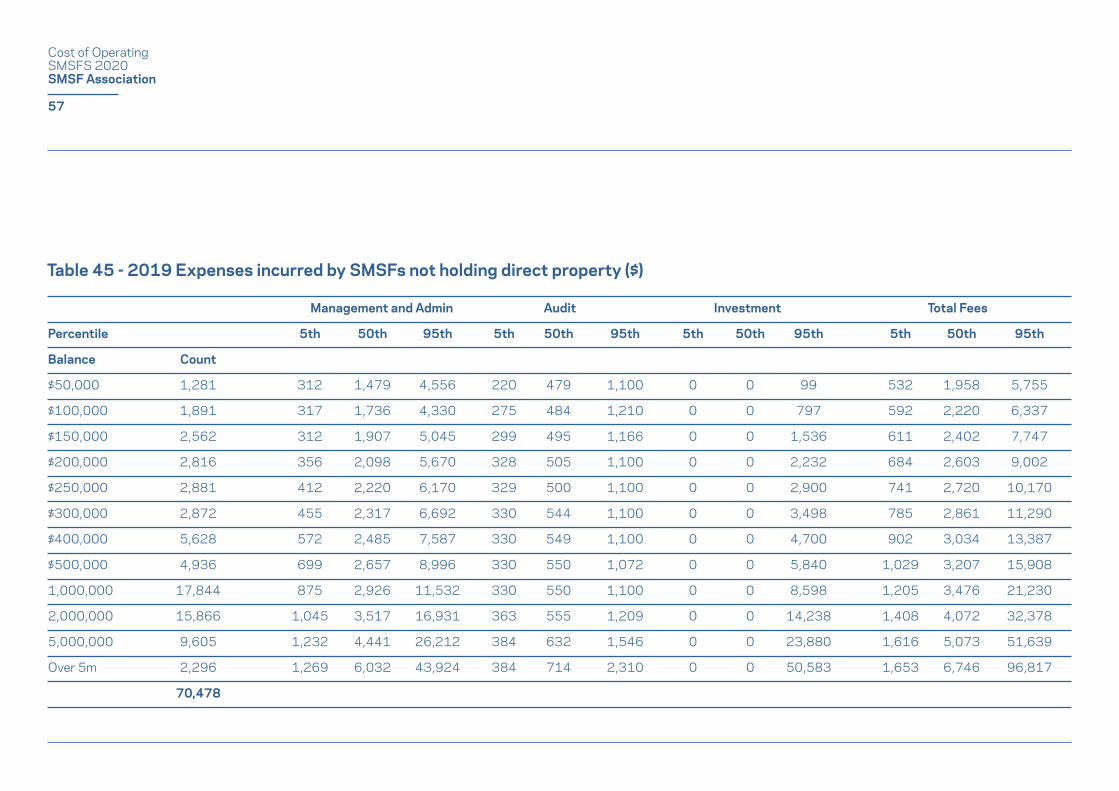
Cost of Operating SMSFS 2020 SMSF Association
Management and Admin Audit Investment Total Fees
Percentile 5th 50th 95th 5th 50th 95th 5th 50th 95th 5th 50th 95th
Balance Count
$50,000 1,281 312 1,479 4,556 220 479 1,100 0 0 99 532 1,958 5,755
$100,000 1,891 317 1,736 4,330 275 484 1,210 0 0 797 592 2,220 6,337
$150,000 2,562 312 1,907 5,045 299 495 1,166 0 0 1,536 611 2,402 7,747
$200,000 2,816 356 2,098 5,670 328 505 1,100 0 0 2,232 684 2,603 9,002
$250,000 2,881 412 2,220 6,170 329 500 1,100 0 0 2,900 741 2,720 10,170
$300,000 2,872 455 2,317 6,692 330 544 1,100 0 0 3,498 785 2,861 11,290
$400,000 5,628 572 2,485 7,587 330 549 1,100 0 0 4,700 902 3,034 13,387
$500,000 4,936 699 2,657 8,996 330 550 1,072 0 0 5,840 1,029 3,207 15,908
1,000,000 17,844 875 2,926 11,532 330 550 1,100 0 0 8,598 1,205 3,476 21,230
2,000,000 15,866 1,045 3,517 16,931 363 555 1,209 0 0 14,238 1,408 4,072 32,378
5,000,000 9,605 1,232 4,441 26,212 384 632 1,546 0 0 23,880 1,616 5,073 51,639
Over 5m 2,296 1,269 6,032 43,924 384 714 2,310 0 0 50,583 1,653 6,746 96,817
70,478
Table 45 - 2019 Expenses incurred by SMSFs not holding direct property ($)
57
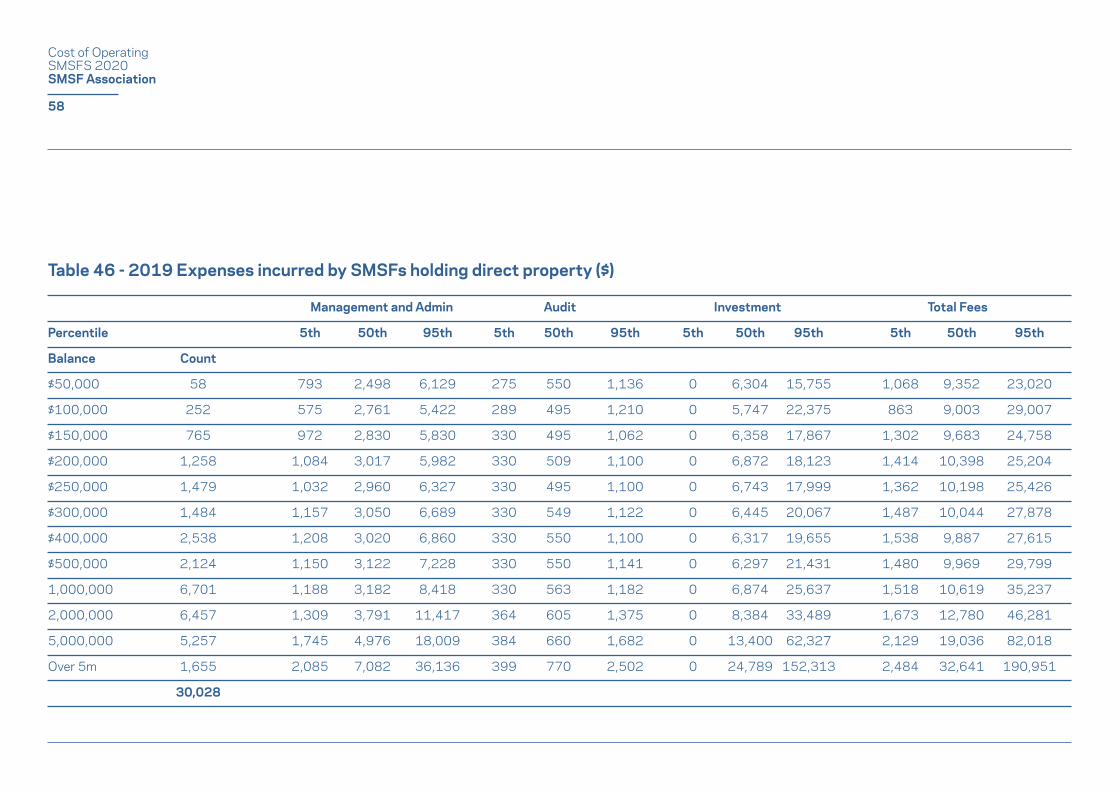
Cost of Operating SMSFS 2020 SMSF Association
Management and Admin Audit Investment Total Fees
Percentile 5th 50th 95th 5th 50th 95th 5th 50th 95th 5th 50th 95th
Balance Count
$50,000 58 793 2,498 6,129 275 550 1,136 0 6,304 15,755 1,068 9,352 23,020
$100,000 252 575 2,761 5,422 289 495 1,210 0 5,747 22,375 863 9,003 29,007
$150,000 765 972 2,830 5,830 330 495 1,062 0 6,358 17,867 1,302 9,683 24,758
$200,000 1,258 1,084 3,017 5,982 330 509 1,100 0 6,872 18,123 1,414 10,398 25,204
$250,000 1,479 1,032 2,960 6,327 330 495 1,100 0 6,743 17,999 1,362 10,198 25,426
$300,000 1,484 1,157 3,050 6,689 330 549 1,122 0 6,445 20,067 1,487 10,044 27,878
$400,000 2,538 1,208 3,020 6,860 330 550 1,100 0 6,317 19,655 1,538 9,887 27,615
$500,000 2,124 1,150 3,122 7,228 330 550 1,141 0 6,297 21,431 1,480 9,969 29,799
1,000,000 6,701 1,188 3,182 8,418 330 563 1,182 0 6,874 25,637 1,518 10,619 35,237
2,000,000 6,457 1,309 3,791 11,417 364 605 1,375 0 8,384 33,489 1,673 12,780 46,281
5,000,000 5,257 1,745 4,976 18,009 384 660 1,682 0 13,400 62,327 2,129 19,036 82,018
Over 5m 1,655 2,085 7,082 36,136 399 770 2,502 0 24,789 152,313 2,484 32,641 190,951
30,028
Table 46 - 2019 Expenses incurred by SMSFs holding direct property ($)
58
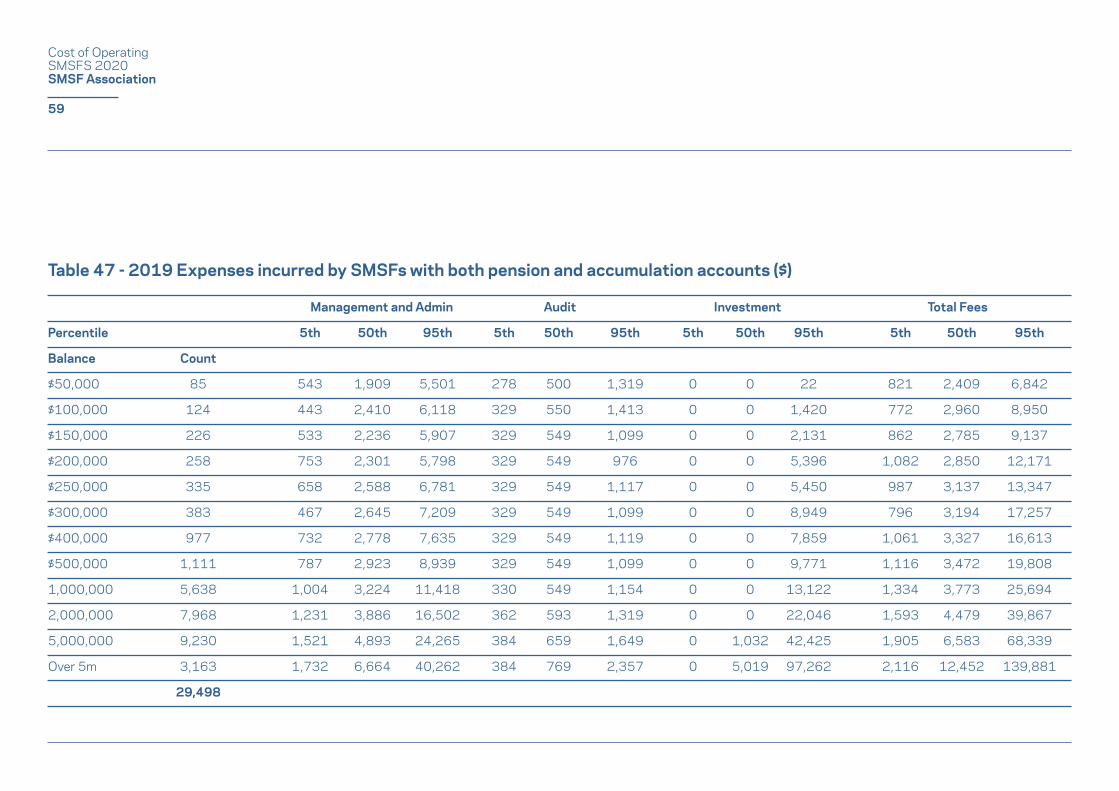
Cost of Operating SMSFS 2020 SMSF Association
Management and Admin Audit Investment Total Fees
Percentile 5th 50th 95th 5th 50th 95th 5th 50th 95th 5th 50th 95th
Balance Count
$50,000 85 543 1,909 5,501 278 500 1,319 0 0 22 821 2,409 6,842
$100,000 124 443 2,410 6,118 329 550 1,413 0 0 1,420 772 2,960 8,950
$150,000 226 533 2,236 5,907 329 549 1,099 0 0 2,131 862 2,785 9,137
$200,000 258 753 2,301 5,798 329 549 976 0 0 5,396 1,082 2,850 12,171
$250,000 335 658 2,588 6,781 329 549 1,117 0 0 5,450 987 3,137 13,347
$300,000 383 467 2,645 7,209 329 549 1,099 0 0 8,949 796 3,194 17,257
$400,000 977 732 2,778 7,635 329 549 1,119 0 0 7,859 1,061 3,327 16,613
$500,000 1,111 787 2,923 8,939 329 549 1,099 0 0 9,771 1,116 3,472 19,808
1,000,000 5,638 1,004 3,224 11,418 330 549 1,154 0 0 13,122 1,334 3,773 25,694
2,000,000 7,968 1,231 3,886 16,502 362 593 1,319 0 0 22,046 1,593 4,479 39,867
5,000,000 9,230 1,521 4,893 24,265 384 659 1,649 0 1,032 42,425 1,905 6,583 68,339
Over 5m 3,163 1,732 6,664 40,262 384 769 2,357 0 5,019 97,262 2,116 12,452 139,881
29,498
Table 47 - 2019 Expenses incurred by SMSFs with both pension and accumulation accounts ($)
59

Cost of Operating SMSFS 2020 SMSF Association
Management and Admin Audit Investment Total Fees
Percentile 5th 50th 95th 5th 50th 95th 5th 50th 95th 5th 50th 95th
Balance Count
$50,000 58 287 1,674 4,532 326 504 1,288 0 0 103 613 2,177 5,923
$100,000 140 265 1,952 4,692 275 495 1,320 0 0 1,908 540 2,447 7,921
$150,000 212 428 1,878 5,250 245 495 940 0 0 1,823 672 2,373 8,012
$200,000 340 374 2,082 5,737 330 520 966 0 0 2,946 704 2,601 9,649
$250,000 454 500 2,366 6,718 330 542 912 0 0 3,179 830 2,908 10,809
$300,000 557 906 2,417 7,258 330 522 914 0 0 4,268 1,236 2,939 12,439
$400,000 1,431 906 2,624 7,684 330 550 990 0 0 5,117 1,236 3,174 13,790
$500,000 1,514 1,037 2,697 9,293 330 533 942 0 0 6,426 1,367 3,230 16,661
1,000,000 7,013 1,045 2,914 11,506 330 550 1,017 0 0 10,204 1,375 3,464 22,727
2,000,000 7,187 1,098 3,394 15,355 373 555 1,116 0 0 17,770 1,471 3,949 34,241
5,000,000 2,173 1,073 4,100 19,582 375 605 1,320 0 25 31,780 1,447 4,730 52,681
Over 5m 9 4,664 9,960 63,329 416 989 2,741 0 0 16,293 5,079 10,949 82,363
21,088
Table 48 - 2019 Expenses incurred by SMSFs with only pension accounts ($)
60
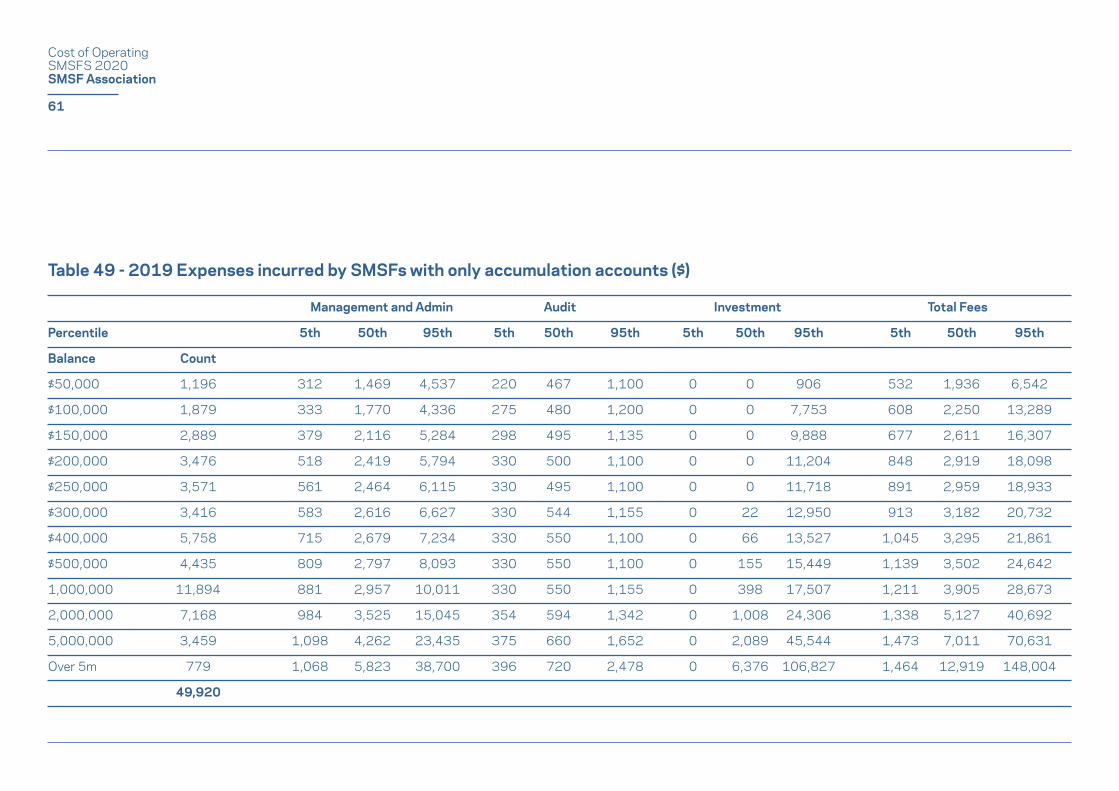
Cost of Operating SMSFS 2020 SMSF Association
Management and Admin Audit Investment Total Fees
Percentile 5th 50th 95th 5th 50th 95th 5th 50th 95th 5th 50th 95th
Balance Count
$50,000 1,196 312 1,469 4,537 220 467 1,100 0 0 906 532 1,936 6,542
$100,000 1,879 333 1,770 4,336 275 480 1,200 0 0 7,753 608 2,250 13,289
$150,000 2,889 379 2,116 5,284 298 495 1,135 0 0 9,888 677 2,611 16,307
$200,000 3,476 518 2,419 5,794 330 500 1,100 0 0 11,204 848 2,919 18,098
$250,000 3,571 561 2,464 6,115 330 495 1,100 0 0 11,718 891 2,959 18,933
$300,000 3,416 583 2,616 6,627 330 544 1,155 0 22 12,950 913 3,182 20,732
$400,000 5,758 715 2,679 7,234 330 550 1,100 0 66 13,527 1,045 3,295 21,861
$500,000 4,435 809 2,797 8,093 330 550 1,100 0 155 15,449 1,139 3,502 24,642
1,000,000 11,894 881 2,957 10,011 330 550 1,155 0 398 17,507 1,211 3,905 28,673
2,000,000 7,168 984 3,525 15,045 354 594 1,342 0 1,008 24,306 1,338 5,127 40,692
5,000,000 3,459 1,098 4,262 23,435 375 660 1,652 0 2,089 45,544 1,473 7,011 70,631
Over 5m 779 1,068 5,823 38,700 396 720 2,478 0 6,376 106,827 1,464 12,919 148,004
49,920
Table 49 - 2019 Expenses incurred by SMSFs with only accumulation accounts ($)
61