cost of capital study - washington · ch robinson 10.50 11.08 high average ups 11.02 11.0 high...
TRANSCRIPT

Washington State Department of Revenue
9.25%
CAPITAL ASSET PRICING MODEL PAGE
CAPM Ex Ante 8.93% 6
DIVIDEND GROWTH MODELS
Value Line, based on Dividends Growth 7.50% 7
Value Line, based on Earnings Growth 9.00% 8
Value Line, based on Return on Equity 11.50% 9
RANGE 7.5% - 11.5%
4.50% 10
4.25% 10
MARKET CAPITAL STRUCTURE Tax Shield
Equity 60% x 9.25% = 5.55% 3
Operating Leases 20% x 4.25% x 76.00% = 0.65% 3
Debt 20% x 4.50% x 76.00% = 0.68% 3
Marginal Tax Rate 24%
WEIGHTED AVERAGE COST OF CAPITAL 6.88%
COST OF SECURED DEBT (LEASE) RATE
DEBT RATE
COST OF CAPITAL STUDY
2019 ASSESSMENT YEAR
APPENDIX C
EQUITY RATE
YIELD CAPITALIZATION
FREIGHT AIRLINES
2019 AY Final Cost of Capital - Freight Airlines.xlsx04/16/2019
1

Washington State Department of Revenue
Company Ticker Beta Fin'l
Strength
Price
Stability
Growth
Persist
Earnings
Predict
P/E
Ratio
Div'd
YieldCommon Stock % Preferred Stock % Long Term Debt % Total Debt & Equity %
UPS UPS 0.95 A 100 80 75 13.0 4.00% 3,479,865,980 14.9% - 0.0% 19,931,000,000 85.1% 23,410,865,980 100.0%
Fed Ex FDX 1.20 A++ 80 65 60 10.1 1.61% 19,058,795,061 55.6% - 0.0% 15,243,000,000 44.4% 34,301,795,061 100.0%
Atlas Air AAWW 1.45 B+ 20 25 55 5.8 - 1,825,867,406 45.3% - 0.0% 2,205,000,000 54.7% 4,030,867,406 100.0%
CH Robinson CHRW 0.85 A 75 40 75 16.3 2.33% 1,574,425,300 54.0% - 0.0% 1,341,000,000 46.0% 2,915,425,300 100.0%
Expeditors Int'l EXPD 0.90 A+ 70 25 80 20.3 1.41% 2,183,264,461 100.0% - 0.0% 1,000,000 - 2,184,264,461 100.0%
Air Transport Services GroupATSG 1.15 B 20 55 20 - - 395,111,400 22.4% - 0.0% 1,371,598,000 77.6% 1,766,709,400 100.0%
Mean 1.08 B+ 61 48 61 13.1 2.34% 4,752,888,268 48.7% 0.0% 6,682,099,667 61.6%
Weighted Mean 28,517,329,608 41.6% - 0.00% 40,092,598,000 58.4% 68,609,927,608
Median 1.05 13.0 1.97% 49.7% 0.0% 54.7%
Harmonic Mean 1.05 1.99% 33.2% 0.0% 57.37%
Max 1.45 4.00% 100.0% 0.0% 85.1%
Min 0.85 1.41% 14.9% 0.0% 44.4%
Say 1.05 45% 0.0% 55% 100% 100%
Capital Structure at Book Value
WASHINGTON STATE DEPARTMENT OF REVENUE
FREIGHT AIRLINES
FREIGHT AIRLINES
2019 ASSESSMENT YEAR
2019 AY Final Cost of Capital - Freight Airlines.xlsx04/16/2019
2

Washington State Department of Revenue
Company Ticker Stock
Price
Common
Shares Common Stock % Preferred Stock % Operating Lease % Long Term Debt % Total Debt & Equity
UPS UPS 97.53 859,226,168 83,800,328,165 70.3% - 0.0% 11,764,309,028 9.9% 23,633,000,000 19.8% 119,197,637,193
Fed Ex FDX 161.33 261,043,625 42,114,168,021 47.6% - 0.0% 29,674,688,865 33.6% 16,600,000,000 18.8% 88,388,856,886
Atlas Air AAWW 42.19 25,590,293 1,079,654,462 19.9% - 0.0% 1,766,802,224 32.6% 2,565,443,000 47.4% 5,411,899,685
CH Robinson CHRW 84.09 137,504,393 11,562,744,407 85.5% - 0.0% 618,935,833 4.6% 1,341,352,000 9.9% 13,523,032,240
Expeditors Int'l EXPD 68.09 172,590,076 11,751,658,275 92.9% - 0.0% 900,230,646 7.1% - - 12,651,888,921
Air Transport Services Group ATSG 22.81 59,060,000 1,347,158,600 27.9% - 0.0% 2,080,972,974 43.1% 1,395,300,000 28.9% 4,823,431,574
Mean 57.4% 0.0% 21.8% 25.0%
Weighted Mean 151,655,711,930 62.2% - 0.00% 46,805,939,570 19.18% 45,535,095,000 18.7% 243,996,746,500
Median 59.0% 0.00% 21.26% 19.8%
Harmonic Mean 41.8% 11.0% 19.2%
Max 92.9% 0.0% 43.1% 47.4%
Min 19.9% 0.0% 4.6% 9.9%
Source: Target 60% 0% 20% 20% 100%
Stock Price: Yahoo
Market Value Debt: Bond Analysis
Capital Structure at Market Value
SUPPORT FOR CAPITAL STRUCTUREMARKET VALUE
2019 ASSESSMENT YEAR
FREIGHT AIRLINES
WASHINGTON STATE DEPARTMENT OF REVENUE
2019 AY Final Cost of Capital - Freight Airlines.xlsx04/16/2019
3

Washington State Department of Revenue
Company Ticker Stock
Price Revenues Multiple
Cash
Flow Multiple Earnings Multiple
Book
Value Multiple
UPS UPS 97.53 83.55 1.2 9.89 9.9 7.24 13.5 4.05 24.1
Fed Ex FDX 161.33 246.12 0.7 27.32 5.9 15.31 10.5 73.01 2.2
Atlas Air AAWW 42.19 104.70 0.4 15.70 2.7 7.15 NMF 71.35 0.59
CH Robinson CHRW 84.09 119.65 0.7 5.45 15.4 4.73 17.8 11.45 7.34
Expeditors Int'l EXPD 68.09 47.05 1.4 3.75 18.2 3.25 21.0 12.65 5.38
Air Transport Services GroupATSG 22.81 18.09 1.26 3.32 6.9 0.36 63.4 6.69 3.4
Mean 0.9 9.8 25.2 7.2
Median 0.9 8.4 17.8 4.4
Harmonic Mean 0.8 6.6 17.3 2.1
Max 1.4 18.2 63.4 24.1
Min 0.40 2.7 10.5 0.59
Std Dev 0.41 5.93 21.69 8.62
Coefficient of Variation 0.44 0.60 0.86 1.20
Percentile .25 0.7 6.1 13.5 2.5
Percentile .75 1.2 14.0 21.0 6.9
Say 1.0 11.0 18.0 NMF
SUPPORT FOR MARKET MULTIPLESWASHINGTON STATE DEPARTMENT OF REVENUE
2019 ASSESSMENT YEAR
FREIGHT AIRLINES
2019 AY Final Cost of Capital - Freight Airlines.xlsx04/16/2019
4
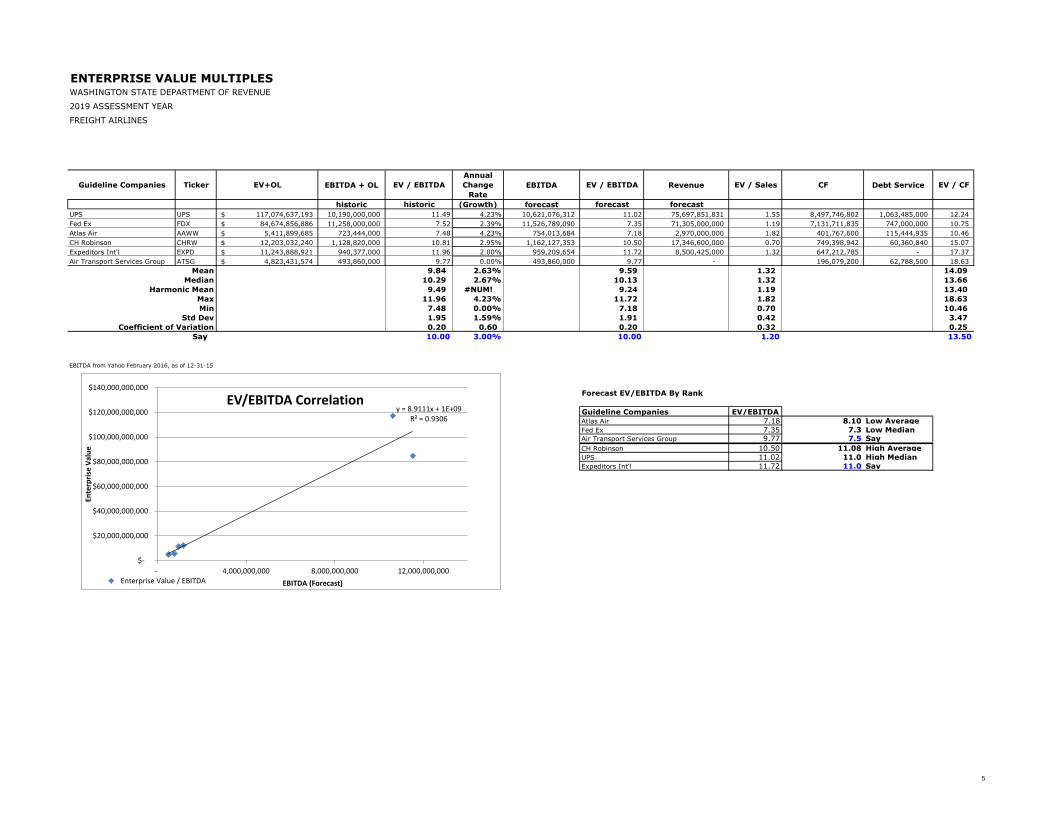
Guideline Companies Ticker EV+OL EBITDA + OL EV / EBITDA
Annual
Change
Rate
EBITDA EV / EBITDA Revenue EV / Sales CF Debt Service EV / CF
historic historic (Growth) forecast forecast forecast
UPS UPS 117,074,637,193$ 10,190,000,000 11.49 4.23% 10,621,076,312 11.02 75,697,851,831 1.55 8,497,746,802 1,063,485,000 12.24
Fed Ex FDX 84,674,856,886$ 11,258,000,000 7.52 2.39% 11,526,789,090 7.35 71,305,000,000 1.19 7,131,711,835 747,000,000 10.75
Atlas Air AAWW 5,411,899,685$ 723,444,000 7.48 4.23% 754,013,684 7.18 2,970,000,000 1.82 401,767,600 115,444,935 10.46
CH Robinson CHRW 12,203,032,240$ 1,128,820,000 10.81 2.95% 1,162,127,353 10.50 17,346,600,000 0.70 749,398,942 60,360,840 15.07
Expeditors Int'l EXPD 11,243,888,921$ 940,377,000 11.96 2.00% 959,209,654 11.72 8,500,425,000 1.32 647,212,785 - 17.37
Air Transport Services Group ATSG 4,823,431,574$ 493,860,000 9.77 0.00% 493,860,000 9.77 - 196,079,200 62,788,500 18.63
Mean 9.84 2.63% 9.59 1.32 14.09
Median 10.29 2.67% 10.13 1.32 13.66
Harmonic Mean 9.49 #NUM! 9.24 1.19 13.40
Max 11.96 4.23% 11.72 1.82 18.63
Min 7.48 0.00% 7.18 0.70 10.46
Std Dev 1.95 1.59% 1.91 0.42 3.47
Coefficient of Variation 0.20 0.60 0.20 0.32 0.25
Say 10.00 3.00% 10.00 1.20 13.50
EBITDA from Yahoo February 2016, as of 12-31-15
Forecast EV/EBITDA By Rank
Guideline Companies EV/EBITDA
Atlas Air 7.18 8.10 Low Average
Fed Ex 7.35 7.3 Low MedianAir Transport Services Group 9.77 7.5 Say
CH Robinson 10.50 11.08 High Average
UPS 11.02 11.0 High Median
Expeditors Int'l 11.72 11.0 Say
ENTERPRISE VALUE MULTIPLESWASHINGTON STATE DEPARTMENT OF REVENUE
2019 ASSESSMENT YEAR
FREIGHT AIRLINES
y = 8.9111x + 1E+09R² = 0.9306
$-
$20,000,000,000
$40,000,000,000
$60,000,000,000
$80,000,000,000
$100,000,000,000
$120,000,000,000
$140,000,000,000
- 4,000,000,000 8,000,000,000 12,000,000,000
Ente
rpri
se V
alu
e
EBITDA (Forecast)
EV/EBITDA Correlation
Enterprise Value / EBITDA
5
Washington State Department of Revenue
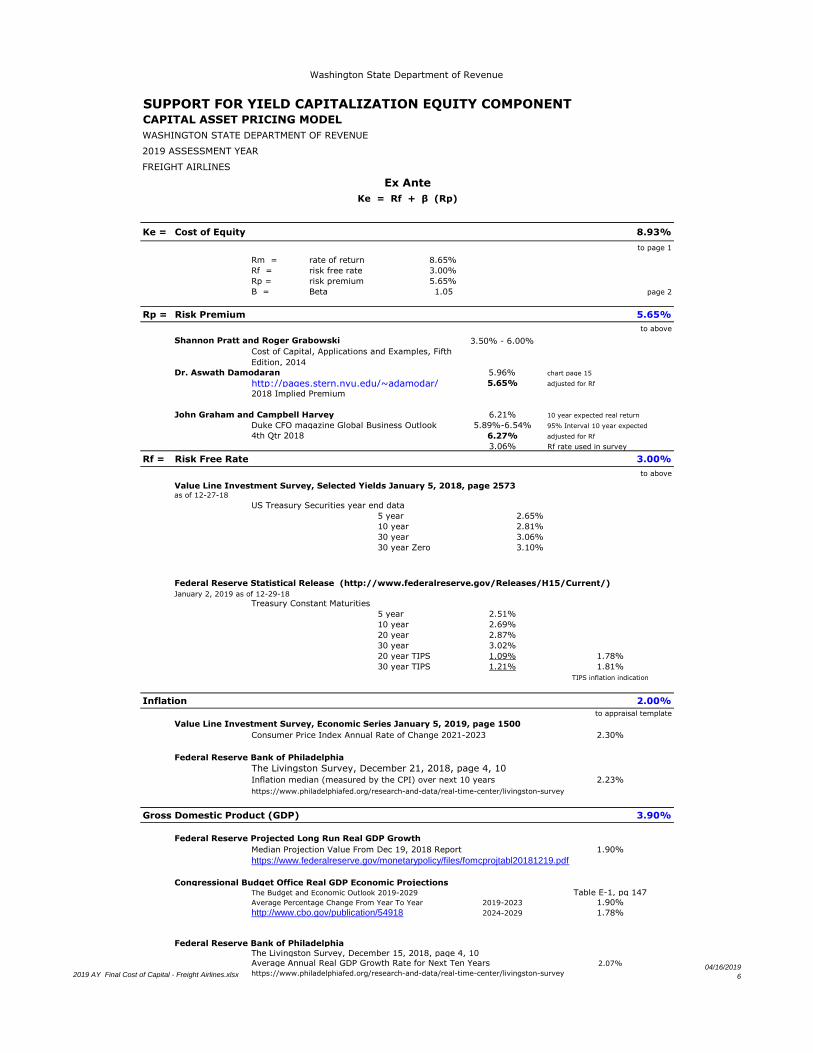
Ke = Cost of Equity 8.93%
to page 1
Rm = rate of return 8.65%
Rf = risk free rate 3.00%
Rp = risk premium 5.65%
B = Beta 1.05 page 2
Rp = Risk Premium 5.65%
to above
Shannon Pratt and Roger Grabowski 3.50% - 6.00%
Dr. Aswath Damodaran 5.96% chart page 15
5.65% adjusted for Rf
John Graham and Campbell Harvey 6.21% 10 year expected real return
5.89%-6.54% 95% Interval 10 year expected
4th Qtr 2018 6.27% adjusted for Rf
3.06% Rf rate used in survey
Rf = Risk Free Rate 3.00%
to above
Value Line Investment Survey, Selected Yields January 5, 2018, page 2573as of 12-27-18
US Treasury Securities year end data
5 year 2.65%
10 year 2.81%
30 year 3.06%
30 year Zero 3.10%
Federal Reserve Statistical Release (http://www.federalreserve.gov/Releases/H15/Current/)
January 2, 2019 as of 12-29-18
Treasury Constant Maturities
5 year 2.51%
10 year 2.69%
20 year 2.87%
30 year 3.02%
20 year TIPS 1.09% 1.78%
30 year TIPS 1.21% 1.81%
TIPS inflation indication
Inflation 2.00%
to appraisal template
Value Line Investment Survey, Economic Series January 5, 2019, page 1500
Consumer Price Index Annual Rate of Change 2021-2023 2.30%
Federal Reserve Bank of Philadelphia
The Livingston Survey, December 21, 2018, page 4, 10
Inflation median (measured by the CPI) over next 10 years 2.23%
https://www.philadelphiafed.org/research-and-data/real-time-center/livingston-survey
Gross Domestic Product (GDP) 3.90%
Federal Reserve Projected Long Run Real GDP Growth
Median Projection Value From Dec 19, 2018 Report 1.90%
Congressional Budget Office Real GDP Economic Projections
The Budget and Economic Outlook 2019-2029 Table E-1, pg 147
Average Percentage Change From Year To Year 2019-2023 1.90%
http://www.cbo.gov/publication/54918 2024-2029 1.78%
Federal Reserve Bank of Philadelphia
The Livingston Survey, December 15, 2018, page 4, 10
Average Annual Real GDP Growth Rate for Next Ten Years 2.07%
https://www.philadelphiafed.org/research-and-data/real-time-center/livingston-survey
https://www.federalreserve.gov/monetarypolicy/files/fomcprojtabl20181219.pdf
Ex Ante
SUPPORT FOR YIELD CAPITALIZATION EQUITY COMPONENTCAPITAL ASSET PRICING MODEL
FREIGHT AIRLINES
2019 ASSESSMENT YEAR
WASHINGTON STATE DEPARTMENT OF REVENUE
Duke CFO magazine Global Business Outlook
Ke = Rf + β (Rp)
2018 Implied Premium
http://pages.stern.nyu.edu/~adamodar/
Cost of Capital, Applications and Examples, Fifth
Edition, 2014
2019 AY Final Cost of Capital - Freight Airlines.xlsx04/16/2019
6

Washington State Department of Revenue
Ke = Cost of Equity
D1 = Expected Dividends
P0 = Current Stock Price
GD = Sustainable Growth -- Dividend
assumption:Sustainable growth can not exceed inflation plus real GDP
Company Ticker
Stock
Price
(Po)
Expected
Dividend
(D1)
Dividend
Yield
(D1/Po)
Dividend
Growth (G)Ke
Forecast
Dividend
Growth
Ke
Forecast
Growth
Sustainable
Dividend
Growth
Ke
Sustainable
Growth
Ke with
Multi Stage
Growth AdjUPS UPS 97.53 3.90 4.00% 7.14% 11.14% 3.80% 7.80% 3.80% 7.80% 8.39%
Fed Ex FDX 161.33 2.60 1.61% 30.00% 31.61% 4.99% 6.60% 3.90% 5.51% 9.49%
Atlas Air AAWW 42.19 0.00 0.00% 0.00%
CH Robinson CHRW 84.09 1.96 2.33% 4.26% 6.59% 4.94% 7.27% 3.90% 6.23% 7.87%
Expeditors Int'l EXPD 68.09 0.96 1.41% 6.67% 8.08% 3.30% 4.71% 3.30% 4.71% 5.46%
Air Transport Services Group ATSG 22.81 0.00 0.00% 0.00%
Mean 2.34% 14.35% 6.60% 6.06% 7.80%
Median 1.97% 9.61% 6.94% 5.87% 8.13%
Harmonic Mean 1.99% 10.07% 6.36% 5.86% 7.48%
Max 4.00% 31.61% 7.80% 7.80% 9.49%
Min 1.41% 6.59% 4.71% 4.71% 5.46%
Source: Value Line Projections 17-18 to 21-23
Say 7.50%
to page 1
Ke = (D1 / Po) + GD
SUPPORT FOR YIELD CAPITALIZATION EQUITY COMPONENT
WASHINGTON STATE DEPARTMENT OF REVENUE
2019 ASSESSMENT YEAR
Based on Dividend Growth
FREIGHT AIRLINES
DIVIDEND GROWTH MODEL
2019 AY Final Cost of Capital - Freight Airlines.xlsx04/16/2019
7
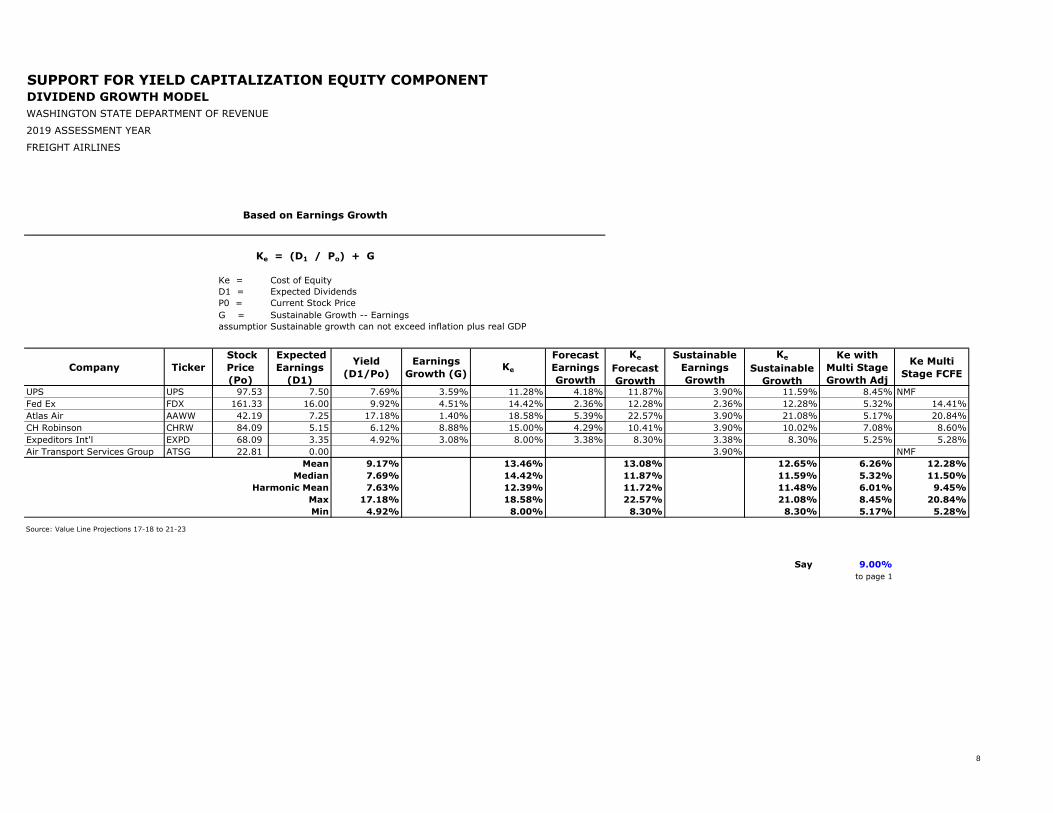
Ke = Cost of Equity
D1 = Expected Dividends
P0 = Current Stock Price
G = Sustainable Growth -- Earnings
assumption:Sustainable growth can not exceed inflation plus real GDP
Company Ticker
Stock
Price
(Po)
Expected
Earnings
(D1)
Yield
(D1/Po)
Earnings
Growth (G)Ke
Forecast
Earnings
Growth
Ke
Forecast
Growth
Sustainable
Earnings
Growth
Ke
Sustainable
Growth
Ke with
Multi Stage
Growth Adj
Ke Multi
Stage FCFE
UPS UPS 97.53 7.50 7.69% 3.59% 11.28% 4.18% 11.87% 3.90% 11.59% 8.45% NMF
Fed Ex FDX 161.33 16.00 9.92% 4.51% 14.42% 2.36% 12.28% 2.36% 12.28% 5.32% 14.41%
Atlas Air AAWW 42.19 7.25 17.18% 1.40% 18.58% 5.39% 22.57% 3.90% 21.08% 5.17% 20.84%
CH Robinson CHRW 84.09 5.15 6.12% 8.88% 15.00% 4.29% 10.41% 3.90% 10.02% 7.08% 8.60%
Expeditors Int'l EXPD 68.09 3.35 4.92% 3.08% 8.00% 3.38% 8.30% 3.38% 8.30% 5.25% 5.28%
Air Transport Services Group ATSG 22.81 0.00 3.90% NMF
Mean 9.17% 13.46% 13.08% 12.65% 6.26% 12.28%
Median 7.69% 14.42% 11.87% 11.59% 5.32% 11.50%
Harmonic Mean 7.63% 12.39% 11.72% 11.48% 6.01% 9.45%
Max 17.18% 18.58% 22.57% 21.08% 8.45% 20.84%
Min 4.92% 8.00% 8.30% 8.30% 5.17% 5.28%
Source: Value Line Projections 17-18 to 21-23
Say 9.00%
to page 1
Ke = (D1 / Po) + G
SUPPORT FOR YIELD CAPITALIZATION EQUITY COMPONENTDIVIDEND GROWTH MODEL
WASHINGTON STATE DEPARTMENT OF REVENUE
2019 ASSESSMENT YEAR
FREIGHT AIRLINES
Based on Earnings Growth
8

Washington State Department of Revenue
Ke = Cost of EquityD1 = Expected Dividends E1 = Expected EarningsPo = Current PriceG = Sustainable Growthb = Retained Earnings % = (EPS - DPS) / EPSROE = Return on Equity = (E1 / Po)
Company Ticker Stock Price
(Po)
Expected
Dividend
(D1)
Expected
Earnings
(E1)
Dividend
Yield
(D1/Po)
Retained
Earnings
(b)
ROE
(E1/Po)
Growth
(b*ROE)
Ke
Dividends
Ke
Earnings
UPS UPS 97.53 3.90 7.50 4.00% 48.0% 7.69% 3.69% 7.69% 11.38%
Fed Ex FDX 161.33 2.60 16.00 1.61% 83.8% 9.92% 8.31% 9.92% 18.22%
Atlas Air AAWW 42.19 0.00 7.25 100.0% 17.18% 17.18% 34.37%
CH Robinson CHRW 84.09 1.96 5.15 2.33% 61.9% 6.12% 3.79% 6.12% 9.92%
Expeditors Int'l EXPD 68.09 0.96 3.35 1.41% 71.3% 4.92% 3.51% 4.92% 8.43%
Air Transport Services GroupATSG 22.81 0.00 0.00 100.0% 0.00% 0.00%
Mean 7.16% 16.46%
Median 6.91% 11.38%
Harmonic Mean 6.70% 12.78%
Max 9.92% 34.37%
Min 4.92% 8.43%
Say 11.50%
to page 1
Based on Return on Equity
Ke = (D1 / Po) + G
SUPPORT FOR YIELD CAPITALIZATION EQUITY COMPONENT
FREIGHT AIRLINES
2019 ASSESSMENT YEAR
DIVIDEND GROWTH MODEL
WASHINGTON STATE DEPARTMENT OF REVENUE
2019 AY Final Cost of Capital - Freight Airlines.xlsx04/16/2019
9

Washington State Department of Revenue
Company TickerMergent's
RatingsS&P Ratings
UPS UPS A1 A+
Fed Ex FDX Baa2 BBB
Atlas Air AAWW - -
CH Robinson CHRW - -
Expeditors Int'l EXPD - -
Air Transport Services Group ATSG - -
Overall Average Debt Rating A2 A-
Corporate Aaa Aa A Baa
October 4.14% 4.28% 4.46% 5.07%
November4.22% 4.37% 4.53% 5.22%
December 4.02% 4.20% 4.37% 5.13%
4th Qtr Average 4.13% 4.28% 4.45% 5.14%
Public Utilities Aa A Baa
October 4.31% 4.45% 4.91%
November 4.40% 4.52% 5.03%
December 4.24% 4.37% 4.92%
4th Qtr Average 4.32% 4.45% 4.95%
Industrials Aaa Aa A BaaOctober 4.14% 4.24% 4.45% 5.22%November 4.22% 4.34% 4.53% 5.42%
December 4.02% 4.16% 4.36% 5.34%
4th Qtr Average 4.13% 4.25% 4.45% 5.33%
Debt Yield Rate 4.50%
Cost of Secured Debt (Lease) Based on 4th Quarter Aa rate 4.25%
to page 1
SUPPORT FOR DEBT RATING AND DEBT YIELD RATE
2019 ASSESSMENT YEAR
FREIGHT AIRLINES
Mergent's Bond Record January 2019, page 13
WASHINGTON STATE DEPARTMENT OF REVENUE
2019 AY Final Cost of Capital - Freight Airlines.xlsx04/16/2019
10

Washington State Department of Revenue
WASHINGTON STATE DEPARTMENT OF REVENUE
2019 ASSESSMENT YEAR
FREIGHT AIRLINES
Stock Price
12/31/2018
Beta
levered
Revenues
Per Share
Cash
Flow Per
Share
Earnings
Per Share
Dividends
Per Share
Bk Value
Per Share
Common
Shares
Trailing
P/E Ratio
Operating
Margin
Income
Tax Rate
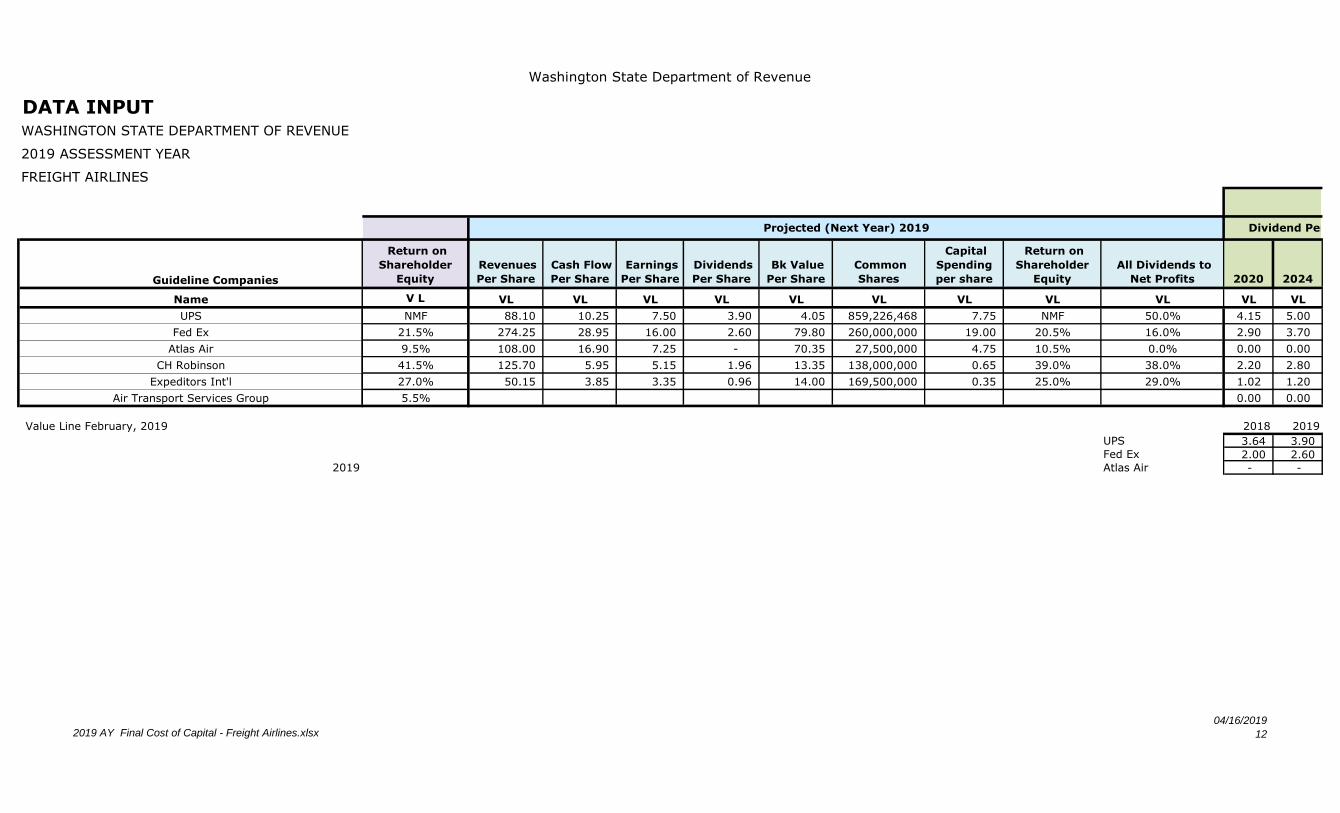
Name Ticker Yahoo VL VL VL VL VL VL VL VL VL VL
UPS UPS 97.53 0.95 83.55 9.89 7.24 3.64 4.05 859,226,168 15.3 13.3% 21.3%
Fed Ex FDX 161.33 1.20 246.12 27.32 15.31 2.00 73.01 261,043,625 10.8 13.5% 20.0%
Atlas Air AAWW 42.19 1.45 104.70 15.70 7.15 - 71.35 25,590,293 8.8 21.5% 15.0%
CH Robinson CHRW 84.09 0.85 119.65 5.45 4.73 1.88 11.45 137,504,393 19.2 6.1% 24.5%
Expeditors Int'l EXPD 68.09 0.90 47.05 3.75 3.25 0.90 12.65 172,590,076 23.0 12.2% 25.0%
Air Transport Services Group ATSG 22.81 1.15 18.09 3.32 0.36 - 6.69 59,060,000 - 38.8% 22.0%
Value Line February, 2019
2019
DATA INPUT
Guideline Companies
Historic Figures (2018)
2019 AY Final Cost of Capital - Freight Airlines.xlsx04/16/2019
11
Washington State Department of Revenue
WASHINGTON STATE DEPARTMENT OF REVENUE
2019 ASSESSMENT YEAR
FREIGHT AIRLINES
Name
UPS
Fed Ex
Atlas Air
CH Robinson
Expeditors Int'l
Air Transport Services Group
Value Line February, 2019
2019
DATA INPUT
Guideline Companies
Return on
Shareholder
Equity
Revenues
Per Share
Cash Flow
Per Share
Earnings
Per Share
Dividends
Per Share
Bk Value
Per Share
Common
Shares
Capital
Spending
per share
Return on
Shareholder
Equity
All Dividends to
Net Profits 2020 2024
V L VL VL VL VL VL VL VL VL VL VL VL
NMF 88.10 10.25 7.50 3.90 4.05 859,226,468 7.75 NMF 50.0% 4.15 5.00
21.5% 274.25 28.95 16.00 2.60 79.80 260,000,000 19.00 20.5% 16.0% 2.90 3.70
9.5% 108.00 16.90 7.25 - 70.35 27,500,000 4.75 10.5% 0.0% 0.00 0.00
41.5% 125.70 5.95 5.15 1.96 13.35 138,000,000 0.65 39.0% 38.0% 2.20 2.80
27.0% 50.15 3.85 3.35 0.96 14.00 169,500,000 0.35 25.0% 29.0% 1.02 1.20
5.5% 0.00 0.00
2018 2019
UPS 3.64 3.90
Fed Ex 2.00 2.60
Atlas Air - -
DATA INPUT
LONGER TERM FORCASTS
Historic Figures (2018) Projected (Next Year) 2019 Dividend Per Share
2019 AY Final Cost of Capital - Freight Airlines.xlsx04/16/2019
12

Washington State Department of Revenue
WASHINGTON STATE DEPARTMENT OF REVENUE
2019 ASSESSMENT YEAR
FREIGHT AIRLINES
Name
UPS
Fed Ex
Atlas Air
CH Robinson
Expeditors Int'l
Air Transport Services Group
Value Line February, 2019
2019
DATA INPUT
Guideline Companies
Income Statement
% Annual
change 2020 2024
% Annual
Change 2020 2024
% Annual
Change 2020 2024
%
Annual
Change
Return on
Shareholder
Equity Operating Income Current Assets
VL VL VL VL VL VL VL VL VL VL VL M* M*
3.80% 8.15 10.00 4.18% 11.10 13.40 3.84% 92.75 114.10 4.23% NMF 7,024,000,000 16,210,000,000
4.99% 17.80 20.00 2.36% 31.20 36.25 3.05% 290.70 327.10 2.39% 18.0% 5,250,000,000 13,341,000,000
0.00% 8.00 10.40 5.39% 19.10 26.60 6.85% 115.70 142.30 4.23% 12.5% 295,000,000 630,000,000
4.94% 5.35 6.60 4.29% 6.20 7.50 3.88% 131.95 152.60 2.95% 29.0% 912,000,000 2,753,000,000
3.30% 3.60 4.25 3.38% 4.15 4.90 3.38% 53.25 58.80 2.00% 21.5% 797,000,000 2,735,000,000
0.00% 0.00 0.00 0.00% 0.00 0.00 0.00% 0.00 0.00 0.00% 93,000,000 185,000,000
%Change 2018 2019 %Change 2018 2019 %Change 2018 2019 %Change
7.14% 7.24 7.50 3.59% 9.89 10.25 3.64% 83.55 88.10 5.45%
30.00% 15.31 16.00 4.51% 27.32 28.95 5.97% 246.12 274.25 11.43%
NMF 7.15 7.25 1.40% 15.70 16.90 7.64% 104.70 108.00 3.15%
LONGER TERM FORCASTS
Balance SheetDividend Per Share Earnings % Change Cash Flow % Change Revenue % Change
2019 AY Final Cost of Capital - Freight Airlines.xlsx04/16/2019
13

Washington State Department of Revenue
WASHINGTON STATE DEPARTMENT OF REVENUE
2019 ASSESSMENT YEAR
FREIGHT AIRLINES
Name
UPS
Fed Ex
Atlas Air
CH Robinson
Expeditors Int'l
Air Transport Services Group
Value Line February, 2019
2019
DATA INPUT
Guideline Companies
Cash Flow
Statement
PP & E Gross
Intangibles (excl.
GW)
Current Liabilities
Total
Long Term Debt
Less Current
Maturities
Depreciation &
Amortization
Carrying Value
Debt Fair Value Debt
Current Maturity
Long Term Debt
M* M* M* M*/10-K M* 10-K 10-K 10-K
54,488,000,000 2,076,000,000 14,087,000,000 19,931,000,000 2,207,000,000 22,736,000,000 23,633,000,000 2,805,000,000
55,121,000,000 480,000,000 9,627,000,000 15,243,000,000 3,095,000,000 16,510,000,000 16,600,000,000 1,342,000,000
5,323,000,000 57,000,000 818,000,000 2,205,000,000 266,000,000 2,568,840,000 2,565,443,000 264,835,000
499,000,000 143,000,000 1,433,000,000 1,341,000,000 97,000,000 1,346,352,000 1,341,352,000 5,000,000
951,000,000 - 1,327,000,000 1,000,000 54,000,000 - - -
2,004,000,000 45,000,000 229,134,000 1,371,598,000 155,000,000 1,401,300,000 1,395,300,000 29,654,000
Balance Sheet Other Financials
2019 AY Final Cost of Capital - Freight Airlines.xlsx04/16/2019
14

Washington State Department of Revenue
WASHINGTON STATE DEPARTMENT OF REVENUE
2019 ASSESSMENT YEAR
FREIGHT AIRLINES
Name
UPS
Fed Ex
Atlas Air
CH Robinson
Expeditors Int'l
Air Transport Services Group
Value Line February, 2019
2019
DATA INPUT
Guideline Companies
Aircraft Rental
Expense
10-K
959,000,000
2,913,000,000
162,444,000
119,820,000
89,377,000
245,860,000
Other Financials
2019 AY Final Cost of Capital - Freight Airlines.xlsx04/16/2019
15

2019 Multi Stage Dividend Growth Model for DGM-d7Freight Airline Industry
United Parcel Service
UPS Growth Payout Terminal
Year Rate Ratio Earnings Dividends Value
0 7.24 3.64 (97.53) price = 97.53
2019 1 7.14% 50.28% 7.76 3.90 3.90 104.50
2020 2 6.41% 50.28% 8.25 4.15 4.15 111.19
2021 3 3.80% 50.28% 8.57 4.31 4.31 115.42
2022 4 3.80% 50.28% 8.89 4.47 4.47 119.80
2023 5 3.80% 50.28% 9.23 4.64 4.64 124.35
2024 6 3.80% 50.00% 9.58 4.79 4.79 129.07
2025 7 3.82% 50.00% 9.95 4.97 4.97 134.00
2026 8 3.84% 50.00% 10.33 5.16 5.16 139.14
2027 9 3.86% 50.00% 10.73 5.36 5.36 144.51
2028 10 3.88% 50.00% 11.14 5.57 150.11 155.69 150.11
2029 11+ 3.90% 50.00% 11.58 5.79
Ke = 8.39%
source: Valueline
FedEx
FDX Growth Payout Terminal
Year Rate Ratio Earnings Dividends Value
0 15.31 2.00 (161.33) price = 161.33
2019 1 30.00% 13.06% 19.90 2.60 2.60 209.73
2020 2 11.54% 13.06% 22.20 2.90 2.90 233.93
2021 3 4.99% 13.06% 23.31 3.04 3.04 245.61
2022 4 4.99% 13.06% 24.47 3.20 3.20 257.87
2023 5 4.99% 13.06% 25.69 3.36 3.36 270.75
2024 6 4.99% 18.50% 26.98 4.99 4.99 284.27
2025 7 4.77% 18.50% 28.26 5.23 5.23 297.84
2026 8 4.56% 18.50% 29.55 5.47 5.47 311.41
2027 9 4.34% 18.50% 30.83 5.70 5.70 324.91
2028 10 4.12% 18.50% 32.10 5.94 338.30 344.24 338.30
2029 11+ 3.90% 18.50% 33.36 6.17
Ke = 9.49%
source: Valueline
CH Robinson
CHRW Growth Payout Terminal
Year Rate Ratio Earnings Dividends Value
0 4.73 1.88 (84.09) price = 84.09
2019 1 4.26% 39.75% 4.93 1.96 1.96 87.67
2020 2 12.24% 39.75% 5.54 2.20 2.20 98.40
2021 3 4.94% 39.75% 5.81 2.31 2.31 103.27
2022 4 4.94% 39.75% 6.10 2.42 2.42 108.37
2023 5 4.94% 39.75% 6.40 2.54 2.54 113.72
2024 6 4.94% 42.42% 6.71 2.85 2.85 119.34
2025 7 4.73% 42.42% 7.03 2.98 2.98 124.99
2026 8 4.52% 42.42% 7.35 3.12 3.12 130.65
2027 9 4.32% 42.42% 7.67 3.25 3.25 136.29
2028 10 4.11% 42.42% 7.98 3.39 141.89 145.27 141.89
2029 11+ 3.90% 42.42% 8.29 3.52
Ke = 7.87%
source: Valueline
Expeditors Int'l
EXPD Growth Payout Terminal
Year Rate Ratio Earnings Dividends Value
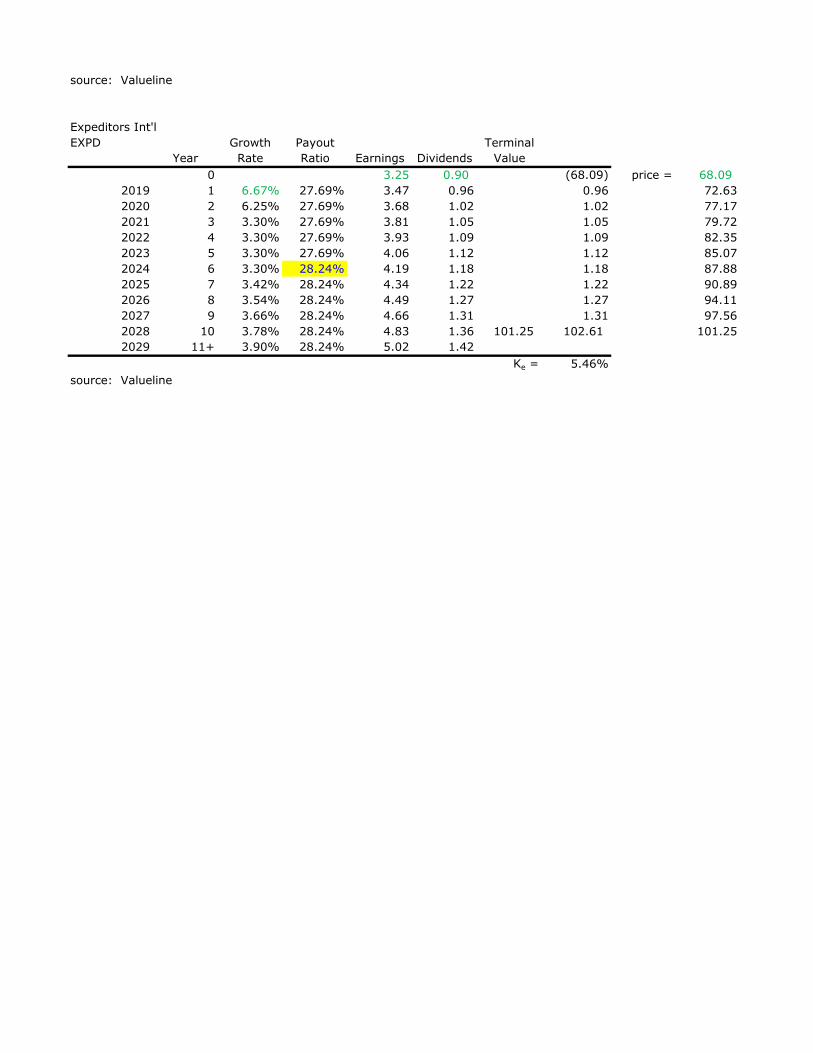
0 3.25 0.90 (68.09) price = 68.09
2019 1 6.67% 27.69% 3.47 0.96 0.96 72.63
2020 2 6.25% 27.69% 3.68 1.02 1.02 77.17
2021 3 3.30% 27.69% 3.81 1.05 1.05 79.72
2022 4 3.30% 27.69% 3.93 1.09 1.09 82.35
2023 5 3.30% 27.69% 4.06 1.12 1.12 85.07
2024 6 3.30% 28.24% 4.19 1.18 1.18 87.88
2025 7 3.42% 28.24% 4.34 1.22 1.22 90.89
2026 8 3.54% 28.24% 4.49 1.27 1.27 94.11
2027 9 3.66% 28.24% 4.66 1.31 1.31 97.56
2028 10 3.78% 28.24% 4.83 1.36 101.25 102.61 101.25
2029 11+ 3.90% 28.24% 5.02 1.42
Ke = 5.46%
source: Valueline
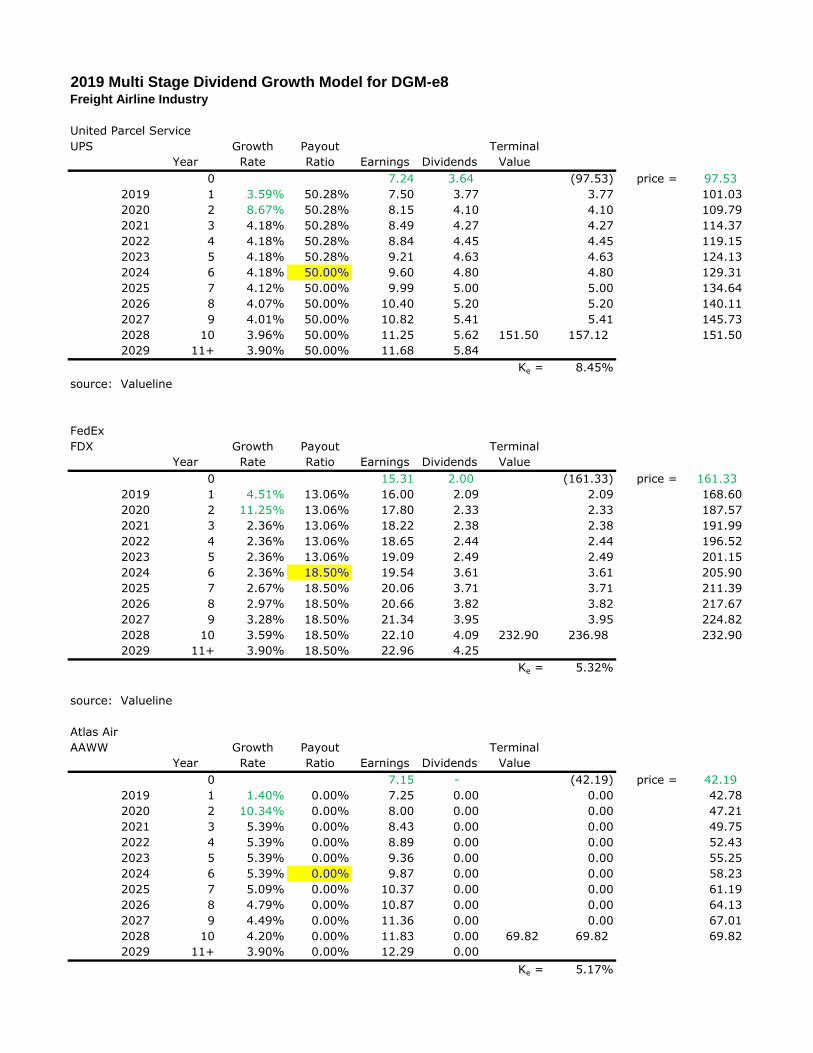
2019 Multi Stage Dividend Growth Model for DGM-e8Freight Airline Industry
United Parcel Service
UPS Growth Payout Terminal
Year Rate Ratio Earnings Dividends Value
0 7.24 3.64 (97.53) price = 97.53
2019 1 3.59% 50.28% 7.50 3.77 3.77 101.03
2020 2 8.67% 50.28% 8.15 4.10 4.10 109.79
2021 3 4.18% 50.28% 8.49 4.27 4.27 114.37
2022 4 4.18% 50.28% 8.84 4.45 4.45 119.15
2023 5 4.18% 50.28% 9.21 4.63 4.63 124.13
2024 6 4.18% 50.00% 9.60 4.80 4.80 129.31
2025 7 4.12% 50.00% 9.99 5.00 5.00 134.64
2026 8 4.07% 50.00% 10.40 5.20 5.20 140.11
2027 9 4.01% 50.00% 10.82 5.41 5.41 145.73
2028 10 3.96% 50.00% 11.25 5.62 151.50 157.12 151.50
2029 11+ 3.90% 50.00% 11.68 5.84
Ke = 8.45%
source: Valueline
FedEx
FDX Growth Payout Terminal
Year Rate Ratio Earnings Dividends Value
0 15.31 2.00 (161.33) price = 161.33
2019 1 4.51% 13.06% 16.00 2.09 2.09 168.60
2020 2 11.25% 13.06% 17.80 2.33 2.33 187.57
2021 3 2.36% 13.06% 18.22 2.38 2.38 191.99
2022 4 2.36% 13.06% 18.65 2.44 2.44 196.52
2023 5 2.36% 13.06% 19.09 2.49 2.49 201.15
2024 6 2.36% 18.50% 19.54 3.61 3.61 205.90
2025 7 2.67% 18.50% 20.06 3.71 3.71 211.39
2026 8 2.97% 18.50% 20.66 3.82 3.82 217.67
2027 9 3.28% 18.50% 21.34 3.95 3.95 224.82
2028 10 3.59% 18.50% 22.10 4.09 232.90 236.98 232.90
2029 11+ 3.90% 18.50% 22.96 4.25
Ke = 5.32%
source: Valueline
Atlas Air
AAWW Growth Payout Terminal
Year Rate Ratio Earnings Dividends Value
0 7.15 - (42.19) price = 42.19
2019 1 1.40% 0.00% 7.25 0.00 0.00 42.78
2020 2 10.34% 0.00% 8.00 0.00 0.00 47.21
2021 3 5.39% 0.00% 8.43 0.00 0.00 49.75
2022 4 5.39% 0.00% 8.89 0.00 0.00 52.43
2023 5 5.39% 0.00% 9.36 0.00 0.00 55.25
2024 6 5.39% 0.00% 9.87 0.00 0.00 58.23
2025 7 5.09% 0.00% 10.37 0.00 0.00 61.19
2026 8 4.79% 0.00% 10.87 0.00 0.00 64.13
2027 9 4.49% 0.00% 11.36 0.00 0.00 67.01
2028 10 4.20% 0.00% 11.83 0.00 69.82 69.82 69.82
2029 11+ 3.90% 0.00% 12.29 0.00
Ke = 5.17%

source: Valueline
CH Robinson
CHRW Growth Payout Terminal
Year Rate Ratio Earnings Dividends Value
0 4.73 1.88 (84.09) price = 84.09
2019 1 8.88% 39.75% 5.15 2.05 2.05 91.56
2020 2 3.88% 39.75% 5.35 2.13 2.13 95.11
2021 3 4.29% 39.75% 5.58 2.22 2.22 99.19
2022 4 4.29% 39.75% 5.82 2.31 2.31 103.45
2023 5 4.29% 39.75% 6.07 2.41 2.41 107.88
2024 6 4.29% 42.42% 6.33 2.68 2.68 112.51
2025 7 4.21% 42.42% 6.60 2.80 2.80 117.25
2026 8 4.13% 42.42% 6.87 2.91 2.91 122.09
2027 9 4.06% 42.42% 7.15 3.03 3.03 127.05
2028 10 3.98% 42.42% 7.43 3.15 132.10 135.25 132.10
2029 11+ 3.90% 42.42% 7.72 3.28
Ke = 7.08%
source: Valueline
Expeditors Int'l
EXPD Growth Payout Terminal
Year Rate Ratio Earnings Dividends Value
0 3.25 0.90 (68.09) price = 68.09
2019 1 3.08% 27.69% 3.35 0.93 0.93 70.19
2020 2 7.46% 27.69% 3.60 1.00 1.00 75.42
2021 3 3.38% 27.69% 3.72 1.03 1.03 77.97
2022 4 3.38% 27.69% 3.85 1.07 1.07 80.60
2023 5 3.38% 27.69% 3.98 1.10 1.10 83.32
2024 6 3.38% 28.24% 4.11 1.16 1.16 86.13
2025 7 3.48% 28.24% 4.25 1.20 1.20 89.13
2026 8 3.59% 28.24% 4.41 1.24 1.24 92.33
2027 9 3.69% 28.24% 4.57 1.29 1.29 95.73
2028 10 3.80% 28.24% 4.74 1.34 99.37 100.71 99.37
2029 11+ 3.90% 28.24% 4.93 1.39
Ke = 5.25%
source: Valueline

2019 Multi Stage Dividend Growth Model Using FCFEFreight Airline Industry
Assumptions: 3.90%
13.0
29.0%
22.8%
United Parcel Service
UPS Growth Reinvestment Payout Terminal Cash
Year Rate ROE Rate Ratio Earnings FCFE Value Flow
Historic 0 NMF 15.79% 84.21% 7.24 -97.53 price = 97.53
2019 1 3.59% NMF NMF NMF 7.50 NMF 0.00
2020 2 8.33% NMF NMF NMF 8.13 NMF 0.00
Stage 1 2021 3 7.69% NMF NMF NMF 8.75 NMF 0.00
2022 4 7.14% NMF NMF NMF 9.38 NMF 0.00
2023 5 6.67% NMF NMF NMF 10.00 NMF 0.00
2024 6 6.11% NMF NMF NMF 10.61 NMF 0.00
2025 7 5.56% NMF NMF NMF 11.20 NMF 0.00
Stage 2 2026 8 5.01% NMF NMF NMF 11.76 NMF 0.00
2027 9 4.45% NMF NMF NMF 12.29 NMF 0.00
2028 10 3.90% NMF NMF NMF 12.77 NMF 172.47 172.47
Stage 3 11+ 3.90% 22.75% 17.14% 82.86% 13.26 NMF
Ke = NMF
FedEx
FDX Growth Reinvestment Payout Terminal Cash
Year Rate ROE Rate Ratio Earnings FCFE Value Flow
Historic 0 21.50% 19.81% 80.19% 15.31 -161.33 price = 161.33
2019 1 4.51% 20.50% 30.49% 69.51% 16.00 11.12 11.12
2020 2 6.25% 19.88% 29.60% 70.40% 17.00 11.97 11.97
Stage 1 2021 3 5.88% 19.25% 28.86% 71.14% 18.00 12.81 12.81
2022 4 5.56% 18.63% 28.26% 71.74% 19.00 13.63 13.63
2023 5 5.26% 18.00% 27.73% 72.27% 20.00 14.45 14.45
2024 6 4.99% 18.95% 24.90% 75.10% 21.00 15.77 15.77
2025 7 4.72% 19.90% 22.34% 77.66% 21.99 17.08 17.08
Stage 2 2026 8 4.45% 20.85% 20.01% 79.99% 22.97 18.37 18.37
2027 9 4.17% 21.80% 17.89% 82.11% 23.92 19.64 19.64
2028 10 3.90% 22.75% 17.14% 82.86% 24.86 20.60 335.85 356.45
Stage 3 11+ 3.90% 22.75% 17.14% 82.86% 25.83 21.40
Ke = 14.41%
Atlas Air
AAWW
Growth Reinvestment Payout Terminal Cash
Year Rate ROE Rate Ratio Earnings FCFE Value Flow
Historic 0 9.50% 6.15% 93.85% 7.15 -42.19 price = 42.19
2019 1 1.40% 10.50% 103.45% -3.45% 7.25 -0.25 -0.25
2020 2 10.86% 11.00% 89.07% 10.93% 8.04 0.88 0.88
Stage 1 2021 3 9.80% 11.50% 77.60% 22.40% 8.83 1.98 1.98
2022 4 8.92% 12.00% 68.27% 31.73% 9.61 3.05 3.05
2023 5 8.19% 12.50% 58.67% 41.33% 10.40 4.30 4.30
2024 6 7.33% 14.55% 44.50% 55.50% 11.16 6.19 6.19
2025 7 6.48% 16.60% 33.84% 66.16% 11.89 7.86 7.86
Stage 2 2026 8 5.62% 18.65% 25.51% 74.49% 12.55 9.35 9.35
2027 9 4.76% 20.70% 18.84% 81.16% 13.15 10.67 10.67
2028 10 3.90% 22.75% 17.14% 82.86% 13.66 11.32 184.61 195.93
Stage 3 11+ 3.90% 22.75% 17.14% 82.86% 14.20 11.76
Ke = 20.84%
CH Robinson
CHRW Growth Reinvestment Payout Terminal Cash
Year Rate ROE Rate Ratio Earnings FCFE Value Flow
Historic 0 41.50% 39.03% 60.97% 4.73 -84.09 price = 84.09
2019 1 8.88% 39.00% 18.05% 81.95% 5.15 4.22 4.22
2020 2 7.04% 36.50% 18.02% 81.98% 5.51 4.52 4.52
Stage 1 2021 3 6.58% 34.00% 18.15% 81.85% 5.88 4.81 4.81
2022 4 6.17% 31.50% 18.45% 81.55% 6.24 5.09 5.09
GDP
Industry PE
Target Dividend Payout Ratio
Target ROE
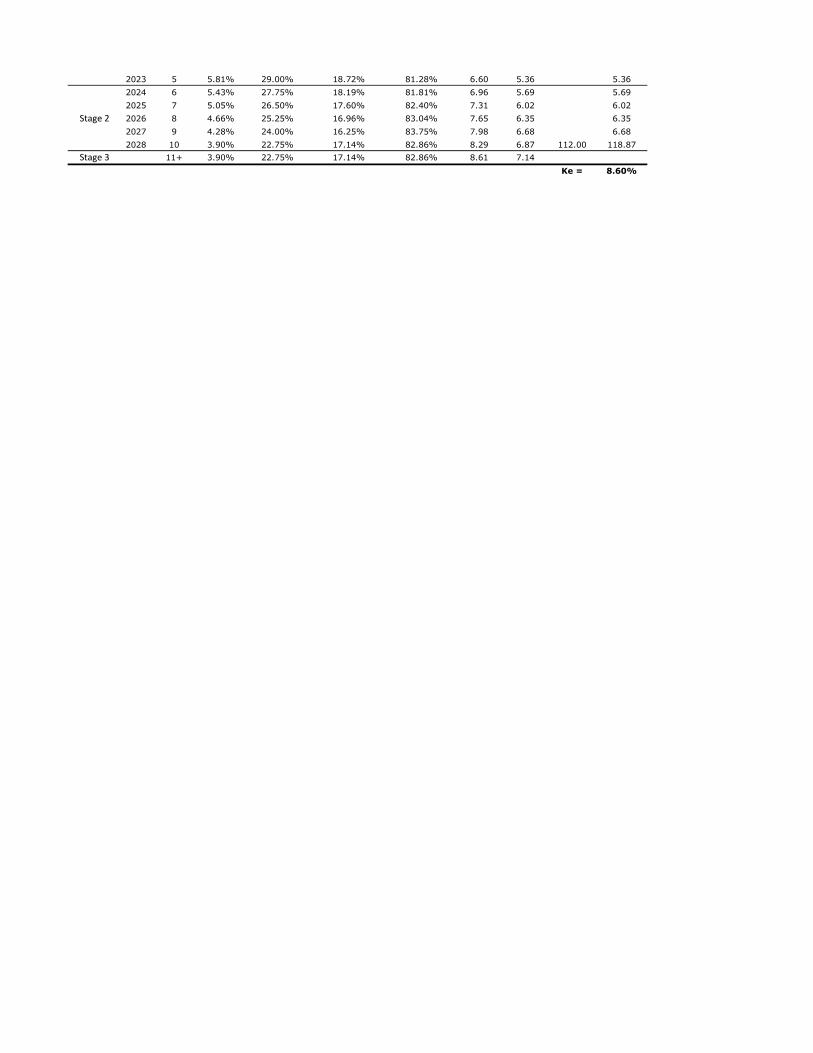
2023 5 5.81% 29.00% 18.72% 81.28% 6.60 5.36 5.36
2024 6 5.43% 27.75% 18.19% 81.81% 6.96 5.69 5.69
2025 7 5.05% 26.50% 17.60% 82.40% 7.31 6.02 6.02
Stage 2 2026 8 4.66% 25.25% 16.96% 83.04% 7.65 6.35 6.35
2027 9 4.28% 24.00% 16.25% 83.75% 7.98 6.68 6.68
2028 10 3.90% 22.75% 17.14% 82.86% 8.29 6.87 112.00 118.87
Stage 3 11+ 3.90% 22.75% 17.14% 82.86% 8.61 7.14
Ke = 8.60%

IMPLIED PREMIUMS FOR US MARKET
Updated January 2018
These implied premiums are calculated using the S&P 500.
YearEarnings
Yield
Dividend
YieldS&P 500 Earnings* Dividends*
Change
in
Earnings
Change in
Dividends
T.Bill
Rate
T.Bond
RateBond-Bill
Smoothed
Growth
Implied
Premium
(DDM)
Analyst
Growth
Estimate
Implied Premium (FCFE)ERP/Riskfree
Rate
1960 5.34% 3.41% 58.11 3.10 1.98 0.0266 2.76% 0.10% 2.45%1961 4.71% 2.85% 71.55 3.37 2.04 0.08602 0.02908 0.0213 2.35% 0.22% 2.41% 2.92% 2.92% 124.26%1962 5.81% 3.40% 63.1 3.67 2.15 0.08786 0.052092 0.0273 3.85% 1.12% 4.05% 3.56% 3.56% 92.47%1963 5.51% 3.13% 75.02 4.13 2.35 0.12752 0.094493 0.0312 4.14% 1.02% 4.96% 3.38% 3.38% 81.64%1964 5.62% 3.05% 84.75 4.76 2.58 0.15225 0.100825 0.0354 4.21% 0.67% 5.13% 3.31% 3.31% 78.62%1965 5.73% 3.06% 92.43 5.30 2.83 0.11197 0.094195 0.0393 4.65% 0.72% 5.46% 3.32% 3.32% 71.40%1966 6.74% 3.59% 80.33 5.41 2.88 0.02228 0.019619 0.0476 4.64% -0.12% 4.19% 3.68% 3.68% 79.31%1967 5.66% 3.09% 96.47 5.46 2.98 0.00849 0.033662 0.0421 5.70% 1.49% 5.25% 3.20% 3.20% 56.14%1968 5.51% 2.93% 103.86 5.72 3.04 0.04807 0.020858 0.0521 6.16% 0.95% 5.32% 3.00% 3.00% 48.70%1969 6.63% 3.52% 92.06 6.10 3.24 0.06656 0.064873 0.0658 7.88% 1.30% 7.55% 3.74% 3.74% 47.46%1970 5.98% 3.46% 92.15 5.51 3.19 -0.09716 -0.01608 0.0653 6.50% -0.03% 4.78% 3.41% 3.41% 52.46%1971 5.46% 3.10% 102.09 5.57 3.16 0.01153 -0.0074 0.0439 5.89% 1.50% 4.57% 3.09% 3.09% 52.46%1972 5.23% 2.70% 118.05 6.17 3.19 0.10762 0.007128 0.0384 6.41% 2.57% 5.21% 2.72% 2.72% 42.43%1973 8.16% 3.70% 97.55 7.96 3.61 0.28929 0.132398 0.0693 6.90% -0.03% 8.30% 4.30% 4.30% 62.32%1974 13.64% 5.43% 68.56 9.35 3.72 0.17481 0.031434 0.08 7.40% -0.60% 6.42% 5.59% 5.59% 75.54%1975 8.55% 4.14% 90.19 7.71 3.73 -0.17541 0.00297 0.058 7.76% 1.96% 5.99% 4.13% 4.13% 53.22%1976 9.07% 3.93% 107.46 9.75 4.22 0.26395 0.131047 0.0508 6.81% 1.73% 8.19% 4.55% 4.55% 66.81%1977 11.43% 5.11% 95.1 10.87 4.86 0.11525 0.1507 0.0512 7.78% 2.66% 9.52% 5.92% 5.92% 76.09%1978 12.11% 5.39% 96.11 11.64 5.18 0.07074 0.065997 0.0718 9.15% 1.97% 8.48% 5.72% 5.72% 62.51%1979 13.48% 5.53% 107.94 14.55 5.97 0.25014 0.152259 0.1038 10.33% -0.05% 11.70% 6.45% 6.45% 62.44%1980 11.04% 4.74% 135.76 14.99 6.44 0.03007 0.078059 0.1124 12.43% 1.19% 11.01% 5.03% 5.03% 40.47%1981 12.39% 5.57% 122.55 15.18 6.83 0.01308 0.060763 0.1471 13.98% -0.73% 11.42% 5.73% 5.73% 40.99%1982 9.83% 4.93% 140.64 13.82 6.93 -0.0895 0.015751 0.1054 10.47% -0.07% 7.96% 4.90% 4.90% 46.80%1983 8.06% 4.32% 164.93 13.29 7.12 -0.03845 0.027608 0.088 11.80% 3.00% 9.09% 4.31% 4.31% 36.53%1984 10.07% 4.68% 167.24 16.84 7.83 0.26688 0.098506 0.0985 11.51% 1.66% 11.02% 5.11% 5.11% 44.40%1985 7.42% 3.88% 211.28 15.68 8.20 -0.06912 0.04738 0.0772 8.99% 1.27% 7.89% 4.03% 6.75% 3.84% 42.71%1986 5.96% 3.38% 242.17 14.43 8.19 -0.07933 -0.0015 0.0616 7.22% 1.06% 5.54% 3.36% 6.96% 3.58% 49.58%1987 6.49% 3.71% 247.08 16.04 9.17 0.111 0.119888 0.0547 8.86% 3.39% 9.66% 4.18% 8.58% 3.99% 45.03%1988 8.20% 3.68% 277.72 24.12 10.22 0.50416 0.114919 0.0635 9.14% 2.79% 9.76% 4.12% 7.67% 3.77% 41.25%1989 6.80% 3.32% 353.4 24.32 11.73 0.00829 0.148021 0.0837 7.93% -0.44% 9.58% 3.85% 7.46% 3.51% 44.26%1990 6.58% 3.74% 330.22 22.65 12.35 -0.06867 0.052617 0.0781 8.07% 0.26% 7.39% 3.92% 7.19% 3.89% 48.20%1991 4.58% 3.11% 417.09 19.30 12.97 -0.1479 0.050304 0.07 6.70% -0.30% 6.34% 3.27% 7.81% 3.48% 51.94%1992 4.16% 2.90% 435.71 20.87 12.64 0.08135 -0.0259 0.053 6.68% 1.38% 4.67% 2.83% 9.83% 3.55% 53.14%1993 4.25% 2.72% 466.45 26.90 12.69 0.28893 0.004103 0.035 5.79% 2.29% 4.73% 2.74% 8.00% 3.17% 54.75%1994 5.89% 2.91% 459.27 31.75 13.36 0.1803 0.053385 0.05 7.82% 2.82% 7.23% 3.06% 7.17% 3.55% 45.40%1995 5.74% 2.30% 615.93 37.70 14.17 0.1874 0.059981 0.035 5.57% 2.07% 5.65% 2.44% 6.50% 3.29% 59.07%1996 4.83% 2.01% 740.74 40.63 14.89 0.07772 0.051 0.05 6.41% 1.41% 6.13% 2.11% 7.92% 3.20% 49.92%1997 4.08% 1.60% 970.43 44.09 15.52 0.08516 0.042523 0.0535 5.74% 0.39% 5.45% 1.67% 8.00% 2.73% 47.56%1998 3.11% 1.32% 1229.23 44.27 16.20 0.00408 0.04368 0.0433 4.65% 0.32% 4.60% 1.38% 7.20% 2.26% 48.60%1999 3.07% 1.14% 1469.25 51.68 16.71 0.16738 0.031595 0.0537 6.44% 1.07% 5.75% 1.20% 12.50% 2.05% 31.83%2000 3.94% 1.23% 1320.28 56.13 16.27 0.08611 -0.02653 0.0573 5.11% -0.62% 3.71% 1.65% 12.00% 2.87% 56.16%2001 3.85% 1.37% 1148.09 38.85 15.74 -0.30786 -0.03242 0.018 5.05% 3.25% 3.56% 1.73% 10.30% 3.62% 71.68%2002 5.23% 1.83% 879.82 46.04 16.08 0.18507 0.021536 0.012 3.81% 2.61% 3.57% 2.29% 8.00% 4.10% 107.61%2003 4.87% 1.61% 1111.91 54.69 17.88 0.18788 0.11194 0.01 4.25% 3.25% 5.35% 2.12% 11.00% 3.69% 86.82%2004 5.58% 1.60% 1211.92 67.68 19.41 0.23752 0.085403 0.0218 4.22% 2.04% 4.90% 2.02% 8.50% 3.65% 86.49%2005 5.47% 1.79% 1248.29 76.45 22.38 0.12958 0.153192 0.0431 4.39% 0.08% 6.16% 2.20% 8.00% 4.08% 92.94%2006 6.18% 1.77% 1418.3 87.72 25.05 0.14742 0.119303 0.0488 4.70% -0.18% 5.93% 1.97% 12.50% 4.16% 88.51%2007 5.62% 1.89% 1468.36 82.54 27.73 -0.05905 0.106986 0.0331 4.02% 0.71% 5.03% 2.06% 5.00% 4.37% 108.71%2008 7.24% 3.11% 903.25 65.39 28.05 -0.20778 0.01154 0.0159 2.21% 0.62% 2.11% 4.05% 4.00% 6.43% 290.95%2009 5.35% 2.00% 1115.1 59.65 22.31 -0.08778 -0.20463 0.0014 3.84% 3.70% 0.28% 2.60% 7.20% 4.36% 113.54%2010 6.65% 1.84% 1257.64 83.66 23.12 0.40251 0.036307 0.0013 3.29% 3.16% 3.33% 2.24% 6.95% 5.20% 158.05%
2011 7.72% 2.07% 1257.6 97.05 26.02 0.16005 0.125433 0.0003 1.88% 1.85% 2.75% 2.71% 7.18% 6.01% 319.68%
2012 7.18% 2.13% 1426.19 102.47 30.44 0.05585 0.169869 0.0005 1.76% 1.71% 2.93% 2.47% 5.27% 5.78% 328.41%
2013 5.81% 1.96% 1848.36 107.45 36.28 0.0486 0.191853 0.0007 3.04% 2.97% 5.01% 2.03% 4.28% 4.96% 163.16%
2014 5.57% 1.87% 2058.9 114.74 38.57 0.06785 0.06312 0.00053 2.17% 2.12% 2.55% 2.24% 5.58% 5.78% 266.36%
2015 5.20% 2.11% 2043.94 106.32 43.16 -0.0592 0.0943 0.0021 2.27% 2.06% 2.96% 2.46% 5.55% 6.12% 270.00%
2016 4.86% 2.01% 2238.83 108.86 45.03 0.0239 0.0433 0.0051 2.45% 1.94% 2.64% 2.41% 5.54% 5.69% 232.00% 16