cost of capital and capital budgeting for privately … of capital and capital budgeting for...
TRANSCRIPT

Cost of Capital and Capital Budgeting for Privately-Held Firms: Evidence from Business Owners Survey
Maretno A. Harjoto
Pepperdine University
John K. Paglia Pepperdine University
This study reveals characteristics of privately owned firms and factors that influence capital budgeting decisions made by business owners. On average, private businesses employ 25% debt with an average corporate tax rate of 32% and a weighted average cost of capital of 16.67%. Business owners who receive funding from family and friends tend to rely on “gut feel” and market analysis to guide their investment decisions while business owners who prepare an annual budget, engage in planning beyond the current year, and have a solid growth strategy are more likely to use quantitative capital budgeting methods. INTRODUCTION
Traditionally, private equity markets are considered the major capital providers for privately held firms (Metrick and Yasuda, 2010). According to the International Financial Services London (IFSL) Research Private Equity report, the total funds raised and total investment by private equity reached its peak totaling $493 billion and $309 billion globally during 2007. North America accounted for over 70% of private equity investments. However, after the recent financial crisis, the size of private equity investments has been adversely affected by the contraction in the global capital markets. A significant drop occurred in 2009 and 2010 as the total capital raised by global private equity markets reached $140 billion and $150 billion respectively, compared to $459 billion in 2008 (The City UK Research Private Equity, 2010). The Ernst and Young report (2010) states that fundraising for private equity firms will continue to be a challenge for the next 12 to 18 months. Therefore, private business owners are questioning whether they can rely on the private equity markets for their financing needs.
In recent years, privately held firms have relied less on private equity firms (PEs) to address their capital needs. They also have sought funding from mezzanine, asset backed lenders (ABLs), senior lenders (banks), venture capital (VCs), angels, and more importantly from business owners’ family and friends. All of these fund providers for small private businesses operate under the private capital markets (Slee, 2004). While the existing academic literature examines characteristics of venture capital financing (Gompers and Lerner, 1999a; 1999b; 1999c; Metrick, 2007), banks financing (Petersen and Rajan, 1994; Berger and Udell 1995; Cole, 1998), private equities’ performance (Kaplan and Schoar, 2005; Phalippou and Gottschaig, 2009; Phalippou, 2010), fees and economies of scale for private equity funds (Metrick and Yasuda, 2010), and investment behavior of private equity managers (Ljungqvist and Richardson,
Journal of Accounting and Finance vol. 12(5) 2012 71

2003), we find no existing studies that examine the overall characteristics of the private capital markets, which includes family and friends, angels, mezzanine, and ABLs in addition to those segments investigated previously—venture capital, banks, and private equity firms—from the business owners’ perspective. This study reveals capital budgeting and financing decisions by private business owners who received funding from a broader spectrum of private capital providers.
Existing studies on capital budgeting and financing decisions primarily focus on publicly traded firms. Graham and Harvey (2001; 2002) examine how corporate financing and capital budgeting decisions are made from the lens of practitioners (CFOs and CEOs) for Fortune 500 firms. They find that large public firms tend to rely on the net present value and the capital asset pricing model while small public firms tend to rely on payback period. Danielson and Scott (2006) investigate the capital budgeting decision for small businesses and find that many small firms evaluate their projects using payback period or the owners’ gut feel. Robb and Robinson (2010) examine capital structure decisions on newly formed firms using the Kauffman Firm Survey (KFS). Very little is known about the cost of capital for privately owned firms and capital budgeting methods that are utilized by private business owners. This study fills this gap in the literature.
The study relies on the Pepperdine Private Capital Markets business owners’ survey conducted during the spring of 2010. The study identifies the characteristics of private business owners such as the legal form of their businesses, size of ownership interest, size, and funding sources. The study examines the cost of capital in the private capital market by examining capital structure, cost of debt, cost of equity, and weighted average cost of capital for private business owners. The study concludes by investigating factors that influence business owners’ usage of quantitative capital budgeting techniques such as the payback period, the discounted cash flow, and the internal rate of return (IRR) as opposed to more qualitative analyses such as market analysis and gut feel.
The study shows that major private business owners are dominated by the service industry (i.e. business services, software, employment, and consulting services), followed by manufacturing, technology, and financial industries. Their legal forms are general partnerships, S-corporations, and C-corporations. Their operations have a median average age category range of 5 to 10 years with the majority of business owners having business experience of 10 to 30 years. Most firms have averages of annual net sales between $0 and $500,000 and between $1 million and $5 million. Most private business owners actively manage their own firms. On average, businesses employ 25% debt, an average corporate tax rate of 32% and a weighted average cost of capital of 16.67%. The majority of business owners claim that they use financing from family and friends followed by senior lenders (banks), angel investors (angels), asset based lenders (ABLs), private equity groups (PEs), and other sources. This last finding is different from Robb and Robinson’s (2010) study that finds that new firms tend to rely on bank financing rather than family and friends. We believe this difference is attributed to the deterioration of the credit market for small and medium sized businesses that occurred during the time period between the 2007 KFS survey and our survey in 2010.
Our regression results indicate that business owners who receive funding from family and friends tend to rely on their “gut feel” to guide their investment decisions while business owners who receive funding from senior lenders (banks) and engage in planning beyond the current year are more likely to employ payback period and internal rate of return (IRR) methods. Firms that prepare their annual budget also tend to use IRR and discounted cash flow (DCF) methods. Our findings also indicate that firms that have a solid growth strategy tend to use DCF. We find some industry influence as well. Firms in the technology industry tend to use market analysis and payback period while firms in the finance industry tend to use IRR. Overall, the results indicate that internal financial management, planning, growth strategy, industry, and sources of financing influence the capital budgeting methods that business owners employ. The recent global financial crisis has shifted the landscape of participants that provide capital for private businesses. This study finds that the increased role of family and friends financing for small private businesses has a significant influence on the way business owners make their investment decisions.
72 Journal of Accounting and Finance vol. 12(5) 2012

The next section addresses the literature and discusses the background of the survey. It is followed by descriptive statistics of the sample and a regression analysis on the empirical data. The paper concludes with a summary of the main findings, directions for future research in the field of private capital markets, and insights on private business owners’ perception of their cost of capital. LITERATURE REVIEW
Existing literature on equity financing for private firms focuses on the characteristics of venture capital and private equity firms primarily due to the data limitation for other equity capital providers. Gompers and Lerner (1999a) examine the role of venture capital firms on certifying initial public offerings (IPOs) of firms that they invest in. In this capacity, the role of venture capitalists is to generate information about these privately held firms prior to going public. Gompers and Lerner (1999b) study the determinants of venture capital fundraising in the United States. They find that reducing capital gains taxes and easing pension funds investment restrictions have positive impacts on the supply of venture capital funding. Gompers and Lerner (1999c) and Metrick (2007) provide a complete coverage of characteristics, investment behavior, and roles venture capitalists play in private firms.
Current studies that examine the role of banks in providing capital for small businesses mostly rely on the Survey for Small Business Finance (SBBF) by the Federal Reserve Bank. Petersen and Rajan (1994) analyze bank credit availability for small private businesses and find firms with stronger relationships with their prospective lenders are more likely to receive credit, but not necessarily receive better pricing. Berger and Udell (1995) focus on banks’ lines of credit to small businesses where relationships should be especially important. They find that loan rates are lower when private firms have longer pre-existing relationships. Cole (1998) focuses on the lender’s decision to extend credit versus the rate charged by the lender. He finds that the existence of a firm-lender relationship affects the likelihood a lender will extend credit to business owners.
Other literature focuses on the roles of private equity firms, its performance, and characteristics of the private equity markets. Kaplan and Schoar (2005) investigated the performance and capital inflow of private equity partnerships. They find that the average net returns for private equity is approximately equal to the S&P 500. Based on the internal rate of return and public market value equivalent measures, better performing funds are more likely to raise follow-on funds. Lerner, Schoar, and Wong (2007) argue that there is a learning cost associated with investing in private equity (PE) funds. They find that large differences in private equity investors’ skill to choose among private equity (PE) funds explains poor performance of PE funds in their early stage.
Phalippou and Gottschaig (2009) point out that private equity funds underperform the S&P 500 by 3% after adjusting the internal rate of return (IRR) with duration of cash flows. They state that aggregation of IRR currently reported from private equity firms overstate their funds performance by 6% after adjusting the risk using industry and size matched cost of capital. Metrick and Yasuda (2010) contrast the performance and fee structure in private equity funds from buyouts versus venture capital. They find that successful buyout fund managers can scale up their funds using the same sets of skill and knowledge from managing small buyout funds. In contrast, venture capital fund managers cannot scale up their investment funds since investment in each private firm require specific experience and knowledge.
A strand of literature that is also relevant to this study is the survey-based studies that examine how corporate finance and capital budgeting decisions are made among practitioners. Moore and Reichert (1983) suggest that more sophisticated capital budgeting techniques, such as net present value (NPV) and internal rate of return (IRR), are widely used among managers, but vary across different industries. Bierman (1993) finds that senior financial officers of large publicly traded firms tend to rely on several capital budgeting methods that take into account the time value of money. Pike (1998) presents a longitudinal study that examines the capital budgeting decisions for publicly traded firms during 1975 to 1993. He finds that there is an increasing trend for managers to utilize the discounted cash flows (DCF) method. Graham and Harvey (2001; 2002) conduct a survey of 392 chief executive officers during 1999 and find that most survey participants use both net present value (discounted cash flow) and internal rate
Journal of Accounting and Finance vol. 12(5) 2012 73

of returns to evaluate new projects. Surprisingly, a large number of firms use the company-wide cost of capital to evaluate projects which may be more or less risky than company-wide risk. Smaller companies tend to use the payback period method and large companies tend to use the net present value (NPV).
Danielson and Scott (2006) investigate the capital budgeting decision for small firms. They utilize the National Federation of Independent Business (NFIB) 2003 survey from the Gallup Organization. They examine capital budgeting methods for small firms with fewer than 250 employees and investigate why small firms use such methods. They find that most small firms use less sophisticated capital budgeting methods such as payback period, accounting rate of return, and gut feel rather than discounted cash flow methods. Many small business owners have limited formal education, have incomplete management teams, and have smaller numbers of staff. These factors contribute to a lack of financial sophistication in capital budgeting practices for small firms.
Robb and Robinson (2010) examine the capital structure decision from newly formed companies using the Kauffman Firm Survey (KFS) data from 2004 to 2007. The Kauffman Firm Survey (KFS) surveys 4,928 businesses and tracks operations annually dating back to 2004. The survey focuses on the nature of new business formation activity, characteristics of the strategy, offerings, employment patterns, financial and organizational arrangements of these businesses, and the characteristics of the founders of new businesses. They find that many startups rely on external debt financing (bank loans) instead of family and friends. They conclude that heavy reliance on external debt underscores the importance of well-functioning credit markets to support the success of these new businesses.
While some of the existing studies examine characteristics, roles, and investment decisions of venture capitalists (Gompers and Lerner, 1999c) and behavior of private equity funds (Phalippou and Gottschaig, 2009; Ljungqvist and Richardson, 2003), we do not find any study that examines the characteristics of the private capital markets and the impact of sources of funding on capital budgeting decisions for private business owners. The main reason is due to limited data on capital providers for private businesses that are readily available beyond venture capital, banks, and private equity data (i.e. Venture Economics, Venture Xpert, Thomson Reuters, and Investors Records only cover venture capitalists and private equity funds data and the Survey for Small Business Finances by the Federal Reserve Bank ended in 2003). This study utilizes a unique survey data set that was collected directly from private business owners from the Pepperdine Private Capital Markets Project during the spring of 2010.
The Pepperdine Private Capital Markets Project launched a web-based Qualtrics© survey for private capital market participants such as banks, asset based lenders, mezzanine funds, private equity, angel investors, and venture capital firms in spring of 2010. There were nine separate surveys that were administered: angel investors survey, venture capital survey, private equity survey, mezzanine survey, banks (senior lenders) survey, asset backed lenders survey, factors survey, appraisers survey and business owners survey. Among these nine surveys, the most comprehensive survey is done through the business owners’ survey, which is used in this study. The survey contains questions regarding the private capital market participants’ profile, credit box (characteristics that must be displayed in order to qualify for financing), historical returns, expected returns, cost of capital analysis, and capital budgeting methods that they use to evaluate the value of potential investment opportunities in private firms who seek funding from the private capital markets (see Appendix A). Based on 389 responses from the business owner survey, there are approximately 350 usable responses that are analyzed in this study. EMPIRICAL ANALYSIS
Table 1 summarizes industry characteristics of the business owners (participants). Software, employment service, business to business, and consulting services (categorized as “service”) represents 23% of the participants followed by manufacturing (15%), technology (13%) and finance (12%).
74 Journal of Accounting and Finance vol. 12(5) 2012
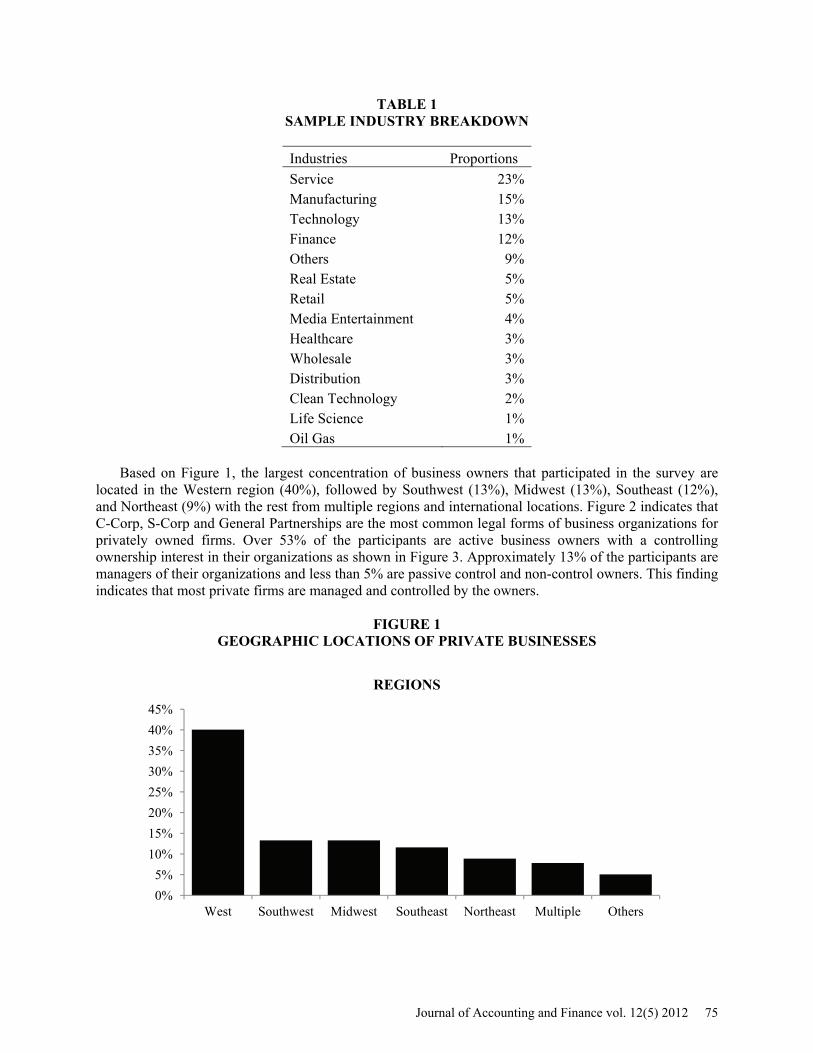
TABLE 1 SAMPLE INDUSTRY BREAKDOWN
Industries Proportions
Service 23%Manufacturing 15%Technology 13%Finance 12%Others 9%Real Estate 5%Retail 5%Media Entertainment 4%Healthcare 3%Wholesale 3%Distribution 3%Clean Technology 2%Life Science 1%Oil Gas 1%
Based on Figure 1, the largest concentration of business owners that participated in the survey are
located in the Western region (40%), followed by Southwest (13%), Midwest (13%), Southeast (12%), and Northeast (9%) with the rest from multiple regions and international locations. Figure 2 indicates that C-Corp, S-Corp and General Partnerships are the most common legal forms of business organizations for privately owned firms. Over 53% of the participants are active business owners with a controlling ownership interest in their organizations as shown in Figure 3. Approximately 13% of the participants are managers of their organizations and less than 5% are passive control and non-control owners. This finding indicates that most private firms are managed and controlled by the owners.
FIGURE 1 GEOGRAPHIC LOCATIONS OF PRIVATE BUSINESSES
0%
5%
10%
15%
20%
25%
30%
35%
40%
45%
West Southwest Midwest Southeast Northeast Multiple Others
REGIONS
Journal of Accounting and Finance vol. 12(5) 2012 75
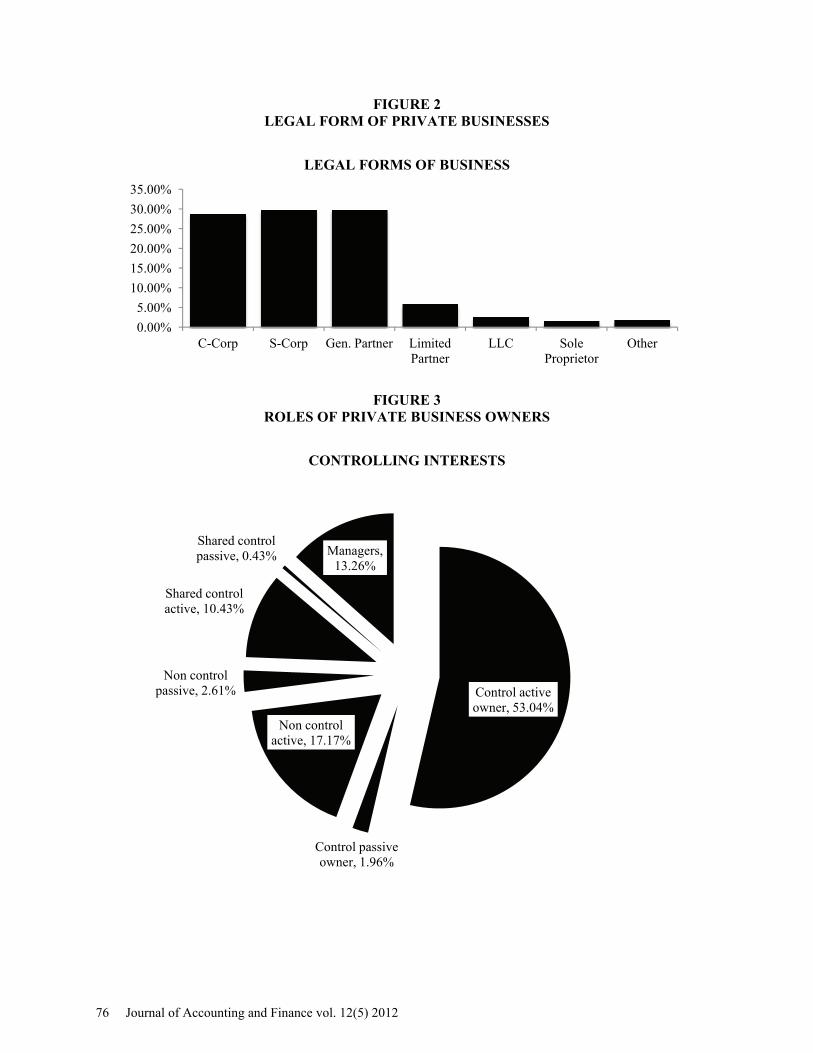
FIGURE 2 LEGAL FORM OF PRIVATE BUSINESSES
FIGURE 3 ROLES OF PRIVATE BUSINESS OWNERS
0.00%
5.00%
10.00%
15.00%
20.00%
25.00%
30.00%
35.00%
C-Corp S-Corp Gen. Partner Limited Partner
LLC Sole Proprietor
Other
LEGAL FORMS OF BUSINESS
Control active owner, 53.04%
Control passive owner, 1.96%
Non control active, 17.17%
Non control passive, 2.61%
Shared control active, 10.43%
Shared control passive, 0.43% Managers,
13.26%
CONTROLLING INTERESTS
76 Journal of Accounting and Finance vol. 12(5) 2012

Next, we examine the financial performance, in terms of annual net sales and earnings before interest, taxes and depreciation and amortization (EBITDA), and the capital needs and sources of capital for these survey participants. Based on Table 2, we find that annual net sales and EBITDA for the survey participants is bimodal. They are either small firms with their net sales and EBITDA less than $500,000 or medium firms with their net sales between $1 million and $5 million, and EBITDA between $500,000 and $3 million. Very small percentages of participants are coming from large firms with annual revenues and EBITDA above $25 million. Additionally, almost 75% of these firms have capital needs of less than $5 million. This suggests that most business owners who participate in the private capital markets are relatively small-sized firms. When we examine the length of business operations and work experience of the survey participants (Table 3), we find that most businesses are evenly distributed from one year up to 30 years of operations. Nearly half of the participants report having working experience of greater than 20 years and over 26% have at least 10 to 20 years.
TABLE 2 PERFORMANCE AND CAPITAL NEEDS
Annual Annual Capital Revenues EBITDA Needs
Negative - 15.9% - Zero 6.9% 4.9% - Up to $100K 13.6% 22.9% - $100K to $500K 16.3% 20.4% 25.5% $500K to $1M 7.6% 9.6% 17.6% $1M to $3M 15.0% 11.0% 13.2% $3M to $5M 10.0% 4.9% 18.1% $5M to $10M 9.2% 2.0% 11.0% $10M to $25M 8.9% 1.4% 7.5% $25M to $50M 4.7% 0.7% 2.2% $50M to $100M 2.5% 0.5% 1.8% $100M to $500M 3.1% 1.1% 2.2% Above $500M 2.2% 4.7% 0.9%
TABLE 3
BUSINESS OPERATION AND WORK EXPERIENCE
Business Working Years Operation Experience
Less than 1 8.5% 1.1% 1 to 2 12.2% 3.3% 2 to 5 14.3% 8.7% 5 to 10 17.4% 11.9% 10 to 20 18.0% 26.2% 20 to 30 12.8% 48.9% 30 to 50 7.4% - More than 50 9.5% -
Journal of Accounting and Finance vol. 12(5) 2012 77

Looking at current sources of capital presented in Table 4, this study finds that 37% of business owners claim they received funding from family and friends, followed by 24% from senior lenders (banks), 10% from angel investors, and 7% from asset based lenders. The frequency of institutional investing sources such as private equity groups (PEs), venture capital (VCs), and hedge funds only represents 5%, 2%, and 2%, respectively. This finding indicates that existing studies that focus only on venture capital and private equity firms have missed the importance of friends and family as the leading source of capital for private businesses. Our finding is also different than Robb and Robinson (2010) who show that most newly formed companies rely on bank debt financing rather than business owners’ family and friends. We believe that the difference between our finding and Robb and Robinson (2010) is due to tighter credit market conditions, especially with respect to bank loans to small businesses during 2009. Robb and Robinson rely on the Kauffman Firm Survey data from 2004 to 2007, which is prior to the global crisis in the credit markets. Our study is based on the survey conducted during spring of 2010 at the time when small businesses have experienced a significant contraction in the credit markets. Therefore, it is intuitive to find that small business owners rely more on family and friends for funding rather than senior lenders during the time period examined in this study.
TABLE 4 SOURCES OF CAPITAL FOR BUSINESS OWNERS
Sources of Financing Proportions
Family Friends 37% Senior Lenders 24% Angels 10% Asset Based Lenders 7% PEs 5% Factoring 3% VCs 2% Hedge Fund 2% Mezzanine 1% Others 9%
Table 5 summarizes capital structure, tax rate, cost of debt, cost of equity, and weighted average cost
of capital (WACC). It appears relative few small businesses calculate their own WACC as there are just 33 survey participants who filled out the questionnaire on these items. Of the 33 participants, the mean (median) of percentage of debt financing is 24.75% (22%) and the mean (median) of their effective corporate tax rate is 31.57% (34%). Pretax cost of debt is 8.38% with the median of 7%. This seems to be 1% to 2% higher than the cost of debt for publicly traded firms from Damodaran (2010).
TABLE 5
CAPITAL STRUCTURE AND COST OF CAPITAL
Capital structure Mean Median
Debt financing % 24.75% 22%
Tax rate 31.57% 34%
Pretax Cost of Debt 8.38% 7%
Cost of Equity 22.03% 16%
WACC 16.67% 13%
78 Journal of Accounting and Finance vol. 12(5) 2012
The average cost of equity is 22.03% with a median of 16%. The cost of equity is at least two to three times higher than the cost of equity for publicly traded firms (Damodaran, 2010). The capital structure, effective corporate tax rate, cost of debt and cost of equity result in the average weighted average cost of capital (WACC) of 16.67% with a median of 13%, which is twice as much as publicly traded firms.
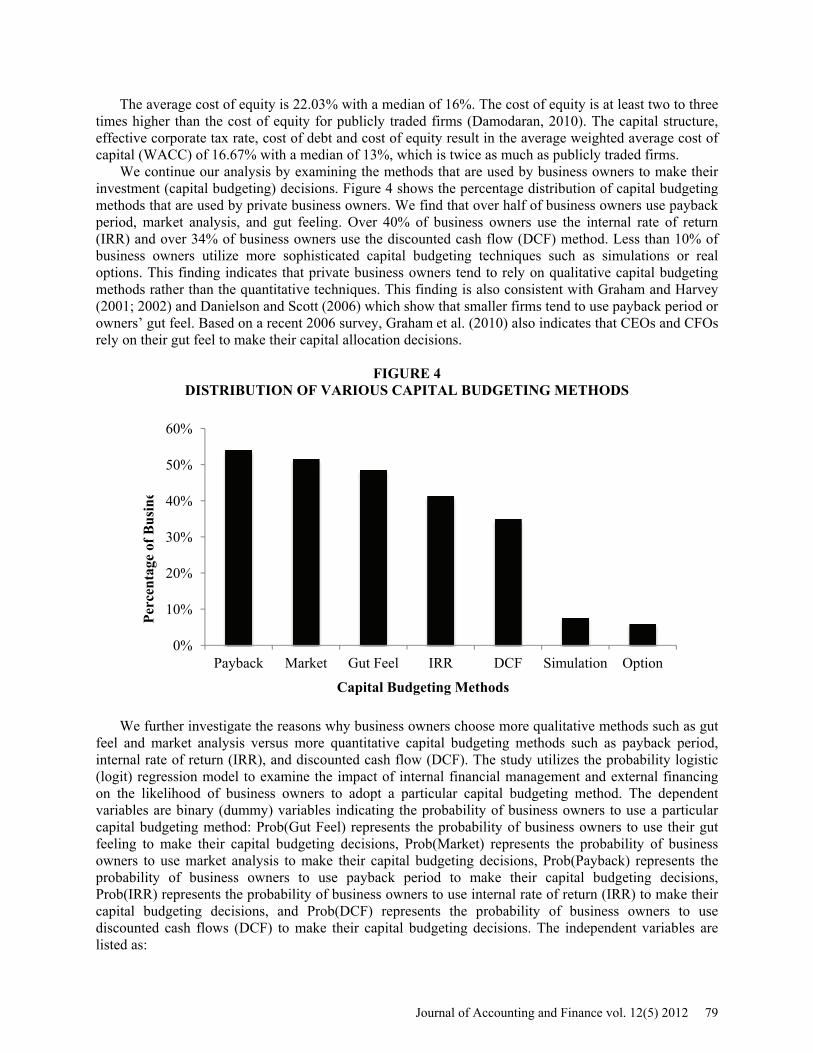
We continue our analysis by examining the methods that are used by business owners to make their investment (capital budgeting) decisions. Figure 4 shows the percentage distribution of capital budgeting methods that are used by private business owners. We find that over half of business owners use payback period, market analysis, and gut feeling. Over 40% of business owners use the internal rate of return (IRR) and over 34% of business owners use the discounted cash flow (DCF) method. Less than 10% of business owners utilize more sophisticated capital budgeting techniques such as simulations or real options. This finding indicates that private business owners tend to rely on qualitative capital budgeting methods rather than the quantitative techniques. This finding is also consistent with Graham and Harvey (2001; 2002) and Danielson and Scott (2006) which show that smaller firms tend to use payback period or owners’ gut feel. Based on a recent 2006 survey, Graham et al. (2010) also indicates that CEOs and CFOs rely on their gut feel to make their capital allocation decisions.
FIGURE 4 DISTRIBUTION OF VARIOUS CAPITAL BUDGETING METHODS
We further investigate the reasons why business owners choose more qualitative methods such as gut
feel and market analysis versus more quantitative capital budgeting methods such as payback period, internal rate of return (IRR), and discounted cash flow (DCF). The study utilizes the probability logistic (logit) regression model to examine the impact of internal financial management and external financing on the likelihood of business owners to adopt a particular capital budgeting method. The dependent variables are binary (dummy) variables indicating the probability of business owners to use a particular capital budgeting method: Prob(Gut Feel) represents the probability of business owners to use their gut feeling to make their capital budgeting decisions, Prob(Market) represents the probability of business owners to use market analysis to make their capital budgeting decisions, Prob(Payback) represents the probability of business owners to use payback period to make their capital budgeting decisions, Prob(IRR) represents the probability of business owners to use internal rate of return (IRR) to make their capital budgeting decisions, and Prob(DCF) represents the probability of business owners to use discounted cash flows (DCF) to make their capital budgeting decisions. The independent variables are listed as:
0%
10%
20%
30%
40%
50%
60%
Payback Market Gut Feel IRR DCF Simulation Option
Capital Budgeting Methods
Per
cen
tage
of B
usi
ne
Journal of Accounting and Finance vol. 12(5) 2012 79
Annual Budget: a dummy variable equal to one if business owners prepare an annual budget or zero otherwise. Audited Financial: a dummy variable equal to one if business owners have their financial statements audited or reviewed by a Certified Public Accountant (CPA) annually or zero otherwise. Planning: a dummy variable equal to one if business owners engage in planning beyond the current year or zero otherwise. Outside Board: a dummy variable equal to one if business owners have an outside board of directors to guide the company or zero otherwise. Growth Strategy: a dummy variable equal to one if business owners have a solid growth strategy or zero otherwise. Family & Friend: represents a dummy variable for business owners who received current capital funding from their family and friends. Angels: represents a dummy variable for business owners who received current capital funding from angel investors. VC: represents a dummy variable for business owners who received current capital funding from venture capital. Mezzanine: represents a dummy variable for business owners who received current capital funding from mezzanine. PE: represents a dummy variable for business owners who received current capital funding from private equity groups (PEs). Hedge Fund: represents a dummy variable for business owners who received current capital funding from hedge funds. ABL: represents a dummy variable for business owners who received current capital funding from asset based lenders (ABLs). Bank: represents a dummy variable for business owners who received current capital funding from senior lenders (banks). Revenue1: represents a dummy variable for firms with annual net sales between $1 million to $5 million per year. Revenue2: represents a dummy variable for firms with annual net sales above $5 million. The omitted dummy variable is for firms with annual net sales below $1 million. CCORP: is a dummy variable to represent the C Corporation as a legal form of their businesses. This variable represents the level of business complexity in C Corporation in addition to different tax code treatment as opposed to other forms of legal types of organizations. Experience: represents a dummy variable to represent business owners who have business experience more than 10 years. Control Active: represents a dummy variable for control owners who actively manage their own businesses. Service, Manufacturing, Finance, and Technology represent dummy variables for four major industries in the sample shown in Table 1. These variables control for variation across four dominant industries in the sample.
80 Journal of Accounting and Finance vol. 12(5) 2012

TABLE 6 LOGISTIC PROBABILITY ANALYSIS FOR CAPITAL BUDGETING DECISION
Prob(Gut Feel) Prob(Market) Prob(Payback) Prob(IRR) Prob(DCF) Annual Budget 0.085 0.151 0.065 0.170 0.148
(1.19) (1.98)** (0.92) (2.27)** (1.96)** Audited Financial -0.064 -0.071 -0.089 -0.071 0.012
(1.01) (1.12) (1.47) (1.12) (0.20) Planning 0.149 0.130 0.152 0.131 0.024
(1.87)* (1.65)* (1.96)* (1.67)* (0.33) Outside Board 0.150 0.208 0.176 0.201 0.238
(2.01)** (2.80)*** (2.47)** (2.76)*** (2.05)** Growth Strategy -0.080 0.001 -0.006 0.023 0.127
(1.08) (0.02) (0.09) (0.31) (1.71)* Family & Friend 0.167 0.103 0.100 0.096 0.093
(2.80)*** (1.67)* (1.60) (1.50) (1.58) Angels -0.057 -0.005 -0.081 -0.005 -0.099
(0.58) (0.05) (0.85) (0.05) (1.05) VCs -0.424 -0.221 -0.060 -0.121 0.028
(2.03)** (1.20) (0.35) (0.58) (0.16) Mezzanine -0.001 0.019 -0.032 -0.152 0.086
(0.01) (0.06) (0.10) (0.51) (0.33) PEs -0.292 -0.070 -0.176 -0.000 -0.169
(1.86)* (0.44) (1.15) (0.00) (1.09) Hedge Fund 0.376 0.165 0.150 0.283 0.432
(1.34) (0.60) (0.55) (0.79) (1.43) ABL -0.008 0.028 -0.035 0.018 0.144
(0.07) (0.25) (0.32) (0.15) (1.25) Banks 0.045 0.126 0.147 0.119 0.066
(0.67) (1.87)* (2.23)** (1.76)* (1.03) Revenue1 0.142 0.084 0.154 0.033 0.052
(1.81)* (1.07) (2.00)** (0.42) (0.71) Revenue2 -0.036 -0.021 0.074 -0.024 0.007
(0.45) (0.27) (0.95) (0.30) (0.09) CCORP -0.061 -0.078 -0.107 -0.180 -0.040
(0.95) (1.21) (1.74)* (2.76)*** (0.68) Experience 0.082 0.044 0.009 0.123 0.081
(1.13) (0.59) (0.13) (1.63) (1.15) Control Active -0.066 0.013 -0.001 0.013 -0.090
(1.03) (0.20) (0.02) (0.20) (1.48) Service 0.088 0.090 0.084 -0.011 0.111
(1.14) (1.19) (1.11) (0.15) (1.53) Manufacturing -0.092 0.017 0.031 0.040 -0.093
(1.07) (0.19) (0.37) (0.45) (1.15) Finance 0.039 0.163 0.128 0.250 0.110
(0.37) (1.58) (1.30) (2.44)** (1.09) Technology 0.100 0.178 0.149 0.096 0.136
(1.07) (1.95)* (1.63) (1.05) (1.56) Intercept -0.196 -0.398 -0.221 -0.415 -0.502
(1.65)* (3.15)*** (1.85)* (3.20)*** (4.09)*** Pseudo R-square 0.0778 0.0716 0.0665 0.091 0.0736 Observations 365 365 365 365 365
Journal of Accounting and Finance vol. 12(5) 2012 81

The first column of Table 6 presents the logistic regression to examine the probability that business owners choose gut feel (Prob(Gut Feel)) for their capital budgeting decision. Each slope coefficient represents the marginal impact for a one unit increase in each independent variable on the probability of business owners to use gut feeling for their capital budgeting decisions. We consider 10%, 5%, and 1% levels of significance as statistically significant. The result indicates that the likelihood for business owners to use their gut feeling to make their capital budgeting decision increases by 14.9% if they engage in planning beyond one year. The likelihood of using gut feeling increases by 15% if business owners have an outside board of directors to help to guide their business strategy. Examining the impact of sources of financing, the study finds that the probability of business owners to use their gut feeling for their capital budgeting decision increases by 16.7% if they currently receive funding from their friends and family. However, their likelihood to use gut feeling decreases by 42.2% if they currently receive funding from venture capital (VCs). The likelihood of using gut feeling is further reduced by 29.2% if they currently receive funding from private equity (PEs). These adverse effects of VCs and PEs on the likelihood of business owners to use their gut feeling are economically significant. We interpret the impact of VCs and PEs on gut feeling as evidence that business owners are less likely to use their gut feeling to make their capital budgeting decision when they receive funding from more sophisticated institutional investors. In other words, funding sources have a significant influence on the business owners’ likelihood to adopt less or more sophisticated capital budgeting methods. The study also finds that firms with annual revenue between $1 and $5 million are 14.2% more likely to use gut feeling than the firms with annual revenue below $1 million.
Next, the study focuses on the probability of business owners to use market analysis for their capital budgeting decision. Market analysis represents a capital budgeting process that is based on an assessment of whether there currently exists or will exist a market for a company’s products and/or services, the potential size of the market, and how the company can significantly penetrate that market. It is considered a qualitative measure of capital budgeting since it only evaluates market positioning without taking into account the project’s expected future cash flows and its risk adjusted return. However, market analysis is considered a more sophisticated method than gut feeling. Comparing the market analysis result with the result from gut feeling, this study finds that the likelihood of business owners to use market analysis increases by 15.1% if business owners prepare an annual budget whereas having an annual budget does not affect the likelihood to use gut feeling. The impact for planning is similar for both market analysis and gut feeling. However, the impact of outside directors is significantly more positive for market analysis than gut feeling. We interpret this latter finding as evidence that outside board of directors provide their expertise to enhance the level of sophistication of capital budgeting methods that the business owners are likely to adopt.
The impact of financing from family and friends on the likelihood of business owners to use market analysis is less significant compared to gut feeling. We interpret this result as evidence that business owners who receive funding from family and friends are more likely to use gut feeling compared to market analysis. On the other hand, business owners are 12.6% more likely to adopt a market analysis if they currently receive funding from banks (senior lenders). Again, we find evidence that funding sources have a significant influence on the business owners’ likelihood to adopt more or less sophisticated capital budgeting methods. This study also finds that firms in the technology industry tend to use market analysis for their capital budgeting decisions. This may be due to the characteristics of the technology industry that make it difficult for business owners to project their future cash flows from new innovations in this line of business. Therefore, the market analysis method is preferred.
The last 3 columns of Table 6 present the logistic regression results of probabilities for business owners to adopt more sophisticated capital budgeting techniques starting from the least quantitative method—payback period—to more quantitative methods such as the internal rate of return (IRR) and the discounted cash flows (DCF). The likelihood of business owners to adopt payback period increases by 15.2% if the owners engage in planning beyond the current year. However, planning becomes a less relevant factor in determining the likelihood of business owners to adopt IRR and DCF methods when businesses have an annual budget and solid growth strategy. We interpret these finding as evidence that
82 Journal of Accounting and Finance vol. 12(5) 2012
the likelihood of using IRR and DCF methods increases when business owners have more certainty about future cash flows of their business opportunities.
The results also indicate that an outside board increases the likelihood of business owners to use payback period, IRR and DCF. The magnitude of the slope coefficient for an outside board gradually increases the likelihood of business owners to adopt the payback period, IRR, and DCF by 17.6%, 20.1%, and 23.8% respectively. This indicates that the outside board members provide expertise that increases the likelihood of business owners to use more quantitative methods such the internal rate of return (IRR) and the discounted cash flows (DCF). On the contrary, the likelihood of business owners to use payback period increases as the business owners receive current funding from senior lenders (banks).
When we examine the firms’ characteristics, we find that firms with annual net sales between $1 million and $5 million are more likely to use payback period compared to firms with annual net sales below $1 million. Business owners for C-Corporation firms are less likely to adopt the payback period and IRR methods by 10.7% and 18% respectively. And business owners in the finance industry are 25% more likely to use the IRR method for their capital budgeting decision. Finally, throughout all the regression results, business owners’ capital budgeting decisions are not affected by their funding sources if they receive capital from angel investors, mezzanine, and hedge fund.
CONCLUSIONS
Slee (2004) points out that private business owners do not solely rely on venture capital, banks, and private equity for their funding needs. Our current literature, which focuses on the role of venture capital, banks, and private equity funds, has overlooked the importance of other private capital markets participants, such as family and friends, who played a more important role in providing capital for private businesses in recent years. The Pepperdine Private Capital Markets Project attempts to capture more complete private capital market participants as it includes asset based lenders, mezzanine funds, angel investors, and family and friends, in addition to senior lenders (banks), private equity, and venture capital firms.
Based on the survey results from business owners during the spring of 2010, this study provides a description of the private capital markets and insights into characteristics of private businesses, performance, source of capital, cost of capital, and capital budgeting decision making. The majority of business owners (participants) represent four important industries: service, manufacturing, finance, and technology. The sizes of their businesses are between small and medium size and their legal forms are general partners, C-Corporation or S-Corporation. The majority of funding comes from business owners’ family and friends, senior lenders (banks), and angel investors rather than from sophisticated institutional investors such as venture capital, private equity, mezzanine, and hedge funds.
When we examine the capital structure and cost of capital from a sample of survey participants, we find on average their capital structure consists of debt of 25%, pretax cost of debt of 8.4%, cost of equity of 22%, effective corporate tax rate of 32%, and a weighted average cost of capital of 16.67%. The weighted average cost of capital for privately held firms are over twice as much as the average cost of capital for publicly traded firms in the Valueline database (Damodaran, 2010).
Looking at the business owners’ capital budgeting decisions, we find that qualitative methods such as “gut feeling” and market analysis play important roles and are contrasted to quantitative (standard) capital budgeting methods such as payback period, internal rate of return (IRR), and discounted cash flow (DCF) techniques. We further examine factors that influence business owners’ decisions to utilize qualitative capital budgeting methods such as gut feeling and market analysis and more quantitative methods such as payback period, IRR, and DCF. This study finds that both internal financial management such as planning, having an outside board of directors, having an annual budget, and having a solid growth strategy influences business owners’ likelihood to use qualitative versus quantitative capital budgeting methods. Additionally, current funding sources that business owners employ such as family and friends, venture capital, private equity, and banks also influence the likelihood of using qualitative versus quantitative capital budgeting methods. This study explains that the shift in capital budgeting methods
Journal of Accounting and Finance vol. 12(5) 2012 83

that business owners are more likely to adopt can be explained in part due to the change in their primary sources of capital, especially after recent financial crisis.
This study attempts to provide new depictions for characteristics of private capital markets from a private business owners’ survey. It is subject to weaknesses of standard survey studies. Graham and Harvey (2001) point out that survey studies suffer from two obvious weaknesses: a survey study measures survey participants’ beliefs that do not necessarily reflect their actions; and a survey study may also suffer from a sample selection bias where respondents who filled out the survey may not represent the whole population of private business owners. Comparing our results with Robb and Robinson (2010), we realize that survey results appear to vary across different time periods. Also, not all survey participants completely filled out our survey questionnaire. Therefore, this study is limited by the data availability from the survey. As the Pepperdine Private Capital Markets Project surveys continue to evolve in future years, we will attempt to provide more robust insights on those factors that influence the firms’ capital structure and cost of capital, and how cost of capital influences their capital budgeting decisions. We thank Nancy Ellen Dodd for her invaluable editing assistance. Harjoto acknowledges the release time support from the Julian Virtue Professorship endowment and the Rothschild Fellowship and Paglia acknowledges the support from the Denney Professorship. REFERENCES Berger, A.N. & Udell, G.F. (1998). The Economics of Small Business Finance: The Roles of Private Equity and Debt Markets in the Financial Growth Cycle. Journal of Banking and Finance, 22, 613-673. Bierman, H. (1983). Capital Budgeting in 1992: A Survey. Financial Management, 22, (3), 24. Cole, R. (1998). The Importance of Relationships to the Availability of Credit. Journal of Banking and Finance, 22, 959-997. Damodaran, A. (2010). Cost of Capital by Sector. NYU Stern School of Business. Retrieved September 9, 2011, from, http://pages.stern.nyu.edu/~adamodar/New_Home_Page/datafile/wacc.htm Danielson, M.G. & Scott, J.A. (2006). The Capital Budgeting Decisions of Small Businesses. Journal of Applied Finance, 16, (2), 45-56. Ernst and Young LLP. (2010). Global Private Equity Watch. Retrieved May 14, 2010, from, http://www.ey.com/Publication/vwLUAssets/2010-global-private-equity-watch-April-2010/$FILE/2010_global_private_equity_watch_April_2010.pdf Gompers, P. & Lerner, J. (1999a). Conflict of Interest in the Issuance of Public Securities: Evidence from Venture Capital. Journal of Law and Economics, 42, 1-28. Gompers, P. & Lerner, J. (1999b). What Drives the Venture Capital Fundraising? NBER working paper No. 6906. Retrieved August 27, 2010, from, http://www.nber.org/papers/w6906 Gompers, P. & Lerner, J. (1999b). The Venture Capital Cycle, Cambridge, MA: The MIT Press. Graham, J.R. & Harvey, C.R. (2001). The Theory and Practice of Corporate Finance: Evidence from the Field. Journal of Financial Economics, 60, 187-243. Graham, J.R. & Harvey, C.R. (2002). How Do CFOs Make Capital Budgeting and Capital Structure Decisions? Journal of Applied Corporate Finance, 15, (1), 8-25.
84 Journal of Accounting and Finance vol. 12(5) 2012

Graham, J.R., Harvey, C.R. & Puri, M. (2010). Capital Allocation and Delegation of Decision-Making Authority Within Firms. Working paper, Duke University. Retrieved July 6, 2010, from, http://papers.ssrn.com/sol3/papers.cfm?abstract_id=1527098 International Financial Services London (IFSL) Research Private Equity 2008 and 2009. Retrieved August 12, 2010, from, http://www.ifsl.org.uk/. Kaplan, S. & Schoar, A. (2005). Private Equity Performance: Returns, Persistence and Capital Flows. Journal of Finance, 60, 1791-1823. Lerner, J., Schoar, A. & Wong, W. (2007). Smart Institutions, Foolish Choices: The Limited Partner Performance Puzzle. Journal of Finance, 62, (2), 731-764. Ljungqvist, A. & Richardson, M. (2003). The Investment Behavior of Private Equity Fund Managers. Working paper No. SC-AM-03-12, New York University. Metrick, A. (2007). Venture Capital and the Finance of Innovation, Hoboken, NJ: John Wiley & Sons Inc. Metrick, A. & Yasuda, A. (2010). The Economics of Private Equity Funds. Review of Financial Studies, 23, (6), 2303-2341. Moore, J. & Reichert, A. (1983). An Analysis of the Financial Management Techniques Currently Employed by Large U.S. Corporations. Journal of Business Finance and Accounting, 10, (4), 623-645. Paglia, J. (2010). Pepperdine Private Capital Markets Project, Survey Report Volume II. Graziadio School of Business and Management, Pepperdine University, Winter/Spring 2010. Petersen, M.A. & Rajan, R.G. (1994). The Benefits of Lending Relationships: Evidence from Small Business Data. Journal of Finance, 49, (1), 3-37. Phalippou, L. & Gottschaig, O. (2009). The Performance of Private Equity Fund. Review of Financial Studies, 22, (4), 1747-1776 Phalippou, L. (2010). Private Equity Funds’ Performance, Risk and Selection. Working paper, University of Amsterdam, June 2010. Retrieved August 12, 2010, from, http://papers.ssrn.com/sol3/papers.cfm?abstract_id=1636190 Pike, R. (1998). A Longitudinal Survey on Capital Budgeting Practices. Journal of Business Finance and Accounting, 23, (1), 79-92. Robb, A.M. & Robinson, D.T. (2010). The Capital Structure Decisions on New Firms. NBER working paper 16727, August 2010. Retrieved August 31, 2010, from, http://www.nber.org/papers/w16272 TheCityUK Research Private Equity. (2010). Retrieved May 14, 2010, from, http://www.TheCityUK.com Slee, R.T. (2004). Private Capital Markets: Valuation, Capitalization, and Transfer of Private Business Interests, Hoboken, NJ: John Wiley & Sons Inc.
Journal of Accounting and Finance vol. 12(5) 2012 85