cost estimation of building construction projects in gaza strip … · 2017-12-23 ·...
TRANSCRIPT

The Islamic University – Gaza
Deanery of Graduate Studies
Faculty of Engineering
Civil Engineering Department
Engineering Projects Management
ــزةــــــغـ -ة ـــــــــــة اإلســــالميــــــــامعـــــــــالجــ العليا والدراسات العلمي البحث شئون
ةـــــــــــــــــــــــــــــــــــــــــــــــــــة الهنـــــدســـــــــــــــــــــــــــــيــــــــــكـــل ةــــــــــــــة المــــدنيــــــــــــــــسـدـــــــــم الهنـــــــــــــــقســــــــ
ـةـــــدسيـــــــــهنــــــات الــــــــــروعــــــإدارة المشـ
Cost Estimation of Building Construction Projects in Gaza Strip
Using Support Vector Machines Model (SVM)
الناقل الدعم االتتقدير تكلفة مشاريع المباني االنشائية في قطاع غزة باستخدام نموذج
Researcher
Tareq M. Rayyan
Supervised by
Dr. Nabil EL Sawalhi
A Thesis Submitted in Partial Fulfillment of the Requirement for the Degree of
Master of Science in Civil Engineering Gaza, Palestine
2016 – 1437

إقــــــــــــــرار
أنا الموقع أدناه مقدم الرسالة التي تحمل العنوان:
Cost Estimation of Building Construction Projects
in Gaza Strip Using Support Vector Machines
Model (SVM)
تقدير تكلفت هشاريع الوباني االنشائيت في قطاع غزة باستخدام نووذج االث الدعن الناقل
باستثناء ما تمت اإلشارة أقر بأن ما اشتممت عميو ىذه الرسالة إنما ىو نتاج جيدي الخاص،إليو حيثما ورد، وأن ىذه الرسالة ككل أو أي جزء منيا لم يقدم من قبل اآلخرين لنيل درجة أو
لقب عممي أو بحثي لدى أي مؤسسة تعميمية أو بحثية أخرى. وأن حقوق النشر محفوظة فمسطين- جامعة اإلسالمية غزةلم
Declaration
I hereby certify that this submission is the result of my own work, except
where otherwise acknowledged, and that this thesis (or any part of it)
has not been submitted for a higher degree or quantification to any other
university or institution. All copyrights are reserves toIslamic University
– Gaza strip paiestine
:Student's name طارق ريان اسم الطالب:
:Signature طارق ريان التوقيع:
:Date 22/11/2012 التاريخ:


I
بسم هللا الرحمن الرحيم
نك إا ال علم لنا اال ما علمتن كق الوا سبحان" "أنت العليم الحكيم.
صدق هللا العظيم. سورة البقرة - 32اآلية

II
DEDICATION
I dedicate this research
To the spirit of my father,
To My mother for her endless support,
To my dearest brothers, and sisters, colleagues and friends, for their
sustainable support,
To my wife for her unlimited encouragement,
To my children who, were, missing my direct care during my study,
Hoping I have made all of them proud of me.
Tareq M. Rayyan
April, 2016

III
ACKNOWLEDGMENTS
First of all, all thanks and appreciations to Allah for his unlimited blessings and for
giving me the ISLAM and the strength to complete this thesis.
I wish to express my profound gratitude to Dr. Nabil EL-Sawalhi for his continued
guidance, supervision, constant encouragement, and comments throughout the course
of this research. His dedication to helping me succeed is deeply appreciated.
I am highly indebted to the Construction Management Teaching Staff of the Islamic
University for their support and encouragement.
Special thanks to all friends and colleagues especially Eng. Mohammed Mady, Eng.
Salah Tayeh,and Eng. Omar Shehatto, for their helping and advices during the study.
My grateful thanks to all contractors, and engineers who participated in filling
questionnaires and provided important information for this study.
IV
ABSTRACT
Construction industry is considered an important sector for the development in Gaza
Strip. Estimating process is an important element of the construction industry. Early
stage cost estimate plays a significant role in the success of any construction project.
The research aims to predict the parametric cost estimation in construction building
projects in Gaza Strip using support vector machine model.
This research has been conducted through literature reviews of the cost estimating
process, followed by a field survey done by structured interviews to define the factors
which effect the parametric cost estimation of building construction projects.
The study shows that nine factors are affecting construction cost. The main factors are
the area of typical floor, numbers of stories and the building type. Eighty case studies
from real executed construction projects in Gaza Strip were collected to build up SVM
model.
Neurosolution software version 6.07 was used to train the models. The results of the
trained models indicated that SVM reasonably succeeded in estimating the cost of
building projects without the need for more detailed drawings. The average error of test
dataset for the adapted model was 2.3% which is largely acceptable.
One of the main recommendations of this research is to join the developed model with
cost index to give an accurate estimate in any time. In addition, it encourages all parties
involved in construction industry to pay more attention for developing model in cost
estimation by archiving all projects data, and conducting more studies and workshops
to obtain maximum advantage of this new approach.

V
ملخص الدراسة
التكلفة من في قطاع غزة, وتعتبر عملية تقديرللتطويريعتبر قطاع صناعة اإلنشاءات من القطاعات الهامة
دورا هاما في تقدير التكلفة للمشاريع اإلنشائية في المراحل المبكرة يلعبأهم عناصر صناعة اإلنشاءات.
نجاح أي مشروع إنشائي.
استخدام بب التكاليف لمشاريع التشييد في قطاع غزة إلى تطوير نموذج لتقدير حسا يهدف هذا البحث
نطق الغامض.الم
كلفة, تبع ذلك اعتمد البحث على مراجعة الدراسات السابقة في المواضيع ذات العالقة بعملية تقدير الت
عاريلمشا تقدير حساب التكلفة في ثر علىلتحديد العوامل التي تؤ المقابالت إجراءوبحث ميداني
.االنشائية
مل هي مساحة تكلفة اإلنشاءات, واهم هذه العواة عوامل تؤثر على تسعلقد أوضحت الدراسة بأنه يوجد
م تنفيذها في تمشروع من المشاريع التي 80تم جمع وقد .الطابق المتكرر و عدد الطوابق و نوع المبنى
.الغامض المنطق نموذج بناء أجل من قطاع غزة
نموذج . وقد أظهرت النتائج أن الغامض المنطق نموذج لتطوير تم استخدام برنامج نيوروسوليوشن
لخطأ لمجموعة وكان متوسط االمنطق الغامض لديه القدرة على إعطاء نتائج مقبولة عند تقديره للتكلفة,
. وهي نسبة مقبولة الي حد كبير% 2.3من المشاريع
خصص في متكان من التوصيات األساسية لهذا البحث, تشجيع المقاولين المحليين القتناء برنامج محوسب
تقليل األخطاء وتقدير التكلفة و استخدامه في تقدير األعمال للحصول على تقدير أدق للتكلفة وتوفير الوقت
جراءوإ المشاريع، بيانات جميع أرشفة طريق عن وذلك التكاليف وإعطاء فرصة أفضل للفوز بالعطاءات
.يدالجد النهج هذا من ستفادةلال لالعم وورش الدراسات من المزيد

VI
TABLE OF CONTENTS
Dedication .............................................................................................................................. II
Acknowledgments ................................................................................................................ III
Abstract……………. ............................................................................................................ IV
List of Tables ........................................................................................................................ IX
List of Figures ........................................................................................................................ X
1 CHAPTER 1: Introduction .............................................................................................. 1
1.1 Background and Rationale ......................................................................................................... 1
1.2 Problem statement ...................................................................................................................... 2
1.3 Research Aim ............................................................................................................................. 3
1.4 Research Objectives ................................................................................................................... 3
1.5 Research Scope and Limitation .................................................................................................. 3
1.6 Methodology Outline ................................................................................................................. 3 1.6.1 Literature Review........................................................................................................ 3 1.6.2 Data Collection ........................................................................................................... 4 1.6.3 Design and Models Development ............................................................................... 4 1.6.4 Conclusion, Recommendations And Writing Up ........................................................ 4 1.6.5 Research Layout ......................................................................................................... 4
2 Chapter 2: Literature Review .......................................................................................... 6
2.1 Introduction ................................................................................................................................ 6
2.2 Definition of Cost Estimating .................................................................................................... 7
2.3 The Purpose of Cost Estimating ................................................................................................. 8
2.4 The Importance of Cost Estimating ........................................................................................... 9 2.4.1 Estimator Responsibility ........................................................................................... 10 2.4.2 Estimator Skills ......................................................................................................... 10
2.5 Types of Construction Cost Estimates ..................................................................................... 11
2.6 Estimating Process ................................................................................................................... 13
2.7 Accuracy of Cost Estimates ..................................................................................................... 14 2.7.1 Factors Affecting the Accuracy of Cost Estimates .................................................... 15 2.7.2 Common Errors and Omissions in Cost Estimation ................................................. 16
2.8 Classification of Construction Costs ........................................................................................ 17 2.8.1 Material Cost ............................................................................................................ 18 2.8.2 Labor Cost ................................................................................................................ 18 2.8.3 Equipment Costs ....................................................................................................... 18 2.8.4 Overheads ................................................................................................................. 19 2.8.5 Markup ...................................................................................................................... 19
2.9 Methods of Cost Estimation ..................................................................................................... 20 2.9.1 Quantitative and Qualitative Technique ................................................................... 20 2.9.2 Preliminary and Detailed Techniques ...................................................................... 21 2.9.3 Traditional and Artificial Intelligence Based Techniques ........................................ 21
2.10 Traditional Techniques............................................................................................................. 21 2.10.1 Artificial Intelligence-Based Techniques .................................................................. 22
2.11 Support Vector Machines (SVM) ............................................................................................ 22 2.11.1 Support vector machines (SVM) and neural network architecture (ANN) ............... 23

VII
2.11.2 The using of support vector machines in construction ............................................. 23
2.12 Construction Cost Estimating Previous Researches ................................................................. 24
3 CHAPTER 3: METHODOLOGY ................................................................................. 31
3.1 Introduction .............................................................................................................................. 31
3.2 Research Strategy ..................................................................................................................... 31
3.3 Research Design ....................................................................................................................... 32
3.4 Research Population and Sample Size ..................................................................................... 34
3.5 Research Location .................................................................................................................... 36
3.6 Limitation of the Research ....................................................................................................... 36
3.7 Defining the Factors Affecting Cost Estimating Project in Gaza Strip .................................... 36
3.8 Structured Interviews ............................................................................................................... 37
3.9 Questionnaire Design ............................................................................................................... 38
3.10 Reliability and Validity of Research ........................................................................................ 39
3.11 Development of the Research Model ....................................................................................... 40
3.12 Performance Measures ............................................................................................................. 40 3.12.1 Mean Square Error (MSE): ...................................................................................... 40 3.12.2 Normalized Mean Square Error (NMSE): ................................................................ 41 3.12.3 Correlation Coefficient (r): ...................................................................................... 41 3.12.4 Mean Absolute Error (MAE): ................................................................................... 42 3.12.5 Mean Absolute Percentage Error (MAPE): ............................................................. 42 3.12.6 Accuracy Performance (AP): ................................................................................... 43
4 CHAPTER 4: Data Collection and Results .................................................................. 44
4.1 Introduction .............................................................................................................................. 44
4.2 Factors affecting cost estimate in building projects ................................................................. 44
4.3 Questionnaire Analysis ............................................................................................................ 44
4.4 Part One: General Information ................................................................................................. 44 4.4.1 Classification of contracting companies according to PCU .................................... 44 4.4.2 The position of officer who fills the questionnaire ................................................... 45 4.4.3 Number of company's employees .............................................................................. 45 4.4.4 Number of projects executed in the last five years ................................................... 46 4.4.5 The value of projects executed in the last five years ................................................. 46 4.4.6 The type of implemented projects ............................................................................. 46
4.5 Part two: Factors affecting on cost estimate for construction project in Gaza Strip ................ 47 4.5.1 Factors related to structural (skeleton) group ......................................................... 47 4.5.2 Factors related to external group ............................................................................. 48 4.5.3 Factors related to finishing group ............................................................................ 48
4.6 Overall ranking of factors affecting on total building cost ...................................................... 49
4.7 Ranking of groups for factors affecting on total building cost ................................................. 50
4.8 Delphi Technique ..................................................................................................................... 50
4.9 Influential factors adopted in the research ............................................................................... 51
4.10 Real building projects in Gaza Strip (projects case studies) .................................................... 52
5 CHAPTER 5: Model Development ................................................................................ 57
5.1 Introduction .............................................................................................................................. 57
5.2 Select Application .................................................................................................................... 57
5.3 Model Limitations .................................................................................................................... 58
5.4 Model Implementation ............................................................................................................. 58

VIII
5.5 Training Models and Testing ................................................................................................... 63
5.6 Model cross-validation and testing .......................................................................................... 64
5.7 Model Results .......................................................................................................................... 65
6 CHAPTER 6: CONCLUSION AND RECOMMENDATIONS ................................. 69
6.1 Introduction .............................................................................................................................. 69
6.2 Conclusion ............................................................................................................................... 69
6.3 Recommendations .................................................................................................................... 70 6.3.1 Recommendations to Owners & Consultants ........................................................... 71 6.3.2 Recommendations to Contractors ............................................................................. 71 6.3.3 Recommendations to Government, Contractors' Union and Association of Engineers
72 6.3.4 Recommendations for Further Studies ..................................................................... 72
7 References ........................................................................................................................ 73

IX
LIST OF TABLES
Table 2-1: Conceptual and detailed cost estimates .................................................................. 13
Table 2-2: Possible estimating errors and possible procedures for minimizing the chances of
occurrence ................................................................................................................................. 16
Table 3-1: Factors affecting cost estimating of the construction building project .................. 36
Table 4-1: Classification of contracting companies................................................................. 45
Table 4-2: Position of respondent ............................................................................................ 45
Table 4-3: Number of company's employees .......................................................................... 45
Table 4-4: Number of executed projects .................................................................................. 46
Table 4-5: Value of executed projects ..................................................................................... 46
Table 4-6: Type of executed projects....................................................................................... 46
Table 4-7: Influence of skeleton factors on building cost........................................................ 47
Table 4-8: Influence of external factors on building cost ........................................................ 48
Table 4-9: Influence of finishing factors on building cost ....................................................... 48
Table 4-10: Overall ranking of factors affecting on total building cost .................................. 49
Table 4-11: Ranking factors affecting on total building cost among groups ........................... 50
Table 4-12: Influential Factors of building project Cost adopted in this research ................... 52
Table 4-13: Factors of collected real projects .......................................................................... 52
Table 5-1: Input limitations in model ...................................... Error! Bookmark not defined.
Table 5-2: Input and Ouput Factors ......................................................................................... 59
X
LIST OF FIGURES
Figure 2-1: Classification of construction costs .................................................................................... 18
Figure 3-1: Research methodology flowchart ....................................................................................... 34
Figure 5-1: Tag column of data as input parameter .............................................................................. 60
Figure 5-2: Tag column of data as desired parameter ........................................................................... 60
Figure 5-3: Sets of model building ....................................................................................................... 61
Figure 5-4: Building initial network ..................................................................................................... 62
Figure 5-5: Support vector machine (SVM) network ........................................................................... 62
Figure 5-6: Selecting the normalization limits of data .......................................................................... 63
Figure 5-7: Training options in Neurosolution ..................................................................................... 64
Figure 5-8: Comparison between actual and estimated payment delay risk for test set ....................... 66
Figure 5-9: Results of performance measurements according to the Neurosolution app ..................... 68

XI
LIST OF ABBREVIATIONS
AACE American Association of Cost Engineering
AI Artificial Intelligence.
ANN Artificial Neural Network.
AP Accuracy Performance.
CBR case-based reasoning (CBR)
CER Cost Estimate Relationship.
FL Fuzzy Logic
GA Genetic Algorithm.
GA Genetic algorithm
GNP Gross National Product
HVAC Heating, Ventilation and Air Conditioning
LR Linear Regression.
MAE Mean Absolute Error.
MAPE Mean Absolute Percentage Error.
MLP Multi-layer Perceptron.
MSE Mean Square Error.
NMSE Normalized Mean Square Error.
NN Neural Network.
PNA Palestinian National Authority
r Correlation factor.
SVM support-vector machines)
TAP Total Accuracy Performance.

XII
1
CHAPTER 1: INTRODUCTION
1.1 Background
Cost is one of the major criteria in decision making at the early stages of a building design
process. In today’s globally competitive world, diminishing profit margins and decreasing
market shares, cost control plays a major role for being competitive while maintaining high
quality levels. The cost of a building is impacted significantly by decisions made at the design
phase. While this influence decreases through all phases of the building project, the committed
costs increase (Gunaydın, 2004).
Due to the limited availability of information during the early stages of a project, construction
managers typically leverage their knowledge, experience and standard estimators to estimate
project costs. As such, intuition plays a significant role in decision making. Researchers have
worked to develop cost estimators that maximize the practical value of limited information in
order to improve the accuracy and reliability of cost estimation work and thus enhance the
suitability of resultant designs and project execution work (Cheng et al., 2010).
Effective project management techniques are important to ensure successful project
performance. A poor strategy or incorrect budget or schedule forecasting can easily turn an
expected profit into loss. Conceptual cost estimates are important to project feasibility studies
and impact on final project success. Such estimates provide significant information that can be
used in project evaluations, engineering designs, cost budgeting and cost management (Cheng
et al., 2010).
Trost and Oberlender (2003) concentrated more on improving prediction accuracy by deriving
four determinants influencing the accuracy of an early cost estimates. Following this, they
established support-vector machines model which derived significant relationship between
estimate accuracy and influencing factors such as basic process design, team experience and
cost information, time allowed to prepare the estimate, site requirements, and bidding and labor
climate .
Computers are expending increasingly into all aspects of daily life. The cheaper computer
hardware today has boasted the rush of using the computers. However, the accounting early
uses of computers by construction companies were limited to functions. With the advances in
micro-computing, increased knowledge of computer capabilities, and the development of user-
friendly software, computers have been used every day at construction to make quick and
2
accurate decisions through estimating software which have reduced the amount of manual work
necessary for preparing an estimate (Bhatnagar and Ghose, 2012).
As a result of the limited availability information during the early stages of a project
construction managers used their knowledge experience and standard estimators to estimate
project costs. Therefore, personal judgment plays a significant role in decision making.
Researchers have worked to develop cost estimators that improve the accuracy and reliability
of cost estimation work. Today, estimating technologies used by contractors vary tremendously
from contractor to contractor. Some might still be using simple tools such as paper and pencil,
while others are more technologically advanced and use computers for activities such as
quantity take off, calculations and estimating report generation and use digitizing tablets, others
used statistical methods to develop cost estimating models like regression models (Han et al.,
2008; Ganiyu and Zubairu, 2010). Artificial intelligence approaches are applicable to cost
estimation problems related to expert systems, case-based reasoning (CBR), Neural Networks
(NNs), Fuzzy Logic (FL), Genetic Algorithms (GAs) and derivatives of such (Cheng et al.,
2010). Many research studies have been done in this area; this research aim is to investigate
the potential use of support-vector machines (SVM) as a tool for cost estimation modeling.
1.2 Problem statement
An accurate estimation of construction cost is crucial in construction projects for budgeting,
planning, and monitoring for compliance with the client’s available budget, time and work
outstanding. In cost estimation, the experience of the estimator and the project information are
significant factors. Therefore, parametric cost estimation models are very useful in the early
stage of a project’s life cycle when little information is known about the project’s scope. These
parametric cost estimation models include historical data that are currently used in practice as
well as new data specific to a new project (Cavalieri et al., 2004).
In addition, A significant amount of time and money are necessary to calculate a cost estimate.
Data must be compiled and functions need to be deciphered in order to produce an estimate,
all of which require time and knowledge of materials, equipment, and processes. Therefore, it
is desirable to create a method that helps user with little knowledge of details of the construction
project to quickly create a cost estimate. This would allow cost estimates to be used more
frequently and in more aspects of a product’s development and manufacturing, producing a
more cost efficient part.
3
The main problem of the models is their requirement for deciding on the class of relations
between dependent variables and independent variable, in our case, between parameters and
project costs.
It is not always very easy to decide on the class of relation since there are many cost
components when you consider a project like mass housing.
1.3 Research Aim
The aim of this research is to develop an effective model for estimating cost for construction
building projects using support-vector machines technique (SVM). This model is able to help
parties involved in construction projects (owner, contractors, consultants, and others) in
obtaining a cost estimate at the early stages of projects with limited available information and
within possible time and high accuracy.
1.4 Research Objectives
The principal objectives of this study are:
1) Identify the most prominent parameters that affect the estimating the building project
cost in Gaza Strip.
2) Develop a model for cost estimation using support-vector machines (SVM).
1.5 Research Scope and Limitation
This research focuses on buildings sector of construction industry in Gaza Strip, The data was
be collected for building projects that have been implemented and finished in Gaza between
2009 and 2013, which contain the actual costs of these projects and the main parametric factors
that affect the cost of the projects, then use these data in constructing a model for estimating
buildings projects.
1.6 Methodology Outline
The approach used to achieve the study objectives can be summarized in the following steps:
1.6.1 Literature Review
Conduct a literature review of previous studies that are related to construction cost estimate
and paying special attention of using SVM.
4
1.6.2 Data Collection
Proprietary data obtained from a lot of construction projects which implemented in Gaza Strip
in building sector, in addition Delphi technique was used. This large collection of data will
provide a rich source of information and previous experience to be used in the following stages
as training.
Each project must have a cost estimate and actual budget with time scheduling in defined
specifications with final report of the project hand over. This detailed data is very useful in
determined the factors and the support-vector machines is a probabilistic technique in which
several independent variables are used to predict some dependent variable of interest.
1.6.3 Design and Models Development
This phase covers selecting the application, choosing models types, and design models. In
addition to, implement models and trained them for many times with check the validity.
Furthermore includes testing models and discussing the results carefully.
1.6.4 Conclusion, Recommendations and Writing Up
This stage involves writing up the content of the dissertation and should cover the chapters
proposed in the following section, and put the research in the final layout document under the
reliable form of the Islamic University of Gaza templates, with all copies needed in soft and
print out form.
1.7 Research Layout
This research included six chapters explained as follow:
Chapter (1) Introduction: A general idea for this research was given in this chapter
along with research statement of problem, aim, objectives, limitation, methodology
outlined and thesis structure.
Chapter (2) literature Review: This chapter presents a literature review of past
research studies in parametric cost estimating, ANN and SVM applications in
construction management and related fields.
Chapter (3) Research Methodology: The adopted methodology in this research was
presented in this chapter including the data-acquisition process of influential factors
that relate to cost estimating of building projects and historical data of building projects
that necessary for the proposed model.
5
Chapter (4) Data Collection: Presents statistical analysis for surveying questionnaire,
Delphi technique which consist of three phases interviews, questionnaire, expert focus
group to get the most factor affecting on cost for building projects in Gaza strip
Chapter (5) Models Development: This chapter contains the application, which was
selected, types of models chosen and displays of the structure design. Moreover, it is
including the model implementation, training and validation also optimizing the error
and testing the models. Finally it is presents the results discussion.
Chapter (6) Conclusion and Recommendations: Finally, this chapter outlines the
conclusions and recommendations of this study. It also includes the recommendations
for further studies.
6
2 CHAPTER 2: LITERATURE REVIEW
2.1 Introduction
Cost estimating is an essential part of construction projects, where cost is considered as one of
the major criteria in decision making at the early stages of building design process (Gunaydın
& Dogan, 2004). The accuracy of estimation is a critical factor in the success of any
construction project, where cost overruns are a major problem, especially with current
emphasis on tight budgets. Indeed, cost overruns can lead to cancellation of a project. In some
cases, a potential overrun may result in changing a project to a design-to-cost task (Feng et al.,
2010).
Subsequently, the cost of construction project needs to be estimated within a specific accuracy
range, but the largest obstacles standing in front of a cost estimate, particularly in early stage,
are lack of preliminary information and larger uncertainties as a result of engineering solutions.
As such, to overcome this lack of detailed information, cost estimation techniques are used to
approximate the cost within an acceptable accuracy range.
A good estimate depends on many factors including time given to the estimator, estimator’s
experience, and a wide range of assumptions regarding the project (Jrade and Alkass, 2007).
Construction cost estimating involves collecting, analyzing, and summarizing all available data
for a project (Holm et al., 2005).
Researchers have worked to develop cost estimators that maximize the practical value of
limited information in order to improve the accuracy and reliability of cost estimation work
and thus enhance the suitability of resultant designs and project execution work (Cheng et al.,
2010). The purpose of pre-tender price estimating is to provide an indication of the probable
costs of construction at a very early stage in the life of a construction project. It is one of the
most important factors influencing the client’s decision to build or not.
Cost models provide an effective alternative for conceptual estimation of construction costs.
However, development of cost models can be challenging as there are several factors
affecting on project costs. There are usually various and noisy data available for modeling
(Sonmez, 2004).
This chapter will focus on conceptual estimates, the information needed for a preliminary
estimate. Today’s conceptual estimating technologies and the difficulties associated with
conceptual estimates are also reviewed.

7
2.2 Definition of Cost Estimating
Cost estimating has different definition, Carr (1989) defines estimate is to produce a statement
of the approximate quantity of material, time, or cost to perform construction. On the other
hand, Steward (1991) reported a definition of cost estimation from the Society of Cost
Estimating and Analysis (SCEA), as "the art of approximating the probable worth or cost of an
activity based on information available at the time". Also Gao (2009) said that cost estimating
combines science and art to predict the future cost of something based on known historical data
that are adjusted to reflect new materials, technology, software languages, and development
teams. Al Hamidi and Mohammed (2009); Butcher and Ahuja et al. (1994) gives another
definition which is, "the estimate at best is an approximation of the expected cost of the
project". Dysert (2006) defined a cost estimate as, "the predictive process used to quantify,
cost, and price the resources required by the scope of an investment option, activity, or project.
The output of the estimating process, the cost estimate, is typically used to establish a project
budget". While, Akintoye (2000) defined cost estimate as, "is crucial to construction contact
tendering, providing a basis for establishing the likely cost of resources elements of the tender
price for construction work". Turochy et al. (2001) distinct that cost estimation is the process
by which, based on information available at a particular phase of project development, the
ultimate cost of a project is estimated.
While Hendrickson (2000) specifies that are design, bid and control. Furthermore, he defines
that at the very early stage of design, the screening estimate or order of magnitude estimate is
made before the facility is designed, and therefore it relies on the cost data of similar facilities
built in the past. While preliminary or conceptual estimate is based on the conceptual design
of the facility at the state when the basic technologies for the design are known. Moreover, the
detailed or definitive estimate is made when the scope of work is clearly defined and the
completed plans and specification when they are ready for the owner to solicit bids from
construction contractors. Uppal (1997) quotes a definition of cost estimation from Association
for the Advancement of Cost Engineering (AACE) International define the cost estimation to
provide the basis for project management, business planning, budget preparation and cost and
schedule control. Included in these costs are assessments and an evaluation of risks and
uncertainties. ElSawy et al. (2011) consider cost estimation as the lifeblood of the firm and can
be defined as the determination of quantity and the prediction or forecasting, within a defined
scope, of the costs required to construct and equip a facility.
8
On the other hand, Dysert (2006) defined a cost estimate as, “is the predictive process used to
quantify, cost, and price the resources required by the scope of an investment option, activity,
or project.” While, Akintoye (2000) defined cost estimate as, “is crucial to construction contact
tendering, providing a basis for establishing the likely cost of resources elements of the tender
price for construction work”.
Association for the Advancement of Cost Engineering (AACE) International (2007) defined
the cost estimation to provide the basis for project management, business planning, budget
preparation and cost and schedule control. Included in these costs are assessments and an
evaluation of risks and uncertainties.
2.3 The Purpose of Cost Estimating
The cost estimate becomes one of the main elements of information for decision making at
preliminary stage of construction. Thus, Improved cost estimation techniques will facilitate
more effective control of time and costs in construction projects (Kim, et al., 2004).
Actually, estimates are prepared and used for different purposes including feasibility studies,
tendering phase, avoidance misuse of funds during the project, etc. The primary function of
cost estimation is to produce an accurate and a credible cost prediction of a construction project.
However, the predicted cost depends on the requirements of a client and upon the information
and data available (Elhag, et al., 2005). Antohie (2009) stated that the purpose of an estimate
is to postulate the costs required to complete a project in accordance with the contract plans
and specification (Cited in (Abdal-Hadi, 2010)).
The other functions of cost estimate; that it allows the designer and engineer to be aware of the
cost implications for the design decisions they make while still in the design phase. Reliable
cost estimates also allow management to make an informed decision as to what items will be
profitable and what items should be redesigned (Weckman, et al., 2010).
Moreover, cost estimate is of great importance in tendering phase, for example, Carty and
Winslow (cited in (ElSawy, et al., 2011)), have considered that cost estimate as a key function
for acquiring new contracts at right price and hence providing gateway for long survival in the
business. Therefore an accurate estimate of the bid price for a construction project is important
to securing the project contract and achieving a reasonable profit, where in practice, the
available bid-estimation time is often insufficient .
Therefore, conducting comprehensive and detailed cost estimations are not always possible;
taking into account, that detailed cost estimation process is both costly and time consuming.
9
Thus, a method that does not take much time and can approximate a proper bid price is one of
the strongest needs for contractors to help them in making bid-price decisions when the
available bid estimation time is insufficient (Wang, et al., 2012).
(Jitendra, et al., 2011) outlined the purpose of cost estimate through the following points:
Provides an assessment of capital cost for a specified piece of project.
Can help to classify and prioritize development projects with respect to an overall
business plan.
Forms the basis for planning and control by defining the scope of work and its
associated estimated cost.
Determine what resources to commit to the project with providing much of the basic
information (hours, resources, tasks, and durations) which is needed for preparing a
schedule.
Projects can be easier to manage and control when resources are better matched to real
needs.
Provides the financial input required to prepare a cash flow curve.
Customers expect actual development costs to be in line with estimated costs.
Is a catalyst for discussion, idea generation, team participation, clarity and buy-in, it
ties together much of the relevant project information within a simple document.
Can be used to assess the impact of changes and support re-planning.
The main purpose of cost estimation is to produce an accurate and reliable cost estimate of a
construction project. To reach this purpose the estimator have to look in deep to all factors that
affect the project cost and make sure from the information source.
2.4 The Importance of Cost Estimating
Most public owners are obliged to select the lowest bidder. In addition, the contractor must
successfully pass a qualification screening, in this situation the contractor must be prepared to
lower the bid cost, reduce the project completion date, or accept additional owner requirements,
but not to lose money. This can be achieved through a good cost estimation done by qualified
estimator. Cost estimates allow owners and planners to evaluate project feasibility and control
costs effectively in detailed project design work (Feng et al., 2010). Estimating purpose is to
provide information to construction decisions. Typical decisions include procurement and
pricing of construction, establishing contractual amounts for payment and controlling actual
10
quantities by project management (Carr, 1989). Dysert (2006) said that the cost estimate, is
typically used to establish a project budget, but may also be used for other purposes, such as:
• determining the economic feasibility of a project;
• evaluating between project alternatives; and
• providing a basis for project cost and schedule control.
While Gao (2009) believes that cost estimates have two general purposes:
(1) To help managers evaluate affordability and performance against plans, as well as the
selection of alternative systems and solutions.
(2) To support the budget process by providing estimates of the funding required to efficiently
executing a work.
2.4.1 Estimator Responsibility
Enshassi et al. (2007) said that the success or failure of a project is dependent on the accuracy
of several estimates throughout the course of the project, which can influence issues ranging
from project feasibility to profitability. It’s the estimator’s responsibility to assist the owner of
the project to plan and budget for the construction of the project (Choi, 2004). For early
estimates, the estimator is often working directly with the business unit in gaining alignment
on the project scope to be estimated. It is the estimator responsibility to make early
communication between the him and the project team or business unit on the expectations for
the estimate. It is the estimator responsibility to ensure that a project team understands the
information needs for the estimate, then ensure that a project team understands the information
needs for the estimate, then ensure that the information provided is suitable to produce the
quality of estimate desire (Dysert, 2005). The estimator responsibility is to produce an estimate
that is an accurate reflection of reality, before the completion of the design he must have the
vision to see beyond the obvious components and their primary costs of construction (Carr,
1989).
2.4.2 Estimator Skills
The best contractor in the area cannot make a profit or stay in business for long if taken
contracts are below the real cost, so to be a good competitors at the construction industry the
best contractor needs a good estimator. Dysert (2005), Popescu et al. (2003) and Carr (1989)
11
stated that an effective estimating organization requires highly knowledgeable personnel,
possessing technical skills. Moreover they define a set of skills as estimating core competencies
as follows:
1) Ability to read and understand contract documents, with special skills in reading
construction drawings for all specialties and related specifications.
2) Ability to accurately take off the quantities of construction work for which he or she is
preparing the detail estimate.
3) Ability to visualize the future building from drawings, which usually requires some
years of construction site experience.
4) Knowledge of arithmetic, basic geometry, and statistics.
5) Familiarity with estimating software in depth and with available building cost
databases.
6) Knowledge of building construction methods.
7) Knowledge of labor productivity, crew composition, and impacts of various forecasted
site conditions on crew output.
8) Possession of office managerial skills in organizing project-related cost information.
9) Ability to work under pressure and to meet all bid requirements and deadlines.
2.5 Types of Construction Cost Estimates
The type of estimate is a classification that is used to describe one of several estimate functions.
However, there are different types of estimates which vary according to several factors
including the purpose of estimates, available quantity and quality of information, range of
accuracy desired in the estimate, calculation techniques used to prepare the estimate, time
allotted to produce the estimate, phase of project, and perspective of estimate preparer
(Humphreys, 2004; Westney, 1997).
Generally, the main common types of cost estimates as Marjuki (2006) outlined are:
(1) Conceptual estimate: a rough approximation of cost within a reasonable range of values,
prepared for information purposes only, and it precedes design drawings. The accuracy range
of this stage is -50% to +100%.
(2) Preliminary estimate: an approximation based on well-defined cost data and established
ground rules, prepared for allowing the owner a pause to review design before details. The
accuracy range in this stage is -30% to +50%.
12
(3) Engineers estimate: Based on detailed design where all drawings are ready, prepared to
ensure design is within financial resources and it assists in
bids evaluating. The accuracy in this stage is -15% to +30%.
(4) Bid estimate: which done by contractor during tendering phase to price the contract. The
accuracy in this stage is -5% to +15%.
Halpin (cited in (Marjuki, 2006)) commented on previous four levels saying that as the project
proceeds from concept through preliminary, to final and bidding phase, the level of detail
increases, allowing the development of a more accurate estimate.
Some researchers classified estimate types into three main types as Samphaongoen (2010)
which are conceptual, semi-detailed, and detailed cost estimates types where the error
percentage ranges from 20% in conceptual stage to 5% in detailed estimate. However,
according to (AACE Recommended Practice and standard, 1990) there are three specific types
of estimate based on the degree of definition of a project are:
1) Order of magnitude range of accuracy is between (- 30% to +50% )
2) Budget estimate range of accuracy is between (- 15% to +30% )
3) Definitive estimate range of accuracy is between (- 5% to +15% )
Otherwise, Some researchers as Clough (1986), abbreviated previous types into two main
levels by merging conceptual and preliminary estimate into conceptual (preliminary) estimates,
and integrating engineers and bid estimates into detailed (definitive) estimates. In general,
building projects have two types of estimates: conceptual estimates (sometime called
preliminary, approximate or budget estimates) and detailed estimates (sometimes called final,
definitive, or contractor‟s estimates),
Conceptual estimate is normally produced with an accuracy range of – 15% to +30%, while
definitive estimates are detailed and normally produced within an accuracy range of –5% to +
15% (Enshassi, et al., 2007).
Table 2.1 summarizes the views of researchers about conceptual and detailed estimate
(Abdal-Hadi, 2010; Choon & Ali, 2008; Leng, 2005; Humphreys, 2004; Hinze, 1999; Al-
Thunaian, 1996;).

13
Table 2.1: Conceptual and detailed cost estimates
Detailed estimate Conceptual estimate
The scope of work is clearly
defined and the detailed
design is identified and a
takeoff of their quantities is
possible.
At the beginning of the project in
feasibility stage and no drawing and
details are available.
When
Detailed specifications,
drawings, subcontractors
are available.
No details of design and limited
information on project scope are
available.
Available of information
-5% to +15% -30% to +50% Accuracy range
Determine the reliable cost
of a project and make a
contract.
Determine the approximate cost of a
project before making a final
decision to construct it.
Purpose
Analysis of the method of
construction to be used,
quantities of work,
production rate and factors
that affect each sub-item.
Clear understanding of what an
owner wants and a good "feel" for
the probable costs.
Requirements
2.6 Estimating Process
Process is a series of steps or actions that produces a result. However, estimating is one of
many steps in the project management process, yet it is a process into itself, which has 11
steps as (Westney, 1997) stated as the following:
Step 1: Project Initiation: The purpose of project Initiation is to set a definition for overall
parameters of a project where the key of project success is beginning with a project
definition.
Step 2: Scope Definition: The purpose of definition the scope is to make an overview of the
project by providing design basis, detailed scope of work, work breakdown
structures, categorical breakdowns, code of accounts, and formatting required by
end users.
Step 3: Pre-Estimate Planning: It reduces the total effort that can be spent to develop the
estimate, it also provides associated information to other project participants.
14
Step 4: Quantity Take-Offs and Item Descriptions: Estimate items must be listed and
quantity take-offs start with estimate detail sheets for all work items in the project
(Popescu, et al., 2003).
Step 5: Data Sources and Costs: There are numerous sources that data can be obtained as
quotes, histories or commercially available data sources, or old estimates in the
estimating files.
Step 6: Summary and Cover Sheets: The main purpose of the summary sheet is to state the
total estimated cost for the project by providing a format for summarizing all the
project‟s direct costs and indirect costs. Where;
Direct cost: are mainly the materials, labor, plant, and subcontractor costs
involved in executing the works (Al-Shanti, 2003).
Indirect cost: are costs other than direct costs of construction activities, and they
are not physically traceable (Marjuki, 2006).
Step 7: Documentation and Checking: Documentation and checking is essential for verifying
that calculations are valid.
Step 8: Management Review: Management plays a key role in reviewing the estimate because
they are usually responsible for oversight of estimate preparation and they typically
have the insight and experience to know “what could go wrong”.
Step 9: Estimate Issue and Filing: The estimate numbering systems need to be well thought
out to be easyfor retrieval and comfortable for users.
Step 10: Cost Feedback Continual Improvement: This is step is very important to develop
the accuracy of the estimating data, estimator performance, and project histories.
2.7 Accuracy of Cost Estimates
Popescu et al. (2003) said that "all building estimates are probably either higher or lower than
the true cost. The word “accuracy” is defined as 1) the condition or quality of being true,
correct, or exact; precision; exactness. 2) The extent to which a given measurement agrees with
the standard value for that measurement. The conceptual estimate accuracy is defined as a
percentage difference between the engineering estimates compared to the price of the contract
award”. Accuracy is the degree to which a measurement or calculation varies to its actual
value; thus estimate accuracy is an indication of the degree to which the final cost outcome of
a project may vary from the single point value used as the estimated cost for the project.
Estimate accuracy is traditionally represented as a +/- percentage range around the point
15
estimate; with a stated confidence level that the actual cost outcome will fall within this range
(Dysert, 2006).
In early pre-construction stage, accuracy degree is relatively low because of insufficient
information. But, as project is going on and amounts of information are more gained, it is
generally improved (Han, et al., 2008).
2.7.1 Factors Affecting the Accuracy of Cost Estimates
A key factor for a successful project is the preparation of an accurate estimate, which can be
influenced by many factors that affecting this accuracy. Yong and Mustaffa (2012) find that
the financial capability of the clients is the major critical factor to the success of a construction
project in Malaysia. All three groups of participants in the industry opined that apart from
financial capability, “project stakeholders’ factors” such as competence, cooperation in solving
problems, commitment and communication are significant factors ensuring the success of a
construction project. External factors such as availability of resources and weather conditions
also played a crucial role in contributing to the success of a construction project. While
Odeyinka and Lowe, (2002) find the major factors at the UK are client's changes to initial
design, inclement weather, architect's variation to works, labour shortage, production target
slippage, delay in agreeing variation/ day works, delay in settling claims, problems with
foundations, underestimating project complexity, estimating error and undervaluation.
Various studies indicate to these factors affecting the construction cost estimation at Gaza Strip.
Abdal-Hadi (2010) conclude that the main factors affecting accuracy of pre-tender cost
estimate are: material (prices /availability /supply /quality /imports ), closure and blockade,
project team's experience in the construction type, the experience and skill level of the
consultant, clear and detail drawings and specifications, quality of information and flow
requirements, completeness of cost information, accuracy and reliability of cost information,
currency exchange fluctuation, and finally clear contract conditions. Enshassi et al. (2005)
concluded that the main factors affecting the accuracy of cost estimation are: location of the
project, segmentation of Gaza Strip and limitation of movements between areas, political
situation, financial status of the owner, increase in unit cost of construction materials,
experience of consultant engineer, clarity of project drawings, and clarity of information before
execution and tender currency.

16
2.7.2 Common Errors and Omissions in Cost Estimation
Developing a good cost estimate requires stable program requirements, access to detailed
documentation and historical data, well-trained and experienced cost analysts, a risk and
uncertainty analysis, the identification of a range of confidence levels, and adequate
contingency and management reserves. During the estimating process, errors occur. The
magnitude of these errors in an estimating department can spell disaster (GAO, 2009).
Popescu et al. (2003) organize the causes of possible estimating errors and omissions while at
the same time associating these with possible procedures for minimizing their chances of
occurrence during estimating and bid proposal preparation as shown in Table 2.2.
Table 2-2: Possible estimating errors and possible procedures for minimizing the chances of
occurrence
Errors Possible estimating errors Procedures for reducing errors
Ordinary
Arithmetic, location of decimal point
Standardization of estimating forms
Unit of measure, unit price relation
Errors in data input in estimating software Quiet environment and adequate work
station for estimators
Errors in transferring data from quantity
take off to cost summary
Shortcuts/rush/
short
time to prepare
the estimate
Estimating quantities Use of known average ratios to check
relationship between quantities Failure to check the estimate
Guessing the site overhead cost Review finished pricing sheets and
computer printouts Filling in for missing subcontractor costs
Carelessness
Omitting work items
Use summary checklist for each type
of building Omitting subcontractor quotes
Using obsolete productivity data files
No allowance for waste of materials List of subcontractor specialty for the
project No allowance for possible major

17
Errors Possible estimating errors Procedures for reducing errors
construction equipment breakdown
Omitting profit
Poor
estimating
management
Not attending the prebid conference Selection of the best estimator
Missing addenda New estimators in-house training
Missing the time/date of the bid Acquire state-of-the-art estimating
software
Incomplete proposal Updating internal files related to labor
productivity Not visiting the project site
Not reviewing historical Update subcontractor files
Not considering the time faster for pricing
labor and materials
Last call to A/E office to check
number of addenda issued
Not having a summary schedule Develop bid day checklist
2.8 Classification of Construction Costs
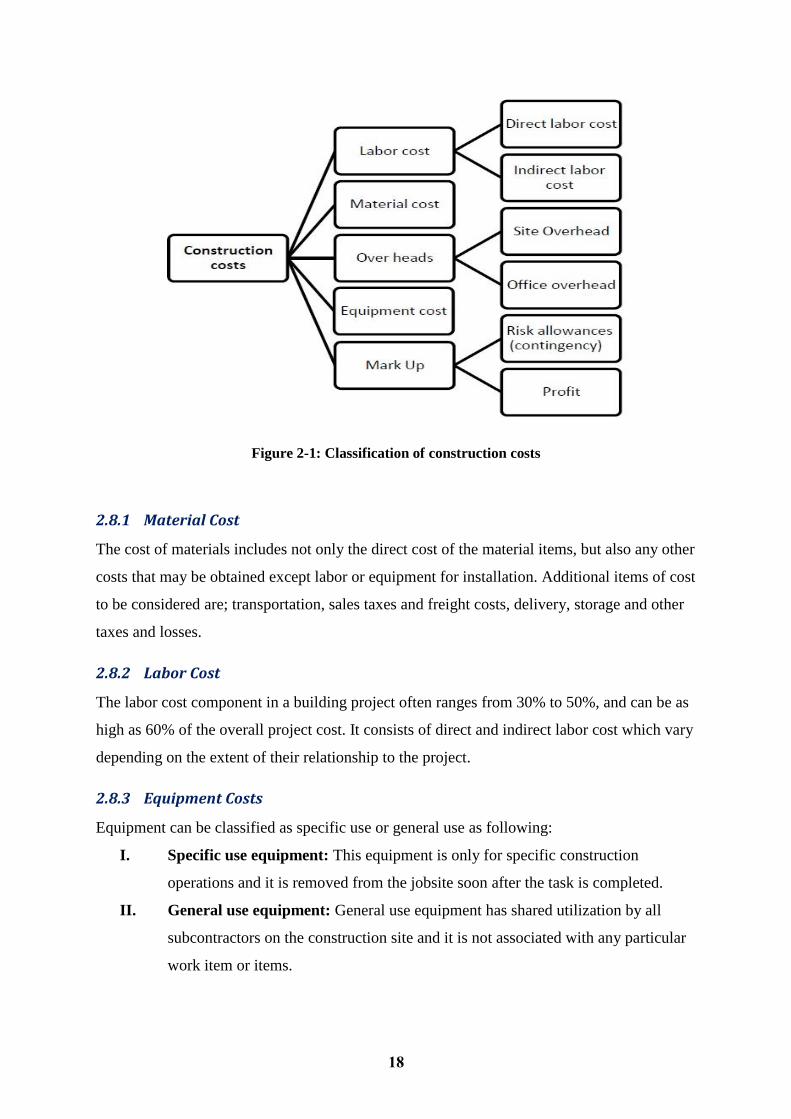
According to researches (Ostwald, 2001; Marjuki, 2006; Hinze, 1999); construction costs can
be classified into five types, which constitute the total cost of the project; they can be classified
as follows: material cost, labor cost, equipment cost, overheads, and markup. These types are
briefed in Figure 2.2 below.
18
Figure 2-1: Classification of construction costs
2.8.1 Material Cost
The cost of materials includes not only the direct cost of the material items, but also any other
costs that may be obtained except labor or equipment for installation. Additional items of cost
to be considered are; transportation, sales taxes and freight costs, delivery, storage and other
taxes and losses.
2.8.2 Labor Cost
The labor cost component in a building project often ranges from 30% to 50%, and can be as
high as 60% of the overall project cost. It consists of direct and indirect labor cost which vary
depending on the extent of their relationship to the project.
2.8.3 Equipment Costs
Equipment can be classified as specific use or general use as following:
I. Specific use equipment: This equipment is only for specific construction
operations and it is removed from the jobsite soon after the task is completed.
II. General use equipment: General use equipment has shared utilization by all
subcontractors on the construction site and it is not associated with any particular
work item or items.
19
2.8.4 Overheads
Overheads cost are construction costs of any kind that cannot be attributed to any specific
item of work. In general, Overheads are a significant item of expense and will generally run
from (5% to 15 %) of the total project cost, depending somewhat on where certain project
costs are included in the cost estimate.
2.8.5 Markup
In construction industry, markup is defined as the amount added to the estimated direct cost
and estimated job into overhead cost to recover the firm‟s main office allocated overhead
(general overhead) and desired profit. In general, markup can be classified into two main
categories as:
I. Risk allowance (Contingency): The contingency is a specific provision; it must be
included to account for unforeseen elements of cost (Ahuja et al. cited in (Al-Shanti, 2003)).
Ostwald (2001) stated that contingency is the amount of money added to an estimate to cover
unforeseen needs of the project, construction difficulties, or estimating accuracy. In addition,
he quoted the main items that make many chief estimators or contractor to executives add a
contingency to the estimate to cover one or possibly more of the following:
Unpredictable price escalation for materials, labor, and installed equipment for projects
with an estimated duration greater than 12 months;
Project complexity;
Incomplete working drawings at the time detail estimate is performed;
Incomplete design in the fast-track or design-build contracting approach;
Soft spots in the detail estimate due to possible estimating errors, to balance an estimate
that is biased low;
Abnormal construction methods and startup requirements;
Estimator personal concerns regarding project, unusual construction risk, and
difficulties to build; and
Unforeseen safety and environmental requirements.
Accordingly, contingency is not a potential profit and it should not be treated as an allowance.
It includes risk and uncertainty but explicitly excludes changes in the project scope (change
orders).
II. Profit: The amount of profit is generally computed as a percentage of the contract, or in
some cases, as a percentage of each item in the contract. Generally, the magnitude of desired

20
profit must be decided by the owner for each individual bid, depending on local market
conditions, competition, and the contractor‟s need for new work.
2.9 Methods of Cost Estimation
Cost estimation methods can be categorized into several techniques as;
2.9.1 Quantitative and Qualitative Technique
Qualitative approaches rely on expert judgment or heuristic rules, and quantitative approaches
classified into statistical models, analogous models and generative-analytical models (Duran,
et al., 2009; Caputo & Pelagagge, 2008). Quantitative approach has been divided into three
main techniques according to (Cavalieri, et al., 2004).
(a) Analogy-Based Techniques
This kind of techniques allows obtaining a rough but reliable estimation of the future costs. It
based on the definition and analysis of the degree of similarity between the new project and
another one. The underlying concept is to derive the estimation from actual information.
However, many problems exist in the application of this approach, such as:
The difficulties in the measure of the concept of "degree of similarity".
The difficulty of incorporating in this parameter the effect of technological progress
and of context factors.
(b) Parametric Models
According to these techniques, the cost is expressed as an analytical function of a set of
variables. These usually consist in some features of the project (performances, type of materials
used), which are supposed to influence mainly the final cost of the project (known also as "cost
drivers"). Commonly, these analytical functions are named "Cost Estimation Relationships"
(CER), and are built through the application of statistical methodologies.
(c) Engineering Approaches
In this case, the estimation is based on the detailed analysis and features of the project. The
estimated cost of the project is calculated in a very analytical way, as the sum of its elementary
components, comprised by the value of the resources used in each step of the project process
(raw materials, labor, equipment, etc.).
Due to this more details, the engineering approach can be used only when all the characteristics
of the project process are well defined.
21
2.9.2 Preliminary and Detailed Techniques
For both preliminary and detailed technique its own methods, especially since preliminary
methods are less numeric than detailed methods. However, most of researchers seek for perfect
preliminary method that gives good results. Ostwald (2001) outlined commonly methods that
are divided into two sets qualitative preliminary methods as opinion, conference, and
comparison similarity or analogy and quantitative preliminary methods as unit method, unit
quantity, linear regression...etc.
2.9.3 Traditional and Artificial Intelligence Based Techniques
In fact, most of earlier traditional methods fall into one of the following categories;
Time referenced cost indices, cost capacity factors, component ratio, and parameter
costs. However, many researches addressed these traditional parametric methods Mahamid &
Bruland, 2010 , Kim, et al., 2004).)
Recently new approaches were introduced in the last years based on the concept of
parametric models that based on computerized techniques such as artificial intelligence,
which attempt to simulate human intelligence such as Artificial Neural Network (ANN),
Fuzzy logic, etc., where it stills under research and development especially in construction
sector.
2.10 Traditional Techniques
For the past half century, the forecasting techniques that have been used usually depend on
quantitative approaches. They can be stochastic or deterministic. Examples of deterministic
methods are regression methods (linear regression and multiple regressions). Many researchers
used traditional parametric cost estimation techniques due to their simple formulations such as
(Khosrowshahi & Kakakt 1995, Skitmore & Thomas 2003, and Mahamid & Bruland, 2010).
Khosrowshahi and Kakakt (1995) adapted an improvised iterative technique for conducting the
multi-variety regression analysis by developing two separate models and proposed them for
the estimation of project cost and duration for the project definitions within the category of
housing projects in the U.K. The efficiency or accuracy of the models reflected on their
statistical performance, which is measured in terms of the adjusted coefficient of determination,
which is calculated to be 81.4% and 92.7% for cost and duration models respectively. Skitmore
and Thomas (2003) also conducted a similar effort, using standard regression and a forward
Cross Validation (C.V) regression analysis for the development of several models for
22
forecasting actual construction time and cost using a set of 93 Australian construction projects.
Mahamid & Bruland, (2010) developed a linear regression model to predict the cost of road
construction activities based on 100 set of data in the west Bank of Palestine. The prediction
models were developed for three major road construction activities, which are earthworks, base
course works, and asphalt works. Three groups of models for each activity were developed
based on used dependent variable; they are total cost of construction activity, cost per meter
length, and cost per meter square. The proposed independent variables are road length,
pavement width, base course width, terrain condition, soil drill ability, and soil suitability. The
coefficients of determination r2 for the developed models ranged from 0.57 to 0.96. These
research efforts, while were constrained by the limitations of traditional tools, provide insights
into the elements that need to be considered in the development of effective parametric models.
Traditionally, cost-estimating relationships are developed by applying regression analysis to
historical project information. The development of these models, however, is a difficult task
due to the inherent limitations of regression analysis (Hegazy & Ayed, 1998).
2.10.1 Artificial Intelligence-Based Techniques
Recently several attempts were made to introduce parametric models for cost estimation based
on various computerized techniques. Artificial Intelligence (AI) has been a rapidly growing
field of computer science that has direct applications in the construction industry (Ayed, 1997).
Neural Networks are applied to those fields of computer science attempt to simulate human
intelligence. Neural networks are among the current Artificial Intelligence research areas
(Dikmen & Akbiyikli, 2009).
2.11 Support Vector Machines (SVM)
A Neural Network training program, NeuroSolution, was used as a standalone environment for
support-vector machines (SVM) development and training. Moreover, for verifying this work
the plentiful trial and error process was performed to obtain the best model architecture.
The support-vector network is a new learning machine for two-group classification problems.
The machine conceptually implements the following idea: input vectors are non-linearly
mapped to a very high dimension feature space. In this feature space a linear decision surface
is constructed. Special properties of the decision surface ensures high generalization ability of
the learning machine. The idea behind the support-vector network was previously implemented
for the restricted case where the training data can be separated without errors (Cortes and
Vapnik, 1995).
23
The theory that underlies support vector machines (SVM) represents a new statistical technique
that has drawn much attention in recent years. This learning theory may be seen as an
alternative training technique for polynomial, radial basis function and multi-layer percept
classifiers. SVM are based on the structural risk minimization (SRM) induction principle (Lin,
2004).
The SVM deals with classification and regression problems by mapping the input data into
high-dimensional feature spaces. Its central feature is that the regression surface can be
determined by a subset of points or support-vectors (SV); all other points are not important in
determining the surface of the regression (Chen and Shih, 2006).
2.11.1 Support vector machines (SVM) and neural network architecture (ANN)
According to Chen and Shih (2006) the SVM, which originated as an implementation of
Vapnik’s Structural Risk Minimization (SRM) principle, is now being used to solve a variety
of learning, classification and prediction problems. In many ways, a SVM performs the same
function as neural network architecture (ANN). For example, when both the input and output
data are available (supervised learning in ANN), the SVM can perform classification and
regression; but when only the input data are available, it can perform clustering, density
estimation and principle component analysis. The SVM is more than just another algorithm. It
has the following advantages over an ANN:
1. It can obtain the global optimum.
2. The over fitting problem can be easily controlled.
3. Empirical testing has shown that the performance of SVMs is better than ANNs in
classification (Cai and Lin, 2002; Morris and Autret, 2001) and in regression (Tay and
Cao, 2011).
2.11.2 The using of support vector machines in construction
There are plenty of learning approaches for applications in the engineering fields. Scholars
have utilized approaches such as neural networks, case based reasoning, and self-organizing
feature map based optimization to deal with practical construction problems. SVM is one
popular type of learning approach which has been utilized in the engineering fields, especially
for pattern classification. Recently this approach has also been adapted for the construction
industry, for example, for the solving of cost estimates, contract risk, and construction safety
problems. Construction material suppliers are usually exposed to financial risks as a

24
consequence of a high debt capital structure and the nature of the material import business.
There is demand for a tool that is able to predict whether such a material supplier, based on its
financial status, should use derivatives to hedge financial risks. a prediction model using the
Support Vector Machine (SVM) was developed to determine whether employing risk hedging
based on derivatives usage would be beneficial. The SVM prediction model, based on the
kernel radial basis function and normalized data, yields a prediction accuracy rate of 80.65%.
The evaluation, using logistics and small sets of data. A ten financial determinates are proven
candidates for financial risk hedging. SVM prediction model appeared feasible for construction
material suppliers to apply the model (Chen and Lin, 2010).
2.12 Construction Cost Estimating Previous Researches
Several researches have studied the cost estimating in general, the accuracy of cost estimate,
factors affecting cost estimating and the computer applications in cost estimating.
Globally there are many researches such as Zheng and Guang (2012); Bhatnagar and Ghose
(2012); Bo and Albert (2011); Memon et al., (2010); Ray et al., (2010); Cheng et al., (2010)
and Adeli and Jiang, (2003).
Zheng and Guang (2012) said that the main factors influencing the construction engineering
cost in China are:
(1) Geological conditions of the engineering and hydrological geological conditions;
(2) Structural features of the building;
(3) Construction techniques and mechanical equipment;
(4) Influence of the construction unit.
In their study they found that the computational speed and accuracy were more significantly
improved by using the global random search capability of genetic algorithm and the learning
ability and robustness of neural network than the traditional methods.
While Bo and Albert (2011) studied the key parameters that measure the degree of project
complexity in China. They identified that the six key measures of project complexity include,
(1) building structure & function; (2) construction method; (3) the urgency of the project
schedule; (4) project size/scale; (5) geological condition; and (6) neighboring environment.
25
While Memon et al. (2010) studied the factors affecting construction cost at MARA which is
one of the government agencies of Malaysia. They present the results of a questionnaire survey
conducted among the personnel of Project Management Consultant. They concluded that cash
flow and financial difficulties faced by contractors, contractor's poor site management and
supervision, inadequate contractor experience, shortage of site workers, incorrect planning and
scheduling by contractors are most severe factors while changes in scope of project and
frequent design changes are least affecting factors on construction cost.
Ray et al. (2010) reported that the results show that the quality of predictions made by the
intelligent system is comparable to the quality assured by the experienced expert. The proposed
expert system is superior to traditional cost accounting system and assists inexperienced users
in predicting the optimum process cost within the shortest possible time.
While Bhatnagar and Ghose (2012) reported that fuzzy logic is the best model for predicting
early stage effort estimation, they found that Mamdani FIS was able to predict the early stage
efforts more efficiently in comparison to the neural network based models.
On the other hand Cheng et al. (2010) proposed a conceptual cost estimate model by the
Evolutionary Fuzzy Neural Inference, they presents Evolutionary Web-based Conceptual Cost
Estimators which can be deployed to estimate conceptual construction cost more precisely
during the early stages of projects.
Adeli and Jiang (2003) developed neuro-fuzzy logic model for estimation of the freeway work
zone capacity. The new model in general provides a more accurate estimate of the work zone
capacity.
Locally many searches were done for the accuracy of cost estimate. Factors affecting cost
estimating and the computer applications in cost estimating, like Shehatto (2013), Arafa and
Alqedra (2011); Abdal-Hadi (2010); Aljarosha (2008); Al-Najjar (2008); Abu Shaban (2008);
Al-Shanti (2003); Madi (2003) and El-Sawalhi (2002).
Shehatto (2013) studied the significant parameters that effect the early stage cost estimation of
construction projects in Gaza. Shehatto reported that the factors affecting the cost of
construction projects are divided into two main groups' structural skeleton and finishes.
The structural skeleton groups were including 13 factors, he founded the degree of importance
for each factors and the most significant factors at this group were:

26
1- Area of the typical floor.
2- Number of stories.
3- Area of the returning wall.
4- Type of the building (residential, schools, hospital, mosque, university).
5- Type of footing (isolated, combined, raft, piles).
6- Number of elevators.
7- Type of the slab (hollow, solid, drop beam).
The finishes groups included 18 factors. He founded the degree of importance for each factors
and the most significant factors in this group were:
1- External finishing (plaster, tyrolean, oixus. composites).
2- Type of tiles (terrazzo, ceramic, porcelain, marble).
3- Area of glassed elevations.
4- HVAC volume.
5- Type of electrical works.
6- Type of mechanical works.
7- False ceiling area.
Arafa and Alqedra (2011) developed a model for early cost estimation of construction projects
at Gaza. The model were built using artificial neural network depends on seven significant
factors for the structural skeleton namely ground floor area, typical floor area, number of
stories, number of columns, type of footing, number of elevators and number of rooms.
Arafa and Alqedra reported that the results obtained from the trained models indicated that
neural networks rationally succeeded in predicting the early stage cost estimation of building
using basic information of the projects and without need for more detailed design.
Abdal-Hadi (2010) reported about that factors affecting accuracy of pre-tender cost estimate at
Gaza Strip. An exploration of 85 factors affecting the accuracy of pre-tender cost estimate was
conducted in order to find the degree of importance for each factor. The 85 factors where
divide into five main groups which are:
1. Factors related to clients characteristics;
2. Factors related to consultants, design parameters and information;
3. Factors related to project characteristics;

27
4. Factors related to contract requirement and procurement method;
5. External factors and market conditions.
Abdal-Hadi said that the factors that are related to consultants, design parameters and
information were ranked in the first position among other groups. The factors that are related
to external factors and market conditions were ranked in the second position. The factors that
are related to contract requirement and procurement method were ranked in the third position.
The factors that are related to clients characteristics were ranked in the fourth position, while
the factors that are related to project characteristics were ranked in the last position. Which
emphasized that, the consultants, design parameters and information are crucial in accurate
estimation of construction costs at the pre-tender stage.
Aljarosha (2008) explored the impact of conditions of contract for construction on the cost
estimating. He investigated the using of computer applications to deal with liabilities and risks
associated with the construction projects. He found the majority of contractors do not use
formalized techniques for estimating contingencies when preparing tenders. They do not use
computerized tools to evaluate and manage responsibilities and risks and, in general, there is
no commitment to employ an experienced person or team for evaluating and managing
responsibilities and risks.
Abu Shaban (2008) identified 17 cost factors that affecting the performance of construction
projects. He recommended the construction companies to have a structured methodology and
technique should be identified to overcome the effect of local political and economic situations
on the performance of construction projects in the Gaza Strip.
Al-Najjar (2008) study the factors influencing time and cost overruns on construction projects
in the Gaza Strip, he said that it is well known that most construction projects in Gaza Strip
exposed to time and cost overrun or both. So the cost estimator must be more accuracy and
take the factors affecting the cost estimation at his consideration.
Al-Shanti (2003) explored the project cost estimation in Gaza strip. He investigated the using
of computer applications in cost estimating. He concluded that most of contracting companies
are still estimating the projects manually. Shortage of user friendly estimating software
packages and lack of available qualified personnel in using computer-based estimating systems
are considered the main obstacles in using computer in construction estimating.

28
Madi (2003) investigated the essential factors affecting the accuracy of cost estimating in Gaza
Strip to show the degree of importance of 51 factors in cost estimation practice. Madi classified
the 51 factor into 8 groups:
1. Group 1 related to project complexity;
2. Group 2 related to project information and resources;
3. Group 3 related to technological requirements;
4. Group 4 related to contract requirements.
5. Group 5 related to efficiency and resources of company;
6. Group 6 related to market requirements;
7. Group 7 related to project and its duration;
8. Group 8 related to project risks.
Madi found that the most important group in cost estimating practice is group 8 related to
project risks. This group is ranked first. Group 2 related to project information and resources
is ranked second and group 6 related to market requirements is ranked third. He found that the
main factors are: location of the project, segmentation of the Gaza Strip and limitation of
movements between areas, political situation and closure of the Gaza Strip, financial status of
the owner and increase in unit costs of construction materials (Enshassi et al., 2007).
Also Madi investigated the using of computer in tender estimation. He concluded that the main
reasons for not using computer in estimating is lack of suitable software for estimating,
shortage of qualified employees, the wrong belief that using computer gives inaccurate results,
and difficulty in operating computer software.
Al-Shanti (2003) quoted El-Sawalhi (2002) explored the project management practice by
public owners and contractors in Gaza Strip. He investigated the using of computer applications
in supporting implementation of project management in cost estimating. He concluded that the
main reason for low using of computer applications in cost estimating may be referred to the
inefficient using in estimating computer applications. He also referred this partly for the lack
of efficient training for using such programs.
Arafa and Alqedra (2011) developed ANN model to predict the early stage cost of buildings.
The data was collected from 71 construction projects. The analysis of the training data revealed
that there are seven key parameters and the ANN model had one hidden layer with seven
neurons. One output neuron representing the early cost estimate of buildings. A comparison
between the actual cost values of the testing set and values obtained from the ANN model

29
showed that the mean, standard deviation and coefficient of determination (R2) of the ratio
between the actual and predicted cost are 0.960, 0.420 and 97%, respectively. The performed
sensitivity analysis showed that the ground floor area, number of storeys, type of foundation
and number of elevators in the buildings are the most effective parameters influencing the cost
estimates of buildings.
Gunaydın and Dogan (2004) built a neural network model to estimate the cost in early phases
of building design process. Cost and design data from thirty projects were used for training and
testing the neural network methodology with eight design parameters utilized in estimating the
square meter cost of reinforced concrete structural systems of 4–8 storey residential buildings
in Turkey, an average cost estimation accuracy of 93% was achieved.
Kim et al. (2004) used the back-propagation network (BPN) model incorporating genetic
algorithms (GAs) to cost estimation. GAs were adopted in the BPN to determine the BPN’s
parameters and to improve the accuracy of construction cost estimation. Previously, there have
been no appropriate rules to determine these parameters. The construction cost data for 530
residential buildings constructed in Korea between 1997 and 2000 were used for training and
evaluating the performance of the model. This study showed that a BPN model incorporating
a GA was more effective and accurate in estimating construction costs than the BPN model
using trial and error.
In their recent study, Ahadzie et al. (2008) proposed a multiple regression model for the
prediction of the outcome for the performance of project managers at the construction stage of
mass housing projects. Also, the independent variables affecting the success of project
managers were identified. The methodology used by Ahadzie et al. (2008) can also be
implemented for predicting the performance of project managers in the different project types.
In Gaza strip, few researchers discussed the effective techniques for obtaining an accurate cost
estimation, Madi (2003), for example, conducted a research on the factors that affecting the
accuracy of cost estimation. The research documented that the contracting companies in Gaza
strip continue to use traditional techniques for tender cost estimation, therefore, the
recommendation of that research stated that more efforts should be spent to develop special
pricing software in order to improve the cost estimation practice in Gaza Strip.

30
31
3 CHAPTER 3: METHODOLOGY
3.1 Introduction
Developing of a parametric cost estimation model using support-vector machines is the essence
of this study, which takes the building projects in Gaza strip as a case study to predict the final
cost at early stage of project preparation.
This research adopts historical data analysis as the foundation to this methodology. As well,
the use of historical data assists in providing a relation between the main factors affecting the
cost of the building projects to make estimates for new projects.
This chapter provides the information about the research strategy and design, factors affecting
cost of the building projects, process of data collection and analysis.
3.2 Research Strategy
Research strategy in general means a plan of action of how the research objectives can be
questioned, and it can be classified into two types namely, quantitative approach and
qualitative approach (Naoum, 2007).
Qualitative approach seeks to gain insights and to understand people's perceptions, or opinion
towards a particular object. As well, it is used when a limited amount of knowledge about the
topic are available (Naoum, 2007).
Quantitative approach seeks to collect factual data and to study relationship between facts and
how such facts and relationships accord with theories and findings of any research executed
previously (Al-Shanti, 2003).
In this study, both quantitative and qualitative approaches were used. The qualitative approach
was used to determine the main factors affecting the cost of building projects in Gaza strip at
conceptual phase by using Delphi technique. In addition, quantitative approach was used to
gather the data from resources by filling a form for each project, which contains the input
factors and the cost as the output.

32
3.3 Research Design
The purpose of this research is to explore the significant factors affecting the cost estimating
of construction projects at Gaza Strip and develop a computerized cost estimating system using
support vector machine to be used in early cost estimation.
This research consists of eight phases:
1. Topic Selection and Thesis Proposal Phase
Topic is selected, problems are defined, objectives are established and, research plan is
developed.
2. Literature Review Phase
It include the studies that reviewed the relevant literature on the subject of parametric cost
estimation methods and looking at previous models, papers, reports and thesis, which studied
non-traditional methods for parametric cost estimation.
3. Data Collection Phase
The third phase of the research included a field survey which included owners, contractors and
consultants through personal interview which was used in this research to collect factual
information as well as opinions. It was decided that the most appropriate approach was to carry
out a structured interview which mean questions are presented in the same order and with the
same wording to all interviewees. Interviews were used as a step of Delphi method to identify
the main factors, which need to be considered in cost estimation at the conceptual phase. The
Delphi technique can be used to anonymously elicit the opinions of experts concerning factors
affected on the project's cost. It provides feedback to experts in the form of distributions of
their opinions and reasons. They are then asked to revise their opinions in light of the
information contained in the feedback. This sequence of questionnaire and revision is repeated
until no further significant opinion changes are expected. This technique is designed to protect
anonymity of the expert's opinions and reasoning (Creedy et al., 2006)
The following steps have been followed to achieve the Delphi method:
Seven exploratory interviews were done with experts. The experts worked in various
positions: cost engineers, managers and site engineers. They worked in consultant offices,
municipalities and contractor companies.

33
The factors that affect the cost of construction projects, which have been drawn from
previous studies, were presented to them.
Then the expert’s opinions were collected that showed consensus on nine factors, which
have the greatest impact on the construction project cost in Gaza strip. They took in
consideration the ability to gather the related information and the ability to know these
factors at the early stage of the project.
Support-vector machines require a lot of data. Therefore, a lot of historical building projects
were collected which were done between 2010 and 2013 in Gaza strip. These research include
areal data collecting from 169 construction projects. These projects were residential, schools,
mosque and organization buildings.
4. Model Development Phase
After analyzing the data, many models were built and trained with various structures by using
support-vector machines technique in this stage, the NeuroSolutions 6.07 application and
Microsoft Excel 2007 were selected to build the models. Many models were implemented with
various structures and were trained many times with checking the validity. The final models
were tested and the results were presented through comparison between models performance
to choose the best.
5. Model Validity
The fifth phase of the research focused on model validity by comparing the model results of
21 projects with real cost of these projects.
6. Conclusion and Recommendations Phase
In this stage, the content of the dissertation was written and the research chapters were covered.
Moreover, the research was summarized in the conclusion section with some
recommendations.
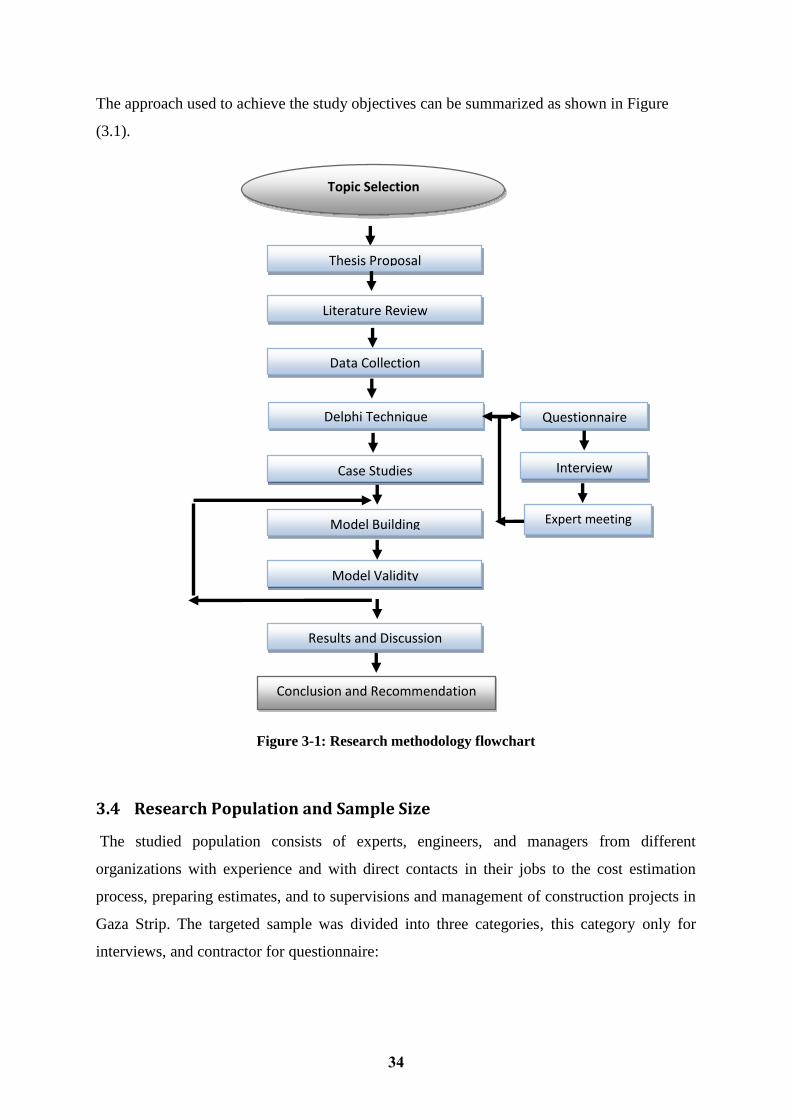
34
The approach used to achieve the study objectives can be summarized as shown in Figure
(3.1).
Figure 3-1: Research methodology flowchart
3.4 Research Population and Sample Size
The studied population consists of experts, engineers, and managers from different
organizations with experience and with direct contacts in their jobs to the cost estimation
process, preparing estimates, and to supervisions and management of construction projects in
Gaza Strip. The targeted sample was divided into three categories, this category only for
interviews, and contractor for questionnaire:
Topic Selection
Thesis Proposal
Conclusion and Recommendation
Data Collection
Model Building
Model Validity
Results and Discussion
Literature Review
Interview Case Studies
Expert meeting
Questionnaire Delphi Technique

35
1- Clients: this category includes ministries, municipalities, governmental bodies,
donors and NGOs. The total numbers of interviews with this category were five.
2- Consultants: this category can be hired by some clients because of their experiences.
The total numbers of interviews with this category were four.
3- Contractors: the first, second and third category who have valid registration in 2012
from the Contractors Union, were include in this category. The total numbers of
interviews with this category were twelve.
The studied population includes contractors who have a valid registration by the Palestinian
Contractors Union (PCU) in buildings specialization in Gaza Strip at year 2012. The total
number of contractors who have valid registration under first, second and third category are
154 companies. The first class has56 companies, the second class has 65 companies, and the
third class has 33 companies.
A systematic random sample to ensure a representative sample of all contractors was selected.
To determine the sample size for each population of contractors , Kish (1965) equation was
used. Several studies such as Assaf et al (1999, 2001) and Abdul-Hadi (1999) used this
equation. According to the Engineers' Association in Gaza strip the population of the
contractors is 154
n= n'/ [1+(n'/N)]
Where:
n': is the sample size from infinite population, which can be calculated from this formula
[n' = S²/V²]. The definitions of all variable can be defined as the following:
n: sample size from finite population.
N: Total population (154 contractors)
V: Standard error of sample population equal 0.05 for the confidence level 95 %, t
=1.96.
S²: Standard error variance of population elements, S²= P (1-P); maximum at P= 0.5
The sample size for the contractors' population can be calculated from the
previous equations as follows:
n' = S²/V² = (0.5)²/(0.05)² = 100
n= 100/ [1+(100 / 154)] = 64
This means that the questionnaire should be distributed to 64 contractor organizations
in order to achieve 95% confidence level
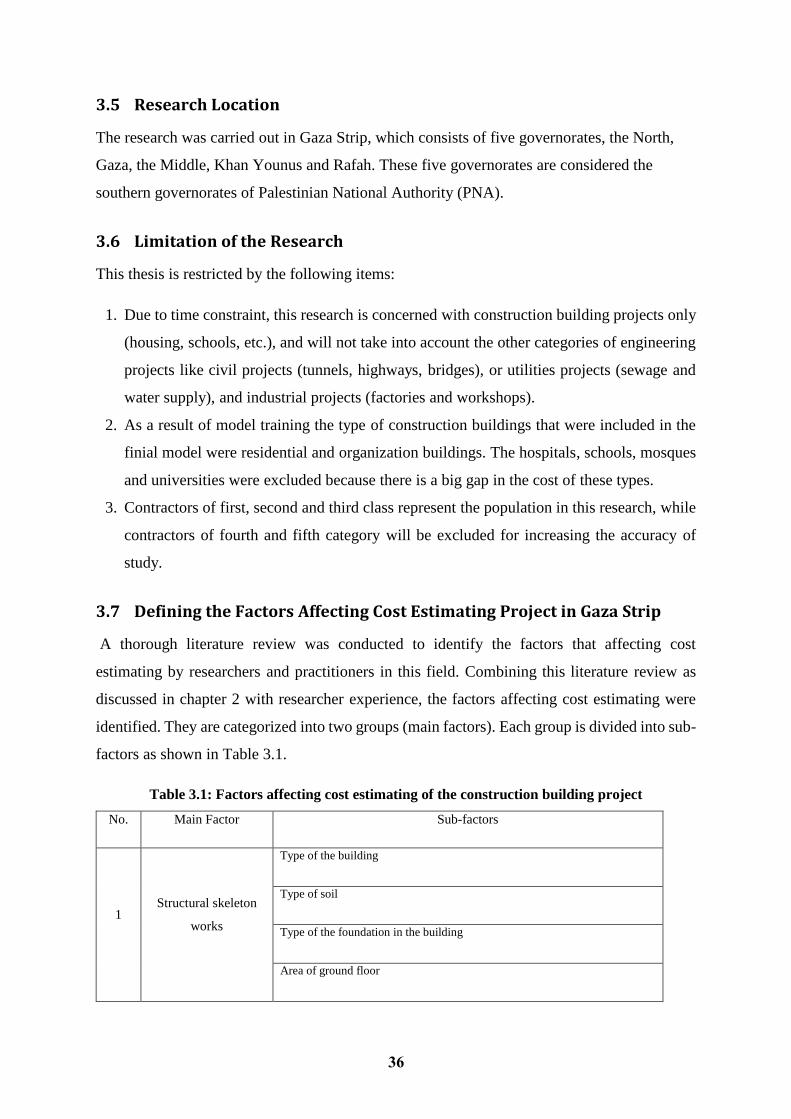
36
3.5 Research Location
The research was carried out in Gaza Strip, which consists of five governorates, the North,
Gaza, the Middle, Khan Younus and Rafah. These five governorates are considered the
southern governorates of Palestinian National Authority (PNA).
3.6 Limitation of the Research
This thesis is restricted by the following items:
1. Due to time constraint, this research is concerned with construction building projects only
(housing, schools, etc.), and will not take into account the other categories of engineering
projects like civil projects (tunnels, highways, bridges), or utilities projects (sewage and
water supply), and industrial projects (factories and workshops).
2. As a result of model training the type of construction buildings that were included in the
finial model were residential and organization buildings. The hospitals, schools, mosques
and universities were excluded because there is a big gap in the cost of these types.
3. Contractors of first, second and third class represent the population in this research, while
contractors of fourth and fifth category will be excluded for increasing the accuracy of
study.
3.7 Defining the Factors Affecting Cost Estimating Project in Gaza Strip
A thorough literature review was conducted to identify the factors that affecting cost
estimating by researchers and practitioners in this field. Combining this literature review as
discussed in chapter 2 with researcher experience, the factors affecting cost estimating were
identified. They are categorized into two groups (main factors). Each group is divided into sub-
factors as shown in Table 3.1.
Table 3.1: Factors affecting cost estimating of the construction building project
No. Main Factor Sub-factors
1 Structural skeleton
works
Type of the building
Type of soil
Type of the foundation in the building
Area of ground floor
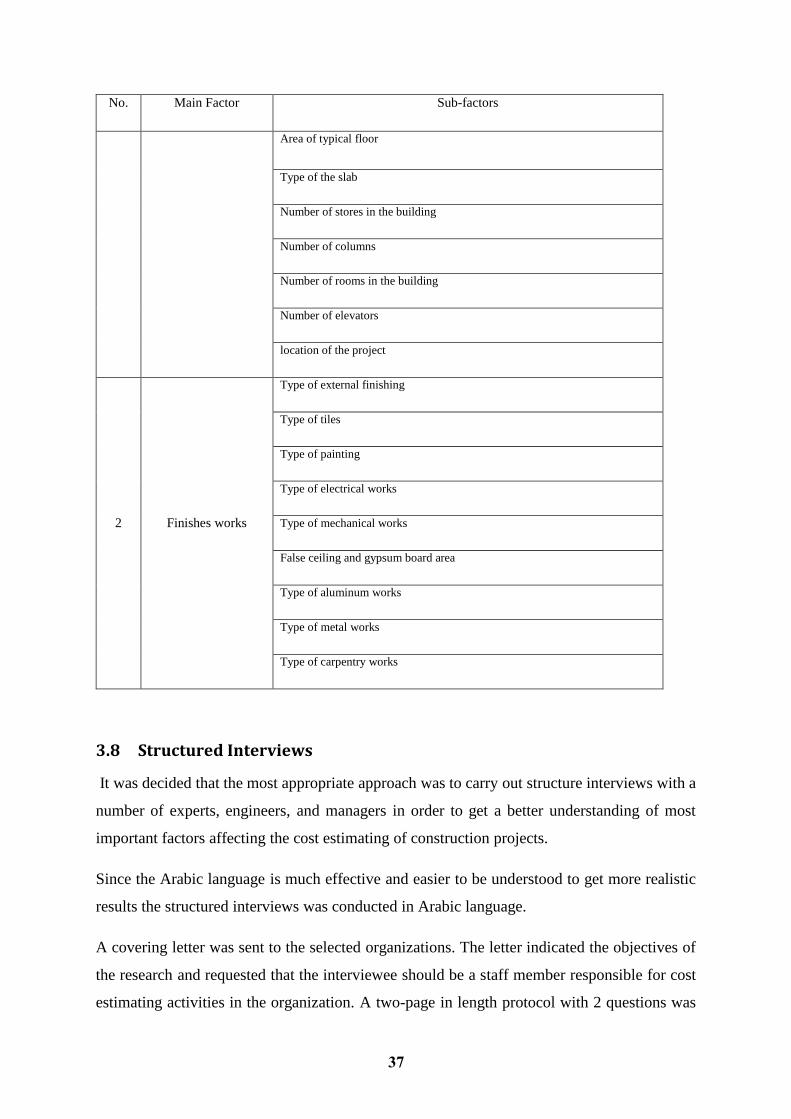
37
No. Main Factor Sub-factors
Area of typical floor
Type of the slab
Number of stores in the building
Number of columns
Number of rooms in the building
Number of elevators
location of the project
2 Finishes works
Type of external finishing
Type of tiles
Type of painting
Type of electrical works
Type of mechanical works
False ceiling and gypsum board area
Type of aluminum works
Type of metal works
Type of carpentry works
3.8 Structured Interviews
It was decided that the most appropriate approach was to carry out structure interviews with a
number of experts, engineers, and managers in order to get a better understanding of most
important factors affecting the cost estimating of construction projects.
Since the Arabic language is much effective and easier to be understood to get more realistic
results the structured interviews was conducted in Arabic language.
A covering letter was sent to the selected organizations. The letter indicated the objectives of
the research and requested that the interviewee should be a staff member responsible for cost
estimating activities in the organization. A two-page in length protocol with 2 questions was
38
prepared based on a combination of an extensive review of the literature dealing with factors
affecting cost estimating practice in Gaza Strip. The covering letter was sent to construction
organizations.
The structured interviews schedule also sought information regarding the following areas:
1. Characteristics of responding organizations in term of position of respondent, years
of experience for the organization and total number of employees.
2. Factors affecting cost estimating.
3. Suggestions regarding any other factors and improvements required in estimating.
The structured interviews were conducted and lasted for 20 to 30 minutes for each one.
3.9 Questionnaire Design
According to literature review related to the concern subject and after discussions with the
supervisor and interviewing sample of contractors, a well designed questionnaire was
developed with mainly closed ended questions. The questionnaire was built from two sections
that cover the main questions of the study. The first section is related to the company profile
and some information about the project. This section includes 6 questions about classification
of contracting companies according to PCU , the position of officer who fills the questionnaire,
number of company's employees, number of projects executed in the last five years, the value
of projects executed in the last five years, the type of implemented projects
The second section is related to factors affecting pricing proses. It includes 3 groups of factors
such as: factors related to structural (skeleton) group which includes 10 factors, factors related
to external group which includes 5 factors, factors related to finishing group which includes 18
factors The original questionnaire was developed in English language. English language
questionnaire is attached in (Appendix 1). In order to avoid any misunderstanding. The
questionnaire would be much effective and easier to be understood and to get more realistic
results, the questionnaire was translated to the Arabic language and the Arabic language
questionnaire is attached in (Appendix 2). An explanatory letter was attached to explain the
way of responding, the aim of the study and the security of the information. A draft
questionnaire was designed with the help of supervisor. This draft was discussed with a group
of specialists. They advised some changes such as modifying the wording of some questions.
Some of them recommended adding questions. Some of them also recommended changing the

39
answer options in questions. Other changes were also made after the pilot study to clarify
confusion and ambiguity reported by the pilot study subjects.
The Relative Importance Index
The relative index technique has been widely used in construction research for measuring
attitudes with respect to surveyed variables. Several researches such as Abdal-Hadi (2010), Al-
Najjar (2008); Madi (2003) and Akintoye (2000) used the relative importance index in their
analysis of factors affecting the accuracy of cost estimate. This study used this technique to
determined factors affecting cost estimating. Likert scaling was used for ranking questions that
have an agreement levels. The respondents were required to rate the importance of each factor
on a 5-point Likert scale using 1 for not important, 2 for of little importance, 3 for somewhat
important, 4 for important and 5 for very important. Then, the relative importance index was
computed using the following equation:
Relative Importance Index =∑𝓦
𝑨𝑵=
𝟓𝒏𝟓+𝟒𝒏𝟒+𝟑𝒏𝟑+𝟐𝒏𝟐+𝟏𝒏𝟏
𝟓𝑵
Where W is the weighting given to each factor by the respondent, ranging from 1 to 5, (n1 =
number of respondents for not important, n2 = number of respondents for little importance, n3
= number of respondents for somewhat important, n4 = number of respondents for important,
n5 = number of respondents for very important). "A" is the highest weight (i.e 5 in the study)
and N is the total number of samples. The relative importance index ranges from 0 to 1 (Tam
and Le, 2006).
3.10 Reliability and Validity of Research
Reliability is the extent to which a test or procedure produces similar results under constant
conditions on all occasions (Bell, 2005). Reliability can be equated with the stability,
consistency, or dependability of a measuring tool. There are a number of devices for checking
reliability in scales and tests, such as ‘test–retest’ (administering the same test some time after
the first), the ‘alternate forms method’ (where equivalent versions of the same items are given
and results correlated) or the ‘split-half method’ (where the items in the test are split into two
matched halves and scores then correlated) (Bell, 2005).
Validity refers to the degree to which an instrument measures what it is supposed to be
measured. When an instrument is valid, it truly reflects the concept it is supposed to measure
(Bell, 2005).
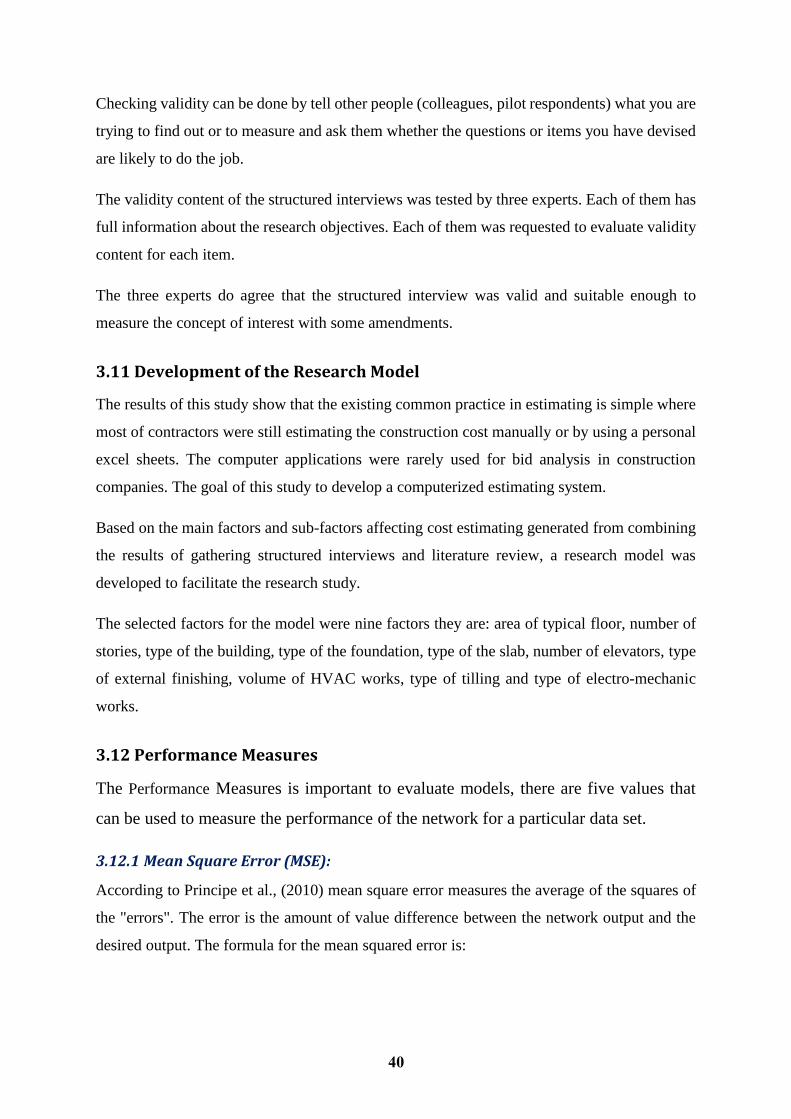
40
Checking validity can be done by tell other people (colleagues, pilot respondents) what you are
trying to find out or to measure and ask them whether the questions or items you have devised
are likely to do the job.
The validity content of the structured interviews was tested by three experts. Each of them has
full information about the research objectives. Each of them was requested to evaluate validity
content for each item.
The three experts do agree that the structured interview was valid and suitable enough to
measure the concept of interest with some amendments.
3.11 Development of the Research Model
The results of this study show that the existing common practice in estimating is simple where
most of contractors were still estimating the construction cost manually or by using a personal
excel sheets. The computer applications were rarely used for bid analysis in construction
companies. The goal of this study to develop a computerized estimating system.
Based on the main factors and sub-factors affecting cost estimating generated from combining
the results of gathering structured interviews and literature review, a research model was
developed to facilitate the research study.
The selected factors for the model were nine factors they are: area of typical floor, number of
stories, type of the building, type of the foundation, type of the slab, number of elevators, type
of external finishing, volume of HVAC works, type of tilling and type of electro-mechanic
works.
3.12 Performance Measures
The Performance Measures is important to evaluate models, there are five values that
can be used to measure the performance of the network for a particular data set.
3.12.1 Mean Square Error (MSE):
According to Principe et al., (2010) mean square error measures the average of the squares of
the "errors". The error is the amount of value difference between the network output and the
desired output. The formula for the mean squared error is:
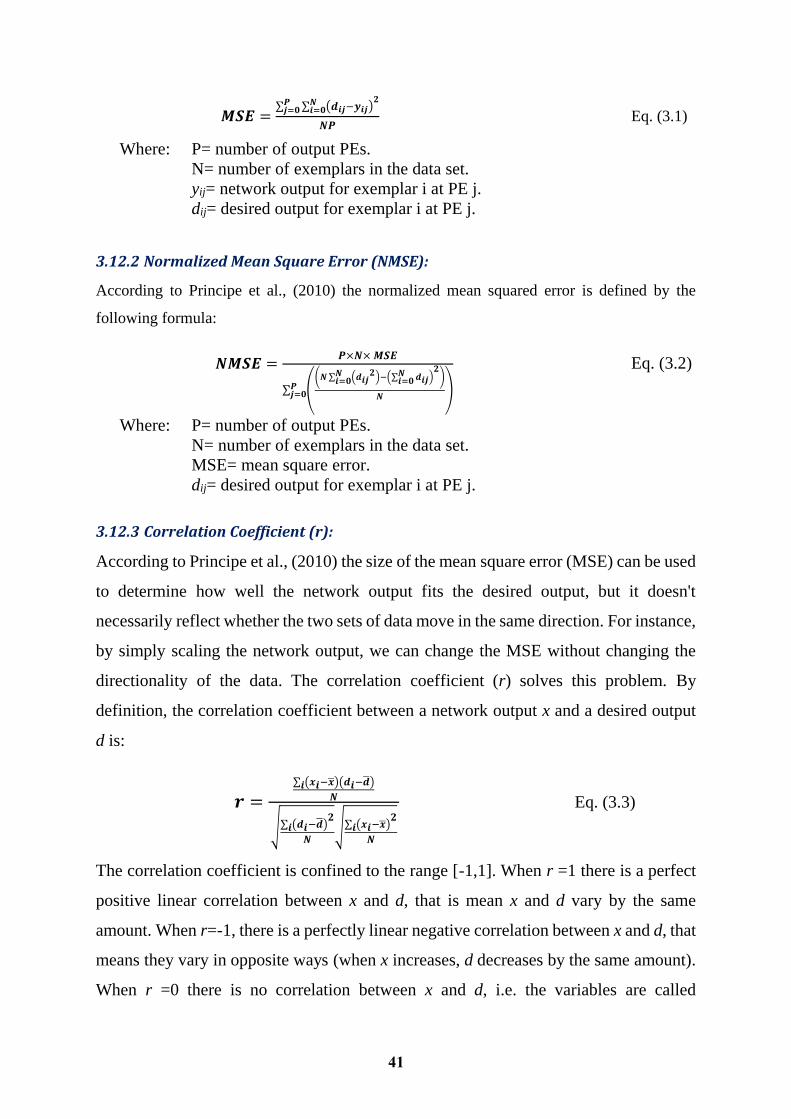
41
𝑴𝑺𝑬 =∑ ∑ (𝒅𝒊𝒋−𝒚𝒊𝒋)
𝟐𝑵𝒊=𝟎
𝑷𝒋=𝟎
𝑵𝑷 Eq. (3.1)
Where: P= number of output PEs.
N= number of exemplars in the data set.
yij= network output for exemplar i at PE j.
dij= desired output for exemplar i at PE j.
3.12.2 Normalized Mean Square Error (NMSE):
According to Principe et al., (2010) the normalized mean squared error is defined by the
following formula:
𝑵𝑴𝑺𝑬 =𝑷×𝑵× 𝑴𝑺𝑬
∑ ((𝑵 ∑ (𝒅𝒊𝒋
𝟐)−(∑ 𝒅𝒊𝒋𝑵𝒊=𝟎 )
𝟐𝑵𝒊=𝟎 )
𝑵)𝑷
𝒋=𝟎
Eq. (3.2)
Where: P= number of output PEs.
N= number of exemplars in the data set.
MSE= mean square error.
dij= desired output for exemplar i at PE j.
3.12.3 Correlation Coefficient (r):
According to Principe et al., (2010) the size of the mean square error (MSE) can be used
to determine how well the network output fits the desired output, but it doesn't
necessarily reflect whether the two sets of data move in the same direction. For instance,
by simply scaling the network output, we can change the MSE without changing the
directionality of the data. The correlation coefficient (r) solves this problem. By
definition, the correlation coefficient between a network output x and a desired output
d is:
𝒓 =∑ (𝒙𝒊−�̅�)(𝒅𝒊−�̅�)𝒊
𝑵
√∑ (𝒅𝒊−�̅�)𝟐
𝒊𝑵
√∑ (𝒙𝒊−�̅�)𝟐
𝒊𝑵
Eq. (3.3)
The correlation coefficient is confined to the range [-1,1]. When r =1 there is a perfect
positive linear correlation between x and d, that is mean x and d vary by the same
amount. When r=-1, there is a perfectly linear negative correlation between x and d, that
means they vary in opposite ways (when x increases, d decreases by the same amount).
When r =0 there is no correlation between x and d, i.e. the variables are called
42
uncorrelated. Intermediate values describe partial correlations. For example a
correlation coefficient of 0.88 means that the fit of the model to the data is reasonably
good (Principe, Lefebvre, Lynn, & Wooten, NeuroSolutions - Documentation, 2010).
3.12.4 Mean Absolute Error (MAE):
According to Willmott and Matsuura, (2005) the MAE is defined by the following
formula:
𝑀𝐴𝐸 =∑ ∑ |𝒅𝒚𝒊𝒋−𝒅𝒅𝒊𝒋|𝑵
𝒊=𝟎𝑷𝒋=𝟎
𝑵 𝑷 Eq. (3.4)
Where: P= number of output PEs.
N= number of exemplars in the data set.
dyij= denormalized network output for exemplar i at PE j.
ddij= denormalized desired output for exemplar i at PE j.
3.12.5 Mean Absolute Percentage Error (MAPE):
According to Principe et al., (2010) The MAPE is defined by the following formula:
𝑀𝐴𝑃𝐸 =100
𝑁 𝑃∑ ∑
|𝑑𝑦𝑖𝑗−𝑑𝑑𝑖𝑗|
𝑑𝑑𝑖𝑗
𝑁𝑖=0
𝑃𝑗=0 Eq. (3.5)
Where: P= number of output PEs.
N= number of exemplars in the data set.
dyij= denormalized network output for exemplar i at PE j.
ddij= denormalized desired output for exemplar i at PE j.
Note that this value can easily be misleading. For example, say that your output data is
in the range of 0 to 100. For one exemplar your desired output is 0.1 and your actual
output is 0.2. Even though the two values are quite close, the percent error for this
exemplar is 100 (Principe, Lefebvre, Lynn, & Wooten, NeuroSolutions -
Documentation, 2010).
After several studies were reviewed, then this research considered Hegazy and Ayed,
(1998) methdology in determinig the total MAPE. Training phase were represented fifty
percent of the total MAPE likewise the test set is equal the remaining fifty percent. Total
Accuracy Performance (TAP) can be calculated by the following formula:
𝑻𝒐𝒕𝒂𝒍 𝑴𝑨𝑷𝑬 =(𝑴𝑨𝑷𝑬𝑻𝒓×𝑵𝑻𝒓+𝑴𝑨𝑷𝑬𝑪.𝑽×𝑵𝑪.𝑽) (𝑵𝑻𝒓+𝑵𝑪.𝑽)⁄ +𝑴𝑨𝑷𝑬𝑻𝒆𝒔𝒕
𝟐 Eq. (3.6)
Where:

43
MAPETr = Mean absolute percentage error for training data set.
NTr = number of exemplars in the training data set.
MAPEC.V = Mean absolute percentage error for cross validation data set.
NTr = number of exemplars in the cross validation training data set.
MAPETest = Mean absolute percentage error for test data set.
3.12.6 Accuracy Performance (AP):
According to Wilmot and Mei, (2005) Accuracy performance is defined as
(100−MAPE) %. Total Accuracy Performance (TAP) can be calculated by the
following formula:
𝑇𝐴𝑃 = 100 − 𝑇𝑜𝑡𝑎𝑙 𝑀𝐴𝑃𝐸 Eq. (3.7)
44
4 CHAPTER 4: RESULTS AND ANALYSIS
4.1 Introduction
This chapter discusses the results that have been deduced from a field survey of seventy
questionnaires. Section one presents the contractor profiles and all necessary information about
the respondents. Section two was designed to investigate the degree of importance of each
factor on cost estimation that affecting on cost estimate of construction project in Gaza Strip.
A Delphi technique was used to validate these factors by conducting interviews with expertise.
The main objective for this research is to develop a model to forecast cost estimate using SVM.
This model was built based on data collected from local projects.
4.2 Factors affecting cost estimate in building projects
In fact, one of the most significant keys in building the SVM model is identifying the factors
that have real impact on the construction cost for building projects. Depending on this great
importance of selecting these factors, a questionnaire survey, was conducted to identify these
factors for building projects in Gaza Strip. This chapter describes the results that have been
obtained from the field study. Analysis of the questionnaire was conducted using Microsoft
excel.
4.3 Questionnaire Analysis
Seventy questionnaires were distributed to three categories of contracting companies, where,
fifty-seven questionnaires, as a response rate 81% of the total number of questionnaires, were
correctly answered. More details and analysis are discussed in this section for the
questionnaire results.
4.4 Part One: General Information
This section is mainly designed to provide general information about the respondents in terms
of the major type of work involved, position and experience of respondent.
4.4.1 Classification of contracting companies according to PCU
As shown in Table 4.1, three classes of contracting companies are surveyed, noted that (57
%) of the investigated contracting companies are classified as first class.
Table 4.1, shows the frequency and percent of classification of contracting companies for
projects.
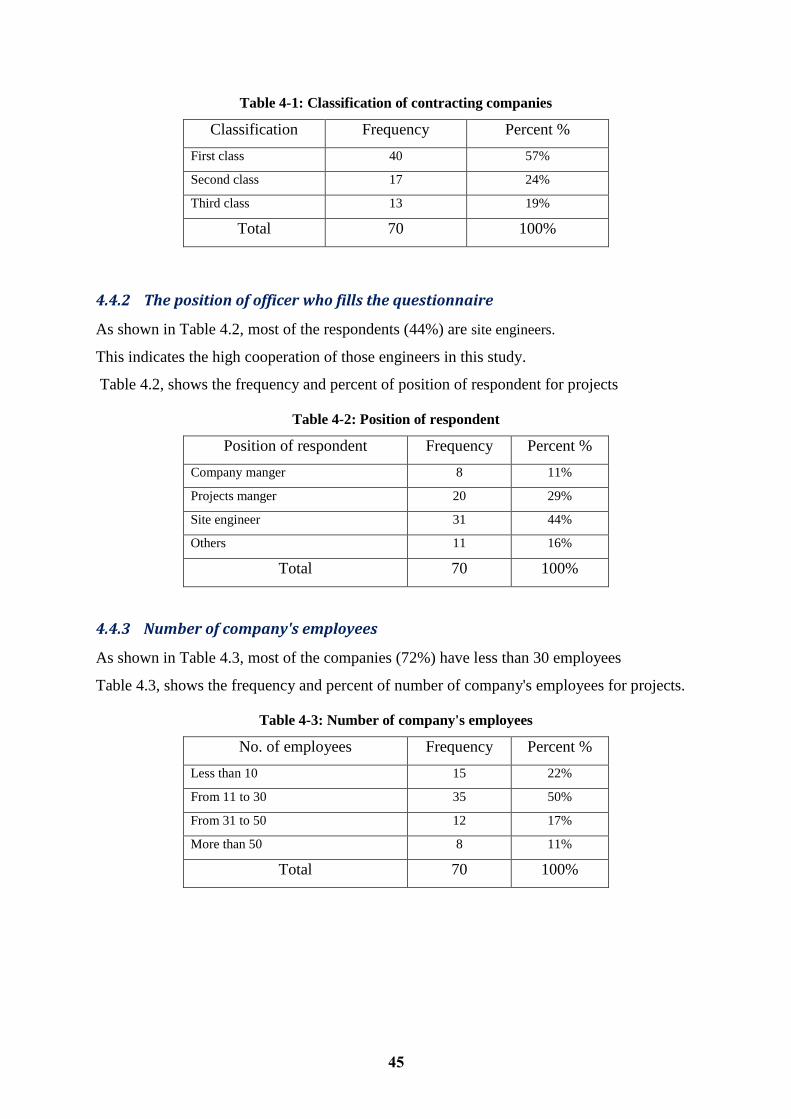
45
Table 4-1: Classification of contracting companies
Classification Frequency Percent %
First class 40 57%
Second class 17 24%
Third class 13 19%
Total 70 100%
4.4.2 The position of officer who fills the questionnaire
As shown in Table 4.2, most of the respondents (44%) are site engineers.
This indicates the high cooperation of those engineers in this study.
Table 4.2, shows the frequency and percent of position of respondent for projects
Table 4-2: Position of respondent
Position of respondent Frequency Percent %
Company manger 8 11%
Projects manger 20 29%
Site engineer 31 44%
Others 11 16%
Total 70 100%
4.4.3 Number of company's employees
As shown in Table 4.3, most of the companies (72%) have less than 30 employees
Table 4.3, shows the frequency and percent of number of company's employees for projects.
Table 4-3: Number of company's employees
No. of employees Frequency Percent %
Less than 10 15 22%
From 11 to 30 35 50%
From 31 to 50 12 17%
More than 50 8 11%
Total 70 100%
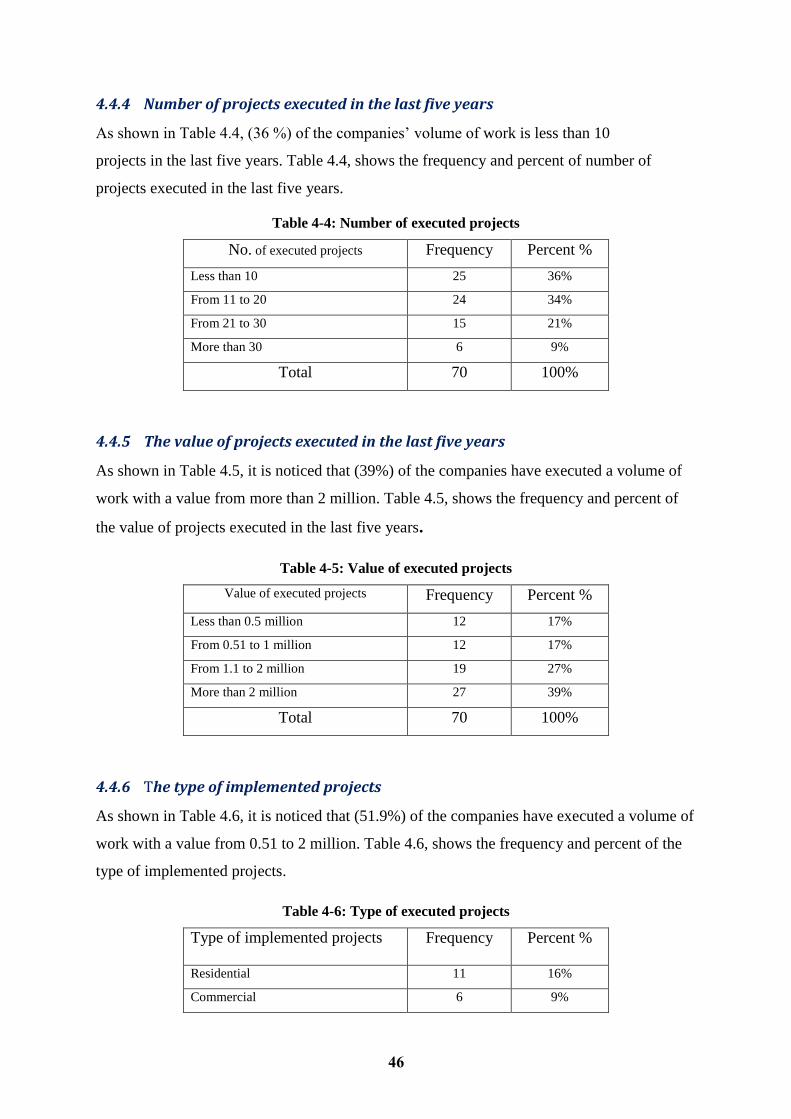
46
4.4.4 Number of projects executed in the last five years
As shown in Table 4.4, (36 %) of the companies’ volume of work is less than 10
projects in the last five years. Table 4.4, shows the frequency and percent of number of
projects executed in the last five years.
Table 4-4: Number of executed projects
No. of executed projects Frequency Percent %
Less than 10 25 36%
From 11 to 20 24 34%
From 21 to 30 15 21%
More than 30 6 9%
Total 70 100%
4.4.5 The value of projects executed in the last five years
As shown in Table 4.5, it is noticed that (39%) of the companies have executed a volume of
work with a value from more than 2 million. Table 4.5, shows the frequency and percent of
the value of projects executed in the last five years.
Table 4-5: Value of executed projects
Value of executed projects Frequency Percent %
Less than 0.5 million 12 17%
From 0.51 to 1 million 12 17%
From 1.1 to 2 million 19 27%
More than 2 million 27 39%
Total 70 100%
4.4.6 The type of implemented projects
As shown in Table 4.6, it is noticed that (51.9%) of the companies have executed a volume of
work with a value from 0.51 to 2 million. Table 4.6, shows the frequency and percent of the
type of implemented projects.
Table 4-6: Type of executed projects
Type of implemented projects
Frequency Percent %
Residential 11 16%
Commercial 6 9%

47
Residential & commercial 19 27%
Institutional 34 49%
Total 70 100%
4.5 Part two: Factors affecting on cost estimate for construction project in
Gaza Strip
The questionnaire included 33 factors, which derived from previous studies as mentioned in
chapter two, and those factors recommended by local contracting companies in the Gaza Strip.
The factors were distributed into three groups. Factors related to structural (skeleton) group,
external factors group and finishes group.
4.5.1 Factors related to structural (skeleton) group
Table 4.7 includes 10 skeleton factors. Most of respondents see that the number of floors in the
building, type of used foundation in the building and the area of typical floor are the most
influential factors on building cost. While area of retaining walls in project, number of elevators
in the building, type of slab and number of staircases in the building have a moderate influence.
The three remaining parameters as number of columns, length of span between columns and
number of rooms have lower influence on the project cost. It is observed from Table 4.7 that
all parameters have considerable effect where all of these have a rate more than 60%. This
indicates that the selection of parameters was logical and realistic in its impact on building cost.
This further will help to provide more acceptable results when building the cost model.
Table 4-7: Influence of skeleton factors on building cost
No Group Factors RII Rank
1
Factors related
to structural
construction
Type of used foundation in the building 0.87 2
2 Area of typical floor 0.84 3
3 Number of floors in the building 0.88 1
4 Number of columns 0.64 8
5 Number of rooms 0.55 10
6 Number of elevators in the building 0.76 5
7 Type of slab (Solid, Ribbed …) 0.73 6
8 Number of staircases in the building 0.73 6
9 Length of spans between columns 0.57 9
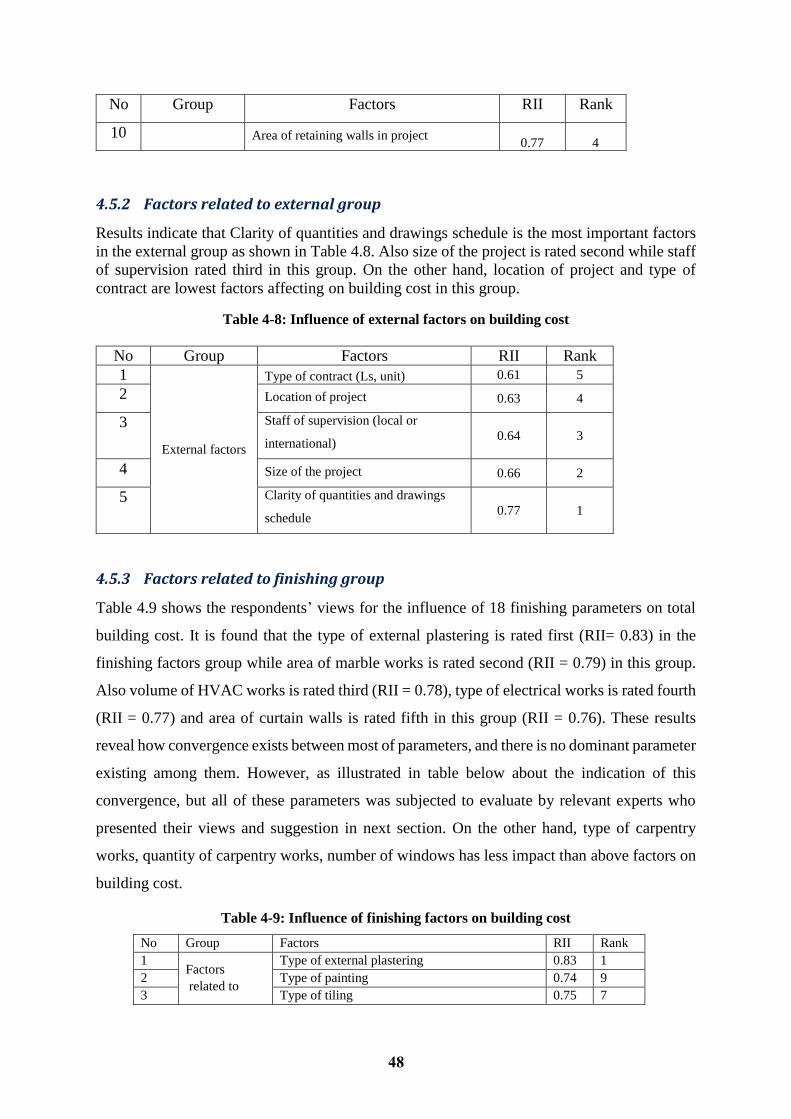
48
No Group Factors RII Rank
10 Area of retaining walls in project 0.77 4
4.5.2 Factors related to external group
Results indicate that Clarity of quantities and drawings schedule is the most important factors
in the external group as shown in Table 4.8. Also size of the project is rated second while staff
of supervision rated third in this group. On the other hand, location of project and type of
contract are lowest factors affecting on building cost in this group.
Table 4-8: Influence of external factors on building cost
4.5.3 Factors related to finishing group
Table 4.9 shows the respondents’ views for the influence of 18 finishing parameters on total
building cost. It is found that the type of external plastering is rated first (RII= 0.83) in the
finishing factors group while area of marble works is rated second (RII = 0.79) in this group.
Also volume of HVAC works is rated third (RII = 0.78), type of electrical works is rated fourth
(RII = 0.77) and area of curtain walls is rated fifth in this group (RII = 0.76). These results
reveal how convergence exists between most of parameters, and there is no dominant parameter
existing among them. However, as illustrated in table below about the indication of this
convergence, but all of these parameters was subjected to evaluate by relevant experts who
presented their views and suggestion in next section. On the other hand, type of carpentry
works, quantity of carpentry works, number of windows has less impact than above factors on
building cost.
Table 4-9: Influence of finishing factors on building cost
No Group Factors RII Rank
1 Factors
related to
Type of external plastering 0.83 1
2 Type of painting 0.74 9
3 Type of tiling 0.75 7
No Group Factors RII Rank
1
External factors
Type of contract (Ls, unit) 0.61 5
2 Location of project 0.63 4
3 Staff of supervision (local or
international) 0.64 3
4 Size of the project 0.66 2
5 Clarity of quantities and drawings
schedule 0.77 1
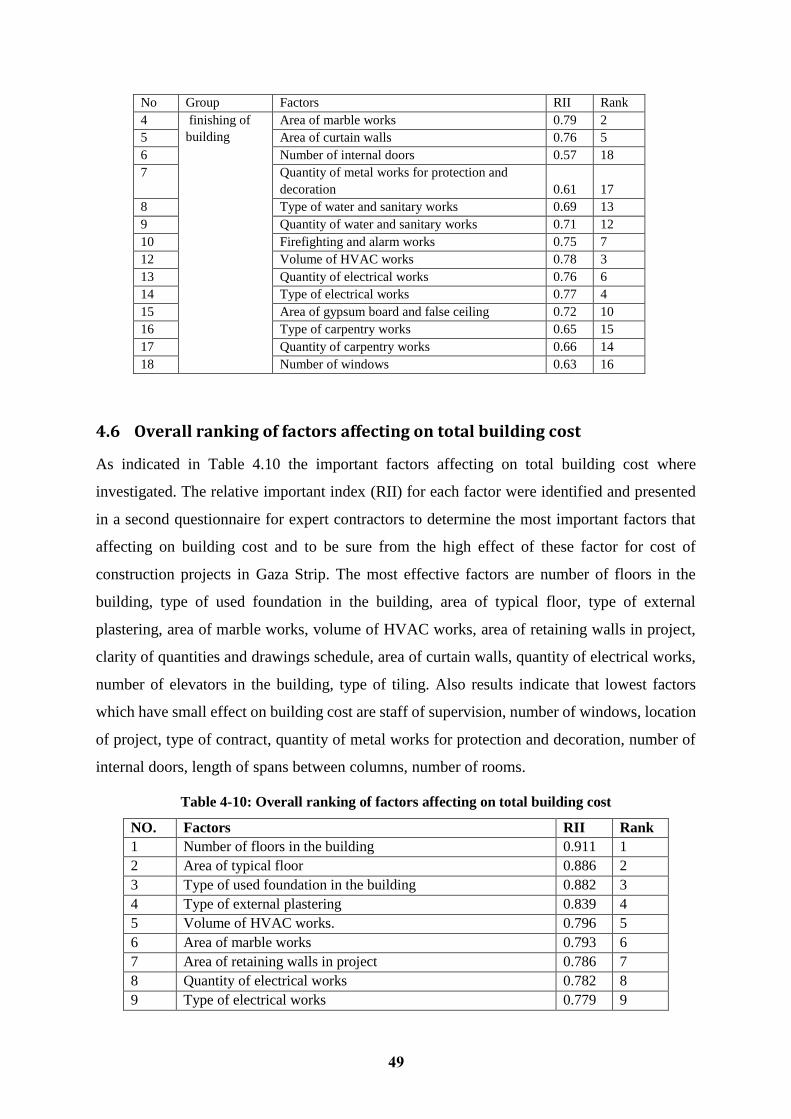
49
No Group Factors RII Rank
4 finishing of
building
Area of marble works 0.79 2
5 Area of curtain walls 0.76 5
6 Number of internal doors 0.57 18
7 Quantity of metal works for protection and
decoration 0.61 17
8 Type of water and sanitary works 0.69 13
9 Quantity of water and sanitary works 0.71 12
10 Firefighting and alarm works 0.75 7
12 Volume of HVAC works 0.78 3
13 Quantity of electrical works 0.76 6
14 Type of electrical works 0.77 4
15 Area of gypsum board and false ceiling 0.72 10
16 Type of carpentry works 0.65 15
17 Quantity of carpentry works 0.66 14
18 Number of windows 0.63 16
4.6 Overall ranking of factors affecting on total building cost
As indicated in Table 4.10 the important factors affecting on total building cost where
investigated. The relative important index (RII) for each factor were identified and presented
in a second questionnaire for expert contractors to determine the most important factors that
affecting on building cost and to be sure from the high effect of these factor for cost of
construction projects in Gaza Strip. The most effective factors are number of floors in the
building, type of used foundation in the building, area of typical floor, type of external
plastering, area of marble works, volume of HVAC works, area of retaining walls in project,
clarity of quantities and drawings schedule, area of curtain walls, quantity of electrical works,
number of elevators in the building, type of tiling. Also results indicate that lowest factors
which have small effect on building cost are staff of supervision, number of windows, location
of project, type of contract, quantity of metal works for protection and decoration, number of
internal doors, length of spans between columns, number of rooms.
Table 4-10: Overall ranking of factors affecting on total building cost
NO. Factors RII Rank
1 Number of floors in the building 0.911 1
2 Area of typical floor 0.886 2
3 Type of used foundation in the building 0.882 3
4 Type of external plastering 0.839 4
5 Volume of HVAC works. 0.796 5
6 Area of marble works 0.793 6
7 Area of retaining walls in project 0.786 7
8 Quantity of electrical works 0.782 8
9 Type of electrical works 0.779 9

50
NO. Factors RII Rank
10 Area of curtain walls 0.768 10
11 Firefighting and alarm works. 0.768 10
12 Number of elevators in the building 0.764 12
13 Clarity of quantities and drawings schedule 0.764 12
14 Type of painting 0.754 14
15 Type of tiling 0.754 14
16 Number of staircases in the building 0.743 16
17 Area of gypsum board and false ceiling 0.732 17
18 Type of slab (Solid, Ribbed …) 0.721 18
19 Type of Aluminum works 0.711 19
20 Type of water and sanitary works 0.707 20
21 Quantity of water and sanitary works 0.707 20
22 Type of carpentry works 0.657 22
23 Number of columns 0.650 23
24 Quantity of carpentry works 0.643 24
25 Number of windows 0.629 25
26 Size of the project 0.621 26
27 Staff of supervision (local or international) 0.618 27
28 Location of project 0.611 28
29 Quantity of metal works for protection and decoration 0.596 29
30 Type of contract (Ls, unit) 0.575 30
31 Number of internal doors 0.575 30
32 Number of rooms 0.546 32
33 Length of spans between columns 0.546 32
4.7 Ranking of groups for factors affecting on total building cost
Survey results indicated that structural (skeleton) factors group was ranked the most important
among all groups of factors (Table.4.11). On the other hand, finishes group was ranked second
important. External factors group was ranked third. Also this results indicate that most
important factors are from the first and third group.
Table 4-11: Ranking factors affecting on total building cost among groups
Groups RII Rank
Structural (skeleton) group 0.73 1
Finishes group. 0.72 2
External factors 0.66 3
4.8 Delphi Technique
Another technique has been used to determine the effective factors on building project cost.
This technique relies on the concept of Delphi technique, which aimed to achieve a

51
convergence of opinion on factors affecting the cost of the project. It provides feedback from
the experts opinions. Then, they are asked to revise their opinions in light of the information
contained in the feedback. This sequence of questionnaire and revision is repeated until no
further significant opinion changes are expected (Creedy et al., 2006).
For Delphi process, several rounds should be conducted where first round begins with a
questionnaire. The questionnaire serves as the cornerstone of soliciting specific information
about a content area from the Delphi subjects, then after receiving the responses, the researcher
converts the collected information into a well-structured questionnaire to be used as the survey
instrument for the second round of data collection. In the second round, each Delphi participant
receives a second questionnaire and is asked to review the items summarized by the
investigators based on the information provided in the first round, where in this round areas of
disagreement and agreement are identified. However, in third round Delphi panelist are asked
to revise his/her judgments or to specify the reasons for remaining outside the consensus. In
the fourth and often final round, the list of remaining items, their ratings, minority opinions,
and items achieving consensus are distributed to the panelists. This round provides a final
opportunity for participants to revise their judgments. Accordingly, the number of Delphi
iterations depends largely on the degree of consensus sought by the investigators and can vary
from three to five (Hsu, 2007). Five experts in construction field were selected to reach a
consensus about specifying the key cost parameters. The results with those five experts were
significantly close to the questionnaire results, and only three rounds were conducted due to
largely degree of consensus. They proposed to exclude clarity of quantities and drawing
schedule, area of retaining wall, area of marble work and area of curtain walls from these
factors because of their rarity in Gaza‟s projects, In addition, for the two factors; type of slab
and length of span, they recommended to combine them with one factor that contains slab with
drop beams. Moreover, they suggested merging area of gypsum board with HVAC (Heating
Ventilation and Air-conditioning) to avoid existing dependent parameters in input factors
because gypsum boards are installed in case of installing central air-conditioning and
recommended to merge type of electrical work with quantity of electrical work to get
homogeneous factors in the model.
4.9 Influential factors adopted in the research
Literature studies was the first process in determining the key parameters, then the
questionnaire that was designed according to these literatures as long as specialists opinions,

52
and finally Delphi technique that acquired a final identification of most influential factors on
building projects cost.
According to previous techniques, it is obvious that there is a substantial convergence in
identifying factors affecting on cost of building projects in Gaza Strip. Therefore, the most
influential factors are adopted (skeleton and finishing factors). Table 4.12 shows the most
influential factors that were adopted in this study and were used in building the models as input
parameters. It contains five skeleton factors and four finishing factors.
Table 4-12: Influential Factors of building project Cost adopted in this research
NO. Factors Range
1 Number of floors Number
2 Type of used foundation None-Isolated-Strap-Piles-Mat
3 Area of typical floor Number
4 Type of external finishing None-Normal plaster- Marmarina- Natural stone
5 Volume of HVAC works & false
ceiling
None -Central conditioning-Split units
6 Type & quantity of electrical &
mechanical works
(Basic -Luxury)
7 Number of elevators & staircases Number
8 Type of tile (Ceramic –Terrazzo -Porcelain)
9 Type of slab (Solid- Ribbed - Drop beams)
4.10 Real building projects in Gaza Strip (projects case studies)
This section is very important section because the model building and validation needs a real
data. The projects data were collected from ministries, consultants, municipalities, NGO's and
international organizations. The total number of collected projects were 88 projects. These
projects were divided as the first type is residential buildings which classified according to the
municipalities classification. The second is institutions buildings which can include public
buildings and commercial building as shown in Table 4.13.
Table 4-13: Factors of collected real projects
Mechanical Electric
al
Tilling
type
HAVA
C
External
finish
Elevator
No. Slab
type
Footing
type
Floors
No.
Building
type
Area
m2 Cost $
normal normal Ter. no T.P 0 H Mat 2 residenti
al 65 20250
normal normal Ter. no T.P 0 H Mat 1 residenti
al 75 20510
normal normal Ter. no no 0 H isolated 1 residenti
al 76 21300
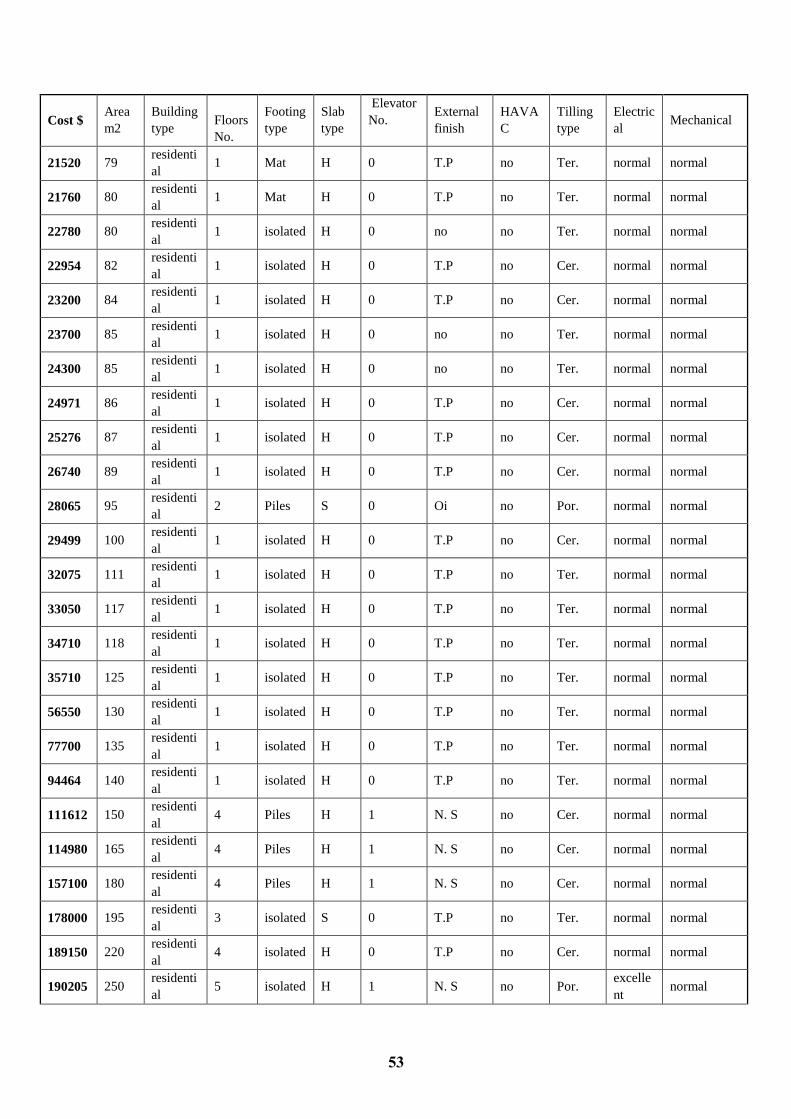
53
Mechanical Electric
al
Tilling
type
HAVA
C
External
finish
Elevator
No. Slab
type
Footing
type
Floors
No.
Building
type
Area
m2 Cost $
normal normal Ter. no T.P 0 H Mat 1 residenti
al 79 21520
normal normal Ter. no T.P 0 H Mat 1 residenti
al 80 21760
normal normal Ter. no no 0 H isolated 1 residenti
al 80 22780
normal normal Cer. no T.P 0 H isolated 1 residenti
al 82 22954
normal normal Cer. no T.P 0 H isolated 1 residenti
al 84 23200
normal normal Ter. no no 0 H isolated 1 residenti
al 85 23700
normal normal Ter. no no 0 H isolated 1 residenti
al 85 24300
normal normal Cer. no T.P 0 H isolated 1 residenti
al 86 24971
normal normal Cer. no T.P 0 H isolated 1 residenti
al 87 25276
normal normal Cer. no T.P 0 H isolated 1 residenti
al 89 26740
normal normal Por. no Oi 0 S Piles 2 residenti
al 95 28065
normal normal Cer. no T.P 0 H isolated 1 residenti
al 100 29499
normal normal Ter. no T.P 0 H isolated 1 residenti
al 111 32075
normal normal Ter. no T.P 0 H isolated 1 residenti
al 117 33050
normal normal Ter. no T.P 0 H isolated 1 residenti
al 118 34710
normal normal Ter. no T.P 0 H isolated 1 residenti
al 125 35710
normal normal Ter. no T.P 0 H isolated 1 residenti
al 130 56550
normal normal Ter. no T.P 0 H isolated 1 residenti
al 135 77700
normal normal Ter. no T.P 0 H isolated 1 residenti
al 140 94464
normal normal Cer. no N. S 1 H Piles 4 residenti
al 150 111612
normal normal Cer. no N. S 1 H Piles 4 residenti
al 165 114980
normal normal Cer. no N. S 1 H Piles 4 residenti
al 180 157100
normal normal Ter. no T.P 0 S isolated 3 residenti
al 195 178000
normal normal Cer. no T.P 0 H isolated 4 residenti
al 220 189150
normal excelle
nt Por. no N. S 1 H isolated 5
residenti
al 250 190205
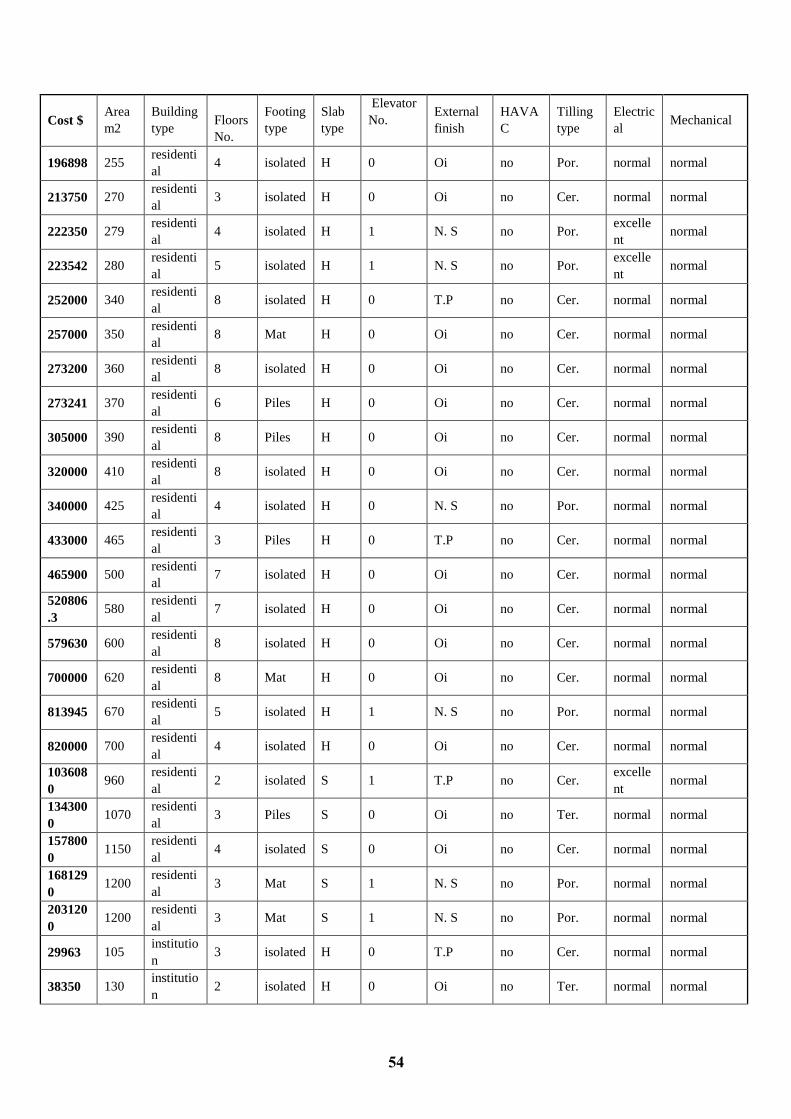
54
Mechanical Electric
al
Tilling
type
HAVA
C
External
finish
Elevator
No. Slab
type
Footing
type
Floors
No.
Building
type
Area
m2 Cost $
normal normal Por. no Oi 0 H isolated 4 residenti
al 255 196898
normal normal Cer. no Oi 0 H isolated 3 residenti
al 270 213750
normal excelle
nt Por. no N. S 1 H isolated 4
residenti
al 279 222350
normal excelle
nt Por. no N. S 1 H isolated 5
residenti
al 280 223542
normal normal Cer. no T.P 0 H isolated 8 residenti
al 340 252000
normal normal Cer. no Oi 0 H Mat 8 residenti
al 350 257000
normal normal Cer. no Oi 0 H isolated 8 residenti
al 360 273200
normal normal Cer. no Oi 0 H Piles 6 residenti
al 370 273241
normal normal Cer. no Oi 0 H Piles 8 residenti
al 390 305000
normal normal Cer. no Oi 0 H isolated 8 residenti
al 410 320000
normal normal Por. no N. S 0 H isolated 4 residenti
al 425 340000
normal normal Cer. no T.P 0 H Piles 3 residenti
al 465 433000
normal normal Cer. no Oi 0 H isolated 7 residenti
al 500 465900
normal normal Cer. no Oi 0 H isolated 7 residenti
al 580
520806
.3
normal normal Cer. no Oi 0 H isolated 8 residenti
al 600 579630
normal normal Cer. no Oi 0 H Mat 8 residenti
al 620 700000
normal normal Por. no N. S 1 H isolated 5 residenti
al 670 813945
normal normal Cer. no Oi 0 H isolated 4 residenti
al 700 820000
normal excelle
nt Cer. no T.P 1 S isolated 2
residenti
al 960
103608
0
normal normal Ter. no Oi 0 S Piles 3 residenti
al 1070
134300
0
normal normal Cer. no Oi 0 S isolated 4 residenti
al 1150
157800
0
normal normal Por. no N. S 1 S Mat 3 residenti
al 1200
168129
0
normal normal Por. no N. S 1 S Mat 3 residenti
al 1200
203120
0
normal normal Cer. no T.P 0 H isolated 3 institutio
n 105 29963
normal normal Ter. no Oi 0 H isolated 2 institutio
n 130 38350

55
Mechanical Electric
al
Tilling
type
HAVA
C
External
finish
Elevator
No. Slab
type
Footing
type
Floors
No.
Building
type
Area
m2 Cost $
normal normal Cer. no N. S 0 H isolated 3 institutio
n 150 104608
normal normal Cer. no N. S 0 H isolated 3 institutio
n 175 155420
normal excelle
nt 3 central Oi 0 H Piles 4
institutio
n 190 173100
normal normal Cer. no N. S 0 H isolated 3 institutio
n 225 190000
normal normal Ter. no Oi 0 H no 2 institutio
n 269 211200
normal normal Ter. no Oi 0 H isolated 2 institutio
n 270 221756
normal normal Por. no Oi 0 D.B. isolated 2 institutio
n 295 224788
normal normal Por. no Oi 0 D.B. isolated 3 institutio
n 320
228137
.3
normal normal Cer. no T.P 0 D.B. isolated 3 institutio
n 360 267100
normal normal Ter. no T.P 0 H no 2 institutio
n 370 275520
normal normal Cer. no T.P 0 D.B. isolated 2 institutio
n 370 279000
normal normal Por. no Oi 0 H Strap 2 institutio
n 420
329993
.6
normal normal Por. no Oi 0 H Strap 2 institutio
n 420 335881
normal normal Por. no Oi 0 H Strap 2 institutio
n 420 336700
normal excelle
nt Ter. no Oi 0 D.B. isolated 1
institutio
n 450 358000
normal normal Por. no Oi 0 H isolated 2 institutio
n 480 441600
excellent normal Cer. no N. S 0 D.B. isolated 3 institutio
n 540 491250
excellent normal Cer. no N. S 0 D.B. isolated 4 institutio
n 580 554050
normal excelle
nt Ter. no T.P 0 H isolated 3
institutio
n 590 565685
excellent normal Ter. no T.P 0 D.B. isolated 1 institutio
n 600 621600
normal normal Ter. no T.P 0 D.B. Piles 1 institutio
n 600 644000
normal normal Ter. no T.P 0 D.B. no 1 institutio
n 630 782460
normal normal Por. no T.P 0 H isolated 4 institutio
n 630 785700
normal excelle
nt Cer. no Oi 0 H isolated 3
institutio
n 670 802235
normal excelle
nt Cer. no Oi 0 H isolated 4
institutio
n 700 833490

56
Mechanical Electric
al
Tilling
type
HAVA
C
External
finish
Elevator
No. Slab
type
Footing
type
Floors
No.
Building
type
Area
m2 Cost $
normal excelle
nt Cer. no Oi 0 H isolated 4
institutio
n 710 835395
excellent excelle
nt Por. central Oi 0 D.B. isolated 6
institutio
n 870 997000
excellent excelle
nt Ter. no T.P 0 H Mat 7
institutio
n 1000
115790
1
excellent excelle
nt Cer. isolated Oi 0 H Mat 5
institutio
n 1100
138880
0
excellent excelle
nt Por. isolated N. S 0 D.B. isolated 3
institutio
n 1180
161000
0
excellent excelle
nt Cer. isolated Oi 0 H Mat 4
institutio
n 1200
203040
0
excellent excelle
nt Cer. isolated Oi 0 H Mat 4
institutio
n 1200
230500
0
(D.B. = Hollow slab with drop beam; H = Hollow slab; S= Solid slab; N. S = normal stone; T.P=
Tryloon plastering; Oi = oixus plastering; Cer. = ceramic tiles; Ter. = terrazzo tiles; Por. = porcelain
tiles).

57
5 CHAPTER 5: MODEL DEVELOPMENT
5.1 Introduction
The case study being dealt with in this search is the developing of a parametric cost estimation
system for building projects. A structured methodology for developing the Support Vector
Machine model has been used to solve the problem at hand. This methodology incorporates
five main phases: 1) Select application 2) Model limitations 3) Model implementation 4)
Training and testing 5) Discussion of results.
5.2 Select Application
This stage involves the study of the existing situation with a view to formulating a feasibility
assessment for selecting and validating the proposed application. The following heuristic rules
are used for selecting successful the applications (Boussabaine, 1996):
• Conventional statistical and mathematical methods are inadequate.
• The problem requires qualitative or complex quantitative reasoning.
• Solutions are derived from highly interdependent parameters that have no precise
quantification.
• Data is multivariate and intrinsically noisy or error prone.
In this research, the cost data did not enable fitting a commonly chosen model, or did not allow
the analyst to discern the appropriate cost estimating relationships; the problem of model
commitment became more complex as the dimensionality of the independent variables set
grew. Therefore, lack of a cost estimation model utilizing SVM for early design stage of
building projects motivated the author and the following model is developed.
There are several types of SVM software’s are used to predict the future values based on the
past data like SPSS, MATLAB, NeuroSolution …etc. Many researchers used NeuroSolution
application in building the SVM model, as it achieved good performance.
The developed model in this research based on NeuroSolution 5.07 for Excel program. It was
selected for its ease of use, speed of training, flexibility of building and executing the SVM
model, and it has multiple criteria for training and testing the model.
In NeuroSolutions, Support Vector Machines (SVMs) are implemented using the kernel
Adatron algorithm. The kernel Adatron maps inputs to a high-dimensional feature space, and
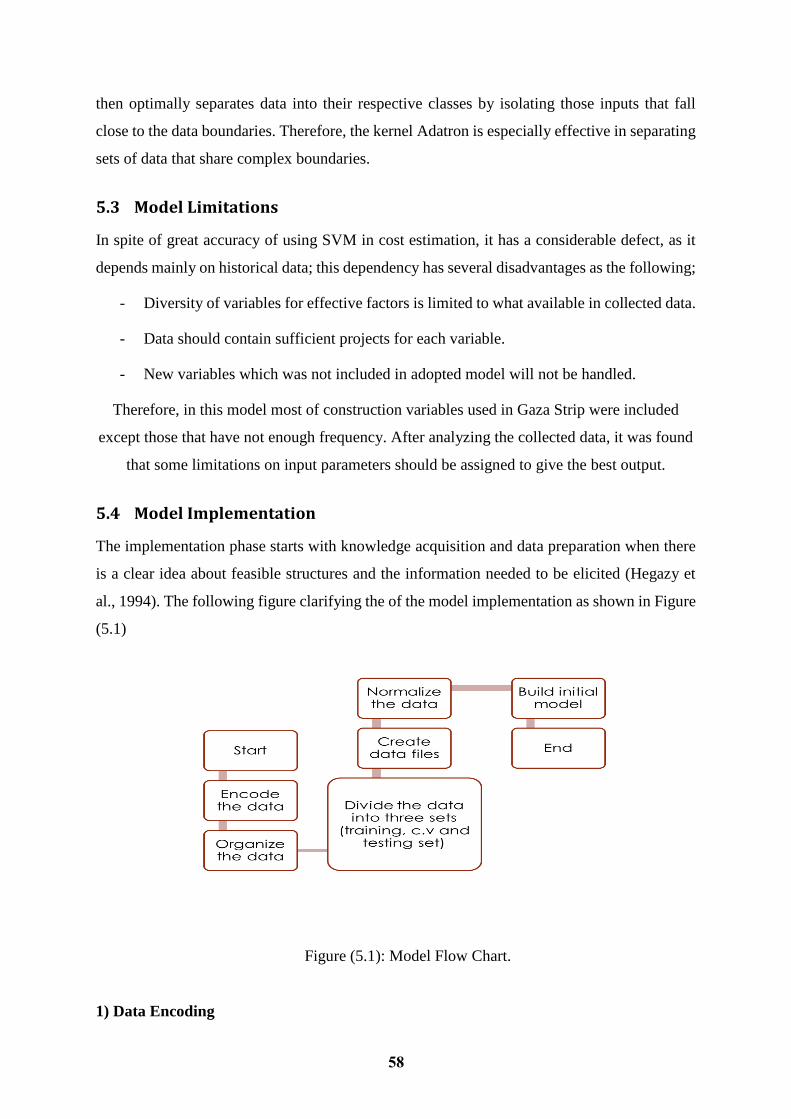
58
then optimally separates data into their respective classes by isolating those inputs that fall
close to the data boundaries. Therefore, the kernel Adatron is especially effective in separating
sets of data that share complex boundaries.
5.3 Model Limitations
In spite of great accuracy of using SVM in cost estimation, it has a considerable defect, as it
depends mainly on historical data; this dependency has several disadvantages as the following;
- Diversity of variables for effective factors is limited to what available in collected data.
- Data should contain sufficient projects for each variable.
- New variables which was not included in adopted model will not be handled.
Therefore, in this model most of construction variables used in Gaza Strip were included
except those that have not enough frequency. After analyzing the collected data, it was found
that some limitations on input parameters should be assigned to give the best output.
5.4 Model Implementation
The implementation phase starts with knowledge acquisition and data preparation when there
is a clear idea about feasible structures and the information needed to be elicited (Hegazy et
al., 1994). The following figure clarifying the of the model implementation as shown in Figure
(5.1)
Figure (5.1): Model Flow Chart.
1) Data Encoding

59
There are many ways to encode the data into a numeric format, and this may be challenging
because there are many ways to do it, and unfortunately some are better than others for neural
network learning (Principe et al., 2010). Support vector machines as artificial neural network
only deal with numeric input data. Therefore, the raw data should be converted from the
external environment (Kshirsagar, 2012). Therefore, the data has been re-written according to
the encoding described in the following Table 5.2
Table 5-1: Encoding of data
No. Input Factors Code
Floor Area in m2
Number of floors In numbers
No. Output Parameter Code
1 Project budget in dollar's
2) Data Organization
Initially, the first step in implementing the SVM model in NeuroSolution application is to
organize the Neurosolution excel spreadsheet. Then, specifying the input factors that have been
already encoded, which consist of 11 factors; Type of project, area of typical floor, number of
floors, type of foundation, type of slab, number of elevators, type of external finishing, type of
air-conditioning, type of tilling, type of electricity, and type of sanitary. The desired parameter
(output) which is (total cost of the project). Figures (5.2) and (5.3) show the procedure of
selecting the input and output factors in the application program.
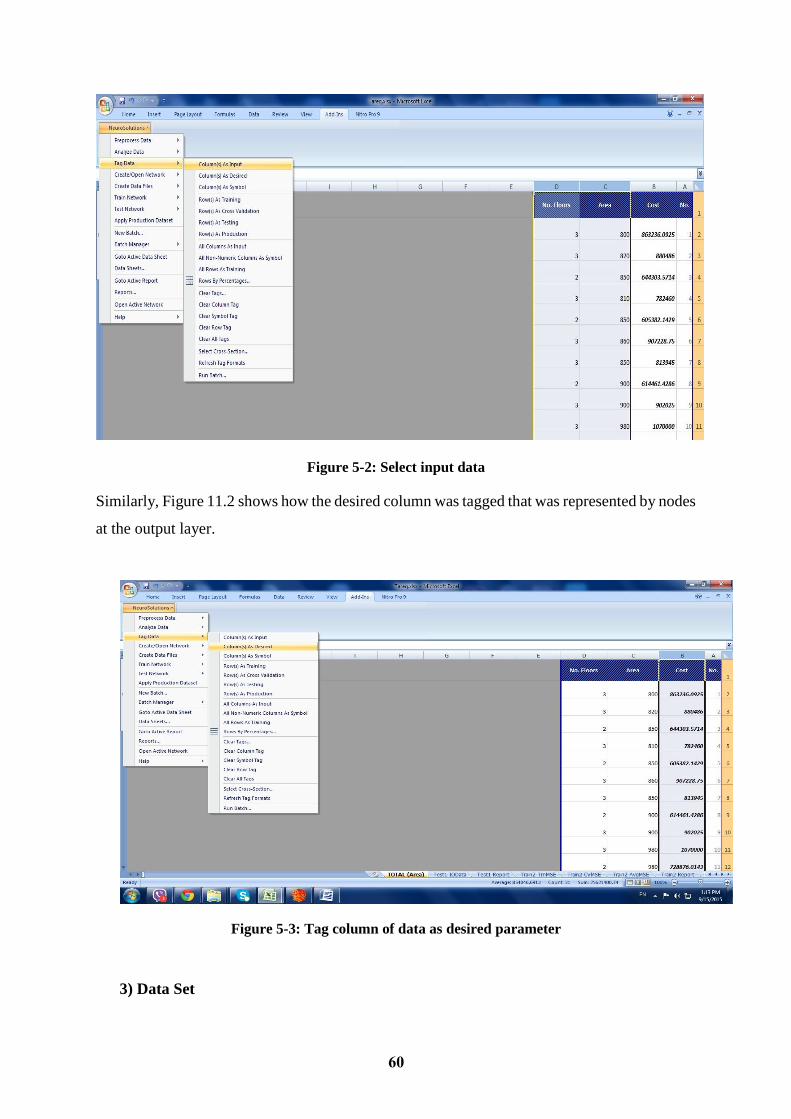
60
Figure 5-2: Select input data
Similarly, Figure 11.2 shows how the desired column was tagged that was represented by nodes
at the output layer.
Figure 5-3: Tag column of data as desired parameter
3) Data Set
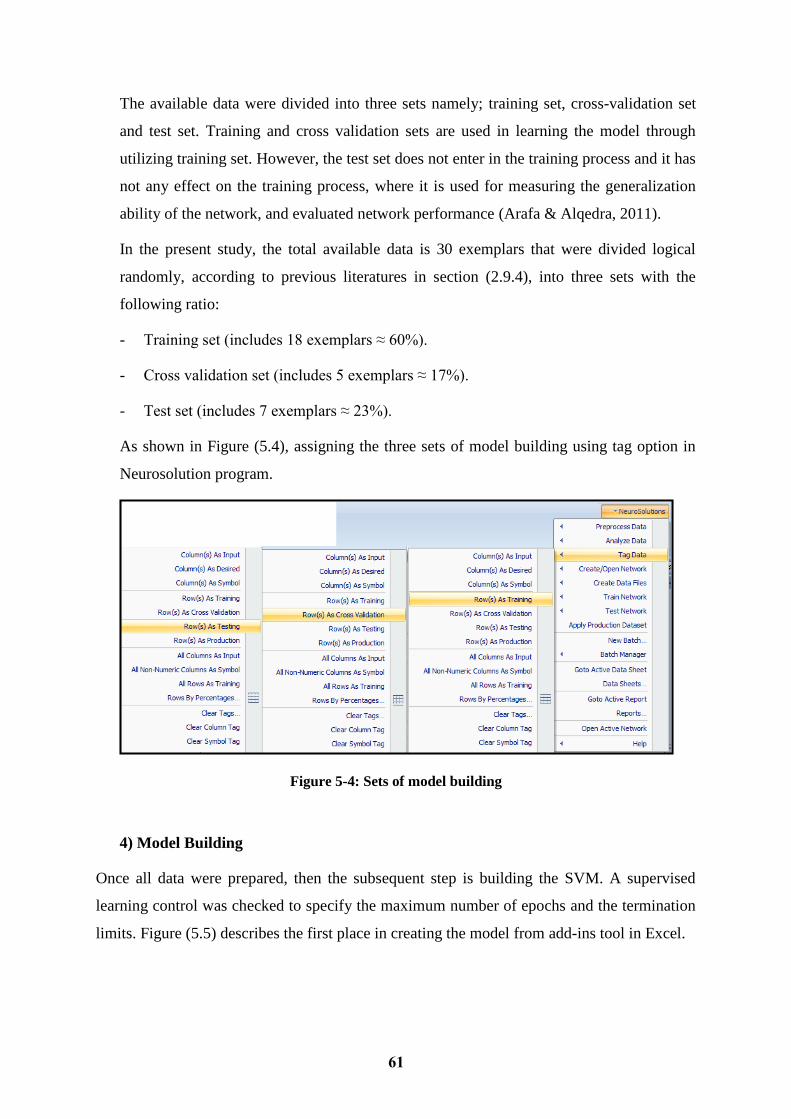
61
The available data were divided into three sets namely; training set, cross-validation set
and test set. Training and cross validation sets are used in learning the model through
utilizing training set. However, the test set does not enter in the training process and it has
not any effect on the training process, where it is used for measuring the generalization
ability of the network, and evaluated network performance (Arafa & Alqedra, 2011).
In the present study, the total available data is 30 exemplars that were divided logical
randomly, according to previous literatures in section (2.9.4), into three sets with the
following ratio:
- Training set (includes 18 exemplars ≈ 60%).
- Cross validation set (includes 5 exemplars ≈ 17%).
- Test set (includes 7 exemplars ≈ 23%).
As shown in Figure (5.4), assigning the three sets of model building using tag option in
Neurosolution program.
Figure 5-4: Sets of model building
4) Model Building
Once all data were prepared, then the subsequent step is building the SVM. A supervised
learning control was checked to specify the maximum number of epochs and the termination
limits. Figure (5.5) describes the first place in creating the model from add-ins tool in Excel.

62
Figure 5-5: Building initial network
The support vector machine was built by selecting the type of network, number of epochs.
Figure (5.6) presents the initial network of support vector machine (SVM) network.
Figure 5-6: Support vector machine (SVM) network
Before starting the training phase, the normalization of training data is recognized to
improve the performance of trained networks by Neurosolution program as shown in Figure
(5.7) which ranging from (0 to 1).
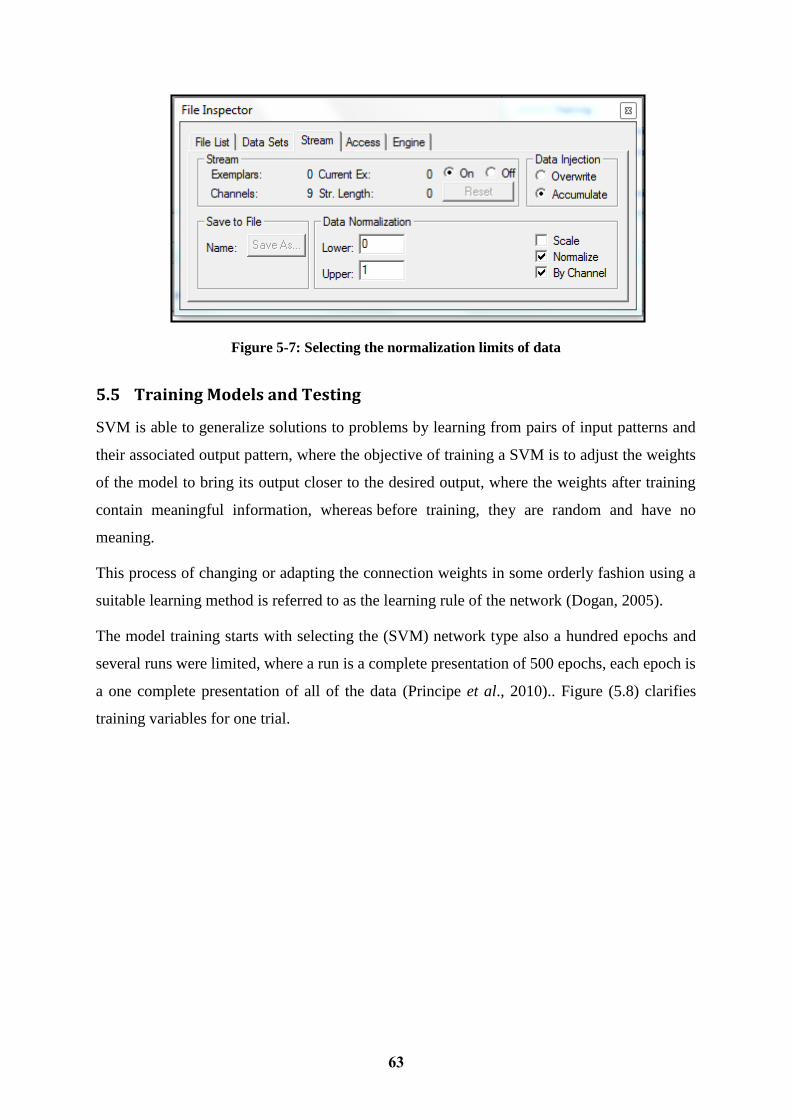
63
Figure 5-7: Selecting the normalization limits of data
5.5 Training Models and Testing
SVM is able to generalize solutions to problems by learning from pairs of input patterns and
their associated output pattern, where the objective of training a SVM is to adjust the weights
of the model to bring its output closer to the desired output, where the weights after training
contain meaningful information, whereas before training, they are random and have no
meaning.
This process of changing or adapting the connection weights in some orderly fashion using a
suitable learning method is referred to as the learning rule of the network (Dogan, 2005).
The model training starts with selecting the (SVM) network type also a hundred epochs and
several runs were limited, where a run is a complete presentation of 500 epochs, each epoch is
a one complete presentation of all of the data (Principe et al., 2010).. Figure (5.8) clarifies
training variables for one trial.
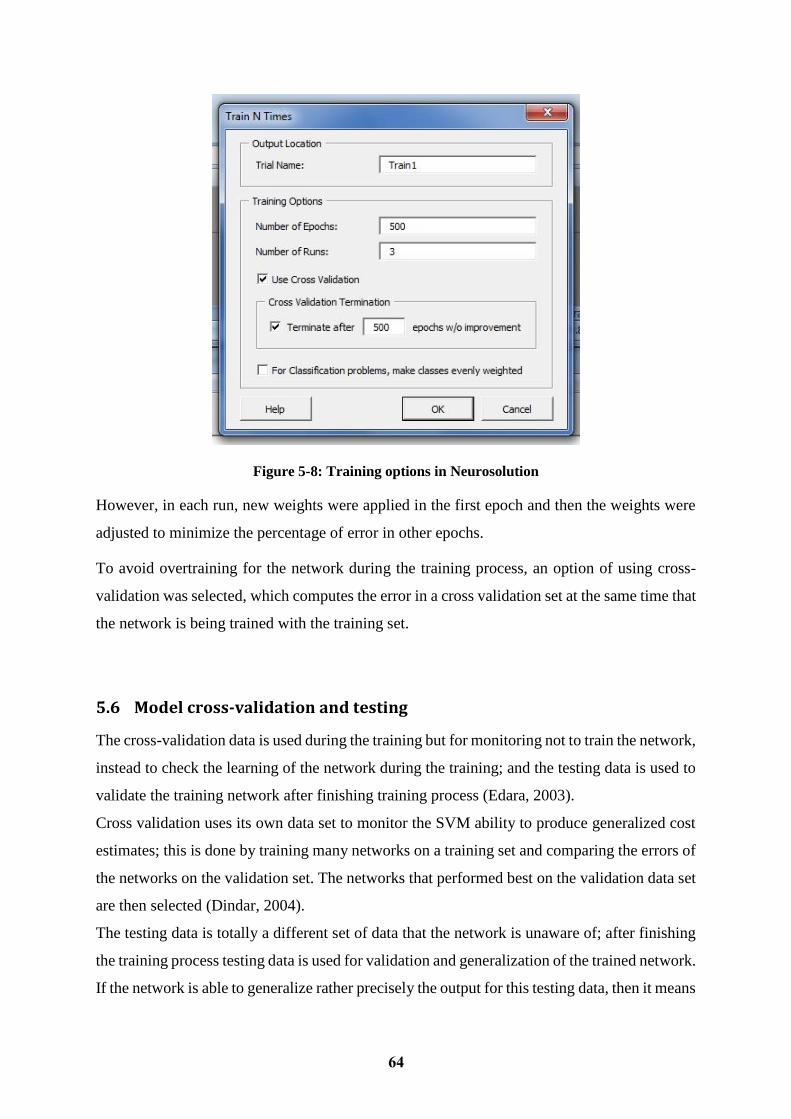
64
Figure 5-8: Training options in Neurosolution
However, in each run, new weights were applied in the first epoch and then the weights were
adjusted to minimize the percentage of error in other epochs.
To avoid overtraining for the network during the training process, an option of using cross-
validation was selected, which computes the error in a cross validation set at the same time that
the network is being trained with the training set.
5.6 Model cross-validation and testing
The cross-validation data is used during the training but for monitoring not to train the network,
instead to check the learning of the network during the training; and the testing data is used to
validate the training network after finishing training process (Edara, 2003).
Cross validation uses its own data set to monitor the SVM ability to produce generalized cost
estimates; this is done by training many networks on a training set and comparing the errors of
the networks on the validation set. The networks that performed best on the validation data set
are then selected (Dindar, 2004).
The testing data is totally a different set of data that the network is unaware of; after finishing
the training process testing data is used for validation and generalization of the trained network.
If the network is able to generalize rather precisely the output for this testing data, then it means
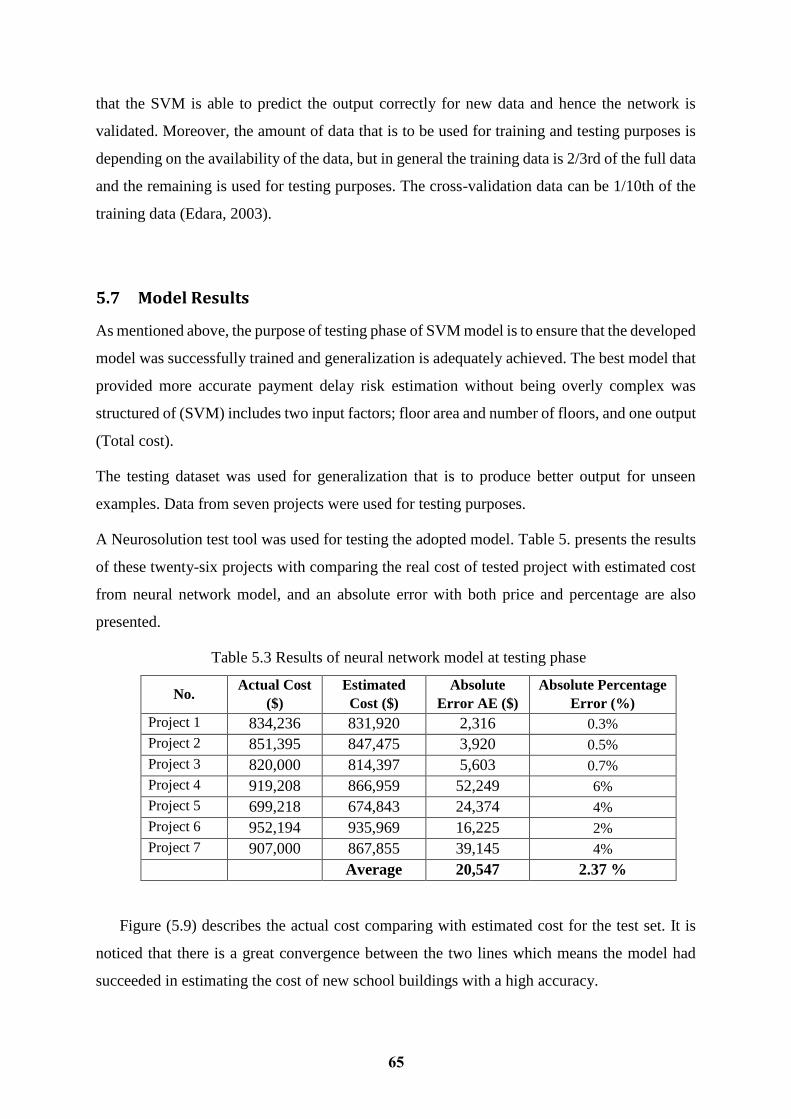
65
that the SVM is able to predict the output correctly for new data and hence the network is
validated. Moreover, the amount of data that is to be used for training and testing purposes is
depending on the availability of the data, but in general the training data is 2/3rd of the full data
and the remaining is used for testing purposes. The cross-validation data can be 1/10th of the
training data (Edara, 2003).
5.7 Model Results
As mentioned above, the purpose of testing phase of SVM model is to ensure that the developed
model was successfully trained and generalization is adequately achieved. The best model that
provided more accurate payment delay risk estimation without being overly complex was
structured of (SVM) includes two input factors; floor area and number of floors, and one output
(Total cost).
The testing dataset was used for generalization that is to produce better output for unseen
examples. Data from seven projects were used for testing purposes.
A Neurosolution test tool was used for testing the adopted model. Table 5. presents the results
of these twenty-six projects with comparing the real cost of tested project with estimated cost
from neural network model, and an absolute error with both price and percentage are also
presented.
Table 5.3 Results of neural network model at testing phase
No. Actual Cost
($)
Estimated
Cost ($)
Absolute
Error AE ($)
Absolute Percentage
Error (%)
Project 1 834,236 831,920 2,316 0.3%
Project 2 851,395 847,475 3,920 0.5%
Project 3 820,000 814,397 5,603 0.7%
Project 4 919,208 866,959 52,249 6%
Project 5 699,218 674,843 24,374 4%
Project 6 952,194 935,969 16,225 2%
Project 7 907,000 867,855 39,145 4%
Average 20,547 2.37 %
Figure (5.9) describes the actual cost comparing with estimated cost for the test set. It is
noticed that there is a great convergence between the two lines which means the model had
succeeded in estimating the cost of new school buildings with a high accuracy.
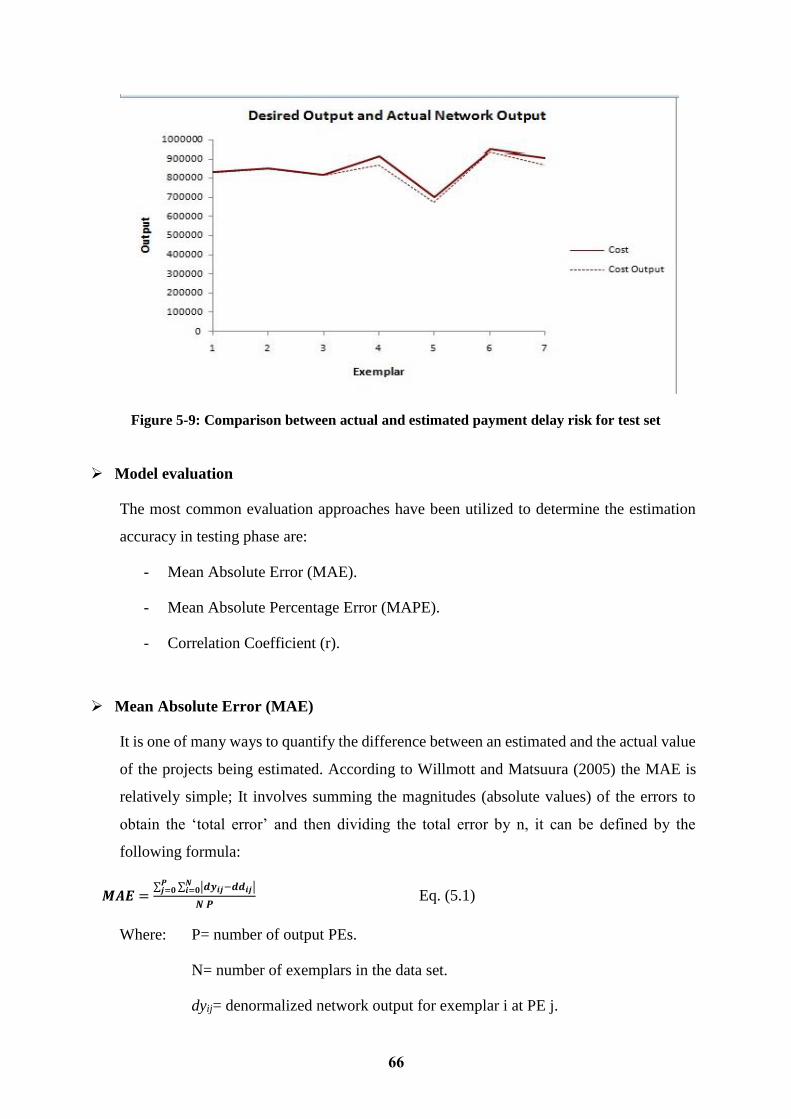
66
Figure 5-9: Comparison between actual and estimated payment delay risk for test set
Model evaluation
The most common evaluation approaches have been utilized to determine the estimation
accuracy in testing phase are:
- Mean Absolute Error (MAE).
- Mean Absolute Percentage Error (MAPE).
- Correlation Coefficient (r).
Mean Absolute Error (MAE)
It is one of many ways to quantify the difference between an estimated and the actual value
of the projects being estimated. According to Willmott and Matsuura (2005) the MAE is
relatively simple; It involves summing the magnitudes (absolute values) of the errors to
obtain the ‘total error’ and then dividing the total error by n, it can be defined by the
following formula:
𝑴𝑨𝑬 =∑ ∑ |𝒅𝒚𝒊𝒋−𝒅𝒅𝒊𝒋|𝑵
𝒊=𝟎𝑷𝒋=𝟎
𝑵 𝑷 Eq. (5.1)
Where: P= number of output PEs.
N= number of exemplars in the data set.
dyij= denormalized network output for exemplar i at PE j.
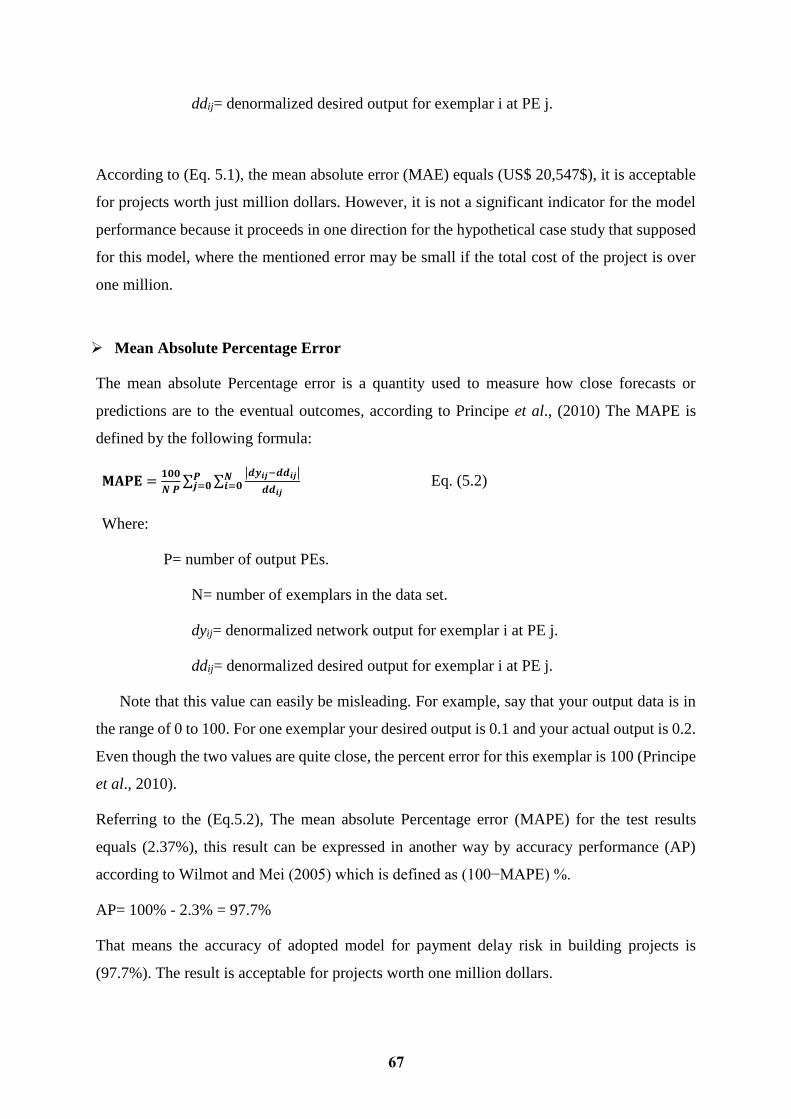
67
ddij= denormalized desired output for exemplar i at PE j.
According to (Eq. 5.1), the mean absolute error (MAE) equals (US$ 20,547$), it is acceptable
for projects worth just million dollars. However, it is not a significant indicator for the model
performance because it proceeds in one direction for the hypothetical case study that supposed
for this model, where the mentioned error may be small if the total cost of the project is over
one million.
Mean Absolute Percentage Error
The mean absolute Percentage error is a quantity used to measure how close forecasts or
predictions are to the eventual outcomes, according to Principe et al., (2010) The MAPE is
defined by the following formula:
𝐌𝐀𝐏𝐄 =𝟏𝟎𝟎
𝑵 𝑷∑ ∑
|𝒅𝒚𝒊𝒋−𝒅𝒅𝒊𝒋|
𝒅𝒅𝒊𝒋
𝑵𝒊=𝟎
𝑷𝒋=𝟎 Eq. (5.2)
Where:
P= number of output PEs.
N= number of exemplars in the data set.
dyij= denormalized network output for exemplar i at PE j.
ddij= denormalized desired output for exemplar i at PE j.
Note that this value can easily be misleading. For example, say that your output data is in
the range of 0 to 100. For one exemplar your desired output is 0.1 and your actual output is 0.2.
Even though the two values are quite close, the percent error for this exemplar is 100 (Principe
et al., 2010).
Referring to the (Eq.5.2), The mean absolute Percentage error (MAPE) for the test results
equals (2.37%), this result can be expressed in another way by accuracy performance (AP)
according to Wilmot and Mei (2005) which is defined as (100−MAPE) %.
AP= 100% - 2.3% = 97.7%
That means the accuracy of adopted model for payment delay risk in building projects is
(97.7%). The result is acceptable for projects worth one million dollars.

68
Correlation Coefficient (R)
Regression analysis was used to ascertain the relationship between the estimated cost and the
actual cost.. The correlation coefficient (R) is 0.973, indicating that; there is a good linear
correlation between the actual value and the estimated neural network cost at tested phase.
The results of performance measures according to the Neurosolution program are presented in
Figure 5-10: where the correlation coefficient (R) = 0.973 and MAE = 20, 547 $ as calculated
previously.
Figure 5-10: Results of performance measurements according to the Neurosolution app

69
6 CHAPTER 6: CONCLUSION AND RECOMMENDATIONS
6.1 Introduction
Cost estimation done during the conceptual phase of the project cycle is usually calculated
approximately, which leads to great inaccuracy (±20 % range). The reasons for that are due to
the project details are not fixed as well as the lack of information. In such case, SVM could be
a suitable tool for estimating project cost. Project managers in Gaza Strip, often need to
estimate the cost of construction projects at early stage quickly and approximately to provide
funding or to obtain the adoption of the budget from decision-makers. Therefore, it is important
to find a way to know the cost of the construction projects in a short time with acceptable
accuracy.
The main objective of this research is to develop SVM model to estimate the cost at early
stage of construction projects in Gaza strip. To achieve this there is a need for identifying the
factors that affect the cost of construction projects including subjective and risk-related factors
that can be available at early stage.
Parametric cost estimating technique lead this research to study a lot of previous research
and recognize the influential parameters in construction cost at early stage. Delphi technique
was used to identify nine factors that affect cost of construction projects.
Many projects were collected from the Ministry of Public Works and Housing, contractors
and consultants. Data collected were analyzed and the research problem identified
6.2 Conclusion
This study aimed at developing a new technique for early cost estimate of building projects
in Gaza Strip, through developing a model that is able to help parties involved in construction
projects (owner, contractors, and others) in obtaining the total cost information at the early
stages of project with limited available information.
Several steps and procedures were conducted in order to achieve this aim as following:
1) A questionnaire survey, expert interviews and exploratory search of previous studies
were used to identify the cost effective factors on building projects. nine key parameters
were adopted as most influential factors on building costs which are use of building, area
of typical floor, number of stories, type of the foundation, slab type, type of tilling, type
of external finishing, number of elevators, Mechanical, Electrical.

70
2) Historical data of building projects were collected. The projects were executed between
2010 and 2014 in Gaza Strip, from government ministries, UNRWA, engineering
institutions, contractors and consultants. The data was analyzed and some of data were
excluded due to some basic conditions.
3) Developing SVM model passed through several steps started with selecting the
application to be used in building the model. The SPSS and EXCEL program was
selected for its efficiency in several previous researches in addition to its ease of use and
extract results.
4) The accuracy performance of the adopted model recorded 97% where the model
performed well and no significant difference was discerned between the estimated output
and the actual budget value. The acceptable error rate in early stage of building projects
as mentioned in researches and studies is ranging between (0.2-0.5%) while the average
percentage error of this model is 2.37%.
5) In order to ensure the validity of the model in estimating the cost of new projects, many
statistical performance measures were conducted i.e; Mean Absolute Error (MAE), Mean
Absolute Percentage Error (MAPE), Total Mean Absolute Percentage Error (Total
MAPE), and Correlation Coefficient (r). The results of these performance measures were
acceptable and reliable, where the mean percentage error of the model was 2.37%, and
the total mean absolute percentage error was 0.973
6) The approach as presented is capable of providing accurate estimates of project cost by
using nine parameters at the early design phase
7) Some assumption and limitation were assumed in the study according to available
collected data. These limitations include the available choices of each factor as Area of
typical floors for example, has limited area between 60 m2 to 1000 m2, as well as the
other input factors.
6.3 Recommendations
The following recommendations are the most important ones that can be deduced by this
research:

71
6.3.1 Recommendations to Owners & Consultants
1) As this study revealed that the vast majority of construction cost exceed the estimation
cost, clients and consultant are advised to ensure that the pricing team is fully supported
with the necessary tools and techniques to deal with this matter.
2) Clients and consultants should give more attention to cost estimating process in order
to enhance productivity and accuracy. They should monitor the performance of their
estimates in terms of accuracy and hire a qualified technical staff in order to obtain the
accurate estimate.
3) A clear identification of the construction project requirements is essential before the
start of the estimate. Care by clients should be taken to keep changes in the scope of
work as minimum as possible.
4) Estimates based on updated price information should be considered in order to come
up with accurate estimate and avoid any wrong estimation.
5) After the completion of each project, clients and consultants have to compare actual
costs with projected costs to evaluate their cost estimating proficiency and improve
their skill.
6) Clients and consultants are recommended to keep continuously records for all cost
related data and built a historical database of finished project. This unique database
should be the main source of information that will be used in estimating future projects.
6.3.2 Recommendations to Contractors
1) It is recommended that each contracting company continuously keeps records for all
cost related data and built a historical database for the company. This unique database
should be the main source of information that will be used in estimating future projects.
2) It is recommended that the estimators in contracting companies attend courses in
using estimating software to improve their capabilities in this field.
3) The local contracting companies are invited to have an estimating software package
and use it in estimating the works in order to get more accurate estimate, save time,
minimize error, and hopefully to have better chance to win bids.

72
6.3.3 Recommendations to Government, Contractors' Union and Association of
Engineers
1) It is recommended to conduct training courses in computer applications in estimating.
This training and seminars aim to improve the local practice in cost estimating and
increases the capabilities of estimators in using estimating software packages.
2) The construction projects information should be organized in a computerized system to
improve the accuracy of cost estimation practice in Gaza Strip. It is recommended if
there is center for construction data.
6.3.4 Recommendations for Further Studies
1) The survey was conducted in Gaza Strip in a period where the construction business
was deteriorated or even paralyzed, which in turn was reflected on the results of the
research. It is recommended to conduct another survey when the construction industry
recovers and make a comparative analysis to the results.
2) It's recommended to make models for every type of building alone, to enable the
researcher to write all rules to get general results that can be generalize to all projects.
3) The results are encouraging for further research of expanded data sets and give estimate
for several outputs such as the networks costs, the project duration and others.
73
7 REFERENCES
Abdal-Hadi, M. (2010) Factors Affecting Accuracy of Pre-tender Cost Estimate in Gaza Strip.
Unpublished M. Sc. thesis, Islamic University, Gaza, Palestine.
Abu Jamous, H. (2013) Parametric Cost Estimation of Road Projects Using Artificial Neural
Networks Unpublished M. Sc. thesis, Islamic University, Gaza, Palestine.
Adeli, H. and Jiang, X. (2003) Neuro-Fuzzy Logic Model for Freeway Work Zone Capacity
Estimation. Journal of Transportation Engineering, Vol. 129, No. 5, pp 484–493.
Ahuja, H., Dozzi, S. and Abou Rizk, S. (1994) Project management techniques in planning
and controlling construction projects, 2nd ed., John Wiley and Sons Inc., New York.
Akintoye, A. (2000) Analysis of factors influencing project cost estimating practice.
Construction Management and Economics, Vol.18, No. 1, pp. 77-89.
Al.Hamidi, I. and Mohammed, M. (2009) Quality Control of Cost Estimation Process in
Construction Organizations. Eng.& Tech. Journal, Vol.27, No.4.
Aljarosha, Z. (2008) Impact of conditions of contract for construction (FIDIC 99). Unpublished
M. Sc. thesis, Islamic University, Gaza, Palestine.
Al-Najjar, J. (2008) Factors influencing time and cost overruns on construction projects in the
Gaza Strip. Unpublished M. Sc. thesis, Islamic University, Gaza, Palestine.
Al-Shanti, Y. (2003) A Cost Estimate System for Gaza Strip Construction Contractors.
Unpublished M. Sc. thesis, Islamic University, Gaza, Palestine.
Arafa, M. and Alqedra, M. (2011) Early stage cost estimation of building construction projects
using artificial neural networks. Journal Of Artifical Intelligence, Vol. 4, No.1, pp.
63-75.
Barrie, D. and Paulson, B. (1993) Professional construction management. 3rd edition. UK :Mc
Grow-Hill.
Beheshti, M. and Lollar, J. (2008) Fuzzy logic and performance evaluation: discussion and
application, International Journal of Productivity and Performance Management,
Vol. 57 Iss: 3 pp. 237 – 246.
Bell, J. (2005) Doing your Research Project. 4th Edition, McGraw-Hill Education,
Maidenhead, England.
Bhatnagar, R. and Ghose, M. (2012) Comparing Soft Computing Techniques For Early Stage
Software Development Effort Estimations. International Journal of Software
Engineering & Applications (IJSEA), Vol.3, No.2.
74
Bo, X. and Albert, C. (2011) Measuring complexity for building projects : a Delphi study.
Engineering, Construction and Architectural Management, Queensland University of
Technology(QUT), Australia. Vol. 19 No.1, pp. 7-24.
Cavalieri, S., Maccarrone, P., Pinto, R., (2004). Parametric vs. neural networkmodels for the
estimation of production costs: A case study in the automotive industry. Int. J.
Production Economics VOL. 91, PP.165–177.
Cheng M., Tsai H., Sudjono E., (2010). Conceptual cost estimates using evolutionary fuzzy
hybrid neural network for projects in construction industry. Expert Systems with
Applications VOL. 37 , PP. 4224–4231.
Cheng, M., Tsai H., and Sudjono, E. (2010) Conceptual cost estimates using evolutionary fuzzy
hybrid neural network for projects in construction industry. Expert Systems with
Applications Journal, Vol. 37, pp. 4224-4231.
Construction Projects Using Evolutionary Fuzzy Neural Inference Model. Automation in
Construction Journal, Vol.18, No.2, pp. 164–172
Dysert, L. R. (2005) So you think you're an estimator?. AACE International Transactions,
EST.01. West Virginia.
Dysert, L. R. (2006) Is "estimate accuracy" an oxymoron?. AACE International Transactions
EST.01: EST01.1 - 01.5.
ElSawy, I., Hosny, H., and Abdel Razek, M. (2011) A Neural Network Model for Construction
Projects Site Overhead Cost Estimating in Egypt. IJCSI International Journal of
Computer Science Issues, Vol. 8, Issue 3, No. 1.
Enshassi, A. Mohamed, S. and Madi. I. (2007) Contractors’ Perspectives towards Factors
Affecting Cost Estimation in Palestine. Jordan Journal of Civil Engineering, Volume
1, No. 2.
Enshassi, A., Mohamed, S. and Madi, I. (2005) Factors affecting accuracy of cost estimation
of building contracts in the Gaza Strip, Journal of Financial Management of Property
and Construction, Vol. 10 Iss: 2 pp. 115 – 125.
Eriksson, P. (2003) Long-term relationships between parties in construction projects - Away
to increase competitive advantage. 17th Nordic Conference on Business Studies,
Reykjavik, Iceland, 2003.
Fellows, R. and Liu, A. (2008) Research methods for construction. 3rd edition. United
Kingdom, Blackwell Publishing Ltd.
Feng, W., Zhu, W. and Zhou, Y. (2010) The Application of Genetic Algorithm and Neural
Network in Construction Cost Estimate. The Third International Symposium on

75
Electronic Commerce and Security Workshops(ISECS ’10) Guangzhou, P. R. China,
pp. 151-155.
Gandhinathan, R., Raviswaran, N. and Suthakar, M. (2004) QFD- and VE-enabled target
costing: a fuzzy approach. International Journal of Quality & Reliability
Management, Vol. 21 Iss: 9 pp. 1003 – 1011.
Ganiyu, B. and Zubairu, I. (2010) Project Cost Prediction Model Using Principle Component
Regression For Public Building Projects In Nigeria. Journal of Building Performance,
Volume 1, Issue 1.
GAO. (2009) "Cost estimating and assessment guide". United States Government
Accountability Office , GAO-09-3SP .Washington.
Gunaydın M., Dogan Z., (2004). A neural network approach for early cost estimation of
structural systems of buildings, International Journal of Project Management VOL.
22 PP. 595–602.
Hajek, P. (1998) Metamathematics of Fuzzy Logic. Kluwer Academic Publishers, Dordrecht.
Han, K. J., Lee, H. S., Park, M. and Ji, H.S. (2008) Cost Estimating Methodology Using
Database Layer In Construction Projects. The 25th International Symposium on
Automation and Robotics in Construction, pp 470-475,Vilnius, Lithuania.
Hendrickson, C. (2000) Project management for construction. 2nd edition. Pittsburgh.
Henry, R., McCray, G., Purvis ,R. and Roberts, T. (2002) Exploiting organizational knowledge
in developing IS project cost and schedule estimates: An empirical study. Information
& Management. Vol. 44, pp 598–612.
Holm L., Schaufelberger J. E., Griffin D. and Cole T. (2005) Construction Cost Estimating:
Process and Practices. Upper Saddle River, N. J.: Prentice Hall.
Idri, A. , Abran, A. and Khoshgoftaar, k. (2001) Fuzzy Case-Based Reasoning Models for
Software Cost Estimation. In Proceedings of the 11th International
Idri, A. and Abran, A. (2001) Towards a fuzzy logic based measures for software projects
similarlity. 7th International Symposium on Software Metrics, pp. 85-96, England,
UK.
Jamkhaneh, E. and Gildeh, B. (2011) Chain Sampling Using Fuzzy Probability Theory.
Journal of Applied Sciences. Vol. 11 Iss: 24, pp. 3830 – 3838.
Jantzen, J. (1998) Tutorial On Fuzzy Logic. Tech. report no 98-E 868. Technical University of
Denmark, Department of Automation, Denmark.
Jantzen, J. (2007) Foundations of Fuzzy Control. Chichester, England. John Wiley & Sons Ltd.
Journal, Vol. 115, No. 4.
76
Jrade, A. and Alkass, S. (2007) Computer-Integrated System for Estimating the Costs of
Building Projects. Journal of Architectural Engineering. Vol. 13, No.4.
Kern, A. and Formoso, C. (2006) A model for integrating cost management and production
planning and control in construction. Journal of Financial Management of Property
and Construction, Vol. 11 Iss: 2, pp. 75 – 90.
Kumar, S., Mandala, A., Chaitanya, V. and Prasad, V. (2011) Fuzzy logic for Software Effort
Estimation Using Polynomial Regression as Firing Interval. International Journal of
Computer Technology and Applications(IJCTA), Vol. 2, No.6, pp1843-1847.
Langford, D., Hancock, M., Fellows, R. and Gale, W. (2000) "Human resources management
in construction".4th edition. Edinburg Gate England: Person Education Limited.
Madi, I. (2003) Essential factors affecting accuracy of cost estimation of building contractors.
Unpublished M. Sc. thesis, Islamic University, Gaza, Palestine.
Math works, (2010) Fuzzy Logic Toolbox User’s Guide. MATLAB 6.0, Math works,
Inc.,2010.
Memon, A., Abdul Rahman, I., Abdullah, M. and Abdu Azis, A. (2010) Factors Affecting
Construction Cost in Mara Large Construction Project: Perspective of Project
Management Consultant. International Journal of Sustainable Construction
Engineering & Technology. Vol. 1, No 2.
Metaxiotis, K., Psarras, J. and Samouilidis, E., (2003) Integrating fuzzy logic into decision
support systems: current research and future prospects. Information Management &
Computer Security, Vol. 11 Iss: 2 pp. 53 – 59.
Mittal, H. and Bhatia, P. (2007) Optimization Criteria for Effort Estimation using Fuzzy
Technique. Clei Electronic Journal, Volume 10, No1, p 2.
Multiple Regression Techniques, Journal of Construction Engineering and Management,
132-7, p.750-758.
Naoum, S. (2007) Dissertation Research and Writing for Construction Students. 2nd Edition
ed. London: Elsevier Ltd.
Nguyen, H., Prasad, N., Walker, c. and Walker, A., (2003) A first course in fuzzy and neural
control. Chapman & Hall/CRC, A CRC Press Company Boca Raton London, New
York, Washington, D.C.
Odeyinka, H. and Lowe, J., (2002) Factor Approach To The Analysis Of Risks Influencing
Construction Cost Flow Forecast. RICS Construction and Building Research
(COBRA) Conference. Nottingham, UK. pp 120 -131.
77
on the Gaza Strip contractor’s cost estimation. Unpublished M. Sc. thesis, Islamic
University, Gaza, Palestine.
Ordoobadi, S. (2008) Fuzzy logic and evaluation of advanced technologies. Industrial
Management & Data Systems, Vol. 108 Iss: 7 pp. 928 – 946.
Ordoobadi, S. (2009) Development of a supplier selection model using fuzzy logic. Supply
Chain Management: An International Journal, Vol. 14 Iss: 4 pp. 314 – 327.
Popescu, C., Phaobunjong, K. and Ovararin, N. (2003) Estimating Building Costs.1st edition.
Marcel Dekker, Inc. New York, USA.
Ray, A., Sarkar, B. and Sanyal, S. (2010) Process cost prediction: a soft computing approach.
International Journal of Intelligent Computing and Cybernetics, Vol. 3 Iss: 3 pp. 431
– 448.
Reddy, P., Sudha, R. and Sree, R. (2011) Application of Fuzzy Logic Approach to Software
Effort Estimation. International Journal of Advanced Computer Science and
Applications, Vol. 2, No. 5.
Sachdeva, K., Hanmandlu, M. and Kumar, A. (2012) Real Life Applications of Fuzzy Decision
Tree. International Journal of Computer Applications. Volume 42– No.10, pp24-28.
Shehatto, O. (2013) Factors Cost estimation for building construction projects in Gaza Strip
using Artificial Neural Network (ANN).Unpublished M. Sc. thesis, Islamic University,
Gaza, Palestine.
Sheikh, N. (2013) COST ESTIMATION OF CONSTRUCTION PROJECTS AT GAZA STRIP
USING FUZZY LOGIC Unpublished M. Sc. thesis, Islamic University, Gaza,
Palestine.
Simon, D. (2003) Introduction to fuzzy control. Courtesy of Embedded Systems Programming.
http://www.embedded.com/showArticle.jhtml?articleID=10700619.
Sivanandam, S., Sumathi, S. and Deepa, S. (2007) Introduction to Fuzzy Logic using
MATLAB. Springer-Verlag Berlin Heidelberg.
Smith A.E., Mason A.K. (1997), Cost estimation predictive modeling: Regression versus
neural network; The Engineering Economist 42(2); 137–161.
Sonmez, R. (2004). Conceptual cost estimation of building projects with regression analysis
and neural networks. Canadian Journal of Civil Engineering, 31(4), 677 – 683.
Steward, Rodney D. (1991) Cost Estimating, 2nd ed., John Wiley & Sons, Inc., New York.
Surmann, H. and Selenschtschikow, A. (2002) Automatic generation of fuzzy logic rule bases:
Examples I. First International ICSC Conference On Neuro-Fuzzy Technologies, PP
75-81, Cuba.
78
Tan, Y. and Shen, L. (2010) A fuzzy competence requirement (FCR) model for competitive
bidding strategy. Construction Innovation: Information, Process, Management, Vol.
10 Iss: 1, pp. 75 – 88.
Teodorovic, D. (1999) Fuzzy Logic Systems For Transportation Engineering: The State Of The
Art. Elsevier Science, Transportation Research Part A 33, pp337-364.
Trost, S. M., and Oberlender, G. D. (2003). Predicting Accuracy of Early Cost Estimates
Using Factor Analysis and Multivariate Regression, Journal of Construction
Engineering and Management, Vol. 129, No. 2, pp. 198–204.
Turochy, R. Hoel, L. and Doty, R. (2001) Highway Project Cost Estimating Methods Used In
The Planning Of Project Development. Technical Assistance Report, Virginia
Transportation Research Council, VTRC 02-TAR3.
Uppal, K.B. (1997) Estimating? Past, Present and 21st Century. Transaction of the AACE 41st
Annual Meeting, July 1997, pp.Est.01.1-EST 01.4.
Verma, A. (1997) Construction of offender profiles using fuzzy logic. Policing: An
International Journal of Police Strategies & Management, Vol. 20 Iss: 2, pp. 408 –
418.
Willmott, C. & Matsuura, K. (2005) Advantages of the mean absolute error (MAE) over the
root mean square error (RMSE) in assessing average model performance. Climate
Research, Volume 30, p. 79–82.
Zadeh, L.A. (1965) Fuzzy Set. Information and Control, vol. 8, pp. 338-353.
Zheng, X. and Guang, M. (2012) On the Estimate Method of Construction Engineering Cost
Based on the RS-GA-NNA Model". Research Journal of Applied Sciences,
Engineering and Technology. Vol.4.No13, pp2003-2008.
بسم هللا الرحمن الرحيم

79
الجامعة اإلسالمية
عمادة الدراسات العليا
قسم الهندسة المدنية -كلية الهندسة
ةـاناســتـبـ
Influential factors on prices of building projects in Gaza Strip
في قطاع غزةعملية التسعير في المشاريع اإلنشائية العوامل المؤثرة علي
جزء من البحث التكميلي لنيل درجة الماجستير في إدارة التشييد ك وذلك
الباحث
م.طارق ريان
إشراف
الدكتور/ نبيل الصوالحي
فلسطين -غزة
2015
اإلنشائية عملية التسعير في المشاريع دراسة العوامل المؤثرة علي هدف إلي ت ةاناستب للمباني
في قطاع غزة من وجهة نظر المقاولين

80
: السالم عليكم ورحمة هللا وبركاتهالمهندس/السيد المقاول
.ةانبتاالس هبداية أتقدم لكم بجزيل الشكر والتقدير لمساهمتكم بجزء من وقتكم وجهدكم في تعبئة هذ المشاريع اإلنشائية وقطاع التشييد والبناء لذلك تعتبر عملية التسعير من األنشطة األساسية والمهمة في
فان هذه االستبانة تهدف إلي دراسة العوامل المؤثرة علي عملية التسعير في المشاريع اإلنشائية للمباني
في قطاع غزة, وهي جزء من البحث التكميلي لنيل درجة الماجستير في إدارة التشييد في الجامعة
اإلسالمية بغزة.
:ةانستبمكونات اال
التعريف بالجهة المعنية الجزء األول:
العوامل التي تؤثر علي عملية التسعير في مشاريع إنشاء المباني في قطاع غزة ويتكون الجزء الثاني:
من قسمين:
)العوامل المتعلقة بعملية اإلنشاء األساسية للمباني )البناء الهيكلي
.العوامل المتعلقة بعملية تشطيب المبني
-:ةانالمعلومات الواردة في االستب
إن كافة المعلومات الواردة في هذا االستبيان سوف يتم استخدامها ألغراض البحث العلمي مع االلتزام
التام بالمحافظة علي سرية المعلومات الخاصة بكم.
كاألتي: ةانن تكون طريقة اإلجابة على االستبأرجو أ
(. 5 – 1تقييم العوامل الكيفية و ذلك بإعطاء كل عامل الدرجة المناسبة ) -أ
يؤثر بدرجة متوسطة - 3يؤثر بعض الشيء - 2يؤثر بدرجة قليلة -1
يؤثر بدرجة كبيرة جدا -5يؤثر بدرجة كبيرة -4
بعض العوامل األخرى.( ل Xوضع العالمة ) -ب
الجزء األول:
تصنيف الشركة حسب تصنيف اتحاد المقاولين:1-

81
درجة أولى درجة ثانية درجة ثالثة
يقوم بتعبئة االستبانة:الوظيفة اإلدارية لمن 2-
غير ذلك مهندس الموقع مدير المشاريع صاحب / مدير الشركة
عدد الموظفين اإلداريين والفنيين في الشركة: -3
50أكثر من 50-31 30-10 10اقل من
المشاريع المنفذة خالل السنوات الخمس الماضية في مجال المباني:عدد 4-
30أكثر من 30-21 20-10 10اقل من
متوسط حجم أعمال الشركة خالل السنوات الخمس الماضية في مجال المباني )مليون دوالر(.5-
2أكثر من 2-1.1 1-0.51 0.5اقل من
6-نوع المشاريع المنفذة:
مؤسسي سكني تجاري سكني تجاري
الجزء الثاني:
علي التسعير:العوامل المؤثرة
في الجدول التالي عدد من العوامل التي تؤثر علي عملية التسعير في صناعة التشييد في مشاريع البناء
يرجي تحديد درجة تأثير هذه العوامل علي التسعير مع األخذ بعين االعتبار الرموز التالية
الرمز درجة التأثير
1 يؤثر بدرجة قليلة
2 يؤثر بعض الشيء
بدرجة متوسطةيؤثر 3
4 يؤثر بدرجة كبيرة
5 يؤثر بدرجة كبيرة جدا
first part:
1. Classification of the company / according to Contractors Union:
First Class Second Class Third Class
2. The position of officer who fills the questionnaire:
Company Manger Projects Manger Site Engineer Other
3. Number of company's employees:

82
Less than 10 10– 30 31 – 50 More than 50
4. Number of executed projects during the last five years:
Less than 10 10 – 20 21 – 30 More than 30
5. Average value per year of executed projects during the last five years (in million dollars):
Less than 0.5 0.51 - 1 1.1 – 2 More than 2
6. Type of implemented projects:
Residential commercial Residential & commercial institutional
Second Part:
Factors affecting the pricing process in the construction of buildings
In the table below there are numbers of factors affecting in building projects cost. Please
define the degree of importance of these factors in pricing process in the construction
of buildings.
Numbers between (1-5) determine the weight of parameter on the total cost of
building cost. Where:
1: Very Low 2: Low 3: Medium 4: High 5: Very High
بعملية اإلنشاء األساسية للمبني )البناء الهيكلي(العوامل المتعلقة : أوال
يؤثر بدرجة .1
قليلة
يؤثر بعض .2
الشيء
يؤثر بدرجة .3
متوسطة
يؤثر بدرجة .4
كبيرة
يؤثر بدرجة .5
كبيرة جدا
الرقم (Factors) العوامل المؤثرة درجة التأثير
نوع القواعد المستخدمة في المبني 1 2 3 4 5
Type of used foundation in the building
1.
مساحة الطابق المتكرر للمبني 1 2 3 4 5
Area of typical floor
2.
عدد الطوابق في المبني 1 2 3 4 5
Number of floors in the building
3.
عدد األعمدة في المبني 1 2 3 4 5
Number of columns
4.

83
عدد الغرف في المبني 1 2 3 4 5
Number of rooms
5.
عدد المصاعد في المبني 1 2 3 4 5
Number of elevators in the building
6.
نوع السقف للمبني )مصمت , مفرغ, .....( 1 2 3 4 5
Type of slab (Solid, Ribbed …)
7.
عدد األدراج في المبني 1 2 3 4 5
Number of staircases in the building
8.
المسافات بين األعمدة 1 2 3 4 5
Length of spans between columns
9.
مساحة الجدران االستناديه لتنفيذ المبني 1 2 3 4 5
Area of retaining walls in project
10.
العوامل الخارجيةثانيا :
الرقم العوامل المؤثرة درجة التأثير
نوع العقد 1 2 3 4 5
Type of contract (Ls, unit)
1.
موقع إنشاء المبنى 1 2 3 4 5
Location of project
2.
طبيعة الجهة المشرفة )محلية أو دولية( 1 2 3 4 5
Staff of supervision (local or international)
3.
حجم المشروع 1 2 3 4 5
Size of the project
4.
وضوح جدول الكميات والمخططات 1 2 3 4 5
Clarity of quantities and drawings schedule
5.
ثالثا:العوامل المتعلقة بعملية تشطيب المبني
الرقم العوامل المؤثرة درجة التأثير
نوع الكسوة الخارجية 1 2 3 4 5
Type of external plastering
1.
نوع الدهان 1 2 3 4 5
Type of painting
2.
نوع البالط 1 2 3 4 5
Type of tiling
3.
كمية أعمال الرخام 1 2 3 4 5
Area of marble works
4.
مساحة الواجهات الزجاجية 1 2 3 4 5
Area of curtain walls
5.
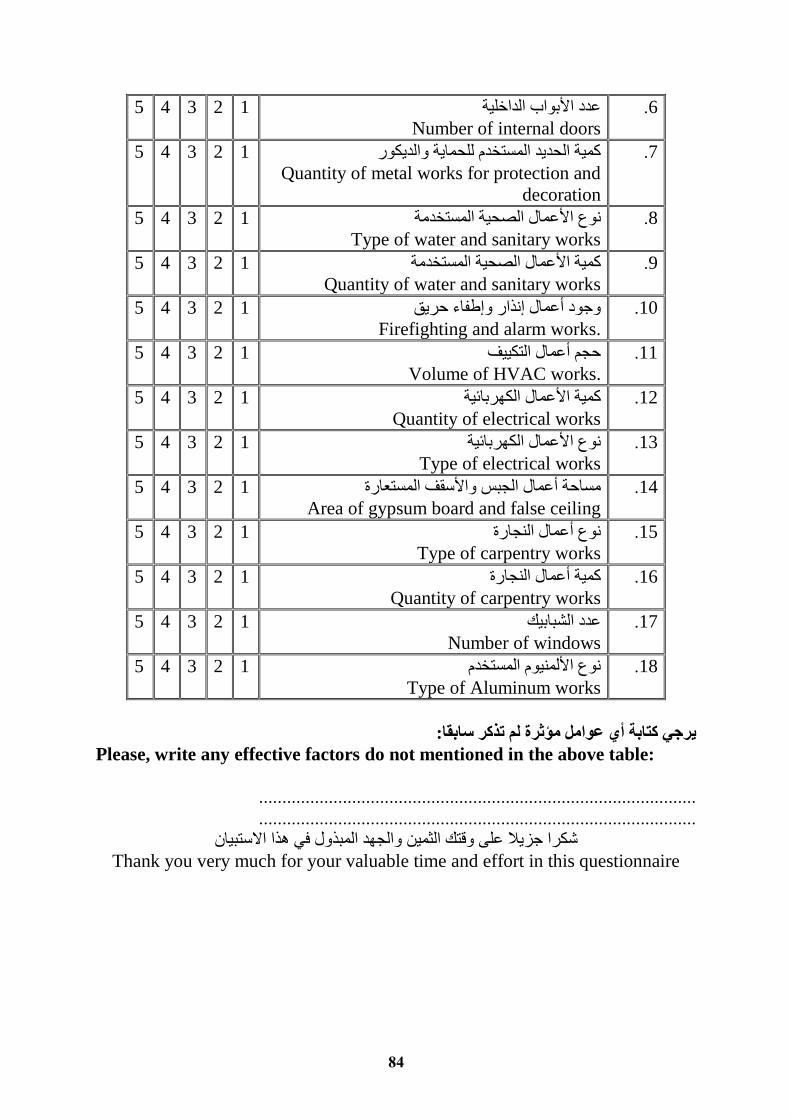
84
عدد األبواب الداخلية 1 2 3 4 5
Number of internal doors
6.
كمية الحديد المستخدم للحماية والديكور 1 2 3 4 5
Quantity of metal works for protection and
decoration
7.
األعمال الصحية المستخدمةنوع 1 2 3 4 5
Type of water and sanitary works
8.
كمية األعمال الصحية المستخدمة 1 2 3 4 5
Quantity of water and sanitary works
9.
وجود أعمال إنذار وإطفاء حريق 1 2 3 4 5
Firefighting and alarm works.
10.
حجم أعمال التكييف 1 2 3 4 5
Volume of HVAC works.
11.
كمية األعمال الكهربائية 1 2 3 4 5
Quantity of electrical works
12.
نوع األعمال الكهربائية 1 2 3 4 5
Type of electrical works
13.
مساحة أعمال الجبس واألسقف المستعارة 1 2 3 4 5
Area of gypsum board and false ceiling
14.
نوع أعمال النجارة 1 2 3 4 5
Type of carpentry works
15.
كمية أعمال النجارة 1 2 3 4 5
Quantity of carpentry works
16.
عدد الشبابيك 1 2 3 4 5
Number of windows
17.
نوع األلمنيوم المستخدم 1 2 3 4 5
Type of Aluminum works
18.
يرجي كتابة أي عوامل مؤثرة لم تذكر سابقا:
Please, write any effective factors do not mentioned in the above table:
..............................................................................................
..............................................................................................
والجهد المبذول في هذا االستبيانشكرا جزيال على وقتك الثمين
Thank you very much for your valuable time and effort in this questionnaire

85
بسم هللا الرحمن الرحيم
الجامعة اإلسالمية
عمادة الدراسات العليا
قسم الهندسة المدنية -كلية الهندسة
02رقم اســتـبـيـان
عملية التسعير في المشاريع اإلنشائية للمبانيدراسة العوامل المؤثرة علي
من وجهة نظر المقاولين في قطاع غزة
جزء من البحث التكميلي لنيل درجة الماجستير في إدارة التشييد ك وذلك
الباحث
م.طارق ريان
إشراف
الدكتور/ نبيل الصوالحي
فلسطين -غزة
2015

86
عملية التسعير في المشاريع اإلنشائية دراسة العوامل المؤثرة علي استبيان يهدف إلي للمباني
في قطاع غزة من وجهة نظر المقاولين
: السالم عليكم ورحمة هللا وبركاتهالمهندس/السيد المقاول بداية أتقدم لكم بجزيل الشكر والتقدير لمساهمتكم بجزء من وقتكم وجهدكم في تعبئة هذا االستبيان.
ن األنشطة األساسية والمهمة في المشاريع اإلنشائية وقطاع التشييد والبناء لذلك عملية التسعير معتبر تالعوامل المؤثرة علي عملية التسعير في المشاريع اإلنشائية للمباني فان هذه االستبانة تهدف إلي دراسة
دارة التشييد في الجامعة , وهي جزء من البحث التكميلي لنيل درجة الماجستير في إفي قطاع غزة اإلسالمية بغزة.
:األولالجزء
تصنيف الشركة حسب تصنيف اتحاد المقاولين:1-
ثالثة درجة ثانية درجة أولىدرجة
لمن يقوم بتعبئة االستبانة: اإلداريةالوظيفة 2-
غير ذلك مهندس الموقع مدير المشاريع صاحب الشركة
في الشركة:اإلداريين والفنيين عدد الموظفين -3
50من أكثر 50-31 30-11 10اقل من
عدد المشاريع المنفذة خالل السنوات الخمس الماضية في مجال المباني:4-
30من أكثر 30-21 20-11 10اقل من
الشركة خالل السنوات الخمس الماضية في مجال المباني )مليون دوالر(. أعمالمتوسط حجم 5-
2من أكثر 2-1.1 1-0.51 0.5اقل من
: المنفذةع اريالمش 6-نوع
مؤسسي سكني تجاري تجاري سكني

87
15بما ال يقل عن التسعير من وجهة نظركم ةالعوامل الؤثرة في عملي اهم االخوة الخبراء الرجاء ترتيب( من وجهة 01مع العلم بان الترتيب والنسب المرفقة كانت نتائج االستبيان رقم ) عامل مؤثر بشكل كبير
.نظر المهندسين الذين يعملون في مجال المقاوالت #
Factors Total RII Rank Rank Remarks
1. Number of floors in the building 70 0.883 1 2. Type of used foundation in the building 70 0.869 2 3. Area of typical floor 70 0.843 3 4. Type of external plastering 70 0.829 4 5. Area of marble works 70 0.789 5 6. Volume of HVAC works. 70 0.789 5 7. Area of retaining walls in project 70 0.771 7 8. Clarity of quantities and drawings schedule 70 0.769 8 9. Type of electrical works 70 0.766 9 10. Area of curtain walls 70 0.763 10 11. Quantity of electrical works 70 0.760 11 12. Number of elevators in the building 70 0.757 12 13. Type of tiling 70 0.754 13 14. Firefighting and alarm works. 70 0.754 13 15. Type of painting 70 0.737 15 16. Type of slab (Solid, Ribbed …) 70 0.726 16 17. Number of staircases in the building 70 0.726 16 18. Area of gypsum board and false ceiling 70 0.723 18 19. Type of Aluminum works 70 0.720 19 20. Quantity of water and sanitary works 70 0.706 20 21. Type of water and sanitary works 70 0.694 21 22. Size of the project 70 0.663 22 23. Quantity of carpentry works 70 0.657 23 24. Type of carpentry works 70 0.649 24 25. Number of columns 70 0.643 25 26. Staff of supervision (local or international) 70 0.640 26 27. Number of windows 70 0.634 27 28. Location of project 70 0.629 28 29. Type of contract (Ls, unit) 70 0.614 29 30. Quantity of metal works for protection
&decoration 70 0.609 30 31. Length of spans between columns 70 0.569 31 32. Number of internal doors 70 0.569 31 33. Number of rooms 70 0.551 33
يرجي كتابة أي عوامل مؤثرة لم تذكر سابقا:
.....................................................................................................................

88
شكرا جزيال على وقتك الثمين والجهد المبذول في هذا االستبيان