cost effectiveness analysis of the new pneumococcal...
TRANSCRIPT

Cost effectiveness analysis of the new pneumococcal conjugate vaccine (SynflorixTM)
compared to Prevnar®
CPHA 2009
Ismaila AS1,2, Pereira JA1, Robson RC1, Rawson NS1, Simpson SD1, Standaert BA3
1Medical Affairs, GlaxoSmithKline, Canada 2Clinical Epidemiology and Biostatistics, McMaster University, Canada3WW Commercial Strategy - Health Economics, GlaxoSmithKline Biologicals, Belgium
June 9, 2009

Acknowledgments
Key contributors to model development:– Prof. Philippe de Wals and co-investigators
– Tom Taylor and Sandra Talbird from Research Triangle Institute

Outline
Background
Methods
Results
Sensitivity Analysis
Conclusions
Outline
Background
Methods
Results
Sensitivity Analysis
Conclusions

Background
Streptococcus pneumoniae (Sp) is the leading cause of invasive bacterial infections, bacterial pneumonia and acute otitis media (AOM) in young children1.
In 2001, a 7-valent pneumococcal conjugate vaccine (Prevnar®) was licensed in Canada1.
In December 2008, a new 10-valent pneumococcal non-typeable Haemophilus influenzae protein-D conjugate vaccine (SynflorixTM) was also licensed in Canada2.
1NACI: CCDR 2002;28-ACS-2:1-32; 2Health Canada (NOD 2009)

Pneumococcal vaccines
Prevnar® 4, 6B, 9V, 14, 18C, 19F, 23F
SynflorixTM 4, 6B, 9V, 14, 18C, 19F, 23F 1, 5, 7F
Vaccine serotypes
Cross-reactive serotypes1,2
6A 19A
1Vakevainen et al. (J Infect Dis 2001;184:789–93); 2Jakobsen et al. (Infec & Immun 2003: 2956–2959)

Objective
To evaluate the projected health outcomes, costs, and cost-effectiveness of routine vaccination with SynflorixTM
compared with no vaccination and with Prevnar®.
Outline
Background
Methods
Results
Sensitivity Analysis
Conclusions
Model Description
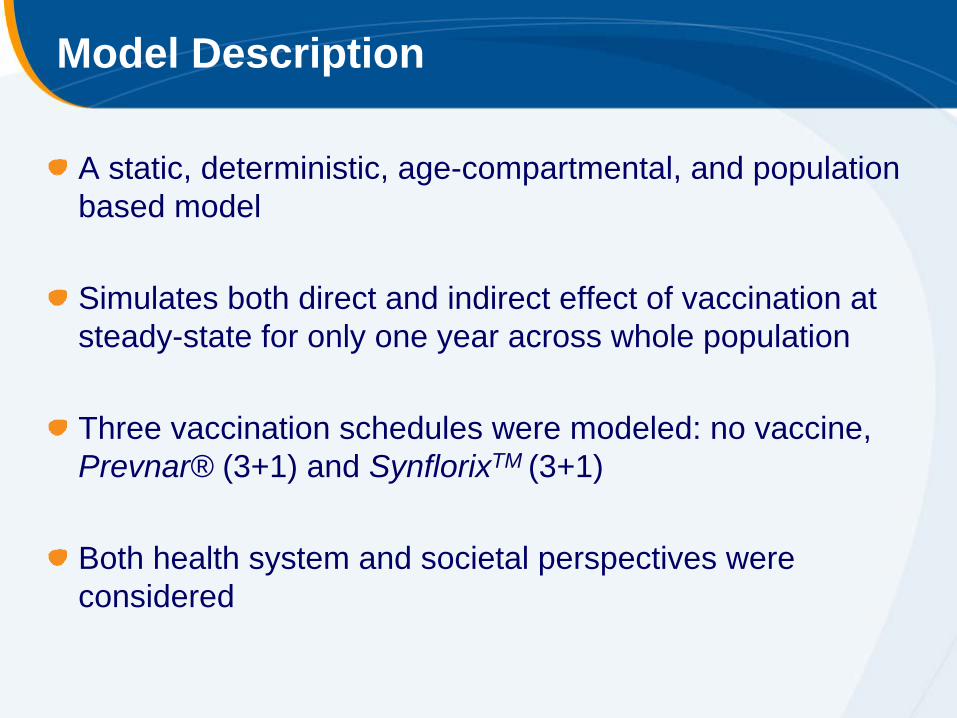
A static, deterministic, age-compartmental, and population based model
Simulates both direct and indirect effect of vaccination at steady-state for only one year across whole population
Three vaccination schedules were modeled: no vaccine, Prevnar® (3+1) and SynflorixTM (3+1)
Both health system and societal perspectives were considered

Input variables and data
Models the entire population of Canada in 2006 (33.0 million)1.
The vaccinated population is children aged 2 to 13 months (348,000).
Vaccination cost was set at parity ($70) per dose plus administration cost for both Prevnar® and SynflorixTM.
The model used Canada-specific epidemiological data2-9
1Statistics Canada: http://www40.statcan.ca/l01/cst01/demo10a.htm (Oct. 2008).2Bettinger et al.: Can J Public Health. 2007 Mar-Apr;98(2):111-115.3MADO 2004 (Maladies infectieuses a declaration obligatoire).4Morrow et al., Can J Infect Dis Med Microbiol 2007;18:121-27.5Petit et al.: Can J Infect Dis 2003;14:215-20.6Robinson et al.: JAMA 2001;285(13):1729-35.7Scheifele et al.: Clin Infect Dis. 2000;31(1):58-64.8Shariatzadeh et al.: Medicine 2005;84(3):147-61.9Furlong et al.: Ann Med 2001;33(5):375-84.

Key model assumptions for base case: (Direct Effect)
Disease Parameter Prevnar® SynflorixTM
IPD1 Prevnar® serotypes Same value
SynflorixTM specific serotypes
0 94.7(93, 98)
Cross protection on 6A
76(39, 90)
76(39, 90)
Pneumonia2 Hospitalizations 20.5 (4.4, 34.0)
25.0(9.7, 37.7)
AOM3,4 Sp vaccine serotype 57.2(44, 67)
57.6(41.4, 69.3)
AOM due to NTHi -11(-34, 8.0)
35.6(3.8, 57.0)
Direct effect (%)
1Whitney et al: Lancet 2006;368(9546):1495-5022Black et al.: Pediatr Infect Dis J. 2002;21(9):810-5.3Eskola et al.: N Engl J Med 2001;344(6):403-9.4Prymula et al.: Lancet. 2006 Mar 4;367(9512):740-8.

Key model assumptions for base case: (Indirect Effect)
Disease Prevnar® SynflorixTM
Herd effect (%) IPD1 76.2(70, 80)
76.2(70, 80)
Pneumonia none none
AOM none none
1. Hicks et al. J Infect Dis. 2007;196(9):1346-54.

Outline
Background
Methods
Results
Sensitivity Analysis
Conclusions

IPD 222 Cases of meningitis3,236 Cases of bacteraemia937 GP visits for bacteraemia611Deaths
Pneumonia 79,577 Hospitalizations148,715 GP visits16,833 Deaths
Otitis media 34,196 Hospitalizations1,639,326 GP visits1,385,230 ATB prescriptions
Annual burden of Pneumococcal disease in Canada: All ages
Projected from Canadian HE modelATB = antibiotics; IPD = invasive pneumococcal disease; GP= general physician
Health system cost: $726 Million Total indirect cost: $2.2 Billion

Base Case Results: Effectiveness
Disease
Baseline Number of cases averted (% reduction)
No Vaccination
Prevnar® vs. no vaccination
SynflorixTM vs. no vaccination
SynflorixTM vs. Prevnar®
IPD 3,458 1,425 (41.2%)
1,810(52.3%)
384(11.1%)
AOM (GP visits)
1,639,326 70,370(4.3%)
241,321(14.7%)
170,951(10.4%)
Antibiotic prescriptions
1,385,230 59,462(4.3%)
203,916(14.7%)
144,454(10.4%)
Total Hospitalizations
113,773 6,127(5.4%)
16,414(14.4%)
10,287(9.0%)
Assumptions:3+1 schedule; all age groups; herd protection and serotype cross-protection for 6A, vaccination coverage is 100%; 85% of AOM visits generate antibiotic prescription

Base case results: direct and indirect costs
Disease
Baseline Cost averted (savings in million)
No Vaccination Prevnar® vs. no vaccination
SynflorixTM vs. no vaccination
SynflorixTM vs. Prevnar®
Vaccine cost +Admin fees
$0 -$112 -$112 $0
Direct cost(Disease related)
$726 $32 $56 $24
Healthcare system cost
$726 -$80 -$57 $24
Indirect costs $2,195 $123 $170 $47
Societal costs $2,921 $43 $113 $71
Assumption: Cost of vaccine at parity ($70.00 per dose + admin fee)

Base-case results: cost-effectiveness results (healthcare system)
Outcome No vaccination Prevnar®3+1 regimen
SynflorixTM
3+1 regimen
Direct cost $726.2M $806.5M $782.9MIncremental cost vs.
No Vaccination$80.3M $56.7M
Total QALYs lost 176,856 170,468 167,736Incremental QALYs
gained vs. no Vaccine6,388 9,120
Incremental cost per QALY gainedNo vaccination $12,565 $6,220 SynflorixTM vs.
Prevnar®-$8,614

Base-case results: cost-effectiveness results (societal perspective)
Outcome No vaccination Prevnar®3+1 regimen
SynflorixTM
3+1 regimen
Total cost $2,921M $2,878M $2,807MIncremental cost vs.
No Vaccination-$43M -$113M
Total QALYs lost 176,856 170,468 167,736Incremental QALYs
gained vs. no Vaccine6,388 9,120
Incremental cost per QALY gainedNo vaccination -$6,669 -$12,436SynflorixTM vs.
Prevnar®-$25,920

Outline
Background
Methods
Results
Sensitivity Analysis
Conclusions
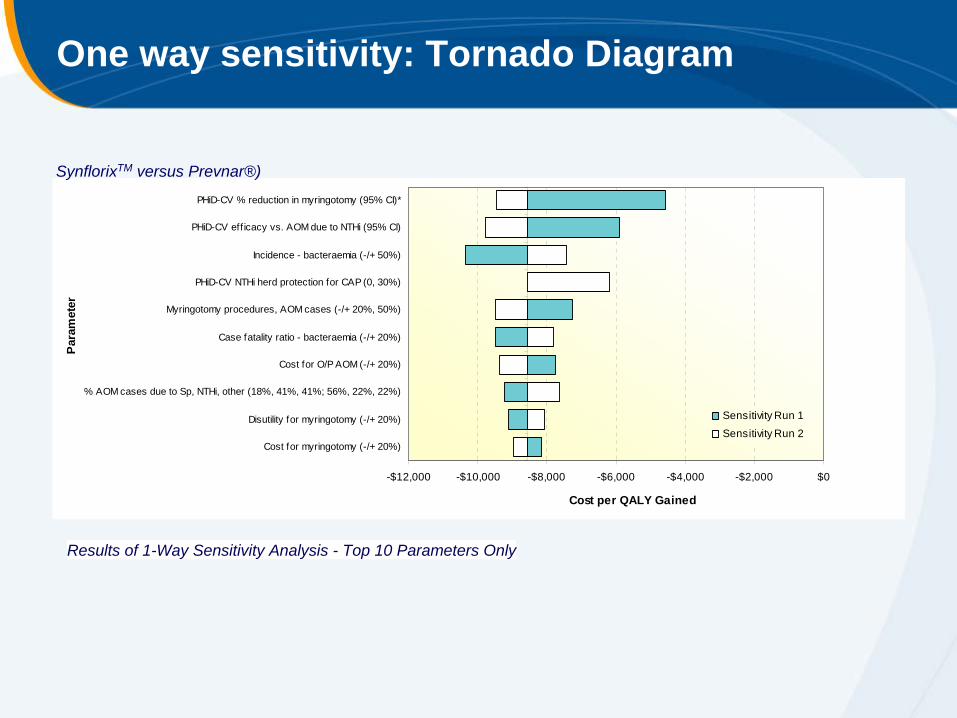
One way sensitivity: Tornado Diagram
Results of 1-Way Sensitivity Analysis - Top 10 Parameters Only
-$12,000 -$10,000 -$8,000 -$6,000 -$4,000 -$2,000 $0
PHiD-CV % reduction in myringotomy (95% CI)*
PHiD-CV eff icacy vs. AOM due to NTHi (95% CI)
Incidence - bacteraemia (-/+ 50%)
PHiD-CV NTHi herd protection for CAP (0, 30%)
Myringotomy procedures, AOM cases (-/+ 20%, 50%)
Case fatality ratio - bacteraemia (-/+ 20%)
Cost for O/P AOM (-/+ 20%)
% AOM cases due to Sp, NTHi, other (18%, 41%, 41%; 56%, 22%, 22%)
Disutility for myringotomy (-/+ 20%)
Cost for myringotomy (-/+ 20%)
Par
amet
er
Cost per QALY Gained
Sensitivity Run 1
Sensitivity Run 2
SynflorixTM versus Prevnar®)
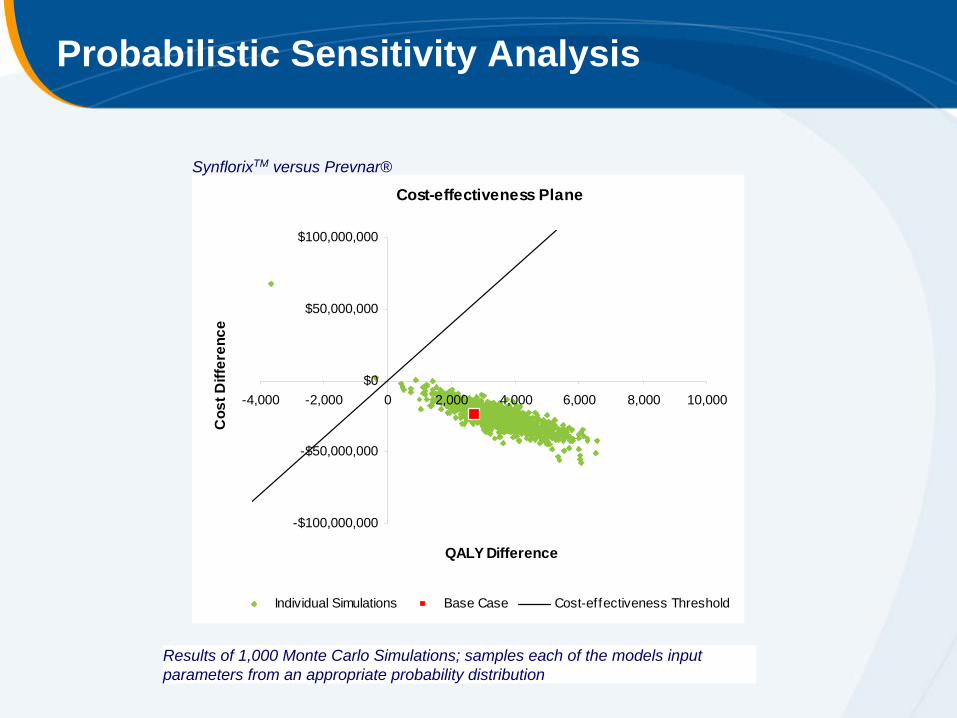
Probabilistic Sensitivity Analysis
Cost-effectiveness Plane
-$100,000,000
-$50,000,000
$0
$50,000,000
$100,000,000
-4,000 -2,000 0 2,000 4,000 6,000 8,000 10,000
QALY Difference
Cos
t Diff
eren
ce
Individual Simulations Base Case Cost-effectiveness Threshold
Results of 1,000 Monte Carlo Simulations; samples each of the models input parameters from an appropriate probability distribution
SynflorixTM versus Prevnar®

Base-case and Five other scenarios
Base-case Scenario 1 Scenario 2 Scenario 3 Scenario 4 Scenario 5
Herd protection IPDAll ages All ages All ages All ages <5y <5y
On On on* Off Off OnCross protection 6A 6A, 19A 6A, 19A Off Off 6ASynflorixTM
Costs ($1000’s) 782,921 782,911 716,702 807,348 248,886 229,178QALYs lost 167,736 167,733 151,276 173,296 12,915 11,110
Prevnar®Costs ($1000’s) 806,457 806,446 760,990 815,474 256,308 248,868QALYs lost 170,468 170,465 158,504 173,934 13,506 12,475
Incremental DifferenceCosts ($1000’s) (23,536) (23,536) (44,287) (8,126) (7,421) (19,690)QALYs 2,732 2,732 7,228 638 591 1,365
Incremental cost-effectiveness ratio (Health System)Per QALY gained ($) (8,614) (8,615) (6,127) (12,736) (12,550) (14,422)Quadrant Q4 Q4 Q4 Q4 Q4 Q4
*Including Herd protection/serotype replacement on CAP and AOM related outcomes
Outline
Background
Methods
Results
Sensitivity Analysis
Conclusions

Conclusions
Because of the broader serotype coverage and substantial impact on AOM, SynflorixTM would prevent more pneumococcal related outcomes than Prevnar® in Canada.
Based on the base-case analysis, SynflorixTM would save about $71M in direct and indirect costs versus Prevnar® in Canada.
From both health care and societal perspective, SynflorixTM would be a cost-saving alternative to Prevnar® at price parity.