cost-effectiveness analysis as a decision tool in
TRANSCRIPT
1
Cost-Effectiveness Analysis as a Decision Tool in Selecting and Implementing
Instructional Interventions in Literacy
Barbara Hummel-Rossi and Jane Ashdown
A Note from the Authors: The following report summarizes the results of our investigation into
the economic analyses of instructional interventions in literacy. Our research of the literature
encompassed the fields of early childhood education, literacy education, educational policy,
educational finance, economics of education, educational interventions, and psychology.
Questions Guiding the Investigation
The investigation focused on examining the following questions:
1. Why is early intervention important? What do economic analyses reveal about the
cost-effectiveness of early intervention?
2. What early literacy interventions have been shown to be effective in terms of
improving children’s literacy competence? What do economic analyses reveal about
the cost-effectiveness of these interventions?
3. What are the critical variables of early literacy intervention effectiveness (e.g.,
intervention duration, intensity, implementation fidelity, teacher training)? What is
the evidence of effectiveness when these variables are manipulated? What is the
evidence for cost-effectiveness when these variables are manipulated?
4. Drawing on findings from Questions 1, 2, and 3, what are the practical implications
for decision making when comparing the evidence for intervention effectiveness and

2
cost-effectiveness? For example, how can school administrators integrate cost-
effectiveness considerations into their decision making?
In researching these four questions, we have accumulated a large number of articles from
the literature that should prove valuable to other literacy researchers. An Excel spreadsheet
containing about 75 references (articles, books, reports) related to the four questions is
available.1 Most of the research study references have pertinent information concerning the
participant characteristics, methods, and findings, as well as comments and links to a research
question(s).
Summary of Findings: Research Question 1
1. Why is early intervention important? What do economic analyses reveal
about the cost-effectiveness of early intervention?
Making a Case for Early Intervention
Although the focus of this report is prudent decision making concerning early literacy
interventions, it is important to remind ourselves of the broader context for early intervention and
the lessons that can be learned when making decisions about which literacy intervention to adopt
during the first year or two of a child's formal schooling. Recognizing the importance of the first
few years of a child’s life in leading to positive outcomes, preschool interventions have been the
subject of comprehensive analyses of both their impact and their costs. Thus, the research
literature contains a series of well-documented studies concerning the effectiveness of early
interventions with accompanying economic analyses. This contrasts with the limited number of
evaluations of interventions in the K–12 grades where economic evaluations have not been
incorporated to the same extent.
3
Why invest in early intervention? A frequently cited response to this question is to be
found in the work of Craig T. Ramey and Sharon L. Ramey (1998) on early intervention and
early experience. The authors present a historical perspective on two important developments.
First, through research in the fields of psychology, sociology and linguistics, there has been
increased understanding of the important role of early experiences in the social, emotional, and
cognitive development of young children. Second, profound societal changes have led to
implementing interventions early in the lives of young children either from a preventative
perspective, where inequalities and discriminatory practices leave children at risk of failing in
school, or from a treatment perspective whereby children with known disabilities and
developmental delays are offered treatment services.
Ramey and Ramey (1998) identified the early intervention challenge for schools as one
of accelerating children’s rate of development so that they can catch up and keep up with their
age mates who are on an optimal trajectory for learning and development. The broad question
addressed was, "Does early intervention alter development?" Based on research findings from
studies using random assignment to groups, the authors concluded that intensive and high-quality
interventions produce modest to large effects on children’s cognitive and social development
(p.115).
Drawing from these research studies, Ramey and Ramey (1998) laid out six principles of
biosocial developmental contextualism as a conceptual framework. The six principles of this
conceptual framework offer a way to distinguish between weak and ineffective interventions and
those interventions likely to be highly effective. Thus, the more-effective interventions can be
targeted to those most in need. Ramey and Ramey's six principles relate to
4
• developmental timing,
• program intensity,
• provision of direct learning experiences,
• program breadth and flexibility,
• individual differences in program benefits, and
• maintenance of development.
The use of such a framework aids in cost containment and is used in the development of the
Decision-Making Checklist for Early Literacy Interventions, which is discussed in our response
to Question 4.
Economic Analyses of Early Intervention
The most well-known study with an economic analysis of an early intervention is the
Perry Preschool Program (Barnett, 1985) with longitudinal follow up of participants in the
original program (Nores, Belfield, Barnett, & Schweinart, 2005). Using a cost-benefit analysis
approach where both program components and outcomes are compared in terms of dollar values,
these studies demonstrate both the positive outcomes for participating individuals and for society
at large. The original program used random assignment to either a control group or a treatment
group for 123 three- and four-year-old children from Black, low-income families. The daily 2
1/2-hour program was relatively intense, with a teacher-student ratio of 1:5. There were home
visit and parent support group components. With participants at age 40, the return to society on
every dollar spent was calculated to be $6.87. For individual participants there were lifetime
earnings advantages. The benefit to society derived from the program largely was accounted for
through reduced crime and incarceration rates for the males among the program participants.
5
A notable contribution to the evaluation of benefits and costs of early interventions has
been made by the Labor and Population unit of the Rand Corporation. For example, building on
a 1998 study synthesizing the outcomes of 10 early childhood programs (Karoly et al., 1998),
Karoly, Kilburn, and Cannon (2005) examined the evaluations of outcomes for 8 home visiting
programs and 12 early childhood education programs, 11 of which also included home visiting
programs. These programs were selected for analysis because of the rigorous nature of their
evaluations (experimental or quasi-experimental). Two-thirds of the programs demonstrated
statistically significant outcomes across a variety of domains including academic achievement,
educational progress (years in school), and educational attainment (graduation from school).
Three program design features appeared to account for improved outcomes for children and
families — better trained staff, smaller child-to-staff ratios, and greater intensity of services.
These latter findings are consistent with the principles of biosocial developmental contextualism
as documented by Ramey and Ramey (1998).
Even as academic gains may fade over time as measured by standardized tests, Karoly et
al. (2005) provide an analysis of spillover benefits that bring economic gains to both the
individual and to society (p. 88). Such benefits include the private value to the family of the
child’s participation in an educational intervention. Societal benefits include a reduction in grade
retention, a reduction in use of special education, and avoidance of incarceration and/or use of
the welfare system. At least three programs (Abecedarian, Perry Preschool Program, and
Chicago Child-Parent Centers) studied by the researchers followed children into adulthood and,
despite some methodological cautions, cost-benefit ratios were calculated based on prior
investigations (Karoly et al., 1998) indicating a return to society ranging from $3.23 to $17.07
for every dollar invested.

6
Of note in relation to the decision-making processes regarding the selection and
implementation of early literacy interventions is Karoly et al.'s (2005) observation that costs and
benefits in early childhood programs are frequently misaligned with what they describe as
downstream savings (p. 97) realized by different individuals, and/or different sectors of society.
These authors discuss the challenge of garnering support for programs that are clearly effective
and demonstrate a return on investment to society and they note:
This misalignment in costs and benefits across the various stovepipes of the public sector,
or between the public and private sectors, makes it difficult to find the support among all
the needed parties for investing in an early intervention. (p. 97)
Summary of Findings: Research Questions 2 and 3
2. What early literacy interventions have been shown to be effective in terms of
improving children’s literacy competence? What do economic analyses reveal
about the cost-effectiveness of these interventions?
3. What are the critical variables of early literacy intervention effectiveness (e.g.,
intervention duration, intensity, implementation fidelity, teacher training)?
What is the evidence of effectiveness when these variables are manipulated?
What is the evidence for cost-effectiveness when these variables are
manipulated?
Effective Early Literacy Interventions
As we review the research in response to the question of which early literacy
interventions are proven to be effective academically as well as cost-effective, we should
recognize the progress that has been made in educational decision making in moving away from

7
the ineffective "wait and see" approach to addressing young children’s reading difficulties
coupled with remedial instruction later in a child’s school career. Growing understanding drawn
from early childhood interventions of the value of preventing literacy learning difficulties has
spurred the development of early literacy interventions.
To guide educational decision makers regarding the most-effective literacy interventions,
the What Works Clearinghouse (WWC) (2007) has conducted extensive evaluations of different
interventions, including Reading Recovery. Their topic review on Reading Recovery compares it
to other literacy interventions. Rigorous standards of evidence reduced the comparison literacy
programs to 24, with Reading Recovery the only intervention demonstrating positive effects or
potentially positive effects in all outcome domains (alphabetics, fluency, comprehension and
general reading achievement). Providing additional evidence of the effectiveness of literacy
interventions, the Institute of Education Sciences (IES) cites Wasik and Slavin’s (1993) finding
of an effect size of 0.7 for one-on-one tutoring of at-risk readers in a randomized controlled trial
study comparing five reading programs for early elementary grades (IES, 2003, p. iii).
It should be noted that the 2007 WWC topic review does not address cost-effectiveness
considerations. The IES guide to identifying and implementing evidence-based practices in
education lists cost as a key item to look for in study descriptions of an intervention (IES, 2003,
p. 5). The guide provides an example of items that should be discussed in a randomized
controlled trial of a one-on-one tutoring program for beginning readers (p. 5). Among the seven
items listed is the cost per student of the tutoring intervention. However, the guide does not offer
further commentary about evaluating the calculation of per student cost, advise how to integrate
cost information into weighing the quality of evidence for selecting an intervention, or address
potential for future savings in averting the need for more-costly educational services for students.

8
Critical Variables of Effective Early Literacy Interventions
Teacher-Student Ratio
As we consider the variables associated with effective early literacy interventions, one
variable of interest is the size of the instructional grouping and the student-teacher ratio. Schmitt
(2008) has undertaken a comprehensive review of the literature investigating this mediating
structure for delivering a literacy intervention. Her review examines a number of empirical
investigations and a meta-analysis of one-to-one tutoring, including Reading Recovery, as
compared to more-typical instructional practices such as small groups with teacher-student ratios
ranging from 1:2 to 1:7. Schmitt's analysis of the evidence reveals robust findings to support the
effectiveness of one-to-one tutoring and Reading Recovery as a highly effective early literacy
intervention.
Several of the studies Schmitt (2008) reviewed examined small-group instruction as a
less costly alternative to one-to-one instruction (Elbaum, Vaughn, Hughes, & Moody, 2000;
Iverson & Tunmer, 1993; Iverson, Tunmer, & Chapman, 2005)). These studies all showed one-
to-one instruction to be more effective than small-group instruction. Further, the studies did not
include cost information or cost comparisons, nor did they present analysis of the resource
allocation models used with regard to literacy instruction so as to clarify the choices and trade-
offs a school or school district needs to consider. It is difficult to assess replication potential of
these small-group designs as they appear to have been developed for the specific purposes of the
study and were not part of an ongoing instructional program involving teacher training, field-
testing, and follow-up assessment of students.
9
A study by Vaughn et al. (2003) compared three instructional grouping formats, 1:1, 1:3,
and 1:10. The student participants were second-grade struggling readers, many of whom were
students in poverty who were English language learners (ELL; N=77). Again the rationale for the
study was the lack of resources available to support 1:1 instruction and the lack of evidence
supporting the superiority of 1:1 instruction. The intervention also was developed specifically for
the study and there is little information about how instruction was conducted in the different
groupings, although teachers did complete training and were observed for the quality of the
instruction and academic engagement. The intervention design included about 1 hour of literacy
instruction delivered for 58 sessions. There were no significant differences between student
outcomes 4 weeks after the program ended between the 1:1 and 1:3 groupings. Both ELL
students and monolingual English students performed similarly in each instructional setting. The
1:10 grouping was considered ineffective based on overall student outcomes. This is one of the
few studies in which an intervention's impact on literacy gains for ELL students was
investigated. The study authors themselves commented that only the Success For All and the
Reading Recovery interventions in Spanish (Descubriendo la Lectura) have been investigated;
this situation alerted us to the need for decision makers to consider an interventions' track record
in serving ELL students.
Of further note, the Vaughn et al. (2003) study provides descriptive statistics for those
students who made less than 6 months progress in each of the groupings with two students in this
category in the 1:1 format, six students in the 1:3 grouping format, and nine students in the 1:10
grouping format. Given that the study was designed to address the lack of resources faced by
schools, it is surprising that this latter information was not analyzed further in terms of the return
on investment arising from the intervention grouping formats. If literacy intervention is designed

10
to conserve resources, then the 1:1 format appears the superior intervention given that only two
students made minimal progress and required additional services. As Odden and Archibald
(2001) note, schools may be serving all students in need, but unless those services are truly
effective, it is crucial to redesign the services and reallocate resources (p. 48).
A more recent study examining both effectiveness and efficiency of different intervention
group sizes was undertaken by Schwartz, Schmitt, and Lose (2008) and supported by the
extensive literature review completed by Schmitt (2008). Schwartz et al. used a strong
experimental design to investigate the influence of varying student-teacher ratios on literacy
learning outcomes for first-grade students most at risk of failing to learn to read. This study was
designed to address the needs of decision makers selecting appropriate interventions that meet
the standards for general education interventions designed to prevent referral to special
education. Reading Recovery (1:1) was compared to three small-group interventions (1:2, 1:3,
and 1:5) taught by trained Reading Recovery teachers (N=75 teachers; N=170 students).
The power of the Schwartz et al. (2008) study is that it not only considered effectiveness,
but also efficiency. The 1:1 instructional format resulted in significantly higher performance on
eight of nine outcomes measures. The performance of students in the three other small-group
settings did not differ significantly from one another. Regarding efficiency, the linear trend in
outcomes (with one exception) revealed that there was a decrease in performance with an
increase in group size. Thus, accelerated learning was compromised with the increase in group
size. Although the Schwartz et al. study did not undertake a cost-effectiveness analysis, the
author regards such analysis as critical for considering the full implications of selecting an early
literacy intervention.

11
Other Key Variables of Early Interventions
As noted above, the Vaughn et al. (2003) study provides just a few details about the
literacy professional development and ongoing support that teachers received in order to teach
the student participants in each of the instructional groupings. A much earlier study (Pinnell,
Lyons, DeFord, Bryk, & Seltzer, 1994) is important not only because the experimental design
compared the performance of students in four literacy instructional interventions with a control
group (324 students in 33 school sites), but also because the study examined and compared key
instructional features of the interventions as well as key features of the professional development
participating teachers received. Three of the interventions were individual tutoring (Reading
Recovery, Direct Instruction Skills Plan, and Reading Success) and the other intervention was
small-group instruction (Reading and Writing). Students were in first grade and were followed
into the fall of the second grade. The study provides a detailed descriptions of key instructional
elements of each of the five treatment conditions drawing on videotaped documentation of
instruction as well as details of teacher education components including number of training
hours, schedule, and training methods.
Results from a qualitative analysis of videotaped lessons and hierarchical linear model
analyses revealed that only Reading Recovery produced significant effects on all the four literacy
assessment tasks used for the Pinnell et al. (1994) study. These included dictation tasks as well as
the Woodcock Reading Mastery Test. The study authors point to the positive impact of the
individual tutoring, the intensity of the professional development, and the instructional design of
Reading Recovery. These process variables individually were not sufficient to explain the
positive outcomes for the high-risk students in the Reading Recovery intervention, but when

12
considered together, students made significant gains in their reading and sustained them beyond
the intervention delivery.
Examination of Cost-Benefits or Cost-Effectiveness
We have found very few studies that combine the study of an early literacy intervention
with rigorous examination of cost-benefits or cost-effectiveness. A major report prepared by staff
at the philanthropic foundation KPMG (Jones, Raby, Tolfree, & Gross, 2006) provides a
comprehensive analysis of the long-term costs of literacy difficulties for individuals and for
society at large using a cost-benefit/return on investment framework. It should be noted that the
KPMG Foundation made a substantial financial investment in the implementation of Reading
Recovery schoolwide in the United Kingdom through a program called Every Child a Reader.
The report documents five different kinds of costs associated with children who have not learned
to read by the age of 7. The cost categories are special education services, antisocial behavior,
unemployment, crime, and health. Publicly available data were used to analyze academic
achievement in school, and a national survey of basic skills for life including literacy and
numeracy was used to evaluate long-term outcomes.
The KPMG (Jones et al., 2006) report makes compelling reading as it sets out the grim
consequences associated with poor literacy levels. Those 11-year-olds leaving elementary school
with inadequate literacy skills are more likely to be boys, over four times more likely to be truant
from school than those who enter secondary school with appropriate literacy skills levels, and
more likely to be unemployed as adults. The report includes a calculation of the return on
investment to society of investing in Reading Recovery to avoid these kinds of devastating
personal and societal consequences, with every pound sterling invested returning between 14.81

13
pounds sterling to 17.56 pounds sterling. Employment cost savings were the largest component
of this return.
The KPMG report (Jones et al., 2006) notes, as do the cost analyses associated with
implementing early interventions provided by Karoly et al. (2005), that the full cost of providing
Reading Recovery falls within the primary (elementary) phase of schooling and this has
implications for how funding should be structured. Indeed, the report states that implementing
Reading Recovery potentially costs more than some special education services, although
Reading Recovery is more effective. Primary schools end up shouldering the burden of these
costs for future individual and societal economic gains (p. 25) and because of this burden the
report recommends that primary schools should be given additional targeted funding.
No doubt due to the wide implementation of Reading Recovery in United Kingdom
schools, Nicholson, Fawcett, Moss, and Nicholson (1999) describe a study of an early literacy
intervention for students between 5 1/2 and 6 1/2 years of age, delivered in groups of four
students (N=16) over a 10-week period as compared to a control group of children (N=40). The
authors claim that the intervention proved more cost-effective than 1:1 instruction provided
through Reading Recovery. However, the authors present only a cursory description of costs and
do not develop a cost-effectiveness ratio. Therefore, the authors' claims could not be
substantiated through data presented in the article.
Borman and Hewes (2002) present a thorough cost-effectiveness analysis comparing
Success For All (SFA) (a comprehensive school reform model focusing on literacy and math
achievement) with the Tennessee class-size reduction program, the Abecedarian project, and the
Perry Pre-School Program. Over 1,000 students in SFA and in a control group were studied. The

14
authors were interested in the enduring effects of early intervention and, based on Ramey and
Ramey’s (1998) principles of biosocial developmental contextualism, predicted that weak and
fragmented early interventions would not be as effective as high-quality and intensive
interventions. Using a quasi-experimental methodology and meeting quality standards for a cost-
effectiveness analysis, the authors’ findings reveal that every $1,000 of per pupil expenditure
produced a reading effect size of 0.09 for SFA, the second-highest cost-effectiveness ratio of the
four interventions studied.
The Borman and Hewes (2002) study is of significance not only for its findings, but also
for its methodology. It used a rigorous quasi-experimental design to study the effects of SFA, it
made cost-effectiveness comparisons with programs that had similar rigorous evaluations and
levels of effectiveness, and it employed standards for the cost-effectiveness analysis that are
transparent and replicable (Levin & McEwan, 2001; Hummel-Rossi & Ashdown, 2002).
However, this study also is a reminder of the complexities and the expertise necessary to conduct
such a quality study.
The Relevance of Process Variables
Understanding the "how" rather than only the "what" of early literacy interventions
requires attending to process variables that we regard as similar to the priming mechanisms
essential for early interventions to effect change as described by Ramey and Ramey (1998). Of
relevance to early literacy interventions are process variables such as teacher instructional
effectiveness and quality of implementation.
Drawing on a broader range of research, Palardy and Rumberger (2008) have studied
several aspects of teacher effects as they impact first-grade reading gains. This research used
15
data from 3,496 kindergarten students in 887 classrooms collected through the Early Childhood
Longitudinal Study. Recognizing the limits of secondary data analysis, the researchers reported
findings of significance for teacher expectations and positive teacher instructional practices in
relation to reading achievement gains. We are reminded again through this study of the
substantial impact effective teachers have on student learning. Investing in teacher effectiveness
through intensive professional development is a vital strategy in ensuring positive literacy
outcomes for students, especially in the early years. However, effective teachers still need
support if an intervention is to be implemented effectively. For example, Stein et al. (2008)
demonstrated that implementing a peer-assisted kindergarten learning program required on-site
technical assistance to ensure that the program had the desired effect on student's reading
achievement.
Caution About Research Syntheses
Finally, Dynarski’s (2008) observations about the implementation of evidenced-based
practices should be noted. Writing as director of the WWC, Dynarski cautioned about research
syntheses that are overly selective and where researchers have a financial stake in the
intervention at hand.2 He also provided a somber analysis of the risk-averse nature of decision
making in schools as follows:
With different goals and resource limits, decision makers use all kinds of research
evidence to decide which curricula and interventions to use in their schools; and these
decision makers, like investors of any kind, usually are averse to risk. If two courses of
action are viewed as having the same outcomes, decision makers will prefer the course of
action with the smaller variability. (p. 27)

16
Summary of Findings: Research Question 4
4. Drawing on findings from Questions 1, 2 and 3, what are the practical
implications for decision making when comparing the evidence for
intervention effectiveness and cost-effectiveness? For example, how can
school administrators integrate cost-effectiveness considerations into their
decision making?
Human Capital Theory
There is a dearth of work in the literature that addresses Question 4. When one considers
the literature in economics of education, there is an interesting body of work that focuses on
examining the relation between school performance and efficiency with the goal of identifying
efficient and inefficient schools. Using production or cost functions, these economists link school
inputs, such as teacher salaries and school characteristics, to school outputs, such as student test
scores and student retention. The production and cost functions employ sophisticated statistical
applications of regression analyses and are beyond the skill set of the typical educational
administrator or teacher (Schwartz & Zabel, 2005; Schwartz, Stiefel, & Amor, 2005).
What has emerged from this economics of education literature that is particularly
interesting to our response to Question 4 is the adoption by educational economists of core
concepts of child development and the integration of these concepts into economic theory
concerning early childhood investments. Influenced by data on the large number of children at
risk in the United States; the importance of early childhood in cognitive, physical, and emotional
development; and the movement from a treatment to a preventive philosophy in public health
and social/educational services, economists have moved toward a human capital approach with
an emphasis on the monetary payoffs of early childhood investments.

17
Essentially, human capital theory is an economic model for skill development. This
theory focuses on the development of the productive capacities of individuals and concerns the
investments necessary to produce the development of these capacities, much as one might make
investments in a manufacturing firm to increase production output. Further, this theory
recognizes that investments in individuals often produce the largest payoffs when these
investments are made early in childhood (Kilburn & Karoly, 2008).
Return on Investment (ROI) Approach
Human capital theory is consistent with a return on investment (ROI) approach to the
decision-making processes schools could pursue when selecting an early literacy intervention.
An investment rather than a cost approach reflects a theory of action based, in part, on human
capital development. In discussing this approach, Psacharopoulos (2006) writes that the
development of human capital entails the sacrifice of resources today for the sake of a stream of
benefits in the future (p. 114). A cost approach focuses on financial accounting of the resources
used for an education program; an investment approach considers resource inputs as investments
in the outcomes produced by an education intervention and, thus, has potential to help decision
makers consider wider social and economic returns. As Kilburn & Karoly (2008) have noted,
when these investments are made early in an individual's life they have the potential to be more
efficient and productive than remediation later in the in the person's life and thus support a
prevention, rather than a treatment, orientation to child development.
School-level decision makers bear the burden of a decision dilemma; they may eschew
adopting the best evidenced-based programs in the face of annual budget cycles that are
dependent on political support that is focused on short-term results and narrow fiscal input

18
considerations. For example, even though early literacy achievement is regarded as a critical
threshold for reaping the social and economic benefits of human capital development, a school
district may not consider that it has the resources to support implementing the most effective, but
in the immediate the most costly, literacy intervention. Raising literacy scores for young adults
by just 1% raises labor productivity by 2.5% (Coulombe, Tremblay, & Marchand, 2004;
Azariadis & Drazan, 1990; cited in Psacharopoulos, 2006) with returns both to the individual and
to society at large. However, the decision dilemma is that these returns may accrue to another
generation of taxpayers and not to those who footed the initial costs.
A human capital perspective is the longer, harder route for decision makers especially
when it involves finding additional resources or projecting the returns on an investment beyond
the immediate budget year. Yet, this perspective is highly consistent with the frequently cited
biosocial developmental contextualism of psychologists Ramey and Ramey (1998) who present a
conceptual framework that draws on experimentally rigorous investigations of early childhood
interventions and their impact on young children’s cognitive and social development. The
authors' identification of six design principles of interventions with proven outcomes for
positively altering human development is a valuable cost-containment contribution. By applying
these principles, implementation of weak and ineffective interventions can be avoided, thus
reducing potential for precious funds to be spent unwisely. When the most effective programs
are implemented, there is the potential for private and social economic returns to exceed the
initial investments of resources, using appropriate discount rates for the present versus future
value of the dollars invested.
19
Practical Applications of a Return On Investment Approach
In practical applications of these concepts, we can draw on some specific examples of
this return on investment approach in use in the public sector. Several different interpretations of
return on investment exist. One simple calculation expresses the monetary relation between
investments and returns as a percentage (benefit divided by the investment times 100), with the
higher the percentage the greater the return on the investment (Martin & Lomperis, 2002).
Return on investment can help decide if the benefits of a program outweigh alternative programs
or different uses of the resources. Foote and Roza (2008) use return on investment as a “useful
and relatively straightforward means of factoring costs into school performance” (p. 23). These
researchers used a return on investment model in a study comparing the efficiency and
effectiveness of different urban school districts in meeting district performance goals. The model
attempted to capture performance beyond test scores by using a weighting system to assess
schools’ capacity to underperform, meet expectations, or excel in key areas such as achievement
growth from year to year.
In calculating a return on investment for library services, a Library Journal news report
(Oder, 2005) described how borrowers were asked what they would be prepared to pay for
certain services and what alternatives they would adopt if the library services they used were no
longer available. This approach reflects efforts to capture outcomes that are difficult to monetize,
such as the leisure and recreational services offered by some libraries. Similarly, in schools
parental preference and satisfaction with an educational program are rarely included in cost
calculations. However, parents may have strong views about the value of certain literacy
program features for their children, such as one-to-one instruction versus small-group
instruction. A decision to eliminate one-to-one literacy instruction on the basis of cost may have

20
unforeseen distributional consequences for the parents of participating children. For example,
families may feel obligated to purchase such levels of instruction privately.
In another example in which the return on investment was examined within the context of
literacy, Martin and Lomperis (2002) investigated the cost-benefit and the return on investment
for implementing English language training programs in international development projects. The
article presents a thorough documentation of the authors' methodology and illustrates the range
of data that are necessary to thoroughly explore the impact and costs of such programs. In
addition to improved employee work-related language skills and subsequent worker productivity,
the full cases and mini cases cited in the article also showed evidence of increased employee job
satisfaction and suggested that a long-term study might reveal further financial impact for the
employees (e.g., promotions), employers (e.g., greater employee retention), and funders.
The Impact of Unexpected or Unplanned Outcomes of Interventions
As suggested above, unanticipated or unplanned outcomes of a program such as the
possibility of having to purchase replacement instruction when a program is withdrawn and/or
increased worker job satisfaction, can have significant impact on program participants. We
addressed this issue of distributional consequences in our own work in which we reviewed the
field of cost-effective and cost-benefit analyses (Hummel-Rossi & Ashdown, 2002) and referred
to nontargeted or unanticipated outcomes as the qualitative residual. In related research,
Psacharopoulos (2006) drew on the work of Haverman and Wolfe (1984) who pioneered an
approach to attach a monetary value to the spillover effects of education. While it frequently is
not possible to anticipate and monetize all program outcomes, good economic evaluations are
sensitive and open to the investigation of all effects.

21
Finally, within the context of education when we consider concepts such as return on
investment, cost-benefit, and cost-effectiveness with respect to new and promising interventions,
we tend to think positively and contemplate how much an innovative method will improve
student achievement and save precious funds. However, we must be prepared for the fact that
some interventions are no more effective and indeed may be worse than existing practice and/or
may cost far too much to implement given how little is gained. Ignoring available evidence in
such cases can result in negative payback or negative return on investment. Educational decision
makers need to be prepared to recognize and acknowledge such situations. Foote and Roza
(2008) cite a 2007 United States Chamber of Commerce report in which return on investment
indices using per pupil expenditure and student achievement on a national test were compared
across states. While some states made large gains, some of these gains were achieved at such
high costs that their worth is questionable. Again, this points to the difficult task faced by
educational decision makers.
A Decision-Making Framework for Selecting and Implementing
a Literacy Intervention
Given the above-cited economic complexities of decision making, how should the school
administrator proceed when faced with selecting and implementing a literacy intervention? To
circumvent a response of "with trepidation," we have developed a decision framework based on
return on investment and cost-benefit principles. The framework is intended for use by educators
to evaluate literacy interventions.

22
Decision-Making Checklist for Early Literacy Interventions
The Decision-Making Checklist for Early Literacy Interventions (the Checklist) is
organized around five major dimensions of an intervention: Student Achievement Outcomes,
Program Comprehensiveness, Capacity Building Outcomes, Efficiency and Efficacy Outcomes,
and Costs (see Appendix A). Within each dimension are five characteristics that the educator
rates on a 3-point scale that indicate the degree or probability (from 0 to 100%) that the
characteristic applies to the intervention. The possible range of summed scores for each
dimension is 5 to 15. The higher the score, the more appropriate or better the intervention on that
dimension. Some of the characteristics are specific to the intervention as applied to the particular
school setting and, consequently, an intervention could have different ratings depending on the
particular situation. Certain of these five dimensions of the checklist may be more important to
an administrator than others and the individual dimension sub scores allow for the isolation of
the various aspects of an intervention.
Using the Checklist, an administrator can evaluate different interventions and compare
the interventions' scores on each of the dimensions. This permits the administrator to see the
strengths and weaknesses for different interventions highlighted in his/her particular setting. Not
only does this assist the administrator in reaching a decision, but it provides him/her with
valuable objective information for consultations with the school board, parents, and other
stakeholders.
Validating the Checklist
To examine the usability, relevance, and content validity of the Checklist, we identified
five public school administrators, each with at least 20 years experience as an administrator, and

23
asked them to review the Checklist and participate in an interview (Appendix B). Two
administrators were retired assistant superintendants, one was a retired superintendant, one was a
retired principal, and one is an active assistant principal. The four retired administrators currently
are actively involved in teacher education at the university level. The administrators were
contacted and asked if they would be willing to review an evaluation tool to be used for the
implementation of early literacy interventions. All are known to one of the authors through her
teacher education work. All agreed to participate and were sent by email a guide sheet and a draft
of the Checklist. The administrators were asked to review the Checklist and a suitable time was
established for a follow-up interview by telephone. Each follow-up interview lasted from 20 to
40 minutes. Three questions guided the interviews and the responses from the administrators are
summarized as follows.
The administrators first were asked if they had ever used a checklist as a basis for
program evaluation in their school or school system. They were unanimous in their responses
and had never used a checklist or seen a checklist used in a program evaluation context.
Secondly, the administrators were asked about their experiences using approaches such as return
on investment or cost-effectiveness in their work. Responses to this question were varied. One of
the more experienced administrators observed that these concepts are becoming more common in
school parlance, as school district boards often include members from the business and corporate
world. One of the other administrators noted that increasingly principals have direct
responsibility for managing budgets and are responsible for their schools' overall performance;
therefore, these concepts are becoming more familiar to school leaders. There was general
agreement among the administrators that incorporating information about costs and outcomes in
making decisions regarding literacy interventions is important.

24
The final part of the interview involved reviewing each section of the Checklist and
considering the extent to which the items were relevant for school administrators to consider.
Responses to the Checklist as a decision-making tool varied; the five dimensions of the checklist
(Student Achievement Outcomes, Program Comprehensiveness, Capacity Building Outcomes,
Efficiency and Efficacy Outcomes, Costs) were regarded as important and relevant in evaluating
early literacy interventions. However, some of the characteristics within the dimensions were
less easily understood, such as procedures or criteria for measuring fidelity of implementation.
Calculating costs savings to families was considered challenging to undertake. One administrator
suggested including specific categories related to space needs, required materials, and
replacement materials. Two administrators recommended that the language of the Checklist be
“more user friendly” and more-detailed guidance and definitions of terminology be provided.
Another administrator observed that the Checklist was easy to use, could be completed in a
relatively short time, and would allow administrators quickly to compare and contrast different
instructional options.
The administrators also were asked to assess the relevance of the three response options.
Three of the five respondents found the middle range response of 20% to 80% too wide to be
useful in decision making. More broadly, one of the administrators saw the Checklist as a
valuable tool for use by school or district-based instructional committees, such as a reading
committee. This administrator noted that much programmatic decision making is based on
recommendations from committees made up of a range of stakeholders including teachers,
parents, and administrators. The Checklist would help compile information about alternative
interventions, serve as a basis for discussion, and as a basis for a recommendation. Another

25
administrator valued the Checklist as a way to capture information quantitatively to use as a
basis for intervention comparison.
The interview responses suggested that the checklist needed to have a more-detailed set
of instructions, the response options needed to be refined, and clarifying examples needed to be
added to some of the items. Additionally, the respondents did not always appear to understand
that they were being asked to evaluate the extent to which the intervention under consideration
had a body of evidence that addressed the checklist dimensions; this point could be addressed in
the directions.
Subsequent to the interviews, we [the authors] have revised the instructions, modified the
response options, and clarified items. The Checklist should prove to be a valuable tool for
administrators to use in deciding upon an appropriate literacy intervention for their particular
school or school district, with the ultimate goal of maximizing their return on their investment.
Methods for Calculating Cost-Effectiveness and
Return on Investment for Literacy Interventions
Subsequent to the implementation of the literacy intervention, the administrator may wish
to examine the cost-effectiveness and the return on investment for the intervention. We have
developed a methodology for these calculations and they are found in Methods for Calculation of
Cost-Effectiveness and Return on Investment for Literacy Interventions (the Methods)
(Appendix C). Our methodology takes into account the resources and data available to the
administrator and his/her probable statistical training and access to statistical programs. It
recognizes the time constraints of busy administrators' schedules. It is an administrator-friendly
approach that assumes that the school has a literacy assessment program in place. As a basis of

26
comparison for examining cost-effectiveness and return on investment we have used existing
practice. This might be, for example, sending the targeted children to a resource room three times
a week for small-group literacy instruction. Clearly, existing practice has costs and outcomes and
can serve as the basis for comparing a new intervention.
There is a very good reason why economic analyses are rarely conducted by school
administrators, and that is that the methodology is too complex and time consuming for the
typical administrator. We have simplified the methodology, and used data and methods readily
available to the administrator and have presented these in a manner that should prove to be useful
and workable.
The Checklist and the Methods, found in Appendices A and C respectively, can form the
basis for the selection and evaluation of a literacy intervention. Faced with the decision as to
whether to introduce a literacy intervention and/or which literacy intervention to introduce, the
administrator (or decision-making committee) can use the Checklist along with visits to schools
that have implemented different interventions and reviews of articles on the interventions to
evaluate salient characteristics of competing interventions. The Checklist permits the
administrator to focus on the most-important dimensions of an intervention to his/her school and
to determine if the intervention is strong enough in the dimension to meet the schools' needs.
As a companion to the Checklist, the Methods will help the administrator to plan an
evaluation of the intervention to help determine if the chosen intervention is more effective than
existing practice in terms of improving student literacy achievement in at risk students. Further,
the Methods shows the administrator how to determine the costs to raise a literacy achievement
score one point with existing practice and with the intervention (cost-effectiveness ratio). Finally,

27
the Methods provides a procedure for tracking students taught under existing practice and under
the intervention and for calculating the return on investment with each curriculum. Information
gleaned through the application of the procedures suggested in the Methods can help
administrators decide whether an intervention is an effective and economically efficient way to
provide literacy instruction. Together the Checklist and the Methods comprise an important
package of administrative tools to employ when faced with decisions regarding implementing
and evaluating a new literacy intervention.
Summary
In this era of reductions in school budgets and strict accountability, it is critical that every
dollar spent on education be carefully scrutinized to determine if it is being spent wisely.
Research has demonstrated that spending on high-quality early literacy interventions is often
cost-effective with quality programs producing impressive literacy gains in at-risk students. Yet
sometimes administrators do not have additional funds to allocate to a literacy intervention. It
must be recognized by school districts that literacy is a fundamental, core cognitive skill and that
the acquisition of good literacy skills in the early years of elementary school is critical and more
important than many other learning activities that take place in school. If students cannot read
they cannot do math word problems, read their science and social studies books, or write reports.
Further, it is much more efficient to address literacy problems in the first few years of
elementary school than in the latter years of elementary school or in middle school. A preventive
literacy approach is far more cost-efficient than a remedial literacy approach. This implies that
schools must carefully examine their goals and prioritize them. The development of good literacy
skills for all children in early elementary school must be at the top of this list. If it is not, the

28
schools need to reprioritize. This also implies that the items in a school's budget might need to be
reprioritized — a painful task, but necessary when faced with limited funds.
School administrators today have far more complex and demanding responsibilities than
in years past. The Checklist and the Methods presented in this report will assist them to more
efficiently and thoroughly address some of these responsibilities.

29
Endnotes
1 An Excel spreadsheet containing literacy references related to the four questions examined in this study is available from the author.
2 The Reading Recovery Council of North America (RRCNA) commissioned the authors to conduct this cost-effectiveness analysis as part of the Early Literacy Intervention: Expanding Expertise and Impact initiative. Funding for the initiative has been provided through an award from the U.S. Department of Education, under award number U215K090094, for the Fund for the Improvement of Education (FIE) Program. The contents do not necessarily represent the policy of the Department of Education, and you should not assume endorsement by the federal government.

30
References
Azariadis, C., & Drazen, A. (1990). Threshold externalities in economic development. Quarterly
Journal of Economics. 105(2), 501-526.
Barnett, S. W. (1985). Benefit-cost-analysis of the Perry Preschool Program and its policy
implications. Educational Evaluation and Policy Analysis, 7, 333-342.
Borman, D., & Hewes, G. M. (2002). The long-term effects and cost-effectiveness of Success for
All. Educational Evaluation and Policy Analysis, 24, 243-266.
Columbe, S. J., Tremblay, E., & Marchland, S. (2004). Literacy scores: Human capital growth
across 14 OECD countries. Ottawa, Ontario, Canada: Statistics Canada.
Dynarski, M. (2008). Bringing answers to educators: Guiding principles for research syntheses.
Educational Researcher, 37, 27-29.
Elbaum, B., Vaughn, S., Hughes, M., & Moody, S. (2000). How effective are one-to-one tutoring
programs in reading for elementary students at risk for reading failure? A meta-analysis
of the intervention research. Journal of Educational Psychology, 92, 605-619.
Foote, M., & Roza, M. (2008). Measuring school efficiency: Educational return on investment:
A case study of an urban district. The Journal of School Business
Management, 20, 20-33.
Haverman, R., & Wolfe, B. (1984) Schooling and economic well-being: The role of non-market
effects. Journal of Human Resources, 19(3), 377-407.
Hummel-Rossi, B., & Ashdown, J. (2002). The state of cost-benefit and cost-effectiveness
analyses in education. Review of Educational Research, 72, 1-30.

31
Hummel-Rossi, B., & Ashdown, J. (2003). Increased self-esteem as a nontargeted outcome of an
early literacy intervention. Proceedings of the Hawaii International Conference on Social
Sciences (pp. 1-21). West Oahu, HI: University of Hawaii. ISN#1539-7300.
Institute of Education Sciences. (2003). Identifying and implementing educational practices
supported by rigorous evidence: A user friendly guide. Washington, DC: U.S.
Department of Education.
Iverson, S., & Tunmer, W. E. (1993). Phonological processing skills and the Reading Recovery
program. Journal of Educational Psychology, 85(1), 112–126.
Iverson, S., Tunmer, W. E., & Chapman, J. W. (2005). The effects of varying group size on the
Reading Recovery approach to preventive early intervention. Journal of Learning
Disabilities, 38, 456-472.
Jones, D., Raby, M., Tolfree, T., & Gross, J. (2006). Long term costs of literacy difficulties.
Montvale, NJ: KPMG Foundation.
Karoly, L. A., Greenwood, P. W., Everingham, S., Hoube, J., Kilburn, M. R., Rydell, et al.
(1998). Investing in our children: What we know and don't know about the costs and
benefits of early childhood interventions. Santa Monica, CA: Rand Corporation.
Karoly, L. A., Kilburn, M. R., & Cannon, J. S. (2005). Early childhood interventions: Proven
results, future promise. Santa Monica, CA: Rand Corporation. (Chapter 4 is titled "The
economics of early childhood interventions.")
Kilburn, M. R., & Karoly, L. A. (2008). The economics of early childhood policy: What the
dismal science has to say about investing in children. Santa Monica, CA: Rand
Corporation.
32
Levin, H. M., & McEwan, P. J. (2001). Cost-effectiveness analysis: Methods and applications
(2nd ed.). Thousand Oaks, CA: Sage Publications.
Martin, W. M., & Lomperis, A. E. (2002). Determining the cost benefit, the return on
investment, and the intangible impacts of language programs for development. TESOL
Quarterly, 36(3). 399-429.
Nicolson, R. I., Fawcett, A. J., Moss, H., & Nicolson, M. K. (1999). Early reading intervention
can be effective and cost-effective. British Journal of Educational Psychology, 69, 47-62.
Nores, M., Belfield, C. R., Barnett, W. S., & Schweinart, L. (2005). Updating the economic
impact of the High/Scope Perry Preschool Program. Educational Evaluation and Policy
Analysis, 27, 245-261.
Odden, A., & Achibald, S. (2001). Reallocating resources to boost student achievement: How to
boost student achievement without asking for more. Thousand Oaks, CA: Corwin Press.
Oder, N. (2005). FL, SC studies tout return on public library investment. Library Journal,
130(4). 16-18.
Palardy, G. J., & Rumberger, R. W. (2008) Teacher effectiveness in first grade: The importance
of background qualifications, attitudes, and instructional practices for student
learning. Educational Evaluation and Policy Analysis, 30(2), 111-140.
Pinnell, G. S., Lyons, C. A., DeFord, D. E., Bryk, A. S., & Seltzer, M. (1994). Comparing
instructional models for the literacy education of high-risk first graders. Reading
Research Quarterly, 29(1), 8-39.
Psacharopoulos, G. (2006). The value of investment in education: Theory, evidence, and policy.
Journal of Education Finance, 32(2), 113-136.
33
Ramey, C. T., & Ramey, S. L. (1998). Early intervention and early experience. American
Psychologist, 53, 109-120.
Schmitt, M. C. (2008, December). Literature review: Response to intervention, group size, and
early intervening services. Symposium conducted at the annual meeting of the National
Reading Conference, Orlando, FL.
Schwartz, A. E., Stiefel, L., & Amor, H. B. H. (2005). Measuring school performance using cost
functions. In L. Stiefel, A. E. Schwartz, R. Rubenstein, & J. Zabel (Eds.), Measuring
school performance and efficiency: Implications for practice and research. American
Education Finance Association 2005 Yearbook (pp. 67-91). Larchmont, NY: Eye on
Education.
Schwartz, A. E., & Zabel, J. E. (2005). The good, the bad, and the ugly: Measuring school
efficiency using school production functions. In L. Stiefel, A. E. Schwartz, R.
Rubenstein, & J. Zabel (Eds.), Measuring school performance and efficiency:
Implications for practice and research. American Education Finance Association 2005
Yearbook (pp. 37-66). Larchmont, NY: Eye on Education.
Schwartz, R. M., Schmitt, M. C., & Lose, M. K. (in press). Effects of student-teacher ratio in
response to intervention approaches. The Elementary School Journal.
Stein, M. L., Berends, M., Fuchs, D., McMaster, K., Saenz, L., Yen, L., Fuchs, L. S., &
Compton, D. L. (2008). Scaling up and early reading program: Relationships among
teacher support, fidelity of implementation, and student performance across different sites
and years. Educational Evaluation and Policy Analysis, 30(4), 368-388.
34
Vaughn, S., Linan-Thompson, S. Kouzekanani, K., Bryant, D. P., Dickson, S., & Blozis, S. A.
(2003). Reading instruction grouping for students with reading difficulties. Remedial and
Special Education, 24(5), 301-315.
Wasik, B. A., & Slavin, R. E. (1993). Preventing early reading failure with one-to-one tutoring:
A review of five programs. Reading Research Quarterly, 28, 178-200.
What Works Clearinghouse. (2007). Beginning reading intervention report: Reading Recovery.
Washington, DC: Institute of Education Sciences.
http://ies.ed.gov/ncee/wwc/reports/beginning_reading/reading_recovery

35
Appendix A
Calculating a Return on Investment:
A Decision-Making Checklist for Early Literacy Interventions
Guidelines for Completion
The following checklist is for school administrators to use in evaluating alternative early literacy interventions. It can be used as part of the decision-making process (for example, with a school or district-based curriculum committee or team) and will help to identify significant aspects of the intervention under consideration. The checklist is organized around five major dimensions of an intervention: Student Achievement Outcomes, Program Comprehensiveness, Capacity Building Outcomes, Efficiency and Efficacy Outcomes, Costs. There are five characteristics under each dimension for a total of 25 items.
Each intervention under consideration should be evaluated using a separate checklist document. Also, it is important to complete a checklist for existing practice, as it should form the basis for comparison. If an intervention is not substantially better than existing practice, it may not be appropriate for adoption. For each of the 25 characteristics, check the appropriate column to indicate the extent of evidence available to you. Does the characteristic describe the intervention less than 30% of the time/with probability less than 30%, 30%–70% of the time/with probability between 30% and 70%, or more than 70% of the time/with probability greater than 70%?
Please note that the characteristics associated with each of the five dimensions are critical to the effectiveness and cost-effectiveness of early literacy interventions according to current early intervention research. Each dimension represents changes in performance that should occur as a result of implementing the early literacy intervention under consideration. For each of the five dimensions, you are prompted to study the evidence available to you for the early literacy intervention under consideration regarding each characteristic. Therefore, it will be important that prior to completing the checklist, that relevant reports and materials (for example, the What Works Clearinghouse website) have been reviewed.
To complete the checklist, apply the following numerical values to the response for each characteristic:
1 = less than 30% of the time or probability less than 30% (very little evidence)
2 = 30%–70% of the time or probability of 30%–70% (moderate evidence)
3 = more than 70% of the time or probability of more than 70% (substantial evidence)
To complete the scoring, add up the numerical values for each of the five dimensions and place the score in the space under each dimension. For example, if a school administrator and/or
36
the school instructional team responds to the Student Achievement Outcomes dimension by answering less than 30% of the time to item 1, 30–70% of the time to items 2 and 3, and more than 70% of the time to items 4 and 5, the total score for this dimension would be 11 (1 + 2 + 2 + 3 + 3 = 11). The minimum score for a dimension is 5 and the maximum score is 15.
At the end of the checklist is a place to enter the scores for each of the five dimensions. This allows for a quick comparison of the extent of the intervention impact and potential return on investment in each dimension (5 = very little evidence of impact; 6–10 = moderate evidence of impact; > 10 = substantial evidence of impact). Some schools may have specific goals or improvement plans that place greater importance on certain of these dimensions. For example, the Student Achievement Outcomes dimension focuses on whether there is evidence that the intervention addresses important equity outcomes. Therefore, separate dimension scores permit the school to focus on the most critical dimensions for decision making relevant for school priorities.
Checklist developed and revised by Barbara Hummel-Rossi and Jane Ashdown, July 2010
37
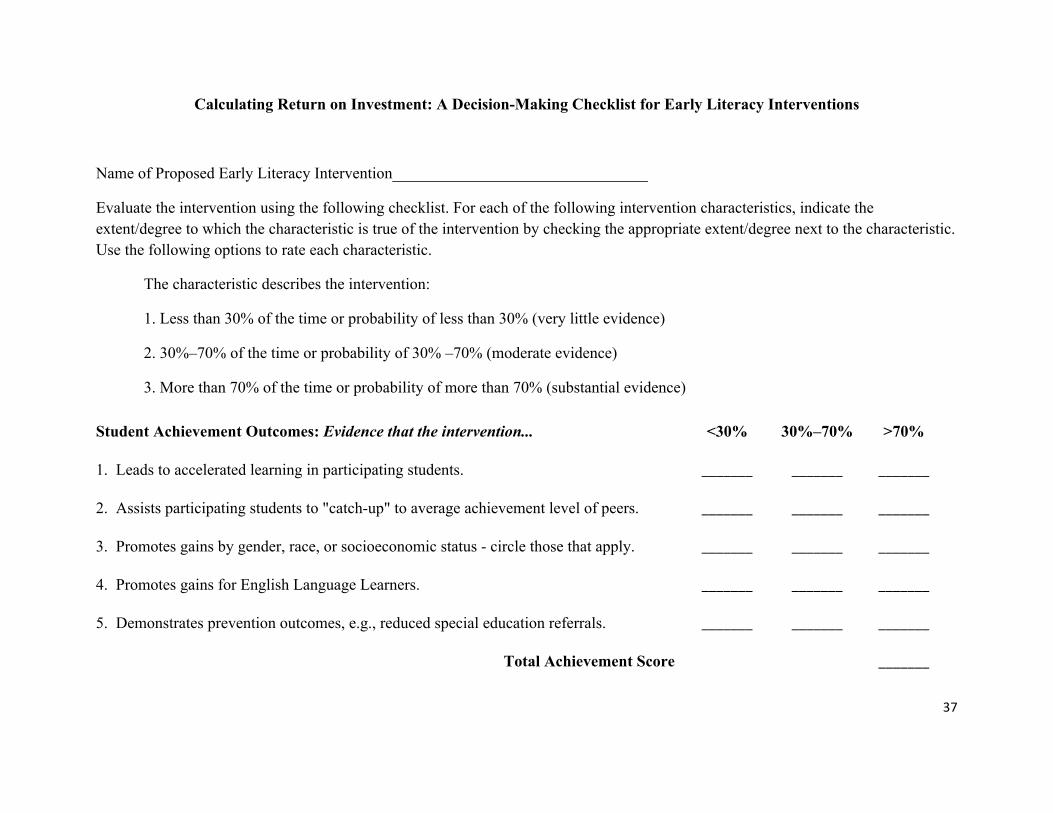
Calculating Return on Investment: A Decision-Making Checklist for Early Literacy Interventions
Name of Proposed Early Literacy Intervention________________________________
Evaluate the intervention using the following checklist. For each of the following intervention characteristics, indicate the extent/degree to which the characteristic is true of the intervention by checking the appropriate extent/degree next to the characteristic. Use the following options to rate each characteristic.
The characteristic describes the intervention:
1. Less than 30% of the time or probability of less than 30% (very little evidence)
2. 30%–70% of the time or probability of 30% –70% (moderate evidence)
3. More than 70% of the time or probability of more than 70% (substantial evidence)
Student Achievement Outcomes: Evidence that the intervention...
<30% 30%–70% >70%
1. Leads to accelerated learning in participating students. _______ _______ _______
2. Assists participating students to "catch-up" to average achievement level of peers. _______ _______ _______
3. Promotes gains by gender, race, or socioeconomic status - circle those that apply. _______ _______ _______
4. Promotes gains for English Language Learners. _______ _______ _______
5. Demonstrates prevention outcomes, e.g., reduced special education referrals. _______ _______ _______
Total Achievement Score _______

38
Program Comprehensiveness: Evidence that the intervention design is based on… <30% 30%–70% >70%
6. An intensive delivery model (e.g., # of lessons per week & student-teacher ratio). _______ _______ _______
7. Adaptability to developmental differences in students' learning. _______ _______ _______
8. Delivery by literacy trained teacher. _______ _______ _______
9. Instructional integration with regular classroom literacy curriculum. _______ _______ _______
10. Assessment system with ongoing feedback to students and terminal evaluation. _______ _______ _______
Total Comprehensiveness Score _______
Capacity Building Outcomes: Evidence that the intervention design includes… <30% 30%–70% >80%
11. Intensive and replicable professional development model _______ _______ _______
12. Ongoing monitoring of expertise of participating teachers. _______ _______ _______
13. Spill-over impact so participating teachers can apply expertise in additional settings. _______ _______ _______
14. Recommended instructional support options to ensure learning gains are sustained. _______ _______ _______
15. Opportunity for student's family to have support role. _______ _______ _______
Total Capacity Score _______

39
Efficiency and Efficacy Outcomes: Evidence that the intervention design includes… <30% 30%–70% >70%
16. Reliable and valid entry screening to target students most in need. _______ _______ _______
17. Reliable and valid terminal outcome measures that capture important outcomes. _______ _______ _______
18. Longitudinal outcome data indicating rate of continued literacy learning. _______ _______ _______
19. Procedures or criteria for measuring quality of intervention implementation. _______ _______ _______
20. Potential for scale-up to additional schools given appropriate resources. _______ _______ _______
Total Efficiency/Efficacy Score _______
Costs: Evidence that the intervention design identifies… <30% 30%–70% >70%
21. The major costs to school for 1, 3, and 5 years. _______ _______ _______
22. The potential sources of funding (new or reallocation) for 1, 3, and 5 years. _______ _______ _______
23. Cost savings to school (e.g., reduced special education referrals) for 1, 3, and 5 years. _______ _______ _______
24. Cost savings to families by not purchasing private tutoring. _______ _______ _______
25. Levels of teacher satisfaction with intervention through immediate feedback, long- term retention, and career progression. _______ _______ _______
Total Costs Score _______

40
Achievement Comprehensiveness Capacity Efficiency/Efficacy Costs/Return on
Investment
_______ _______ _______ _______ _______

41
Appendix B
Interview Protocol
Introduction
As part of a larger federally funded study, we have been awarded a grant through the Reading Recovery Council of North America (RRCNA) to compare the effectiveness and cost-effectiveness of early literacy interventions — in particular we have been asked to compare one-to-one tutoring and small-group instruction. There is evidence that one-to-one tutoring offered through Reading Recovery is very effective at improving literacy outcomes, but some schools are opting for small-group instruction instead saying it is less costly and just as effective. Even though our investigations have revealed that one-to-one instruction through Reading Recovery has both immediate and long-lasting positive impacts on children’s literacy performance compared to small-group instruction, schools and school systems may still choose less effective options in part because of the difficulties of bringing all the relevant cost and outcomes information together to make the best evidenced-based decision when selecting an early literacy intervention.
To assist decision makers, we are proposing an early literacy return on investment checklist. As experienced school administrators, we would appreciate your feedback on the feasibility and usefulness of this instrument at the school and school system level.
We are only interested in your response to the checklist as an evaluation instrument. Although in our final report on completion of the grant we will refer to these interviews and your feedback, we will not be identifying you as individuals.
The Checklist
Have you ever used a ‘checklist’ as a basis for program evaluation in your school or school system?
Is the phrase Return on Investment familiar to you and do you have experience of using this in your work currently or in the past (if retired)? Do you see it as a relevant way to think about identifying appropriate literacy interventions?
Let’s look at this checklist and take the first section on Achievement Outcomes — Are these dimensions relevant for school administrators to consider? Does the positive/negative response calculation seem helpful? (Repeat for each section of the checklist.)

42
Appendix C
Methods for Calculation of Cost-Effectiveness and Return on Investment for Literacy Interventions
Worksheet for Calculation of Cost-Effectiveness Ratio
For many administrators who wish to evaluate the cost-effectiveness of a new literacy intervention, it is useful to compare the costs and effects of the intervention with existing practice. While it is often not possible to conduct an experimental control study, one can compare the achievement of students in the year just previous to the adoption of the intervention to the achievement of the students who participate in the intervention. An effective literacy intervention in the early elementary grades usually has two primary effects of interest to administrators: (a) improvement in students' literacy achievement test scores and (b) reduced student use of resource room or special education services. We note that we have observed other positive outcomes of literacy interventions, such as increased student self-esteem (Hummel-Rossi & Ashdown, 2003) and reduced parental expenditure on supplemental literacy instruction, but these behaviors usually are not the behaviors targeted for improvement. Therefore, the outcome behaviors this analysis focuses on are literacy achievement test scores and use of resource room/special education services.
Also, it is recognized that costs other than salaries, training, and major materials/supplies will be incurred, such as the costs for space, utilities, and support services. However, these other costs generally are very small in comparison to the costs for salaries, training, and major materials and it takes considerable time and effort to determine such additional costs. Additionally, we have not recommended discounting, a procedure in which monetary benefits accrued in the future (e.g., reduced use of resource room by intervention participants the year after the intervention) are valued at a lower rate than monetary benefits obtained in the present. While discounting often will slightly reduce an early literacy intervention's monetary benefits, the procedures for discounting generally are not familiar to the literacy specialists and educational administrators who will be involved in the decision making and evaluation processes and failure to discount will not have a major effect on the findings.
Study Design. Assume that the literacy intervention is a one-semester program designed for first graders. If comparison is to be made with existing practice, the characteristics of the students who will be given the intervention should be identified. These might be the students in the bottom 20% of their first-grade class on a standardized literacy test and also identified by their teachers or a reading specialist as being very weak in literacy. During Year 1 of the study, prior to the intervention implementation, these comparison students should be tested on a standardized literacy test at the very beginning of the school year and at the end of first grade. A log should be kept of the exact amount of resource room or other special literacy instruction these students receive during the year. During Years 2, 3, and 4, these students as second, third, and fourth graders (if promoted each year) should be tracked and their end-of-year literacy scores recorded as well as the exact amount of resource room/special education services they receive.
During Year 2 of the study, the intervention should be implemented to approximately the same number of first-grade students with the same literacy characteristics as the comparison group of Year 1. Literacy testing should be done at the beginning and end of the school year and resource/special education services received by each student, in addition to the intervention, recorded. During Years 3, 4, and 5, these students should continue to be tracked and their end-of-year literacy test scores and resource room/special education services recorded.

43
It is important that the literacy achievement test(s) used for the intervention group be the same as that used for the comparison group and that the test be consistent with the school's literacy curriculum and be a reliable measure.
Calculation of Costs
Three time units need to be considered in determining costs: (a) the number of days in the school year, (b) the number of weeks in the school year, and (c) the number of teacher periods in the school day. Most states establish the number of days in the school year for the public schools. A number of states set this figure at 180 days. You will need to use the figure set by your own state. Once the number of days is known, the number of weeks in the school year can be calculated by dividing the number of days by 5 (the number of school days in a week). If there are 180 days in the school year, then there are 36 weeks in the school year (180 / 5 = 36). Round up or down to the nearest whole number where necessary; for example, 174 school days is 35 weeks (174 / 5 = 34.8) and 176 school days is 35 weeks (176 / 5 = 35.2).
In the calculation of teacher costs, it is assumed that the teacher's day is divided into periods or units that are locally determined by the school district. For example, a teacher's day might be divided into 4 periods in the morning and 3 periods in the afternoon for a total of 7 periods. Literacy teaching might be allocated 3 periods, math 1 period, science .5 period, social studies .5 period, art .5 period, music .5 period, and teacher preparation 1 period. Using this breakdown, the amount of time that a teacher devotes to each area can be calculated for a week and a school year. In calculating teacher costs, it is important that you know the amount of teacher time that an intervention requires and that you can express this time in terms of a teacher period.
In the cost calculations, it is assumed that there is one resource room teacher that works with a child and one intervention teacher. If more than one teacher works with a child for significant periods of time and there are substantial differences in the teachers' salaries, it would be wise to calculate the costs for each teacher and then take the average of the teacher's costs for use in the calculations.
COMPARISON GROUP Resource Room Services
1. Cost of resource room teacher salary for one teaching period
Salary of resource room teacher including benefits ________ (A)
Number of days in school year ________ (B)
Number of teaching periods in 1 day ________ (C)
Number of teaching periods in school year: B x C = D ________ (D)
Resource room teacher cost for one period: A / D = Cost 1 ________ (Cost 1)
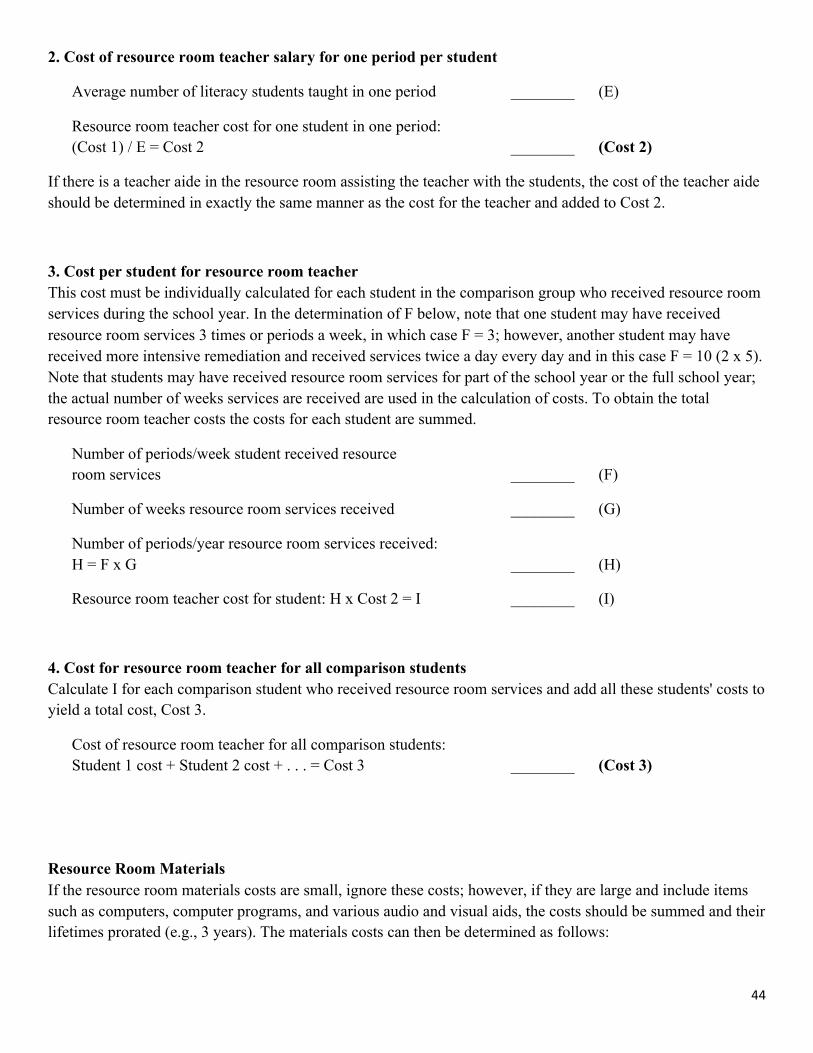
44
2. Cost of resource room teacher salary for one period per student
Average number of literacy students taught in one period ________ (E)
Resource room teacher cost for one student in one period: (Cost 1) / E = Cost 2 ________ (Cost 2)
If there is a teacher aide in the resource room assisting the teacher with the students, the cost of the teacher aide should be determined in exactly the same manner as the cost for the teacher and added to Cost 2.
3. Cost per student for resource room teacher This cost must be individually calculated for each student in the comparison group who received resource room services during the school year. In the determination of F below, note that one student may have received resource room services 3 times or periods a week, in which case F = 3; however, another student may have received more intensive remediation and received services twice a day every day and in this case F = 10 (2 x 5). Note that students may have received resource room services for part of the school year or the full school year; the actual number of weeks services are received are used in the calculation of costs. To obtain the total resource room teacher costs the costs for each student are summed.
Number of periods/week student received resource room services ________ (F)
Number of weeks resource room services received ________ (G)
Number of periods/year resource room services received: H = F x G ________ (H)
Resource room teacher cost for student: H x Cost 2 = I ________ (I)
4. Cost for resource room teacher for all comparison students Calculate I for each comparison student who received resource room services and add all these students' costs to yield a total cost, Cost 3.
Cost of resource room teacher for all comparison students: Student 1 cost + Student 2 cost + . . . = Cost 3 ________ (Cost 3)
Resource Room Materials If the resource room materials costs are small, ignore these costs; however, if they are large and include items such as computers, computer programs, and various audio and visual aids, the costs should be summed and their lifetimes prorated (e.g., 3 years). The materials costs can then be determined as follows:

45
5. Cost per student for resource room materials Note that it is assumed that students other than the comparison group use the resource room materials. Thus, this cost is calculated based on all students who used these resources.
One year prorated cost of materials ________ (J)
Number of periods used per week ________ (K)
Number of weeks in school year ________ (L)
Average number of students per period ________ (M)
Materials cost/period/student: J / (K x L x M) = Cost 4 ________ (Cost 4)
6. Total student resource room materials costs When resource room materials are included in the analysis, the following cost must be individually calculated for each student in the comparison group who receives resource room services. Each student's costs are then summed.
Number of periods/week student receives services ________ (H)
Student materials cost: H x Cost 4 = N ________ (N)
Calculate N for all students in the comparison group and add.
Total comparison group resource room materials cost: Sum of N for all students in comparison group = Cost 5 ________ (Cost 5)
7. Special education placement In the event that a comparison group student is placed in a contained special education classroom, the cost for the student is:
Assessment for special education placement cost _________ (O)
Special education teacher salary including benefits _________ (P)
Number of special education students in class _________ (Q)
Special education cost/student = O + P/Q = Cost 6 _________ (Cost 6)
If a teacher aide also works in the special education classroom, his or her costs would be calculated using the same formula as for the special education teacher. If the student receives additional literacy services, the costs should be calculated using the same formula as that used for calculating the costs for the resource room teacher.
If more than one comparison group student is placed in special education, repeat the calculations of Cost 6 for each student and sum them to provide a total Cost 6.

46
8. Total Comparison Group Costs
Total Comparison Group Year 1 costs = Cost 3 + Cost 5 + Cost 6
Repeat the above cost calculations for the comparison group for Year 2 (second grade), Year 3 (third grade), and year 4 (fourth grade).
9. Comparison group achievement data Collect comparison group students' Years 1, 2, 3, and 4 beginning and end of year literacy standardized achievement scores. In calculating a gain score if beginning-of-year literacy scores are not available, use the end-of-year scores from the previous year, e.g., Third-grade gain = 3rd grade end-of-year literacy score – 2nd grade end of year literacy score.
INTERVENTION GROUP It is recognized that the teachers who teach the intervention may require some kind of training in the methods of the intervention. This training might range from a Saturday morning workshop to two semesters of intense instruction and practice. It is likely that teachers who participate in training one year will not need to be retrained the following year and their training may suffice them for the length of time that they remain teaching in the school. Therefore, their training costs can be spread over their expected years of retention in the school. It is assumed that the publisher of the intervention will be able to provide accurate information on the cost to train a teacher in the intervention curriculum.
10. Cost of intervention training per teacher
Cost to train one teacher _________ (R)
Average number of years intervention teacher expected to remain in school _________ (S)
Training cost/teacher: R / S = Cost 7 _________ (Cost 7)
11. Cost of intervention teacher for one teaching period
Salary of intervention teacher including benefits _________ (T)
Intervention teacher cost for one period: (Cost 7 +T) / D = Cost 8 _________ (Cost 8)

47
12. Cost of intervention teacher for one period per student
Average number of intervention students taught in one period _________ (U)
Intervention teacher cost for one student in one period: Cost 8 / U = Cost 9 ________ (Cost 9)
13. Cost per student for intervention teacher The intervention costs assume that all students receive the same amount of intervention. If the amount of intervention varies by student, use the procedures outlined in steps 3 and 4 for determining the use of the resource room whereby actual use of the resources was calculated for each student.
Number of weeks intervention received _________ (V)
Number of periods per week student receives intervention _________ (W)
Cost of intervention teacher for one student: Cost 9 x V x W = Cost 10 ________ (Cost 10)
14. Cost for intervention teacher for all intervention students
Number of students receiving intervention in Year 2 ________ (Y)
Intervention teacher cost: Y x Cost 10 = Cost 11 ________ (Cost 11)
15. Intervention group materials If the intervention materials costs are significant, cost them for each student as done for the resource room materials for the comparison group in step 4 and 5 above. Multiply by the number of students receiving the intervention. Intervention materials cost = Cost 12
16. Additional intervention costs If additional teachers or a teacher aide are required for the intervention, their costs should be calculated as in steps 9–12 above and added to the cost of the intervention teacher for each student (Cost 10) and multiplied by the total number of students receiving the intervention.
If an intervention student requires placement in special education, the special education costs should be calculated as in step 7 above and added to the total intervention costs in step 17.

48
17. Total Intervention Group Costs
Total Intervention Group costs = Cost 11 + Cost 12
Repeat the above cost calculations for the intervention group for Year 3 (second grade), Year 4 (third grade), and year 5 (fourth grade). As the literacy intervention will have ended after Year 2, focus additional literacy support services, such as resource room, required in Years 3, 4, and 5.
18. Intervention group achievement data Collect intervention group students' Years 2, 3, 4, and 5 beginning and end-of-year literacy standardized achievement scores. In calculating a gain score, if beginning-of-year literacy scores are not available, use the end-of-year scores from the previous year, e.g., Third-grade gain = 3rd grade end-of-year literacy score – 2nd grade end-of-year literacy score.
Cost-Effectiveness and Return on Investment
Comparison Group Year 1: Calculate the mean literacy score for the comparison group for the beginning of Year 1 and for the end of Year 1. Subtract the beginning of Year 1 mean literacy score from the end of Year 1 mean literacy score to yield a Year 1 literacy gain score. The cost-effectiveness (CE) ratio is computed as:
CE = Year 1 literacy gain score / (Year 1 total comparison group costs)
The CE ratio tells you how much it cost during Year 1 to increase, on the average, each comparison group student's literacy score by 1 point.
Repeat the calculation of a CE for Year 2, Year 3, and Year 4 by calculating the literacy gain score for each year and the additional literacy costs for each year. Remember to include the costs for students in the group requiring special education.
Intervention Group Year 2: Calculate the mean literacy score for the intervention group for the beginning of Year 2 and for the end of Year 2. Subtract the beginning of Year 2 mean literacy score from the end of Year 2 mean literacy score to yield a Year 2 literacy gain score. The CE ratio is computed as:
CE = Year 2 literacy gain score / (Year 2 total intervention group costs)
Repeat the calculation of a CE for Year 3, Year 4, and Year 5 by calculating the literacy gain score for each year and the additional literacy costs for each year. Include the costs for students in the group requiring special education.

49
Comparing the Cost-Effectiveness Ratios At the end of Year 2 compare the mean literacy gain for the comparison group in Year 1 with the mean literacy gain for the intervention group in Year 2. If the mean of the intervention group is higher than the mean for the comparison group, the intervention has made a difference. If you are able, calculate the standard deviation for each group and examine the difference in terms of standard deviation units. Next look at the CE ratios and compare what it costs for each group to achieve 1 point of growth in literacy achievement at the end of first grade. Note that even if existing practice is less expensive in Year 1, if the students in the comparison group do not make substantial literacy gains, they may still be at risk.
To investigate the longitudinal gains of the students, examine the mean end-of-year literacy scores and the mean literacy gains for the two groups at the end of second, third, and fourth grade. Does the intervention group achieve at a higher level? Are the intervention group students close to the literacy achievement level of their classmates who presumably did not need the intervention? Or is there no difference between the comparison and intervention groups. At the end of the 5 years of your study, you will be able to examine the long-term effects on literacy achievement and the costs of your investment in the intervention. If the intervention has been effective and had long-term effects, than the intervention group should be performing better than the comparison group.
Comparing the Return on Investment To examine your return on investment (ROI), add up the total costs for the comparison group for Years 1–4 and the total costs for the intervention group for Years 2–5. Be sure to include the costs for special education. Compare the costs over 4 years for the two groups. If the long-term costs for your intervention group are lower than the long-term costs for your comparison group and the literacy achievement for the two groups is nearly the same, you have had a positive ROI. If your intervention group is achieving at a higher level than your comparison group and the difference in costs for the two groups is negligible, you have had a positive ROI. If, on the other hand, the intervention group does not achieve as well as the comparison group and the costs for the two groups are similar or the intervention group costs more, you have not had a positive ROI. The ROI essentially is the "bottom line," and if an intervention shows a positive ROI there is support for continuing to invest in it.
Note that in costing special education, we have used only the initial assessment cost and the cost of the special education teacher and a possible teacher aide. In reality, placing and maintaining a child in special education has additional costs including frequent individual testing of the child by a psychologist or other educational specialist, yearly development of an Individualized Educational Plan by a teacher, administrative review meetings, and possible special classrooms. Special education classes have fewer students than regular classes, but tend to occupy the same size classrooms as regular classes. It takes time to cost out all these additional expenses, but it might be prudent in certain situations to include some or all of these costs.
Worksheets developed and revised by Barbara Hummel-Rossi and Jane Ashdown, July 2010