cost benefit analysis of government support options for ... · pdf filea number of support...
TRANSCRIPT

Cost Benefit Analysis of Government Support Options
for Offshore Wind Energy
November 2002
Sustainable Energy Ireland, formerly the Irish Energy Centre, is funded by the Irish Government under the National Development Plan 2000-2006 with programmes part financed by the European Union

Page 2 of 76
programmes part financed by the European Union
Page 3 of 76
Executive Summary
This report was prepared by Byrne Ó Cléirigh for the Sustainable Energy Authority of Ireland. It provides a comparative analysis of the costs and benefits to the State of implementing three support options for Offshore Wind Energy (OWE) in Irish waters, viz.:
• A research and development programme;
• A demonstration programme consisting of ~5 MW, ~25 MW or ~50 MW projects;
• A full-scale deployment programme.
OWE is conceptually similar to the land based equivalent but it is less well developed. At the end of 2001, there were eight OWE projects installed worldwide with a combined installed capacity of approximately 80 MW. Ireland has a huge OWE resource, including a significant resource in relatively shallow waters close to the electrical network and to load centres. However, there are a number of important technical barriers to the full exploitation of this resource. To date, there are no developments in Irish waters but several consortia propose to develop projects with a combined installed capacity in excess of 2,000 MW. Most are located on the shallow water banks off the East Coast.
The main conclusions of this study are:
• OWE offers clear environmental benefits compared to fossil-fired generation because no CO2, NOX or SOX emissions are produced during operation. Future OWE capacity installed on the Irish system would displace fossil-fired generation and could therefore contribute significantly to Ireland’s targets for Renewable Energy deployment and greenhouse gas emissions limitation and reduction. OWE could also contribute to industrial development and job creation, reduce fossil-fuel imports, stimulate competition in the electricity sector and provide revenue to government through taxation and royalties for use of the foreshore.
• There are several barriers to OWE development in Ireland, including inter alia high capital costs, the non-availability of debt finance, uncertainties regarding the future structure of the Irish electricity market and the anticipated inability of the transmission system to accommodate increased levels of intermittent generation. All of the existing OWE projects in other jurisdictions have benefited from one or more forms of Government support to help them to overcome various barriers, including barriers similar to some of those that might be experienced in Ireland. Therefore, in the short term, it is unlikely that OWE will be deployed in Irish waters without some form of Government support.
• As Ireland is not currently a significant developer of core OWE technology, an Irish R&D programme should focus primarily on the integration of OWE into the Irish energy supply system. This could help to increase both the rate and overall level of
Page 4 of 76
OWE deployment achievable. It is important that Irish industry keeps abreast of developments in other jurisdictions and learns from experiences gained elsewhere.
• The cost of delivered energy from OWE projects is dependent on a number of factors including project capital cost, plant availability and O&M costs. In the absence of experience from operating projects in Irish waters there is uncertainty regarding appropriate values for these parameters in the Irish offshore environment. The level of uncertainty is intensified when considering smaller scale, demonstration projects that will not incorporate the economies of scale anticipated for larger projects.
• There are other costs associated with the deployment of large-scale wind generation plant in Ireland and /or off its coast, including inter alia the reinforcement of the transmission system and the provision of adequate spinning reserve.
• Demonstration programmes can be implemented for a variety of reasons. The most important objective of an Irish OWE demonstration programme should be to provide a learning experience for key players in the sector and to increase their levels of confidence in OWE. This could help to overcome some of the barriers to development and to stimulate the wider deployment of OWE.
• However, demonstration will not deliver large-scale levels of deployment unless OWE generation can earn a premium price over a long term. In the absence of a realisable market value for the environmental benefit of green generation, a market mechanism to provide a premium price for OWE generation will be required to make projects viable and promote development beyond the demonstration phase.
• The demonstration projects themselves will also require a mechanism to provide a premium price for electricity sales. Grant support would reduce the investment cost to the developer and lower the breakeven energy price required for projects. We have calculated the costs to the State of providing different levels of capital grant and AER-type support mechanism for a range of demonstration project sizes and costs.
• In other jurisdictions, the current trend is towards demonstration projects in the 60 MW to 150 MW range. There is little consensus within the sector in Ireland as to an appropriate size for demonstration projects, except that most developers would favour larger demonstration projects.
• A demonstration programme based on ~5 MW project(s) would be too small to either develop sufficient marketplace confidence or incorporate economies of scale. There could be limited opportunities for demonstration of novel technologies via projects of this scale.
• One or more demonstration project(s) of either ~25 MW or ~50 MW would help to increase marketplace confidence in the sector and would act as useful learning experience prior to larger scale deployment. The projects should incorporate proven technology elements – demonstrations of this scale would not be appropriate for new technology demonstration. Many developers believe that 25 MW projects would not be viable due to their small scale – some believe that 100 MW or even 200 MW are appropriate scales for the first projects in Ireland. However,

Page 5 of 76
indications are that banks would be uncomfortable with the level of risk associated with the early development of larger projects. They would favour first projects of the 25 MW scale.
• Depending on the design, scale and performance of demonstration projects, indicative direct benefits accruing from the capacity installed would be 2,400 tonnes of avoided CO2 per annum and €100,000 of avoided fuel imports per annum for each MW installed. The cost to the State would be highly dependent on the scale of project and the structure of support provided. It is likely that the cost per MW for 25 MW would be higher than that for 50 MW. We have prepared estimates of indicative costs for different options.
• In the short term, the large scale deployment of OWE in Ireland would require a State funded mechanism to provide a premium price for generation. Based on the investment cost reported for the latest OWE development in Denmark, the indicative cost per annum to the State of providing AER type support for 500 MW of OWE in Ireland would be €81.4 m. This would avoid 1.2 million tonnes of CO2 emissions per annum at a cost of €26 per tonne on an NPV basis. This level of deployment would earn the State €5.8 m per annum in royalties and avoid the annual importation of €51.3 m of fuel oil (40,000 tonnes).
• Enhanced interconnection of European transmission systems is a stated objective of the European Commission. It is likely that increased levels of interconnection between the Irish and neighbouring transmission systems would benefit OWE development in Ireland. It could provide an opportunity for Ireland to develop its OWE resource as a significant export industry selling Renewable Energy into European markets in the medium to long term. However, there could be significant costs associated with exporting OWE, including the costs of interconnection and grid reinforcement.
• The long-term success of Renewable Energy (RE) technologies, including OWE, is dependent on how the full external costs of generation are internalised, i.e. how the environmental benefit is valued. There is currently great uncertainty in assigning monetary values to the environmental benefits of RE. Future international trading arrangements for green certificates and allocation mechanisms for emissions savings benefits have yet to be developed.

Page 6 of 76
TABLE OF CONTENTS
EXECUTIVE SUMMARY ..................................................................................................3
1.0 INTRODUCTION...................................................................................................8
2.0 STATUS OF OFFSHORE WIND ENERGY.............................................................9
2.1 EXPERIENCE TO DATE.............................................................................................................................9 2.2 BARRIERS TO DEPLOYMENT...............................................................................................................11
3.0 COSTS & BENEFITS TO THE STATE .................................................................14
3.1 OVERVIEW..............................................................................................................................................14 3.2 COSTS TO THE STATE ...........................................................................................................................14 3.3 BENEFITS TO THE STATE ......................................................................................................................15 3.4 OTHER IMPACTS OF FULL SCALE OWE DEPLOYMENT...............................................................18
4.0 SUPPORT FOR RESEARCH AND DEVELOPMENT............................................23
4.1 OVERVIEW..............................................................................................................................................23 4.2 COSTS .....................................................................................................................................................23 4.3 BENEFITS ................................................................................................................................................23
5.0 SUPPORT FOR A DEMONSTRATION PROGRAMME .......................................25
5.1 DEMONSTRATION PROGRAMME PARAMETERS .............................................................................25 5.2 POTENTIAL OBJECTIVES OF AN IRISH OWE DEMONSTRATION PROGRAMME .......................27 5.3 SMALL SCALE DEMONSTRATION PROJECT(S)...............................................................................29 5.4 MEDIUM SCALE DEMONSTRATION PROJECT(S) ...........................................................................32 5.5 LARGE SCALE DEMONSTRATION PROJECT(S) ...............................................................................35 5.6 SUMMARY OF DEMONSTRATION OPTIONS....................................................................................37
6.0 SUPPORT FOR FULL SCALE PROJECTS............................................................42
6.1 FUNDING MECHANISM.......................................................................................................................42 6.2 COSTS & BENEFITS...............................................................................................................................42
7.0 CONCLUSIONS & RECOMMENDATIONS........................................................46
7.1 RESEARCH & DEVELOPMENT.............................................................................................................46 7.2 DEMONSTRATION ................................................................................................................................47 7.3 FULL SCALE DEPLOYMENT................................................................................................................48
Page 7 of 76
ANNEX A1 - ABBREVIATIONS ......................................................................................50
ANNEX A2 – LIST OF EXISTING OWE PROJECTS........................................................51
ANNEX A3 - COST OF OWE ...........................................................................................52
OVERVIEW..............................................................................................................................................................52 SITE ASSESSMENT.................................................................................................................................................53 TURBINES ...............................................................................................................................................................53 FOUNDATIONS .....................................................................................................................................................54 GRID CONNECTION .............................................................................................................................................54 CONSTRUCTION AND INSTALLATION ..............................................................................................................55 OPERATION AND MAINTENANCE ....................................................................................................................56
ANNEX A4 – AREAS FOR R&D ACTIVITY .....................................................................57
ANNEX A5 – TECHNO-ECONOMIC ANALYSIS............................................................58
ASSUMPTIONS USED IN THE ANALYSIS ...........................................................................................................58 SAMPLE TECHNO-ECONOMIC CALCULATION...............................................................................................59
ANNEX A6 – INDICATIVE DIRECT COSTS & BENEFITS OF OWE DEMONSTRATION PROJECTS.......................................................................................................................61
5 MW DEMONSTRATION PROJECT(S)............................................................................................................61 25 MW DEMONSTRATION PROJECT(S) .........................................................................................................64 50 MW DEMONSTRATION PROJECT(S) .........................................................................................................67 60 MW DEMONSTRATION PROJECT(S) .........................................................................................................70 100 MW DEMONSTRATION PROJECT(S) ......................................................................................................73 200 MW DEMONSTRATION PROJECT(S) ......................................................................................................76
Page 8 of 76
1.0 Introduction
This report was prepared by Byrne Ó Cléirigh for the Sustainable Energy Authority of Ireland and it covers a comparative assessment of the costs and benefits to the State of a number of support options for Offshore Wind Energy (OWE) in Irish waters.
The objective of the study is to assist the Irish Government and its advisors in deciding on the viability of committing State resources to supporting the development of OWE through:
• A research and development programme;
• A demonstration programme;
• A full-scale deployment programme.
Byrne Ó Cléirigh were requested by the Sustainable Energy Authority of Ireland to focus primarily on the demonstration programme support option and to assess the costs and benefits associated with demonstration projects of three indicative scales, viz.: ~5 MW, ~25 MW and ~50 MW.

Page 9 of 76
2.0 Status of Offshore Wind Energy
2.1 Experience to Date
2.1.1 Technology Overview
Offshore Wind Energy (OWE) has been under development since the early 1990s. Most of the early projects were relatively small in scale and located in shallow or sheltered waters. A full list of projects is set out in Annex A2. The main advantages of OWE include, inter alia:
• Economies of scale;
• Superior wind resource at sea1;
• Reduction in perceived impact on visual amenity;
• Less difficulty in securing planning approval.
OWE technology is less well developed than the onshore equivalent. The turbine technology is an adaptation of onshore systems and the machines are conceptually similar. The principle differences from onshore systems are the size, the foundations, the installation techniques for both foundations and turbines, the increased importance of reliability and the accessibility of the machines in the extreme offshore conditions. OWE technology elements are described in more detail in Annex A3.
The costs associated with OWE developments vary considerably between different projects. In particular the foundation, installation and grid connection costs are highly site specific.
2.1.2 International Developments
At the end of 2001, there were eight OWE projects installed worldwide with a combined installed capacity of approximately 80 MW. The projects are located in Denmark, Sweden, Netherlands and UK. Several are constructed in shallow-water, sheltered sites. The following are some milestone projects:
• The first OWE project was constructed at Vindeby, Denmark in 1991 (4.95 MW).
1 Compared with some other countries that have deployed wind energy onshore, Ireland has a particularly good onshore wind resource. Consequently, while superior resource levels do exist off the Irish Coast, the potential percentage gains in resource levels offshore may not be as significant as in some other jurisdictions; Germany for example.

Page 10 of 76
• Blyth Offshore (UK, 2000) was the first project built in a “truly offshore”2 environment. All of the other existing installations, with the exception of Horns Rev (see below), have been constructed in locations with environmental conditions that are not typical of those that might be expected at the sites being considered by Irish developers.
• The only project greater than ~10 MW is Middelgrunden (DK, 2001) with an installed capacity of 40 MW.
• The Horns Rev project is currently under construction off the West Coast of Denmark. It will have an installed capacity of 160 MW.
A full list of projects is set out in Annex A2. There are plans to develop large-scale projects (hundreds of MW) in the coastal waters of these pioneering countries and also in Belgium, Germany and Ireland.
2.1.3 Irish Developments
Ireland is particularly well suited to the development of OWE because of a very favourable wind resource available in relatively shallow waters and in the vicinity of both load centres and the transmission network. One estimate3 of the practical OWE resource around the island of Ireland is 19.5 TWh per annum (based on 4 x 3 MW per km2 in up to 20 m water depth at least 5 km from the shore). This estimate has not been reduced “by restrictions imposed due to environmental impacts, competing resources and grid capacity4”.
As yet there are no developments in Irish waters although a number of consortia have proposed projects with a total installed capacity of greater than 2,000 MW. The proposed developments are on a significantly larger scale than either existing onshore developments in Ireland or commissioned OWE developments elsewhere. They are almost exclusively located along Ireland’s East Coast.
2 Offshore Wind Energy - Ready to Power a Sustainable Europe, Concerted Action on Offshore Wind in Europe, 2001
3 Assessment of Offshore Wind Energy Resources in the Republic of Ireland and Northern Ireland, Department of Public Enterprise / Department of Enterprise Trade and Investment (NI), 2000.
4 This level of resource is very high compared to the total electricity demand, which in 1999 was 21.1 TWh for the Republic of Ireland. Due to a variety of important technical constraints, the current Irish electrical network could not accommodate this magnitude of OWE generation on the system (see section 2.2.2).

Page 11 of 76
2.2 Barriers to Deployment
2.2.1 Investment Costs
The investment costs associated with OWE development are greater than those for onshore projects. Whether OWE can be commercially viable in Ireland depends on whether sufficient project income can be generated. This depends on whether the energy produced can be sold in the liberalised market at a ‘reasonable rate’ and how the environmental benefit is valued. Experience from developments in other European jurisdictions suggests that OWE is not commercially viable at present without some form of support mechanism.
The investment costs are typically 30 % to 70 % greater than those for onshore projects. The additional costs are primarily associated with foundations and electrical (grid) connection but also with installation and with the marinisation of turbines. Costs can be highly site and scale dependent.
The DPE / DETI Assessment of Offshore Wind Energy Resources includes an indicative cost range of €1,420 / kW to €2,050 / kW. The investment cost of the 160 MW Horns Rev project, currently under construction in Danish waters is in the region of €1,690 / kW. Other indicative values for investment costs and a discussion on the factors influencing these costs are set out in Annex A3.
2.2.2 Technical Constraints
Notwithstanding the fact that there are several OWE projects operating successfully throughout Europe, there are a number of technical factors that are currently constraining development in Ireland. These include, inter alia:
• The overall capacity of the transmission system to accommodate intermittent generation is constrained. Estimates vary as to the actual limit to wind energy capacity with current grid infrastructure under different operating conditions. However, it is widely accepted that without significant investment in grid infrastructure the total planned OWE capacity proposed at those sites for which foreshore licences have been granted could not be accommodated. CER and OFREG have commissioned a study5 in this area, which will include an assessment of “the economic costs and benefits of accommodating increased wind generation”. The study will help the industry to better understand the degree to which grid infrastructural constraints could limit future rates and levels of OWE deployment.
• There are only a limited number of nodes at which significant amounts of generation (either wind or fossil) can be connected to the current transmission system.
5 Garrad Hassan, ESBI, University College Cork, Study into the Impacts of Increased Levels of Wind Penetration on the Irish Electricity Systems (Republic of Ireland and Northern Ireland).
Page 12 of 76
• The Transmission System Operator (TSO) and project developers have only very limited experience to date in connecting large-scale intermittent generation assets to the transmission system.
• The TSO has a number of concerns about the electrical interaction between OWE developments and the transmission system, including the fault ride through capabilities of proposed developments and the requirements for spinning reserve on the network.
• Some technology elements being considered for use in Irish OWE developments are less well proven than others. For instance, large turbines, offshore substations, HVDC connections and some foundation technologies are all still being developed and optimised for use in this sector (see Annex A3). The incorporation of less well-proven technology elements into OWE projects could result in increased technical risk and cost burden and could adversely affect plant performance and reduce return on investment.
• As well as the technology risk, there are two important areas of uncertainty with regard to OWE plant load factor. The first concern is how the actual wind resource across an array of turbines on a site compares with that determined through mast measurements and simulation / prediction. The second factor is access to the plant in different weather conditions and the degree to which foul weather could restrict O&M activities and therefore reduce plant availability.
2.2.3 Market Factors
There are a number of obstacles to development associated with the current size and structure of the Irish electricity market. Many of these obstacles apply equally to conventional, fossil-fired generation.
• The Irish electricity market is small and has low levels of interconnection. The development of one full-scale commercial OWE plant could represent ~10% of the peak demand and could have a significant impact on the generation and supply markets.
• The current bilateral contracts market is dominated by supply companies who are unwilling to purchase output from generators through long-term off-take contracts. In the absence of long-term contracts or a guaranteed floor price, providers of non-recourse project finance are unwilling to finance generation assets. This applies to fossil-fired generation as well as OWE.
• There will be a review of the trading arrangements in early 2004, in advance of full market opening in 2005. As a result, there is currently a high degree of uncertainty regarding future trading arrangements in the market. This raises the level of risk associated with large-scale generation projects.
• The long-term success of Renewable Energy (RE) technologies, including OWE, is dependent on how the full external costs of the generation sector are internalised, i.e. how the environmental benefit is valued. There is currently great uncertainty in assigning monetary values to the environmental benefits of RE. Future

Page 13 of 76
international trading arrangements for green certificates and allocation mechanisms for emissions savings benefits have yet to be developed.
2.2.4 Availability of Debt Finance
Typically, banks in the Irish market are willing to provide finance for between 60 and 80 % of the development costs of Onshore Wind projects. Within this range, the higher levels of debt finance are provided to projects with AER contracts. Finance is generally provided on a shorter term than the AER contract.
As a result of the constraints set out in sections 2.2.1 to 2.2.3 and other factors such as questions over the insurability of OWE projects, financial institutions are currently of the view that the level of risk associated with providing corresponding levels of debt finance for OWE projects is too high. To date, no bank has committed to financing an OWE in Ireland.
Page 14 of 76
3.0 Costs & Benefits to the State
3.1 Overview
In assessing the costs and benefits associated with supporting OWE, our exclusive focus has been on the relevant costs and benefits to the State. Where possible, we have quantified the direct costs for different support options in terms of levels of expenditure6.
The primary direct benefit accruing to the State from supporting OWE will be contributions to the achievement of the various RE and Greenhouse Gas (GHG) Emissions targets. Therefore, we have quantified the benefits of different support options by estimating the CO2 reductions attributable to them.
3.2 Costs to the State
3.2.1 Direct Costs
Experience from OWE developments in other European jurisdictions suggests that OWE is not commercially viable without some form of support mechanism from government. It is very unlikely that an OWE industry will develop in Ireland in the short to medium term without Government support.
Estimated costs to the State of providing different levels and combinations of financial support to the OWE industry are set out in sections 5.0 and 6.0.
In the medium to long term, if a workable market mechanism is developed whereby operators of green generation assets could realise economic incentives for their contribution to sustainable energy supply then the economics of OWE development could be viable without the need for direct Government support.
3.2.2 Other Costs
The main capital and O&M costs of OWE projects developed in Ireland would be borne by the developers and their backers. However, there could be other significant capital and operational costs associated with OWE projects, which, under the current market structure, would be borne by all users of the Irish transmission system via the Transmission Use of System (TUoS) charges. Relevant costs could include the deep reinforcement of the transmission system and the provision of ‘ancillary services’, including inter alia the provision of significant amounts of spinning reserve for large capacity OWE plants. These costs could also apply to large-scale Onshore Wind Energy developments. TUoS charges are ultimately passed on to final electricity customers.
6 The results of this analysis are useful for comparing the relative costs and benefits of different funding options. However, the absolute figures are indicative only due to the uncertainty associated with several of the inputs, notably OWE project capital costs.

Page 15 of 76
3.3 Benefits to the State
3.3.1 Emissions Savings Targets
In accordance with the Kyoto Protocol and the subsequent EU burden sharing agreement Ireland is committed to limiting its increase in GHG emissions by 13 % above its 1990 emissions levels by the period 2008 – 2012.
The electricity generation sector in Ireland is heavily dependent on four fossil fuels viz.: peat, coal, oil and natural gas. They all emit different quantities of CO2 per unit of electricity generated7. Furthermore, demand for energy has increased significantly in Ireland during the recent period of unprecedented economic growth. As a result, meeting the country’s 2008 – 2012 national targets on GHG emissions is going to pose serious challenges to several sectors in Ireland, including energy supply. It is widely expected that there will be financial penalties for non-compliance and the 2008 – 2012 targets will almost certainly be followed by more severe limits post 2012.
Wind turbines generate no CO2 in the energy conversion process. Furthermore, relatively little energy is required for the manufacture, maintenance and scrapping of a wind power plant, so OWE has very low lifetime CO2 emissions per unit of electricity generated. The Danish Wind Industry Association estimated that for moderate wind onshore sites in Denmark, a wind turbine will recover all of the energy consumed in its manufacture, installation and maintenance in less than three months operation.
Given the significant resource available in Irish waters, the large scale deployment of OWE could contribute significantly to achieving the 2008 – 2012 and the post 2012 GHG emissions targets.
The actual quantity of CO2 emissions avoided per MW of OWE installed is dependent on a number of factors including wind resource, plant performance and the profile of generation that is displaced from the system. Estimated savings for different levels of deployment are included in sections 5.0 and 6.0.
OWE also has the potential to offer reductions in NOX and SOX, neither of which are generated during the energy conversion process.
3.3.2 Renewable Energy Targets
In addition to Ireland’s emissions targets there are two relevant Renewable Energy targets set out in:
• 1999 Green Paper on Sustainable Energy;
• EC Directive 2001/77/EC on Renewable Energy.
7 The energy supply sector contributed 32 % of Ireland’s CO2 emissions and 21.6 % of the basket of the three main greenhouse gases in 1990 - National Climate Change Strategy – Ireland, 2000.
Page 16 of 76
The Green Paper sets out a target of an additional 500 MW of electricity generation capacity from RE sources in the period 2000 - 2005. Onshore Wind Energy is best placed among RE technologies to meet this target.
To meet the targets in the Renewable Energy directive, Ireland will have to generate 13.2 % of its electricity from renewable sources by 2010. It is unlikely that this target will be met with Onshore Wind generation alone8. Furthermore, there is only very limited potential for additional Hydro generation in Ireland and it is doubtful if large-scale Biomass generation will be sufficiently viable to contribute on a significant scale within this timeframe. Therefore, OWE could have an important role in helping Ireland meet its obligations under this directive.
3.3.3 Integrated Pollution Prevention and Control (IPPC) Directive
By 2007, existing power plants in Ireland will be obliged to have an Integrated Pollution Prevention and Control (IPPC) Licence in accordance with the IPPC Directive9. This will require generation stations to move towards Best Available Technology (BAT). The associated limits on NOX and SOX emissions could force the closure for older, more polluting fossil-fired stations. It is also possible that GHG emissions could be licensed under IPPC regulations10.
The development of OWE in Ireland could help the Irish electricity generation sector meet the requirements of this legislation.
3.3.4 Royalties for Use of the Foreshore
Royalties are payable by an OWE developer to Government in accordance with the conditions set out in the relevant foreshore lease. The royalty payments specified in the only lease granted to date for an OWE development11 are:
• €3,800 per MW of installed capacity, and;
8 There are a number of important constraints to Onshore Wind development in Ireland that are likely to lead to increasing interest in Renewable Energy projects other than Onshore Wind in the medium to long terms. These constraints include inter alia higher development costs at less favourable sites, local characteristics of the grid infrastructure and difficulties in securing planning permissions for both turbines and electrical connection assets. These constraints are not accounted for in some of the higher-valued published estimates for Onshore Wind resource in Ireland.
9 EC Directive 96/61/EC. This directive has yet to be transposed into Irish legislation.
10 Proposal for a Directive of the European Parliament and of the Council Establishing a Scheme for Greenhouse Gas Emission Allowance Trading within the Community and Amending Council Directive 96/61/EC, 2001
11 Foreshore Lease granted by the Minister for the Marine and Natural Resources to Sure Partners Limited in January 2002.
Page 17 of 76
• 2.5 % of revenue generated.
The per MW element of the royalty will be adjusted in accordance with the Best New Entrant price published by the CER.
3.3.5 Avoided Fuel Imports
In the short to medium term any OWE developments in Irish waters will most likely displace fossil fuel imports, which should enhance Ireland’s balance of payments.
3.3.6 Competition in the Electricity Sector
According to a recent study commissioned by the CER12, the domination of the electricity generation sector by the incumbent generator contributes to reducing “the attractiveness of the Irish market from both an investor’s and financier’s point of view”. The development of significant OWE capacity in Ireland would almost certainly increase the number of players with significant generation assets in the market. However, depending on the future structure of brown and green electricity market(s), the deployment of OWE plant alone may or may not directly enhance the level of competition in the generation sector.
3.3.7 Taxation Revenue
In addition to the royalties payable for use of the foreshore, taxation revenues to the State would be affected in a number of ways if OWE capacity was developed, including:
• Corporation tax from project developers and VAT from OWE sales. If OWE displaced existing generation, then there would be lost corporation tax and VAT revenue from the displaced generation.
• Increased tax take from enterprises providing goods and services to the sector.
3.3.8 Industrial Development
Opportunities for industrial development would accompany the deployment of OWE in Irish waters. The main areas include:
• Project development;
• Civil engineering and installation;
12 Issues Facing Those Considering Investing in the Irish Electricity Market, NCB Corporate Finance

Page 18 of 76
• Design and manufacture of equipment;
• Operation, maintenance and services.
Patterns of employment resulting from investment in RE are difficult to quantify and are functions of backward linkages in the local and national economies. One source13 states that 4.5 full time jobs are created per MW of installed capacity. This figure accounts for manufacture, project design and operation & maintenance.
An important consideration is the location of the employment. It is conceivable that both Ireland and Britain could develop significant installed capacities of OWE in the Irish Sea. In this event it is unlikely that employment creation would be split on a per MW basis on either side of the Irish Sea. O&M services and / or turbine manufacture14 for the entire Irish Sea could be located in either jurisdiction.
The number of jobs created per MW installed in Ireland will depend to a certain extent on the size and rate of development of the Irish market. For instance, it is doubtful that there would be as many as 4.5 jobs created per MW installed if development was limited to one or two small-scale demonstration projects.
3.3.9 Fuel Diversity
The development of OWE capacity in Ireland would increase the fuel diversity of the Irish electricity sector. This could be especially significant if Moneypoint is re-powered with natural gas as is indicated in the Government’s National Climate Change Strategy - Ireland.
3.3.10 Sustainability
The displacement of conventional fossil-fired generation with OWE capacity would increase the sustainability in the use of energy resources.
3.4 Other Impacts of Full Scale OWE Deployment
3.4.1 OWE Displacement of other RE Technologies
Summary
In deploying OWE, there is a risk that other RE technologies could be displaced instead of fossil generation. It is important that Government incentives should be carefully weighted to promote different technologies that will deliver environmental benefits at least cost over different timescales.
13 Offshore Wind Energy – Building a New Industry for Britain, Border Wind / Greenpeace
14 Industry sources have estimated that an annual demand of one hundred turbines would be sufficient to warrant investment in a local turbine assembly plant.

Page 19 of 76
A future sustainable energy supply system in Ireland will incorporate different complimentary technologies. Three RE technologies that can play important roles in helping Ireland meet its international GHG commitments are Onshore Wind Energy, Offshore Wind Energy and Biomass. While the deployment of these technologies will overlap over time, it is likely that their large-scale deployment will peak in the short term (up to 2005), medium term (2005 to 2010) and long term (post 2010) respectively for Onshore, Offshore and Biomass.
They are complimentary technologies. Onshore Wind Energy is currently the most economically viable and it acts as a useful demonstration for technologies and techniques that will eventually be implemented offshore. OWE offers the potential of large-scale deployment and Biomass has the benefit of being a fully dispatchable source of RE generation.
Onshore Wind
At the end of 2001, there was about 125 MW of installed capacity in Ireland. Given the current status of Wind Energy technologies and of the proposed projects in Ireland / Ireland’s waters, land based Wind Energy will play a more significant role in helping to meet Ireland’s targets in the short term (2005). Estimates of the remaining practicable Onshore Wind Energy resource vary widely but even the lower predictions are in the region of 700 to 800 MW15.
The costs of Onshore Wind Energy development have decreased significantly over the last decade. Today, capital costs in Ireland are typically between €900 / kW and €1,100 /kW. The cost of delivered energy, which depends mainly on capital costs and wind speeds, is in the region of 4 to 6 c/kWh.
As more Onshore Wind capacity is added, it is expected that the sites with better wind resource and grid connection characteristics will be used first. While decreasing technology costs will help to drive down the cost of delivered energy from future onshore developments, less favourable wind resources and / or poorer grid conditions at the remaining ‘second tier’ sites will have the opposite effect. There will likely come a stage in the industry’s development when the cost of energy delivered from new onshore projects in Ireland will begin to increase and, in the absence of a realisable market value for the environmental benefits, additional support above the level currently provided by Government will be required for deployment to continue. However, the cost of delivered energy from, and the levels of price support required for, these additional onshore sites may still be less than the corresponding values for offshore sites.
This argument assumes that other constraints, such as securing planning approval, do not overly restrict onshore development. An important question is how much
15 Higher estimates for practicable onshore resource include the 2,000 MW in the Sustainable Energy Authority of Ireland’s Renewable Energy Research, Development and Demonstration Programme Strategy.
Page 20 of 76
additional onshore capacity can be delivered in the short to medium term at lower cost to the State than OWE capacity.
In the medium to long term (post 2005), OWE will play a more significant role in meeting Ireland’s RE and GHG emissions targets.
Biomass
In the longer term there is considerable potential for Biomass fired generation in Ireland. It is likely that significant rates of deployment will not be achieved until after 2010. Biomass technology has a number of advantages over wind energy including fuel storability and an ability to directly meet heat as well as electrical demands. Being fully dipatchable, Biomass can compliment Wind Energy within a portfolio of RE generation assets by being brought on line when wind availability is low and vice versa.
3.4.2 Requirement for Interconnection
The full scale OWE projects being proposed by developers in Irish water are of a very large scale compared to Ireland’s installed generation capacity. The estimated project capacities change over time as developers consider the installation of larger turbines at each proposed foundation location. Projects in the range of 500 MW to 1,500 MW are being currently considered.
It is uncertain what level of installed wind energy capacity can be accommodated on the Irish transmission system. However, if large capacities of OWE are to be developed in Irish waters, then it is almost certain that increased levels of interconnection with other transmission systems will be necessary.
Several of the parties involved in East Coast OWE developments are evaluating their projects in the context of East-West interconnection between Ireland and Wales. According to a recent CER publication16, there would be several advantages associated with interconnection with Britain including increased market liquidity, reduced electricity prices and enhanced opportunities for wind power. The European Commission has indicated17 that increased levels of interconnection will be required to improve the levels of competition and security of supply in the electricity sector within the EU.
16 Issues Facing Those Considering Investing in the Irish Electricity Market, NCB Corporate Finance
17 Proposal for a European Parliament and Council Decision Amending Decision No 1254/96/EC Laying Down a Series of Guidelines for Trans-European Energy Networks, 2001.
Page 21 of 76
3.4.3 Exporting OWE
It is likely that the large-scale development of Ireland’s OWE resource would only be possible within a European market to which Ireland is well integrated both in terms of physical connections and market rules. In the longer term, the development of suitable transmission assets could provide opportunities for Ireland to exploit its large offshore wind resources by developing OWE as an export industry. Exporting OWE could deliver significant benefits to the State such as increased contributions to the balance of payments, to taxation revenues and to industrial development.
However, exporting OWE could also impose additional costs upon the State, including those outlined below.
• The installation of transmission interconnection infrastructure between Ireland and other jurisdiction(s) would be require significant levels of capital expenditure. There would be important questions to be resolved with respect to the financing arrangements for, and the ownership of, such interconnector(s).
• The deep reinforcement of the transmission system and the provision of ‘ancillary services’ (see section 3.2.2).
• Generation from OWE plants developed and / or operated with the benefit of either direct support from the Irish Government or shared costs with other Irish transmission system users (via TUoS charges) could potentially contribute to other countries’ Renewable Energy and GHG emissions targets / commitments rather than Ireland’s18.
In the shorter term and in the absence of significant interconnection with other jurisdictions, there is interest among some players in the Irish RE sector in green certificate trading as one mechanism to deliver additional revenues from OWE generation. If a suitable European market existed for the ‘green’ element of RE generated in Ireland, an economic return could be gained for the environmental benefit of each unit of electricity and the requirement for a State funded premium price could be diminished.
However, there would be both market and political risk associated with developing OWE projects reliant on future sales of tradable green certificates for revenue. It is likely that financial institutions would be much less willing to provide non-recourse debt finance under these conditions than if there were long term power purchase agreements (PPAs) in place.
As discussed in section 2.2.3, there is currently great uncertainty as to the monetary value of the environmental benefits of RE. International trading arrangements for green certificates and allocation mechanisms for emissions savings benefits have yet to be developed. It is not expected that a fully pan-European solution will be in place for a number of years because of the different policies and mechanisms in place in
18 Appropriate conditions could be attached to the provision of funding to overcome this. For instance, developers in receipt of Britain’s capital grant support for OWE must make the output from their projects available to British electricity suppliers for a minimum of ten years to help the latter fulfill their Renewables Obligations.

Page 22 of 76
different member states and the reluctance to embrace tax harmonisation across the EU.
The merits and demerits of putting in place reciprocal agreements allowing Irish RE developers to trade the ‘green’ value of their generation in the evolving national certificate markets in Britain and in some continental European countries should be assessed, as should the early harmonization of EU RE markets. Such an assessment should also evaluate the potential costs to the State associated with international green certificate trading, including the possible implications for TUoS charges and for the eligibility of GHG savings for national statistics (as discussed above).

Page 23 of 76
4.0 Support for Research and Development
4.1 Overview
In most cases, the deployment of RE technologies in Ireland involves the transfer of core technologies developed in other countries. In the short term, this is likely to remain true for OWE, although there may be a limited number of niche opportunities for technology development in Ireland. The focus of OWE research and development (R&D) in Ireland is likely to be on the integration of OWE into Ireland rather than on core technology development. This could help to overcome various constraints to OWE deployment in the short, medium and long terms.
A list of fields of activity in which additional R&D effort could benefit an OWE industry in Ireland is set out in Annex A419. These fields include environmental assessment, grid integration, transmission system interconnection, energy storage, wind forecasting and deep-water support structure technology.
4.2 Costs
Overall, the costs associated with the funding of an OWE R&D programme would be relatively modest compared with those associated with the provision of grant aid or PPAs for demonstration and / or full scale OWE projects. In the immediate term, appropriate projects could be funded through the Sustainable Energy Authority of Ireland’s €16.25 million Renewable Energy Research, Development and Demonstration Programme. The justification of State expenditure on R&D activity in this sector would be best determined on a project-by-project basis.
4.3 Benefits
The primary benefits to the State from the provision of Government support for research and development would be expected to accrue through an accelerated rate of OWE deployment in the short term and an increased overall level of deployment in the medium to long term.
It is difficult to quantify the results of R&D activity in terms of future MWs installed or emissions saved. However, in the short term R&D in fields such as Environmental Impact Assessment and OWE investment cost analysis could help to accelerate the rate of deployment by developing a fuller understanding of OWE projects among key stakeholders in the industry.
There are certain OWE component technologies that are being developed internationally and which could deliver investment cost reductions to Irish developers in the short and medium terms. In order to best reap the benefits of technology
19 This is not a definitive list of recommended R&D actions in this field.

Page 24 of 76
development elsewhere, State funded R&D could focus on the integration of appropriate technologies into Irish OWE developments.
As discussed in sections 2.2.2 and 3.4.2, the technical characteristics of the transmission system are likely to constrain the levels of OWE that can be connected in Ireland in the medium to long term. An Irish R&D effort in developing and assimilating appropriate technologies and techniques for the improved integration of large amounts of wind energy would help to increase the overall levels of OWE deployment achievable in Irish waters. Examples of relevant technologies include transmission system interconnection, wind forecasting, turbine control systems and energy storage. In the medium to long term, the development of technologies to deploy OWE in more extreme environments, such as in deeper water and in areas with more severe wind / wave loading, would also help to increase the overall levels of deployment achievable.
In addition to the potential benefits of increased rates and magnitude of deployment, the provision of state funding for R&D would result in modest levels of direct job creation in the R&D sector and indirect employment through the longer term development of an OWE industry in Ireland.
In the longer term, R&D into OWE technology could lead to some limited technology transfers to other ocean energy conversion technologies such as wave and tidal stream. These are currently less mature technologies than OWE but could be deployed in the future to exploit the significant energy resources that exist off Ireland’s coasts.
Page 25 of 76
5.0 Support for a Demonstration Programme
5.1 Demonstration Programme Parameters
5.1.1 Overview
There is a demonstration element to virtually all of the OWE capacity installed to date. All of the projects have benefited from various types and levels of Government backing. This is still the case for current developments throughout Europe and is exemplified by the in progress construction of the 160 MW project at Horns Rev as part of Danish demonstration programme20 and the British government’s ~€80 million Capital Grant Scheme for Offshore Wind.
One of the stated objectives of the latter is to “provide a learning experience which can improve confidence and help reduce future costs”21. The primary objective of an Irish OWE demonstration programme would also be to increase marketplace confidence in the sector, rather than to demonstrate new or unproven OWE technologies.
5.1.2 Scale
As requested by the Sustainable Energy Authority of Ireland, we have examined the costs and benefits associated with demonstration programmes based on projects of three indicative scales, viz.:
• Small - ~5 MW;
• Medium - ~25 MW;
• Large - =50 MW.
5.1.3 Funding Mechanisms
Our assessment has focussed on two potential funding mechanisms available to the State to support an OWE demonstration programme. They are:
• Capital grant support for projects. Our calculations for costs to the State of providing grant support are based on the funding levels for demonstration projects published in the Sustainable Energy Authority of Ireland’s Renewable Energy Research, Development and Demonstration Programme, viz.: 10 to 25 % of development cost.
20 In 2002, the Danish OWE demonstration programme was scaled down from an additional 750 MW by 2005 to an additional ~320 MW (two projects) in the same period.
21 Capital Grant Scheme for Offshore Wind – Guidance Notes, DTI, 2001.
Page 26 of 76
• Market price support mechanism to guarantee energy price – the provision of long term, State guaranteed PPAs.22.
It is very doubtful that demonstration scale projects in Irish waters would be economically viable with capital grant support alone. In Denmark, Netherlands and the UK, various forms of capital grant support for OWE are backed up with market mechanisms that provide premium prices for the electricity generated from RE. Such mechanisms are likely to be required in Ireland too.
5.1.4 Number of Projects
The number of projects selected for inclusion in a demonstration programme should be based on the objectives of the programme, wider Government policy objectives, budget and relevant national and EU competition law.
There is no set number of projects required to deliver increased levels of marketplace confidence in the sector. In general, the greater the number of projects demonstrated, the better the uptake of knowledge and experience across the sector and the wider the variety of site project parameters demonstrated, e.g. water depth, foundation type, turbine type, distance from shore etc. The provision of support to more than one project would also stimulate the active involvement of more players in the sector in the shorter term. Most developers, the IWEA and the CER indicated that they would prefer if support were provided for more than one project.
It would be prudent to consider, at least in part, the stage of project development when awarding any demonstration funding to projects.
5.1.5 Length of Demonstration
Depending on the objectives of a demonstration programme, different lengths of period post construction would be appropriate to learn from the demonstration. Generally, longer periods would be required for projects involving the demonstration of unproven core technology. However, in the short term, this will not be the main reason for demonstration in Irish waters.
The most significant benefit to accrue from an Irish OWE demonstration programme would be increased levels of marketplace confidence in the sector (see section 5.2.1). In this context, shorter periods of demonstration could be sufficient prior to larger scale development.
There is significant opposition from developers in the sector to lengthy periods of demonstration in advance of the provision of support for full scale OWE projects.
22 It is beyond the scope of this study to assess different options for market mechanisms to support OWE. As requested by Sustainable Energy Authority of Ireland, we based our assessment on the indicative cost of using a market mechanism similar to the AER system.
Page 27 of 76
5.1.6 Assessment of Direct Costs & Benefits
We have assessed the relative costs and benefits to the State of stimulating OWE demonstration programmes of different scales in Irish waters by providing various combinations of support. Qualitative and quantitative23 costs and benefits are presented in sections 5.3 to 5.6. We determined the quantitative costs and benefits by conducting a techno-economic analysis of different support options, based on:
• 0 %, 10 % and 25 % grant support;
• 15 year PPAs;
• 8 % and 15 % discount rates;
• 38 % plant load factor;
• OWE displacing oil-fired generation from the system;
• Various OWE capital investment costs.
A complete set of inputs to this analysis and a sample calculation are set out in Annex A5. The results are expressed in terms of levels of expenditure and environmental savings. Additional quantitative results are set out in Annex A6.
5.2 Potential Objectives of an Irish OWE Demonstration Programme
The primary, long-term reason for Government to support an OWE demonstration programme should be the delivery of direct environmental benefits that will help Ireland meet its GHG emissions and RE targets. As these benefits will not be realised on a significant scale from the development of demonstration projects alone, the overall aim of a demonstration programme should be to stimulate the wider deployment of OWE on a larger scale. Notwithstanding this common overall aim, different demonstration programmes can have a number of different more immediate objectives, the most relevant of which are set out below. It is unlikely that a single demonstration programme would meet all of these objectives.
5.2.1 Improvement of Marketplace Confidence
Although the success of wind energy on land does provide some marketplace confidence, there remains uncertainty and risk associated with using wind energy technology in the marine environment. Successful demonstration project(s) would
23 The results of our analysis are useful for comparing the relative costs and benefits of different funding options. However, the absolute figures are indicative only due to the uncertainty associated with several of the inputs, notably project capital costs.

Page 28 of 76
enhance the confidence of several important players in the sector, including inter alia developers, banks, construction contractors, O&M contractors, technology manufacturers, the TSO and the Regulator. Some important areas where improved levels of confidence would be forthcoming and welcome are:
• Technology transfer. The degree to which OWE technology already proven / certified elsewhere can perform successfully in Irish conditions is important. The site conditions that can be expected at the locations being considered for OWE development in Ireland are not entirely consistent with those experienced at some of the sites developed in other jurisdictions. There could also be variation in the site conditions between the different sites in Irish waters, which could result in different technology options proposed at different locations; foundations are one example.
• Project financing arrangements.
• Insurability of projects, which is a concern of the banking industry.
• Contractual arrangements for the construction of OWE projects. If finance for OWE projects is to be provided on a non-recourse basis, lenders will be eager that contractual arrangements entered into by the special purpose company meet certain requirements. Of particular concern to banks is which party accepts the ‘site risk’ associated with the weather conditions during construction and with the consistency of seabed conditions during foundations installation. An important question is whether developers will be able to secure an engineering, procurement and construction (EPC) contract on a turnkey basis.
• Quality of the actual wind resource across an array of turbines on a site compared with that determined through mast measurements and simulation / prediction.
• Plant availability and contractual arrangements for O&M. The difficulty of accessing offshore turbines for both scheduled and unplanned maintenance is a key issue. The high cost of access and the potentially higher cost of lost revenue if access is not possible in inclement weather mean that the reliability of plant and the level of access guaranteed / realisable for both crew and equipment under O&M contracts are critical.
• Project management and co-ordination including mobilisation of crew and equipment.
• Construction techniques.
• Compliance with Grid Code. To date, there is relatively little experience with transmission connected wind farms onshore in Ireland. The ability of wind farms to comply the Grid Code is a significant concern of the TSO.
5.2.2 Evaluation of Environmental Impacts
Demonstration project(s) could provide an opportunity to compare the actual environmental impacts of OWE with those determined in the Environmental Impact

Page 29 of 76
Assessments24. This could help to alleviate the concerns of potential objectors to subsequent projects.
5.2.3 Demonstration of Project Economics
Demonstration projects could help the industry to improve its understanding of the economics of project development in Irish conditions and to realise cost reductions on future projects. However, the economies of scale associated with ‘full scale’ developments are likely to be absent from demonstration projects.
5.2.4 Demonstration of New / Unproven Technology
Demonstration projects could be developed to show that new / unproven technology can perform to certain standards over a set period of time under specific operating conditions. At present, Ireland is not a significant developer of core technology in the OWE sector. Therefore, in the short to medium term, OWE projects in Irish waters will almost certainly use technology that has been already proven elsewhere.
5.3 Small Scale Demonstration Project(s)
5.3.1 Scale
A small-scale project could have a capacity of ~5 MW and could consist of less than five turbines (probably two). The project(s) could be connected to the distribution system or, if considered as the first phase of a much larger development, to the transmission system.
Projects of this scale have been installed in other jurisdictions throughout Europe (see list of projects in Annex A2). However, the current trend is towards larger scale demonstration projects because it is believed that they will better meet the requirements of the industry at its current stage of development.
5.3.2 Costs
Some of the main justifications cited for the development of OWE are the economies of scale involved. In the absence of scale, the economics of developing a ~5 MW OWE project are not very attractive.
In accordance with a Government guidance on visual impact, all OWE projects should be at least 5 km from shore25. This constraint further exacerbates the economics of
24 OWE developers are required to conduct an Environmental Impact Assessment prior to their application for a Foreshore Lease.

Page 30 of 76
developing such a small project. There would be disproportionately high costs associated with a ~5 MW development because of:
• The high network connection costs. If a ~5 MW was connected at 110 kV26, as the first phase of a larger project, the connection cost could be of the order of €15 million to €25 million27. A distribution level connection would be cheaper but would still be very high given the distances from plant to shore.
• The high cost of mobilisation of equipment and personnel for the installation and construction of a relatively small project in an offshore environment.
• The costs of operating and maintaining a small number of generating units in an offshore environment more than 5 km from the shore.
Indicative costs to the State of providing capital grant and AER type PPA support for a 5 MW demonstration project are set out below.
Level of Grant Support
Cost of Capital Grant
PPA Price Required
Annual Cost of PPA
0 % Capital Grant €0 29.0 c/kWh €4.1 m
10 % Capital Grant €3 m 26.3 c/kWh €3.6 m
25 % Capital Grant €7.5 m 22.2 c/kWh €3.0 m
These figures are based on 15 % discount rate over 15 years and an OWE capital cost of €6,000 / kW, which is an IWEA estimate for the development costs of transmission connected 2-unit OWE project in Irish waters. Additional results for 8 % discount rate and for different potential values for capital cost are set out in Tables A6.1 to A6.3 in Annex A6. Due to the very small scale involved the potential investment costs for ~5 MW projects will be relatively high and could vary widely between different sites. The capital cost values evaluated in Annex A6 are:
• €2,050 / kW - upper value in DPE / DETI Assessment of Offshore Wind Energy Resources;
• €6,000 / kW and €10,000 / kW - IWEA estimates for development costs of transmission connected 2-unit OWE project in Irish waters
25 Most of the proposed sites for large-scale projects in Irish waters are further from the shore than 5 km.
26 An indicative estimate of the maximum generation capacity that could be accommodated on a 110 kV connection is ~90 - 100 MW. The actual value at any particular connection node on the network could be less than this and would be a function of a variety of interdependent parameters, including power factor.
27 IWEA estimate value.

Page 31 of 76
5.3.3 Benefits
The potential benefits and shortcomings of an Irish OWE demonstration programme based on one or more projects of this scale are set out below.
• Projects of this scale would demonstrate the performance levels of some of the technology elements in Irish conditions, e.g. foundations, turbines. However, the developers believe that they have good understanding of probable technical performance, that demonstration at this scale and for this purpose is not necessary; there is little benefit in replicating demonstrations already conducted elsewhere.
• Indications from the industry are that the concerns currently restraining confidence in the sector, as set out in section 5.2.1, would not be significantly alleviated by demonstration projects of such a small scale. Therefore, it is doubtful that a demonstration programme based on projects of this scale would overcome the barriers currently constraining the large scale deployment of OWE.
• Although they would provide some useful economic data, much of this data would not be relevant to commercial projects due to the small scale involved.
• Demonstration projects of this scale could provide useful reference sites for assessments of the actual environmental performance of OWE installations in Irish conditions.
• Ireland is an importer of technology in this sector - the two main technological fields upon which OWE is based are wind energy generation and offshore engineering and both are dominated by players from other countries. As a result there would be very limited scope for demonstration of novel technology in the short term in Ireland. Notwithstanding this, the provision of demonstration funding for niche projects involving novel technology could benefit the State through:
- The promotion of an OWE technology development and / or manufacturing industry;
- The development of OWE technologies that could help Ireland to exploit wind resource not currently deemed practicable, e.g. West Coast and / or deep water sites.
There would be some direct benefits to the State accruing from the actual MW installed in the demonstration project(s), the most significant being the contribution of these MW to Ireland’s RE targets – each ~5 MW project would represent 1 % of Ireland’s 2005 RE target. In addition there would be 12,000 tonnes of avoided CO2 emissions and 4,000 tonnes of avoided fuel oil imports for each 5 MW installed. (A complete set of inputs to this analysis and a sample calculation are set out in Annex A5.)
Indicative values for the direct benefits to the State accruing from a 5 MW demonstration project in receipt of a capital grant and AER type PPA support are set out below.
Page 32 of 76
Level of Grant Support
Cost to State of CO2 Saved (NPV Basis)
Annual Avoided Fuel Import
Annual Royalties Payable to State
0 % Capital Grant €133 / tonne €0.5 m €0.14 m
10 % Capital Grant €133 / tonne €0.5 m €0.13 m
25 % Capital Grant €132 / tonne €0.5 m €0.11 m
These figures are based on 15 % discount rate over 15 years and an OWE capital cost of €6,000 / kW. Additional results for 8 % discount rate and for other capital costs are set out in Tables A6.4 to A6.6 in Annex A6.
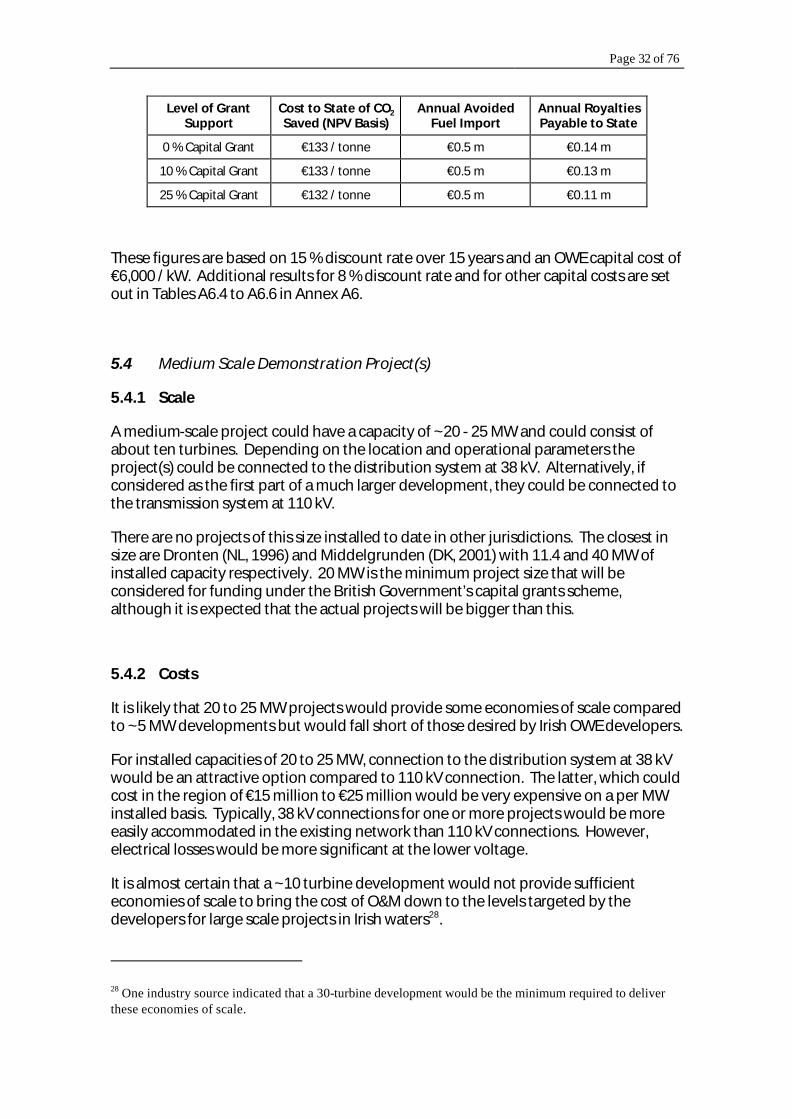
5.4 Medium Scale Demonstration Project(s)
5.4.1 Scale
A medium-scale project could have a capacity of ~20 - 25 MW and could consist of about ten turbines. Depending on the location and operational parameters the project(s) could be connected to the distribution system at 38 kV. Alternatively, if considered as the first part of a much larger development, they could be connected to the transmission system at 110 kV.
There are no projects of this size installed to date in other jurisdictions. The closest in size are Dronten (NL, 1996) and Middelgrunden (DK, 2001) with 11.4 and 40 MW of installed capacity respectively. 20 MW is the minimum project size that will be considered for funding under the British Government’s capital grants scheme, although it is expected that the actual projects will be bigger than this.
5.4.2 Costs
It is likely that 20 to 25 MW projects would provide some economies of scale compared to ~5 MW developments but would fall short of those desired by Irish OWE developers.
For installed capacities of 20 to 25 MW, connection to the distribution system at 38 kV would be an attractive option compared to 110 kV connection. The latter, which could cost in the region of €15 million to €25 million would be very expensive on a per MW installed basis. Typically, 38 kV connections for one or more projects would be more easily accommodated in the existing network than 110 kV connections. However, electrical losses would be more significant at the lower voltage.
It is almost certain that a ~10 turbine development would not provide sufficient economies of scale to bring the cost of O&M down to the levels targeted by the developers for large scale projects in Irish waters28.
28 One industry source indicated that a 30-turbine development would be the minimum required to deliver these economies of scale.
Page 33 of 76
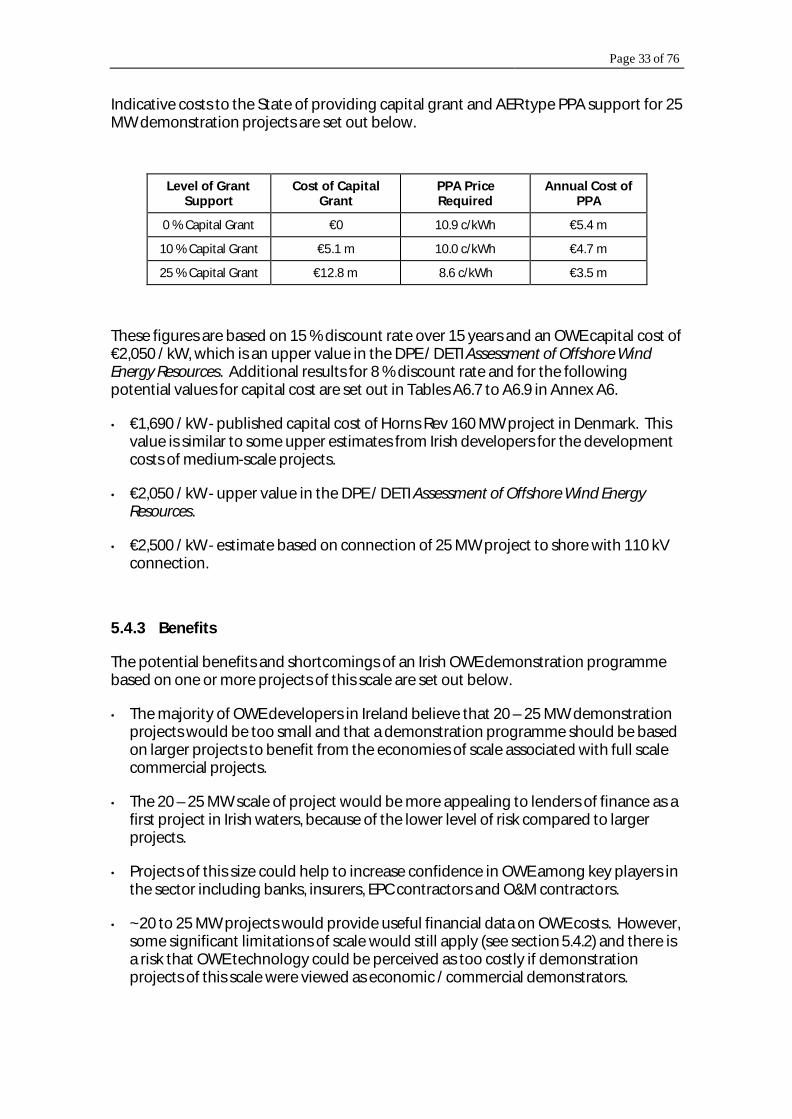
Indicative costs to the State of providing capital grant and AER type PPA support for 25 MW demonstration projects are set out below.
Level of Grant Support
Cost of Capital Grant
PPA Price Required
Annual Cost of PPA
0 % Capital Grant €0 10.9 c/kWh €5.4 m
10 % Capital Grant €5.1 m 10.0 c/kWh €4.7 m
25 % Capital Grant €12.8 m 8.6 c/kWh €3.5 m
These figures are based on 15 % discount rate over 15 years and an OWE capital cost of €2,050 / kW, which is an upper value in the DPE / DETI Assessment of Offshore Wind Energy Resources. Additional results for 8 % discount rate and for the following potential values for capital cost are set out in Tables A6.7 to A6.9 in Annex A6.
• €1,690 / kW - published capital cost of Horns Rev 160 MW project in Denmark. This value is similar to some upper estimates from Irish developers for the development costs of medium-scale projects.
• €2,050 / kW - upper value in the DPE / DETI Assessment of Offshore Wind Energy Resources.
• €2,500 / kW - estimate based on connection of 25 MW project to shore with 110 kV connection.
5.4.3 Benefits
The potential benefits and shortcomings of an Irish OWE demonstration programme based on one or more projects of this scale are set out below.
• The majority of OWE developers in Ireland believe that 20 – 25 MW demonstration projects would be too small and that a demonstration programme should be based on larger projects to benefit from the economies of scale associated with full scale commercial projects.
• The 20 – 25 MW scale of project would be more appealing to lenders of finance as a first project in Irish waters, because of the lower level of risk compared to larger projects.
• Projects of this size could help to increase confidence in OWE among key players in the sector including banks, insurers, EPC contractors and O&M contractors.
• ~20 to 25 MW projects would provide useful financial data on OWE costs. However, some significant limitations of scale would still apply (see section 5.4.2) and there is a risk that OWE technology could be perceived as too costly if demonstration projects of this scale were viewed as economic / commercial demonstrators.

Page 34 of 76
• The projects could provide useful reference sites for assessments of the actual environmental performance of OWE installations in Irish conditions.
• If connected to the transmission system, the demonstration projects would provide experience to project developers and to the TSO on the interaction between wind farms and the transmission system and on matters relating to compliance with the Grid Code.
• The projects would demonstrate the performance levels of some of the technology elements in Irish conditions.
• Demonstration projects of this scale would not be appropriate for the early demonstration of new or unproven technology.
There would be some direct benefits to the State accruing from the actual MWs installed in the demonstration projects, the most significant being the contribution of these MWs to Ireland’s RE targets – each ~20 - 25 MW project would represent 4 - 5 % of Ireland’s 2005 RE target. In addition there would be 60,000 tonnes of avoided CO2 emissions and 20,000 tonnes of avoided fuel oil imports for each 25 MW project installed.
Indicative values for the direct benefits to the State accruing from a 25 MW demonstration project in receipt of a capital grant and AER type PPA support are set out overleaf.

Page 35 of 76
Level of Grant Support
Cost to State of CO2 Saved (NPV Basis)
Annual Avoided Fuel Import
Annual Royalties Payable to State
0 % Capital Grant €35 / tonne €2.6 m €0.32 m
10 % Capital Grant €35 / tonne €2.6 m €0.30 m
25 % Capital Grant €35 / tonne €2.6 m €0.27 m
These figures are based on 15 % discount rate over 15 years and an OWE capital cost of €2,050 / kW. Additional results for 8 % discount rate and for other capital costs are set out in Tables A6.10 to A6.12 in Annex A6.
The deployment of 25 MW demonstration projects would create jobs in the Irish economy. Based on the published estimate of 4.5 full time jobs per MW installed, a 25 MW project would generate over 100 jobs. However, it is unlikely that all of these would be located in Ireland. The potential for OWE to contribute to industrial development is discussed in section 3.3.8.
5.5 Large Scale Demonstration Project(s)
5.5.1 Scale
A large-scale demonstration project could have a capacity of 50 MW or more. The project(s) would be connected to the transmission system at 110 kV.
The OWE demonstration projects being considered in other European jurisdictions are of similar and even larger scales, including:
• 18 sites identified for early development in UK with up to 30 turbines each (~60 – 90 MW);
• Horns Rev in Denmark with 160 MW (under construction), and;
• Near Shore Windpark in the Netherlands with ~100 MW.
5.5.2 Costs
Demonstration projects greater than ~50 MW would offer enhanced economies of scale compared to the other two options. Depending on the size of the projects, minimum economic scales for technology supply, installation, 110 kV grid connection (~90 - 100 MW) and O&M contract costs (= 30 turbines) could be achieved.
As a result the cost to the State per MW installed would be lower than for the other demonstration options but the overall level of expenditure would be higher. Indicative costs to the State of providing capital grant and AER type PPA support for a 50 MW demonstration project are set out overleaf.

Page 36 of 76
Level of Grant Support
Cost of Capital Grant
PPA Price Required
Annual Cost of PPA
0 % Capital Grant €0 9.3 c/kWh €8.1 m
10 % Capital Grant €8.5 m 8.5 c/kWh €6.8 m
25 % Capital Grant €21.1 m 7.4 c/kWh €4.9 m
These figures are based on 15 % discount rate and an OWE capital cost of €1,690 / kW, which is the published capital cost for the Horns Rev 160 MW project in Denmark and is similar to some upper estimates from Irish developers for the development costs of medium-scale projects. Additional results for 8 % discount rate, for the following potential values for capital cost and for 60 MW, 100 MW and 200 MW projects are set out in Tables A6.13 to A6.15 and A6.16 to A6.36 in Annex A6.
• €1,420 / kW - lower value in the DPE / DETI Assessment of Offshore Wind Energy Resources. This is similar to some lower estimates from Irish developers for the development costs of medium-scale projects.
• €1,690 / kW - published capital cost for the Horns Rev 160 MW project in Denmark. This is similar to some upper estimates from Irish developers for the development costs of large-scale projects.
• €2,050 / kW - upper value in the DPE / DETI Assessment of Offshore Wind Energy Resources.
5.5.3 Benefits
The potential benefits and shortcomings of an Irish OWE demonstration programme based on one or more large-scale projects are set out below.
• As discussed in section 5.4.3, most developers favour an immediate demonstration programme for relatively large-scale projects. However, industry opinions on an appropriate size for projects vary considerably. We were informed of several demonstration project sizes considered to be the minimum required by developers, including 60 MW, 100 MW and 200 MW.
• Projects of this size would build confidence among some key players in the sector. However, it is unclear whether banks would be happy to accept the perceived high level of risk associated with early developments of this scale.
• Demonstration projects of this scale would provide useful economic data for future commercial developments.
• As well as providing a proving ground for turbine and foundation technologies, projects of this scale would also demonstrate the technical performance of the transmission connection assets.
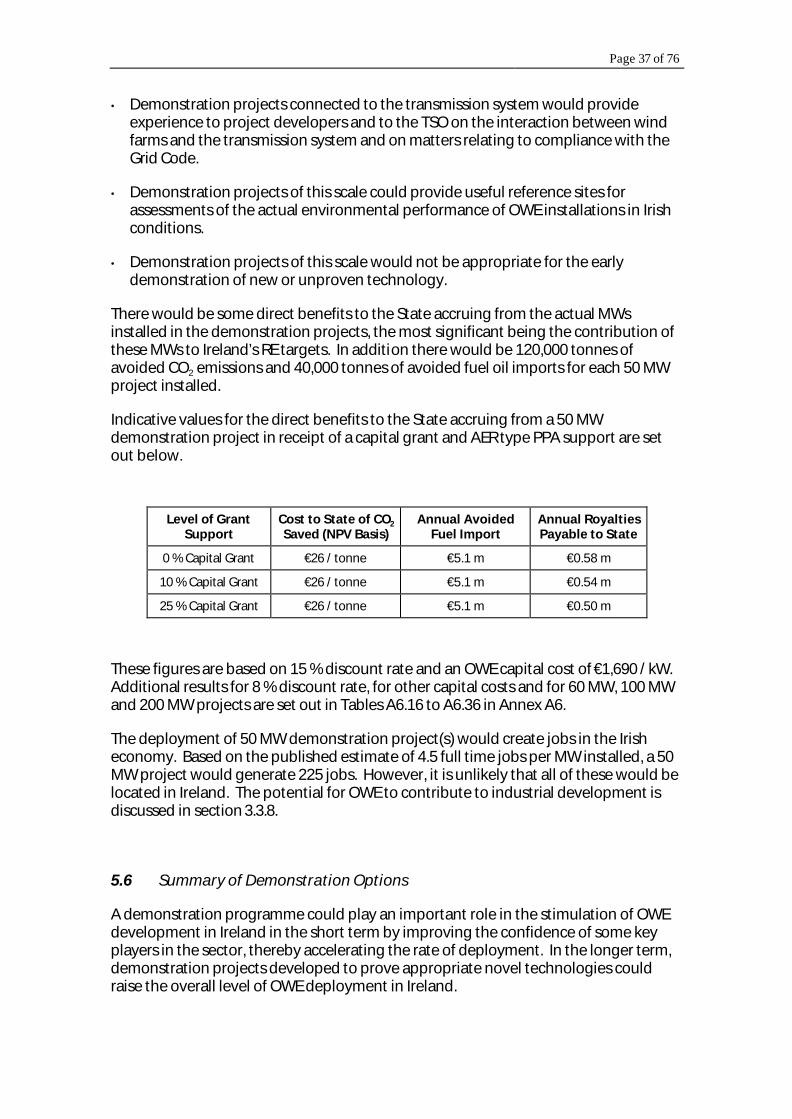
Page 37 of 76
• Demonstration projects connected to the transmission system would provide experience to project developers and to the TSO on the interaction between wind farms and the transmission system and on matters relating to compliance with the Grid Code.
• Demonstration projects of this scale could provide useful reference sites for assessments of the actual environmental performance of OWE installations in Irish conditions.
• Demonstration projects of this scale would not be appropriate for the early demonstration of new or unproven technology.
There would be some direct benefits to the State accruing from the actual MWs installed in the demonstration projects, the most significant being the contribution of these MWs to Ireland’s RE targets. In addition there would be 120,000 tonnes of avoided CO2 emissions and 40,000 tonnes of avoided fuel oil imports for each 50 MW project installed.
Indicative values for the direct benefits to the State accruing from a 50 MW demonstration project in receipt of a capital grant and AER type PPA support are set out below.
Level of Grant Support
Cost to State of CO2 Saved (NPV Basis)
Annual Avoided Fuel Import
Annual Royalties Payable to State
0 % Capital Grant €26 / tonne €5.1 m €0.58 m
10 % Capital Grant €26 / tonne €5.1 m €0.54 m
25 % Capital Grant €26 / tonne €5.1 m €0.50 m
These figures are based on 15 % discount rate and an OWE capital cost of €1,690 / kW. Additional results for 8 % discount rate, for other capital costs and for 60 MW, 100 MW and 200 MW projects are set out in Tables A6.16 to A6.36 in Annex A6.
The deployment of 50 MW demonstration project(s) would create jobs in the Irish economy. Based on the published estimate of 4.5 full time jobs per MW installed, a 50 MW project would generate 225 jobs. However, it is unlikely that all of these would be located in Ireland. The potential for OWE to contribute to industrial development is discussed in section 3.3.8.
5.6 Summary of Demonstration Options
A demonstration programme could play an important role in the stimulation of OWE development in Ireland in the short term by improving the confidence of some key players in the sector, thereby accelerating the rate of deployment. In the longer term, demonstration projects developed to prove appropriate novel technologies could raise the overall level of OWE deployment in Ireland.

Page 38 of 76
However, it is unlikely that demonstration alone will stimulate the deployment of OWE in Ireland in the short term. Some form of market price support mechanism will be required to meet the higher cost of generation compared to fossil technologies and to reduce the off-take risk.
5.6.1 Small Scale Projects
The cost to the State of funding demonstration project(s) of this scale would be low in terms of absolute levels of expenditure but high in terms of cost per MW installed. It is likely that the projects would require both capital grant support and PPAs. However, the direct benefits to the State in terms of RE and GHG reduction targets would be very limited and it is very unlikely that such a programme in isolation would stimulate the wider deployment of OWE in Ireland.
There may be a small number of limited, niche opportunities where support for demonstration project(s) of this scale would be appropriate. In these exceptional cases, demonstration of core technology elements or novel installation techniques would be the likely drivers. The high specific cost of such small-scale projects could be potentially overcome in the short term by securing permission to install projects close to the shore or in the longer terms by installing demonstration elements as part of larger scale commercial developments thereby benefiting from the economies of scale associated with grid connection, installation & construction costs and O&M costs.
Some of the areas where further advances in OWE technology could help the long-term development of OWE in Ireland are set out in Annex A4.
5.6.2 Medium Scale Projects
It is likely that a demonstration programme based on projects of this scale using relatively mature OWE technology would deliver increased levels of market confidence and could act as a useful stepping-stone for the industry prior to developing larger, riskier projects. However, many developers believe that projects of this size would not be viable because of a lack of economies of scale. There is an associated risk that the demonstrations could convey inaccurate impressions of the costs of OWE.
5.6.3 Large Scale Projects
It is likely that a demonstration programme based on projects of this scale using proven / certified technology would deliver increased levels of market confidence and could act as a useful stepping-stone for the industry prior to developing full-scale, commercial projects. Projects of this size would offer better economies of scale as well as significant environmental benefits in their own right, but would involve higher levels of capital investment and risk. There is little consensus within the sector as to an appropriate size for projects. It is also uncertain whether financial institutions would

Page 39 of 76
be happy to provide debt finance due to the perceived high level of risk associated with the early development of projects of this size.
5.6.4 Table of Costs and Benefits
Table 5.1 overleaf summarises the indicative costs and benefits to the State associated with demonstration projects of each of the three scales. The costs and benefits are calculated in terms of Government expenditure and direct environmental savings. The figures presented are for individual projects in each category but they may be scaled directly to determine the costs and benefits to the State associated with multiple projects of each size. The values in Table 5.1 are based on a 15 % discount rate. Additional results based on 8 % discount rate and alternative values for capital investment costs are set out in Annex A6.

Page 40 of 76
November 2002
Table 5.1: Costs and Benefits to the State of Supporting Demonstration Projects of Different Scales with Different Levels of Funding (15 % Discount Rate)
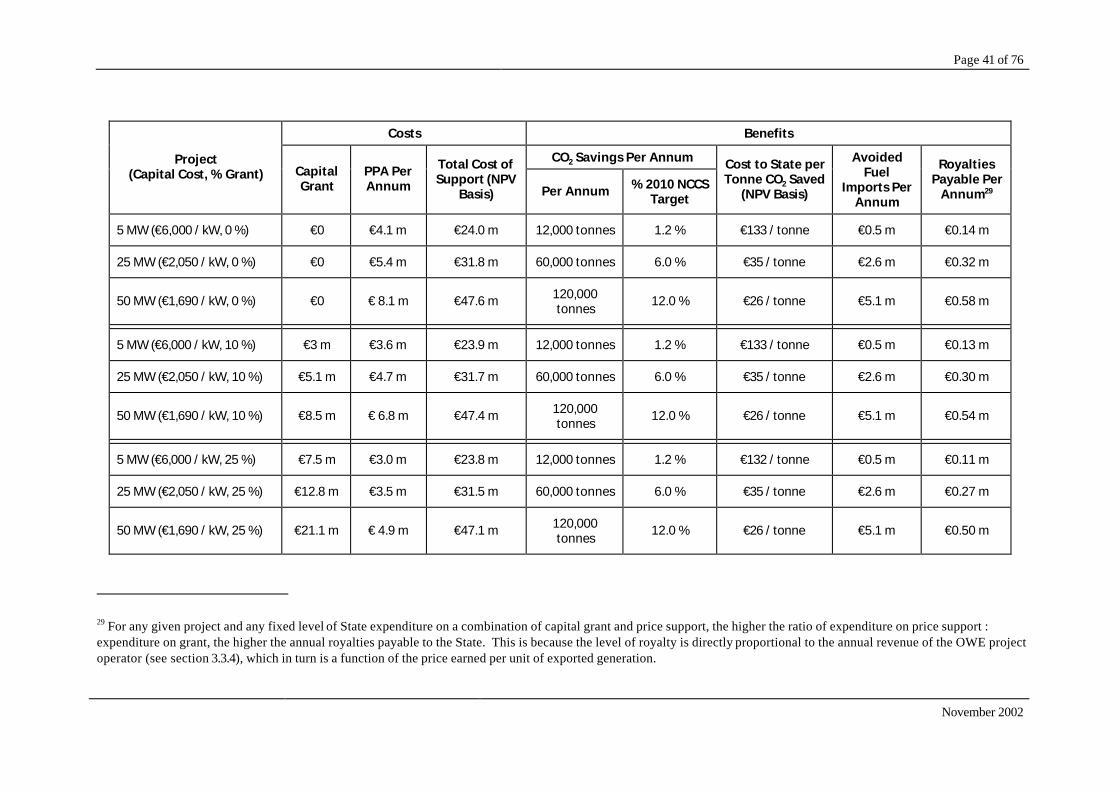
Page 41 of 76
November 2002
Costs Benefits
CO2 Savings Per Annum Project (Capital Cost, % Grant) Capital
Grant PPA Per Annum
Total Cost of Support (NPV
Basis) Per Annum % 2010 NCCS Target
Cost to State per Tonne CO2 Saved
(NPV Basis)
Avoided Fuel
Imports Per Annum
Royalties Payable Per
Annum29
5 MW (€6,000 / kW, 0 %) €0 €4.1 m €24.0 m 12,000 tonnes 1.2 % €133 / tonne €0.5 m €0.14 m
25 MW (€2,050 / kW, 0 %) €0 €5.4 m €31.8 m 60,000 tonnes 6.0 % €35 / tonne €2.6 m €0.32 m
50 MW (€1,690 / kW, 0 %) €0 € 8.1 m €47.6 m 120,000 tonnes
12.0 % €26 / tonne €5.1 m €0.58 m
5 MW (€6,000 / kW, 10 %) €3 m €3.6 m €23.9 m 12,000 tonnes 1.2 % €133 / tonne €0.5 m €0.13 m
25 MW (€2,050 / kW, 10 %) €5.1 m €4.7 m €31.7 m 60,000 tonnes 6.0 % €35 / tonne €2.6 m €0.30 m
50 MW (€1,690 / kW, 10 %) €8.5 m € 6.8 m €47.4 m 120,000 tonnes
12.0 % €26 / tonne €5.1 m €0.54 m
5 MW (€6,000 / kW, 25 %) €7.5 m €3.0 m €23.8 m 12,000 tonnes 1.2 % €132 / tonne €0.5 m €0.11 m
25 MW (€2,050 / kW, 25 %) €12.8 m €3.5 m €31.5 m 60,000 tonnes 6.0 % €35 / tonne €2.6 m €0.27 m
50 MW (€1,690 / kW, 25 %) €21.1 m € 4.9 m €47.1 m 120,000 tonnes
12.0 % €26 / tonne €5.1 m €0.50 m
29 For any given project and any fixed level of State expenditure on a combination of capital grant and price support, the higher the ratio of expenditure on price support : expenditure on grant, the higher the annual royalties payable to the State. This is because the level of royalty is directly proportional to the annual revenue of the OWE project operator (see section 3.3.4), which in turn is a function of the price earned per unit of exported generation.

Page 42 of 76
November 2002
6.0 Support for Full Scale Projects
6.1 Funding Mechanism
The State could support full-scale commercial OWE projects through the implementation of a market mechanism that would provide long term, State guaranteed PPAs. It is beyond the scope of this study to assess or compare different options for market mechanisms to support OWE. As requested by Sustainable Energy Authority of Ireland, we have based our assessment on the indicative cost to the State of providing a market mechanism for OWE projects similar to the AER system.
We determined the quantitative costs and benefits by conducting a techno-economic analysis of AER-type support, based on:
• 15 year PPAs;
• 8 % and 15 % discount rates;
• 38 % plant load factor;
• OWE displacing oil-fired generation from the system;
• Various OWE capital investment costs;
A complete set of inputs to this analysis and a sample calculation are set out in Annex A5. The results are expressed in terms of levels of expenditure and environmental savings.
6.2 Costs & Benefits
The provision of an appropriate market mechanism to provide a premium price for electricity generated in OWE developments would help to stimulate the large-scale deployment of OWE in Irish waters. This in turn would deliver the benefits to the State, discussed in section 3.3. The most significant benefits would be contributions to national RE targets and GHG emission targets.
Conversely, it is highly unlikely that OWE would be deployed in Irish waters in the absence of a market mechanism to support projects.
The primary cost associated with providing a market mechanism to support OWE is the direct expenditure required to subsidise the premium price for each unit of electricity generated. The amount payable by the Government depends on a number of important variables for which definitive values are not yet known for Irish conditions, viz.: investment cost; O&M cost, and; plant availability.

Page 43 of 76
November 2002
Indicative values30 for costs and benefits to the State of providing AER type support are set out in Table 6.1 overleaf. The values are presented on a per MW installed basis and for different levels of project capital cost and discount rate. The capital costs considered are:
• €1,270 / kW - lower estimate from Irish developers for the development costs of large-scale projects.
• €1,420 / kW - lower value in the DPE / DETI Assessment of Offshore Wind Energy Resources. This is similar to lower estimates from Irish developers for the development costs of medium-scale projects and upper estimates from developers for the development costs of large-scale projects.
• €1,690 / kW - published capital cost of Horns Rev 160 MW project in Denmark. This is similar to upper estimates from Irish developers for the development costs of medium-scale projects.
• €2,050 / kW - upper value in the DPE / DETI Assessment of Offshore Wind Energy Resources.
30 The results of our analysis are useful for comparing the relative costs and benefits of different funding options. However, the absolute figures are indicative only due to the uncertainty associated with several of the inputs, notably project capital costs.

Page 44 of 76
November 2002
Table 5.1: Costs and Benefits to the State of Providing AER Type Support to OWE projects with Different Capital Costs and for Different Discount Rates
8 % Discount Rate 15 % Discount Rate
Project Capital Cost Energy Price
Required
Direct Cost of PPAs to the
State per annum
Cost to State per Tonne of
CO2 Saved (NPV Basis)
Royalties to the State per
annum
Energy Price Required
Direct Cost of PPAs to the
State per annum
Cost to State per Tonne of
CO2 Saved (NPV Basis)
Royalties to the State per
annum
[€/kW] [c/kWh] [€/MW] [€/Tonne] [€/MW] [c/kWh] [€/MW] [€/Tonne] [€/MW]
1,270 5.787 45,843 11 8,616 7.373 98,642 16 9,936
1,420 6.287 62485 15 9,032 8.061 121,521 20 10,508
1,690 7.187 92,442 22 9,781 9.298 162,702 26 11,538
2,050 8.387 132,383 32 10,780 10.947 217,611 35 12,910
Notes:
1. No capital grant support is accounted for in these figures.
2. The primary assumptions incorporated in these calculations are set out in Annex A5.
Page 45 of 76
November 2002
Based on these figures, each MW of installed capacity would result in 2,400 tonnes of avoided CO2 emissions and €100,000 of avoided fuel imports (800 tonnes of oil) per annum.
Based on a 15 % discount rate and €1,690 / kW investment costs, the provision of 500 MW of AER type support would:
• Cost the State €81.4 m per annum
• Avoid 1.2 million tonnes of CO2 emissions per annum at a cost of €26 per tonne (NPV basis). This is based on displacing oil-fired generation from the system. This saving would amount to 120 % of the 2010 target for RE derived savings set out in National Climate Change Strategy – Ireland.
• Avoid the annual emission of 12,000 tonnes of SOX and 3,750 tonnes of NOX.
• Earn the State €5.8 m per annum in royalties for use of the foreshore.
• Avoid the annual importation of €51.3 m of fossil fuel (oil).
• Provide up to 2,250 jobs in the Irish economy. This value could be considerably lower as it depends on the future associated development of OWE technology manufacturing and servicing industries in Ireland. The potential for OWE to contribute to industrial development is discussed in section 3.3.8.
Notwithstanding the fact that the provision of a market mechanism to support large scale projects would lower the off-take risk associated with OWE development (see section 2.2.3) banks may be reluctant to provide debt finance for large projects (in the 100s of MW range) in the absence of the earlier development of smaller scale project(s).
It is likely that banks would only lend over 80 % to 85 % of the terms of PPAs. For this reason, and because of the projected ~20 year lifetimes of OWE projects, developers would favour 20 year PPAs31.
31 State Aids guidelines of the EU Commission “suggest” contracts should not exceed 10 years.
Page 46 of 76
November 2002
7.0 Conclusions & Recommendations
• Ireland has a huge OWE resource, including a significant ‘practical resource’ in relatively shallow waters close to load centres.
• Ireland is going to face serious challenges in meeting its international commitments to limit GHG emissions. There are likely to be significant costs associated with non-compliance and it is likely that mechanisms for financial penalties will be introduced in advance of the 2008 – 2012 Kyoto Protocol target deadline. OWE generation produces no CO2 and has the potential to play an important role in helping the Irish energy supply sector to meet its GHG targets.
• OWE could contribute to Ireland’s Renewable Energy targets, help the electricity sector comply with the requirements of the IPPC Directive and make major contributions to the sustainability of energy supply in Ireland.
• OWE could also contribute to industrial development and job creation, reduce fossil-fuel imports, stimulate competition in the electricity sector and provide revenue to government through taxation and royalties for use of the foreshore.
• There are several barriers to OWE development in Ireland. These include inter alia high capital costs, the non-availability of debt finance, uncertainties regarding the future structure of the Irish electricity market and the anticipated inability of the transmission system to accommodate increased levels of intermittent generation.
• The cost of delivered energy from demonstration or full scale OWE projects is dependent on a number of factors including project capital cost, plant availability and O&M costs. For as long as there is no realisable economic value associated with the environmental benefit of OWE, the cost of delivered energy will be high compared to conventional fossil-fired generation. At the moment OWE costs are also higher than those of Onshore Wind Energy. However, the industry expects that with the economies of scale achievable in an offshore environment, the cost can become competitive with alternative sources of generation.
• In the short term, it is unlikely that OWE will be deployed in Irish waters without some form of government support. State funding for Research and Development, one or more Demonstration Programmes and / or Full Scale Deployment are among the options available to Government.
7.1 Research & Development
• As Ireland is not currently a significant developer of core OWE technology, an Irish R&D programme should focus primarily on the integration of OWE into the Irish energy supply system. This could help to increase both the rate and overall level of OWE deployment achievable. We have identified some suggested areas of activity in our report (Annex A4).
• Several other European countries have begun to develop their OWE industries and others will be developing theirs in parallel with Ireland. It is important that Irish

Page 47 of 76
November 2002
industry keeps abreast of developments in other jurisdictions and learns from experiences gained elsewhere.
7.2 Demonstration
• Demonstration could play an important role in OWE development in Ireland but it will not deliver large-scale OWE deployment in the short term without the implementation of a support mechanism for larger projects in the same timeframe.
• Past experience with grant support for demonstration of other technologies in Ireland and elsewhere has often shown that when the grants cease, the market for the technology dwindles. If Ireland is committed to the deployment of OWE on a large scale in the short to medium terms, then any demonstration programme must be part of an overall national policy to support OWE. In the absence of full internalisation of the external costs of electricity generation, a market mechanism to provide a premium price for OWE generation will be required to make projects viable.
• Most Irish OWE developers favour the immediate development of large-scale projects rather than smaller demonstration schemes. They share a belief that a standalone demonstration programme in the absence of price support for larger scale projects in the same timeframe could result in the unnecessary stalling of the industry in Ireland.
• We believe that the most important objective of an Irish OWE demonstration programme should be the development of marketplace confidence among key players in the sector, including banks, insurers, EPC contractors, O&M contractors, technology providers, the TSO and the Regulator. This in turn could help to stimulate the large-scale deployment of OWE in tandem with an appropriate market support mechanism.
• Depending on the size of demonstration projects, certain economies of scale will not be realised. Therefore, the cost of installing demonstration projects is likely to be higher on a per MW basis than the cost of larger projects.
• There is little consensus within the sector as to an appropriate size for demonstration projects, with stated minimum sizes including 25 MW, 60 MW, 100 MW and 200 MW. The main reasons for preferring larger projects are economies of scale. In other jurisdictions, the current trend is towards demonstration projects in the 60 MW to 150 MW range. However, several of these countries have already installed smaller scale projects.
• Given the relatively advanced status of both OWE technology and the proposed projects in Irish waters, and the main confidence-building objective of an Irish demonstration programme, it is likely that the period between demonstration and support for larger scale deployment could be kept to a minimum.
• Generally, a wider level experience would be gained from several demonstration projects than from a single project. If there was a support programme for full-scale OWE deployment in the same timeframe as a demonstration programme, one
Page 48 of 76
November 2002
demonstration project may be sufficient to stimulate further development. However, most players in the sector, including the Regulator, indicated that they would prefer not to see Government support for demonstration being concentrated on just one project.
• As well as any grant support provided, demonstration projects in Irish waters would require an appropriate market mechanism to provide a premium price for energy sales. We have calculated the indicative cost to the State of providing 15 year PPAs in tandem with different levels of grant support for demonstration projects of different scales and cost.
• It is unlikely that a demonstration programme based on ~5 MW project(s) would stimulate the wider deployment of OWE in Ireland. The project(s) would be too small to either develop sufficient marketplace confidence or incorporate economies of scale. However, there may be a small number of niche opportunities involving the demonstration of novel technologies, techniques or applications in new environments where support for projects of this scale would be appropriate.
• One or more 25 MW project(s) incorporating proven / certified technology would help to increase marketplace confidence in the sector and would act as useful learning experience prior to larger scale deployment. Compared to larger demonstration project(s), the risk associated with development would be low, which could help developers to secure debt finance. However, most developers believe that 25 MW projects would not be viable. It is likely that economies of scale could not be realised for a 25 MW project, especially if connected via 110 kV connection. Depending on local grid conditions, 25 MW projects could be connected to the distribution system (38 kV) at lower cost.
• One or more successful 50 MW (or greater) demonstration projects using proven technology would also increase confidence in OWE. Projects of this size would offer better economies of scale as well as significant environmental benefits in their own right, but would involve higher levels of capital investment and risk. It is uncertain whether financial institutions would be happy to provide debt finance due to the perceived high level of risk associated with an early project of this scale. Despite this, most developers indicated that they would favour demonstration projects of this size range and above.
• Depending on the design, scale and performance of demonstration project(s), the indicative direct benefits accruing from the capacity installed would be 2,400 tonnes of avoided CO2 and €100,000 of avoided fuel imports per MW installed per annum. The cost of demonstration to the State would be highly dependent on the scale and type of support. A summary of costs is set out in Table 5.1.
• The technical, economic and environmental performance of any demonstration projects should be carefully monitored and evaluated. The experience gained should be disseminated among stakeholders in the industry.
7.3 Full Scale Deployment
• Even if several demonstration projects are commissioned, it is very unlikely that there will be full-scale deployment of OWE onto the Irish network in the short term

Page 49 of 76
November 2002
without the provision of support for this deployment through an appropriate market mechanism.
• The provision of support for large-scale developments without the earlier deployment of smaller scale project(s) may not overcome the perception of lenders that OWE incorporates excessive levels of risk.
• Based on the investment cost reported for the 160 MW Horns Rev project, the indicative cost per annum to Government of providing AER type support for 500 MW would be €81.4 m. This would avoid 1.2 million tonnes of CO2 emissions per annum at a cost of €26 per tonne (NPV basis). This is 120 % of the 2010 GHG emissions savings targets for RE in the National Climate Change Strategy - Ireland. This level of deployment would earn the State €5.8 m per annum in royalties and avoid the importation of €51.3 m of fuel oil (40,000 tonnes). These figures are based on 15 % discount rate – based on an 8 % discount rate, the annual cost of the PPA to the State would be €46.2 m or €22 / tonne CO2 saved (NPV basis).
• The early development of a mechanism whereby Irish developers could realise a market value for the ‘green’ element of their generation would lessen the potential direct financial burden on the State of supporting the large scale deployment of OWE. Ideally, this could be in a European context. The indirect costs to the State and to other users of the transmission network associated with such a mechanism should be examined.
• Other potential costs associated with the large-scale deployment of OWE include deep reinforcement of the transmission system and the provision of ancillary grid services. Under current market rules, these are borne by all grid users via the TUoS charges.
• Ireland currently has an isolated transmission system with low levels of interconnection. The European Commission wishes to enhance the levels of interconnection between EU transmission systems to create an integrated European electricity market. Improved levels of interconnection between Ireland and Britain would be beneficial to the early development of the Irish OWE sector. If certain associated capital and operational cost barriers can be overcome, improved interconnection could provide an opportunity for Ireland to develop its large OWE resource as an export industry selling RE into markets throughout Europe in the medium to long terms.
• OWE, Onshore Wind Energy and Biomass could each have important roles in a future sustainable energy supply network in Ireland. It is likely that the three technologies will achieve peak rates of deployment in different timeframes. Support for one technology should not be to the detriment of another. It is likely that there are hundreds of MWs of Onshore Wind Energy capacity that could be developed at costs higher than current Onshore Wind costs but lower than the indicative costs of OWE.
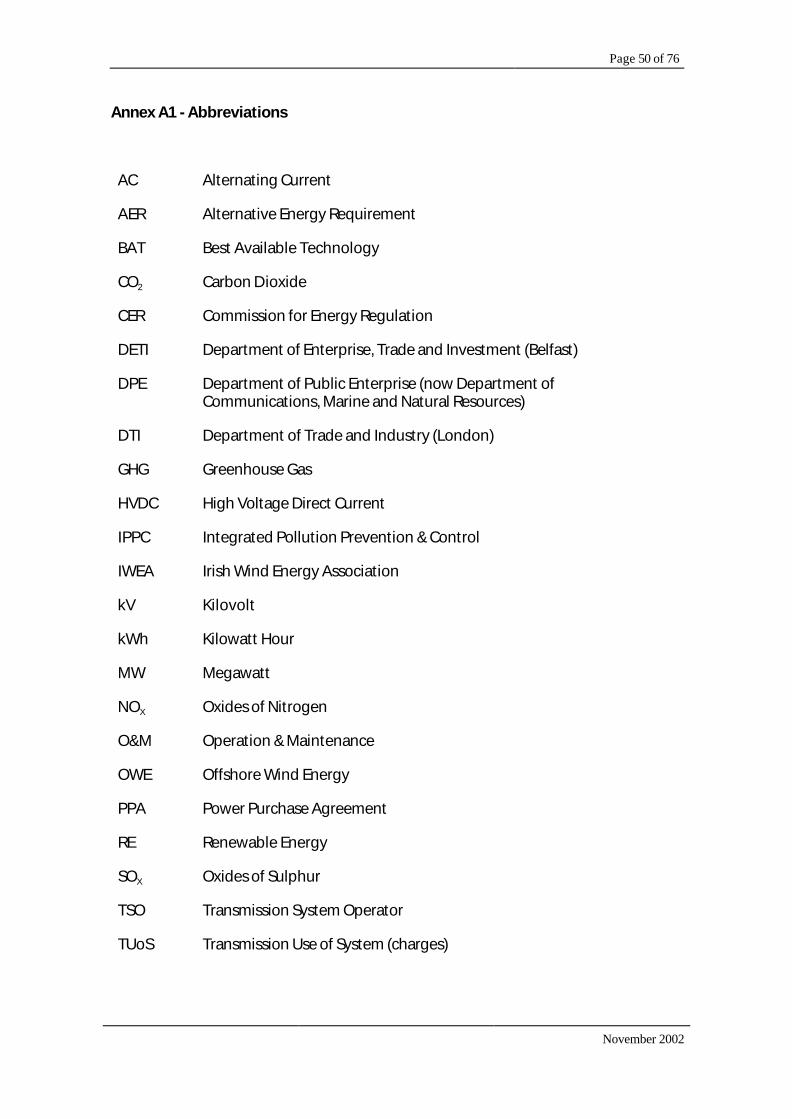
Page 50 of 76
November 2002
Annex A1 - Abbreviations
AC Alternating Current
AER Alternative Energy Requirement
BAT Best Available Technology
CO2 Carbon Dioxide
CER Commission for Energy Regulation
DETI Department of Enterprise, Trade and Investment (Belfast)
DPE Department of Public Enterprise (now Department of Communications, Marine and Natural Resources)
DTI Department of Trade and Industry (London)
GHG Greenhouse Gas
HVDC High Voltage Direct Current
IPPC Integrated Pollution Prevention & Control
IWEA Irish Wind Energy Association
kV Kilovolt
kWh Kilowatt Hour
MW Megawatt
NOX Oxides of Nitrogen
O&M Operation & Maintenance
OWE Offshore Wind Energy
PPA Power Purchase Agreement
RE Renewable Energy
SOX Oxides of Sulphur
TSO Transmission System Operator
TUoS Transmission Use of System (charges)

Page 51 of 76
November 2002
Annex A2 – List of Existing OWE Projects
Project Country Year Capacity No. Turbines
Vindeby Denmark 1991 4.95 MW 11
Lely (Ijsselmeer) Netherlands 1994 2 MW 4
Tunø Knob Denmark 1995 5 MW 10
Dronten (Ijsselmeer) Netherlands 1996 11.4 MW 19
Gotland (Bockstigen) Sweden 1997 2.75 MW 5
Blyth Offshore UK 2000 3.8 MW 2
Middelgrunden Denmark 2001 40 MW 20
Utgrunden Sweden 2001 10.5 MW 7
Horns Rev Denmark Under Construction
160 MW 80

Page 52 of 76
November 2002
Annex A3 - Cost of OWE
Overview
The costs incurred in OWE development are typically 30 % to 70 % greater than those for onshore projects. The additional costs are primarily associated with foundations and electrical (grid) connection but also with installation and with the marinisation of turbines. However, recent studies indicate that large OWE farms are becoming more competitive with other energy sources. There is only very limited definitive cost data available. There are a number of reasons for this, viz.:
• The costs associated with OWE developments vary considerably between different projects. In particular the foundation, installation and grid connection costs are highly site specific.
• The first offshore projects were demonstrations incurring extra costs due to their innovative nature and smaller scale: Vindeby (DK) and Blyth (UK) for example. The costs per kW associated with these developments may not be consistent with the anticipated costs associated with proposed larger scale projects.
• All projects developed to date throughout Europe have benefited from different levels of government support via various support mechanisms. The actual project cost breakdowns are not always transparent or comparable between different projects.
• Most of the existing cost data is available for locations in other countries where conditions are not necessarily representative of those that might be expected at the proposed OWE development sites in Irish waters.
A range of indicative capital investment costs for OWE projects are set out overleaf.

Page 53 of 76
November 2002
Source Specific Investment Cost
IWEA estimates for development costs of a transmission connected 2-unit OWE project in Irish waters (2002)
6,000 to 10,000 € / kW
Estimated cost of ~25 MW plant with 110 kV connection (2002)
2,500 € / kW
Early Danish OWE projects (early 1990s) 2,200 € / kW
DPE / DETI Assessment of Offshore Wind Energy Resources – upper value (2000)
2,050 € / kW
160 MW Horns Rev Project (DK, 2002) 1,690 € / kW
Developer estimates for medium scale developments in Irish waters (up to 100 MW) (2002)
1,400 to 1,650 € / kW
DPE / DETI Assessment of Offshore Wind Energy Resources – lower value (2000)
1,420 € / kW
Developer estimates for large scale developments in Irish waters (100s of MW) (2000)
1,270 to 1,460 € / kW
DTI (UK) Target Cost for year 2010 1,185 € / kW
It is widely expected that OWE investment costs will decrease over time as developers gain wider experience in the sector and economies of scale are achieved. Notwithstanding this, in the medium to longer terms there could be upward pressure on investment costs associated with the deployment of OWE at less favourable sites, such as those in deeper water than is currently considered viable.
Site Assessment
There are significant financial outlays required of developers assessing the potential of OWE sites in Irish waters. These include costs associated with resource prediction, assessment and measurement, environmental assessments and seabed surveys. Combined, these costs can typically amount to approximately €1.5 million, depending on site size, site location, water depth and weather.
Turbines
The first OWE projects developed in the early to mid 1990s used turbines with installed capacities in the region of 500 kW. Today, the vast majority of OWE developments proposed throughout Europe incorporate much larger turbines in an attempt to benefit from economies of scale. The most recent developments at Horns Rev (DK, under construction), Middelgrunden (DK, 2000) and Blyth (UK, 2000) all used 2 MW units (eighty, twenty and two turbines respectively).
The current trend is towards even larger turbines as their use continues to drive down the overall project cost per kW of installed capacity. This clear economic driver to use the newest and biggest turbines is offset to a certain extent by the need to use turbine

Page 54 of 76
November 2002
technology that has been proven to be reliable in onshore and, ideally, offshore conditions.
Typically, turbines account for 40 to 55 % of total OWE project capital costs.
Foundations
The selection of an appropriate foundation design for a project is highly dependent on the composition and structure of the seabed and the water depth. The monopile is currently the favoured technology, though the gravity caisson was used in the 40 MW installation at Middelgrunden (DK, 2001). It is expected that the developers of large-scale OWE farms at the sites currently proposed in Ireland will use a number of variants of similar foundation technologies to best suit the different seabed structures and water depths encountered at different sites and at different locations on individual sites.
Foundation costs can range from 15 to 25 % of the investment cost.
Grid Connection
The cost of grid connection for an OWE development is dependent on number of factors including inter alia plant capacity, connection voltage, distance from shore, number of connections required, strength of the network at the connection node and sub-sea conditions. The cables are more expensive than those used on land because of the more aggressive location in which they are used. Typically, the cost of grid connection is around 20 to 25 % of the overall OWE investment cost - a much higher proportion than for onshore projects.
The main connection options available to Irish developers of projects in the installed capacity range discussed in this document are 38 kV and 110 kV AC connections. High Voltage Direct Current (HVDC) connections are also being considered.
38 kV AC
Depending on network conditions, up to 25 to 30 MW of OWE capacity could be connected directly to the 38 kV distribution network. An offshore substation would not be required and switchgear is cheaper than for 110 kV. A larger wind farm could be divided into smaller blocks connected via separate 38 kV cables. However, losses are higher at 38 kV and there could be significant constraints on the amount of generation capacity that could be connected to the distribution network at any given node.
110 kV AC
OWE developments greater than 25 to 30 MW would require transmission level connections at 110 kV. An indicative estimate of the maximum generation capacity
Page 55 of 76
November 2002
that could be accommodated on a 110 kV connection is ~90 - 100 MW. The actual value at any particular connection node on the network could be less than this and would be a function of a variety of interdependent parameters, including power factor. Developers proposing single AC connections carrying greater capacity would be obliged to connect at 220 kV.
It is likely that an offshore substation would be required for an OWE development connected at 110 kV, although this is currently a source of contention between some developers and the TSO. If an offshore substation were required, voltage would be stepped up from generation levels to an intermediate level (up to 38 kV if appropriate) via separate transformers in each turbine base. Each of the turbines in a block would be connected to the offshore substation where the voltage would be stepped up to 110 kV for transmission ashore via a single sub sea cable. If the substation were located on land, there could be several cables ashore, in which case an individual cable failure would not necessarily mean that the entire OWE farm would have to go offline.
Offshore substations would be more expensive than the onshore equivalent because of their novel nature, the limited market for them and the adaptations required for them to survive in harsh marine environments. There would also be a degree of technical risk associated with their use because there is little experience in their application at this voltage in offshore conditions - experience in the offshore oil and gas sector is limited to 13.8 kV.
HVDC
At large distances from the shore losses and reactive power production in AC sea cables become important.
This has led to interest in the use of HVDC connections. HVDC has been used for many years in other applications, but is typically used where the transported power is large (upwards of several hundred MW) and the distances are large. Recent advances in power electronic technology have led to the development of HVDC systems at lower ratings than were previously cost effective. Work is ongoing to identify the precise combination of technical and economic parameters necessary to make HVDC more attractive than AC for connecting OWE projects.
An OWE development connected via HVDC would require a dedicated offshore platform containing a converter and switchgear.
Construction and Installation
There are significant extra costs associated with carrying out construction activities in an offshore environment. Therefore, as much as possible of the subcomponent assembly is conducted ashore. The actual installation of OWE structures is a two stage process, with the installation of turbines and towers following the installation of foundations. To date, existing, non-dedicated jack-up barges and floating cranes have been used to install turbines up to the 2 or 3 MW size. As turbine sizes increase to 5 MW and beyond, it is expected that special purpose installation vessels will be required.

Page 56 of 76
November 2002
The cost of these vessels, their operational capabilities in foul weather and their rate of turbine deployment will all play important roles in determining the overall installation and construction costs of large scale OWE developments.
Operation and Maintenance
There are no direct fuel costs associated with OWE. However, there are Operation and Maintenance (O&M) costs, which are frequently quantified on the basis of cost per unit of energy delivered. The actual long term O&M costs for OWE projects are not fully known. However, it is widely agreed that offshore O&M costs will be more than those for onshore developments. The principal reasons for this are the limited periods of access to turbines and other offshore components for both maintenance crew and equipment due to foul weather and the coincidence of high wind resource with periods of poor access to turbines.
There are diverse estimates for long term O&M costs available from different sources. The DPE / DETI Assessment of Offshore Wind Energy Resources includes an estimated range of 1.1 to 2.4 c/kWh. Other estimates for proposed projects in both Irish waters and other jurisdictions range from 1.0 to 1.4 c/kWh. Some longer-term targets for large-scale developments suggest that figures as low as 0.6 c/kWh may be achievable. Estimated O&M costs for the Middelgrunden project, which is located just 2 km from the shore in 3-5 m water depth, are 0.8 to 0.9 c/kWh.
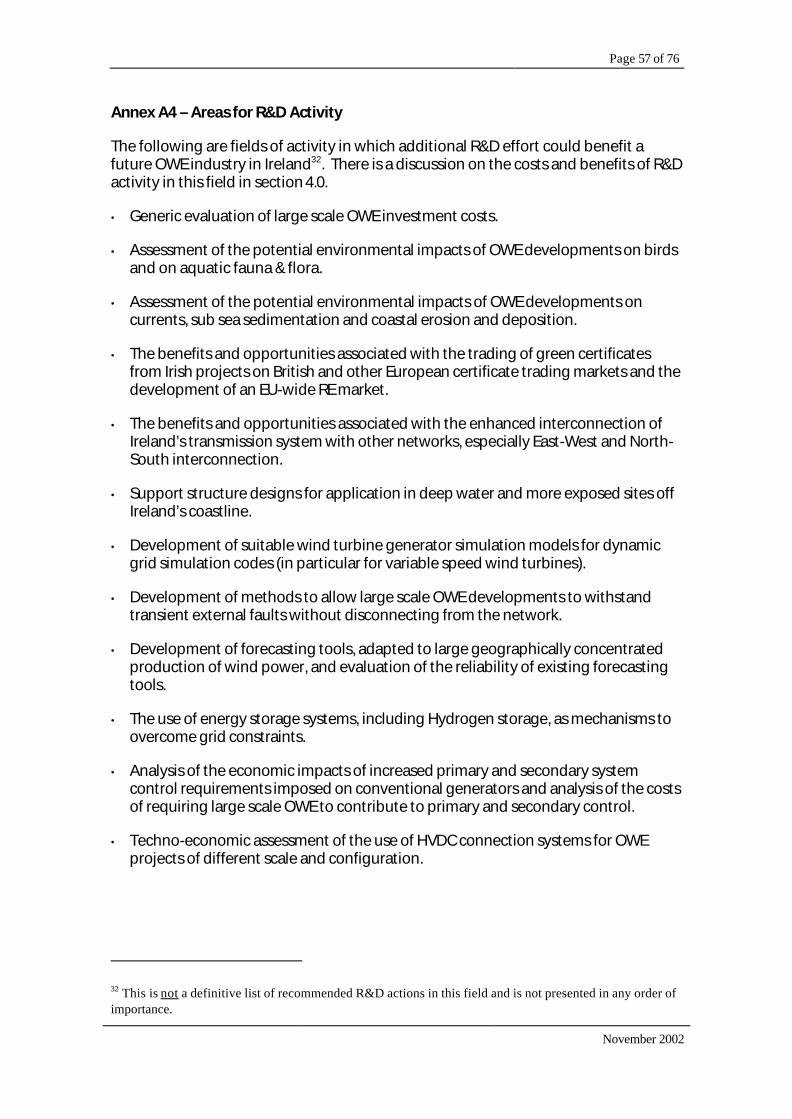
Page 57 of 76
November 2002
Annex A4 – Areas for R&D Activity
The following are fields of activity in which additional R&D effort could benefit a future OWE industry in Ireland32. There is a discussion on the costs and benefits of R&D activity in this field in section 4.0.
• Generic evaluation of large scale OWE investment costs.
• Assessment of the potential environmental impacts of OWE developments on birds and on aquatic fauna & flora.
• Assessment of the potential environmental impacts of OWE developments on currents, sub sea sedimentation and coastal erosion and deposition.
• The benefits and opportunities associated with the trading of green certificates from Irish projects on British and other European certificate trading markets and the development of an EU-wide RE market.
• The benefits and opportunities associated with the enhanced interconnection of Ireland’s transmission system with other networks, especially East-West and North-South interconnection.
• Support structure designs for application in deep water and more exposed sites off Ireland’s coastline.
• Development of suitable wind turbine generator simulation models for dynamic grid simulation codes (in particular for variable speed wind turbines).
• Development of methods to allow large scale OWE developments to withstand transient external faults without disconnecting from the network.
• Development of forecasting tools, adapted to large geographically concentrated production of wind power, and evaluation of the reliability of existing forecasting tools.
• The use of energy storage systems, including Hydrogen storage, as mechanisms to overcome grid constraints.
• Analysis of the economic impacts of increased primary and secondary system control requirements imposed on conventional generators and analysis of the costs of requiring large scale OWE to contribute to primary and secondary control.
• Techno-economic assessment of the use of HVDC connection systems for OWE projects of different scale and configuration.
32 This is not a definitive list of recommended R&D actions in this field and is not presented in any order of importance.
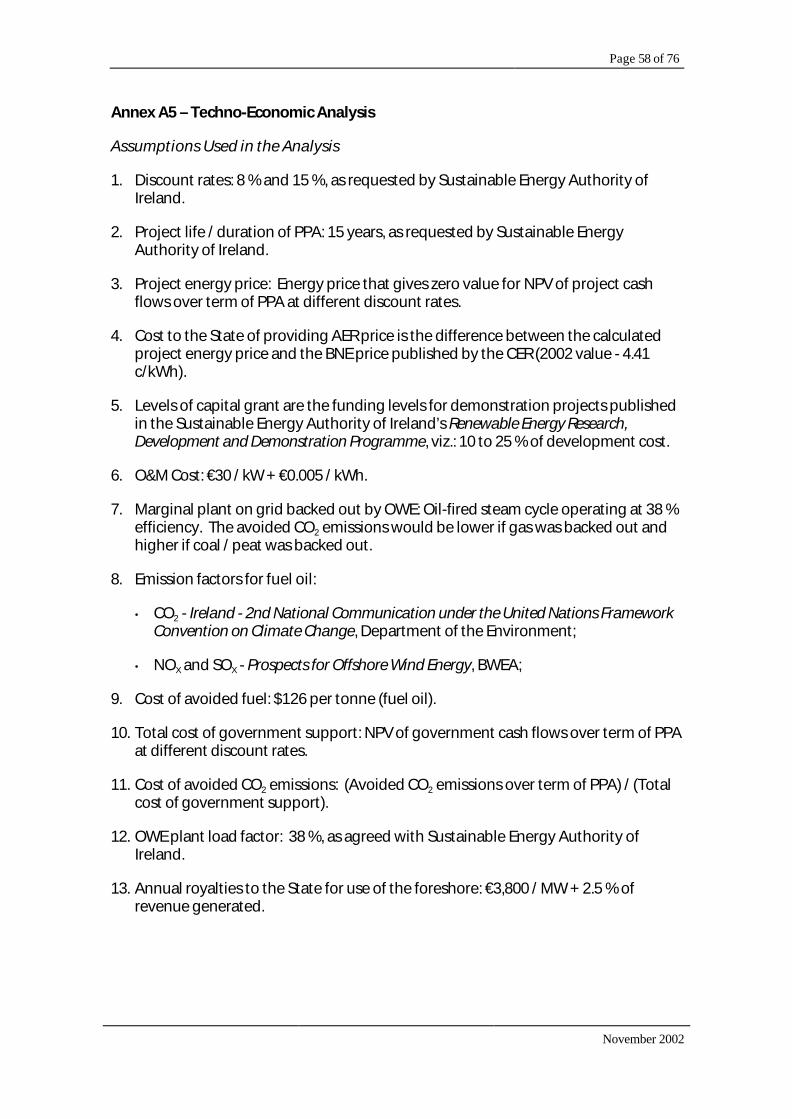
Page 58 of 76
November 2002
Annex A5 – Techno-Economic Analysis
Assumptions Used in the Analysis
1. Discount rates: 8 % and 15 %, as requested by Sustainable Energy Authority of Ireland.
2. Project life / duration of PPA: 15 years, as requested by Sustainable Energy Authority of Ireland.
3. Project energy price: Energy price that gives zero value for NPV of project cash flows over term of PPA at different discount rates.
4. Cost to the State of providing AER price is the difference between the calculated project energy price and the BNE price published by the CER (2002 value - 4.41 c/kWh).
5. Levels of capital grant are the funding levels for demonstration projects published in the Sustainable Energy Authority of Ireland’s Renewable Energy Research, Development and Demonstration Programme, viz.: 10 to 25 % of development cost.
6. O&M Cost: €30 / kW + €0.005 / kWh.
7. Marginal plant on grid backed out by OWE: Oil-fired steam cycle operating at 38 % efficiency. The avoided CO2 emissions would be lower if gas was backed out and higher if coal / peat was backed out.
8. Emission factors for fuel oil:
• CO2 - Ireland - 2nd National Communication under the United Nations Framework Convention on Climate Change, Department of the Environment;
• NOX and SOX - Prospects for Offshore Wind Energy, BWEA;
9. Cost of avoided fuel: $126 per tonne (fuel oil).
10. Total cost of government support: NPV of government cash flows over term of PPA at different discount rates.
11. Cost of avoided CO2 emissions: (Avoided CO2 emissions over term of PPA) / (Total cost of government support).
12. OWE plant load factor: 38 %, as agreed with Sustainable Energy Authority of Ireland.
13. Annual royalties to the State for use of the foreshore: €3,800 / MW + 2.5 % of revenue generated.
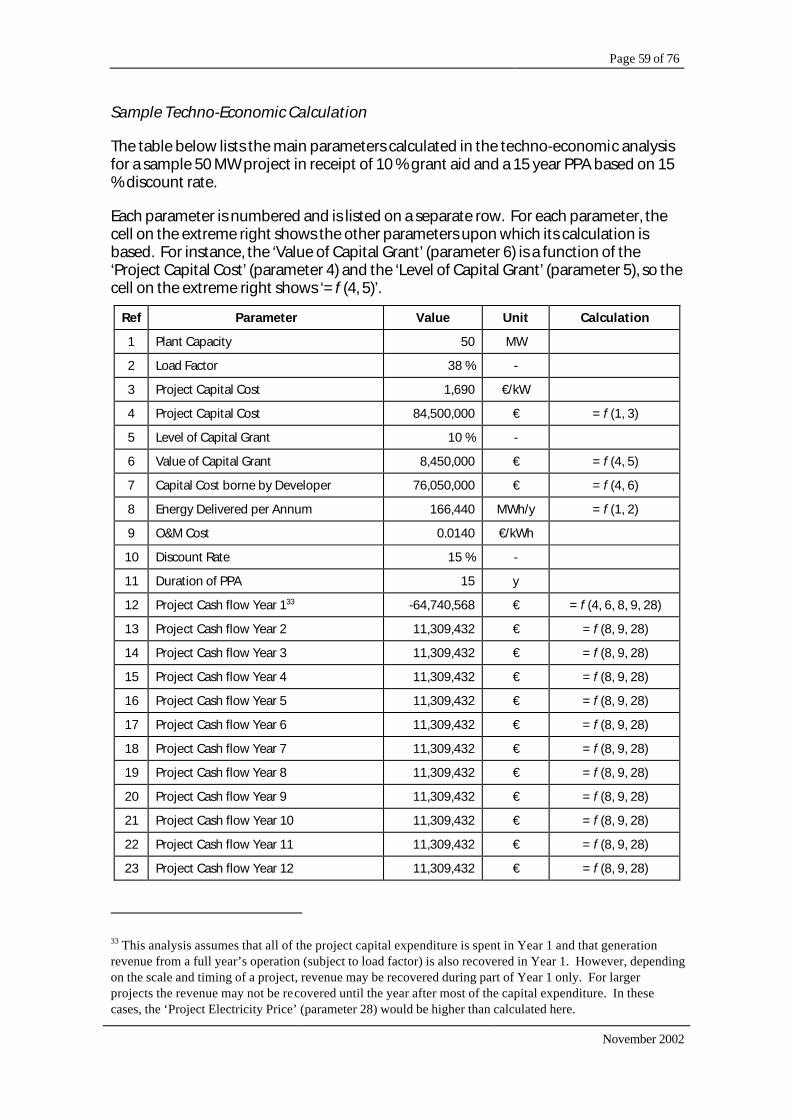
Page 59 of 76
November 2002
Sample Techno-Economic Calculation
The table below lists the main parameters calculated in the techno-economic analysis for a sample 50 MW project in receipt of 10 % grant aid and a 15 year PPA based on 15 % discount rate.
Each parameter is numbered and is listed on a separate row. For each parameter, the cell on the extreme right shows the other parameters upon which its calculation is based. For instance, the ‘Value of Capital Grant’ (parameter 6) is a function of the ‘Project Capital Cost’ (parameter 4) and the ‘Level of Capital Grant’ (parameter 5), so the cell on the extreme right shows ‘= f (4, 5)’.
Ref Parameter Value Unit Calculation
1 Plant Capacity 50 MW
2 Load Factor 38 % -
3 Project Capital Cost 1,690 €/kW
4 Project Capital Cost 84,500,000 € = f (1, 3)
5 Level of Capital Grant 10 % -
6 Value of Capital Grant 8,450,000 € = f (4, 5)
7 Capital Cost borne by Developer 76,050,000 € = f (4, 6)
8 Energy Delivered per Annum 166,440 MWh/y = f (1, 2)
9 O&M Cost 0.0140 €/kWh
10 Discount Rate 15 % -
11 Duration of PPA 15 y
12 Project Cash flow Year 133 -64,740,568 € = f (4, 6, 8, 9, 28)
13 Project Cash flow Year 2 11,309,432 € = f (8, 9, 28)
14 Project Cash flow Year 3 11,309,432 € = f (8, 9, 28)
15 Project Cash flow Year 4 11,309,432 € = f (8, 9, 28)
16 Project Cash flow Year 5 11,309,432 € = f (8, 9, 28)
17 Project Cash flow Year 6 11,309,432 € = f (8, 9, 28)
18 Project Cash flow Year 7 11,309,432 € = f (8, 9, 28)
19 Project Cash flow Year 8 11,309,432 € = f (8, 9, 28)
20 Project Cash flow Year 9 11,309,432 € = f (8, 9, 28)
21 Project Cash flow Year 10 11,309,432 € = f (8, 9, 28)
22 Project Cash flow Year 11 11,309,432 € = f (8, 9, 28)
23 Project Cash flow Year 12 11,309,432 € = f (8, 9, 28)
33 This analysis assumes that all of the project capital expenditure is spent in Year 1 and that generation revenue from a full year’s operation (subject to load factor) is also recovered in Year 1. However, depending on the scale and timing of a project, revenue may be recovered during part of Year 1 only. For larger projects the revenue may not be recovered until the year after most of the capital expenditure. In these cases, the ‘Project Electricity Price’ (parameter 28) would be higher than calculated here.

Page 60 of 76
November 2002
Ref Parameter Value Unit Calculation
24 Project Cash flow Year 13 11,309,432 € = f (8, 9, 28)
25 Project Cash flow Year 14 11,309,432 € = f (8, 9, 28)
26 Project Cash flow Year 15 11,309,432 € = f (8, 9, 28)
27 NPV (Cash Flows Years 1 - 15) 0 € = f (10, 12 - 26)
28 Project Electricity Price 0.08523 €/kWh = f (27)
29 CER BNE Energy Price 0.0441 €/kWh
30 Cost of PPA per Unit 0.04113 €/kWh = f (28, 29)
31 Cost of PPA per Annum 6,846,285 €/y = f (8, 30)
32 Efficiency of Displaced Generation 38 % -
33 Avoided Fuel Import 39,919 Mg = f (8, 32, Calorific Value of Fuel Oil)
34 Cost of Avoided Fuel Import 126 $/Mg
35 Cost of Avoided Fuel Import per Annum 5,132,441 €/y = f (33, 34)
36 Royalty Payable per Annum 544,657 €/y = f (1, 8, 28)
37 CO2 Emission Factor for Fuel Oil 0.72 Mg/MWh
38 Avoided CO2 per Annum 119,837 Mg/y
39 Avoided CO2 over term of PPA 1,797,552 Mg = f (11, 38)
40 Government Cash Flow Year 1 -15,296,285 € = f (6, 31)
41 Government Cash Flow Year 2 -6,846,285 € = f (31)
42 Government Cash Flow Year 3 -6,846,285 € = f (31)
43 Government Cash Flow Year 4 -6,846,285 € = f (31)
44 Government Cash Flow Year 5 -6,846,285 € = f (31)
45 Government Cash Flow Year 6 -6,846,285 € = f (31)
46 Government Cash Flow Year 7 -6,846,285 € = f (31)
47 Government Cash Flow Year 8 -6,846,285 € = f (31)
48 Government Cash Flow Year 9 -6,846,285 € = f (31)
49 Government Cash Flow Year 10 -6,846,285 € = f (31)
50 Government Cash Flow Year 11 -6,846,285 € = f (31)
51 Government Cash Flow Year 12 -6,846,285 € = f (31)
52 Government Cash Flow Year 13 -6,846,285 € = f (31)
53 Government Cash Flow Year 14 -6,846,285 € = f (31)
54 Government Cash Flow Year 15 -6,846,285 € = f (31)
55 Government Cash Flow Year 1 -6,846,285 € = f (31)
56 NPV (Cash Flows Years 1 - 15) -47,380,590 € = f (10, 40 - 55)
57 Cost of Avoided CO2 26 €/Mg = f (39, 56)

Page 61 of 76
November 2002
Annex A6 – Indicative Direct Costs & Benefits of OWE Demonstration Projects
5 MW Demonstration Project(s)
Direct Costs
Indicative costs to the State of providing capital grant and AER type PPA support for 5 MW demonstration projects are set out in Tables A6.1 to A6.3. The costs to the State are presented for a range of potential project capital costs and levels of funding. Due to the very small scale involved the potential investment costs for ~5 MW projects will be relatively high and could vary widely between different sites. The different capital cost estimates considered are:
• €2,050 / kW - upper value in DPE / DETI Assessment of Offshore Wind Energy Resources.
• €6,000 / kW and €10,000 / kW - IWEA estimates for development costs of transmission connected 2-unit OWE project in Irish waters.
Table A6.1: Costs of Providing a 15 Year PPA to a 5 MW Project
Energy Price Required Direct Cost of PPAs to the State per annum Project
Capital Cost
Cost of Grant Support 8 %
Discount Rate
15 % Discount
Rate
8 % Discount
Rate
15 % Discount
Rate
[€/kW] [€] [c/kWh] [c/kWh] [€/y] [€/y]
2,050 0 8.387 10.947 661,916 1,088,053
6,000 0 21.552 29.046 2,853,164 4,100,394
10,000 0 34.884 47.374 5,072,149 7,150,865
Table A6.2: Costs of Providing 10 % Grant and 15 Year PPA to a 5 MW Project
Energy Price Required Direct Cost of PPAs to the State per annum Project
Capital Cost
Cost of Grant Support 8 %
Discount Rate
15 % Discount
Rate
8 % Discount
Rate
15 % Discount
Rate
[€/kW] [€] [c/kWh] [c/kWh] [c/kWh] [€/y]
2,050 1,025,000 7.704 10.008 548,193 931,717
6,000 3,000,000 19.552 26.297 2,520,316 3,642,823
10,000 5,000,000 31.551 42.792 4,517,402 6,388,247

Page 62 of 76
November 2002
Table A6.3: Costs of Providing 25 % Grant and 15 Year PPA to a 5 MW Project
Energy Price Required Direct Cost of PPAs to the State per annum Project
Capital Cost
Cost of Grant Support 8 %
Discount Rate
15 % Discount
Rate
8 % Discount
Rate
15 % Discount
Rate
[€/kW] [€] [c/kWh] [c/kWh] [€/y] [€/y]
2,050 2,562,500 6.679 8.599 377,609 697,212
6,000 7,500,000 16.553 22.173 2,021,045 2,956,467
10,000 12,500,000 26.552 35.919 3,685,283 5,244,321

Page 63 of 76
November 2002
Direct Benefits
Indicative values for the cost to the State per tonne of CO2 saved on an NPV basis and the annual royalty payable to the State are set out in Tables A6.4 to A6.6 below for 5 MW projects in receipt of 0 %, 10 % and 25 % grant support and 15 year PPAs.
Table A6.4: Benefits of Providing a15 Year PPA to a 5 MW Project
Cost to State per Tonne of CO2 Saved (NPV Basis)
Royalties to the State per annum Project
Capital Cost
Tonnes of CO2 Saved per
Annum 8 %
Discount Rate
15 % Discount
Rate
8 % Discount
Rate
15 % Discount
Rate
[€/kW] [Tonne] [€/Tonne] [€/Tonne] [€/y] [€/y]
2,050 12,000 32 35 53,898 64,551
6,000 12,000 136 133 108,679 139,860
10,000 12,000 242 233 164,154 216,122
Table A6.5: Benefits of Providing 10 % Grant and 15 Year PPA to a 5 MW Project
Cost to State per Tonne of CO2 Saved (NPV Basis)
Royalties to the State per annum Project
Capital Cost
Tonnes of CO2 Saved per
Annum 8 %
Discount Rate
15 % Discount
Rate
8 % Discount
Rate
15 % Discount
Rate
[€/kW] [Tonne] [€/Tonne] [€/Tonne] [€/y] [€/y]
2,050 12,000 31 35 51,055 60,643
6,000 12,000 135 133 100,358 128,421
10,000 12,000 241 232 150,285 197,056
Table A6.6: Benefits of Providing 25 % Grant and 15 Year PPA to a 5 MW Project
Cost to State per Tonne of CO2 Saved (NPV Basis)
Royalties to the State per annum Project
Capital Cost
Tonnes of CO2 Saved per
Annum 8 %
Discount Rate
15 % Discount
Rate
8 % Discount
Rate
15 % Discount
Rate
[€/kW] [Tonne] [€/Tonne] [€/Tonne] [€/y] [€/y]
2,050 12,000 31 35 46,790 54,780
6,000 12,000 135 132 87,876 111,262
10,000 12,000 240 231 129,482 168,458
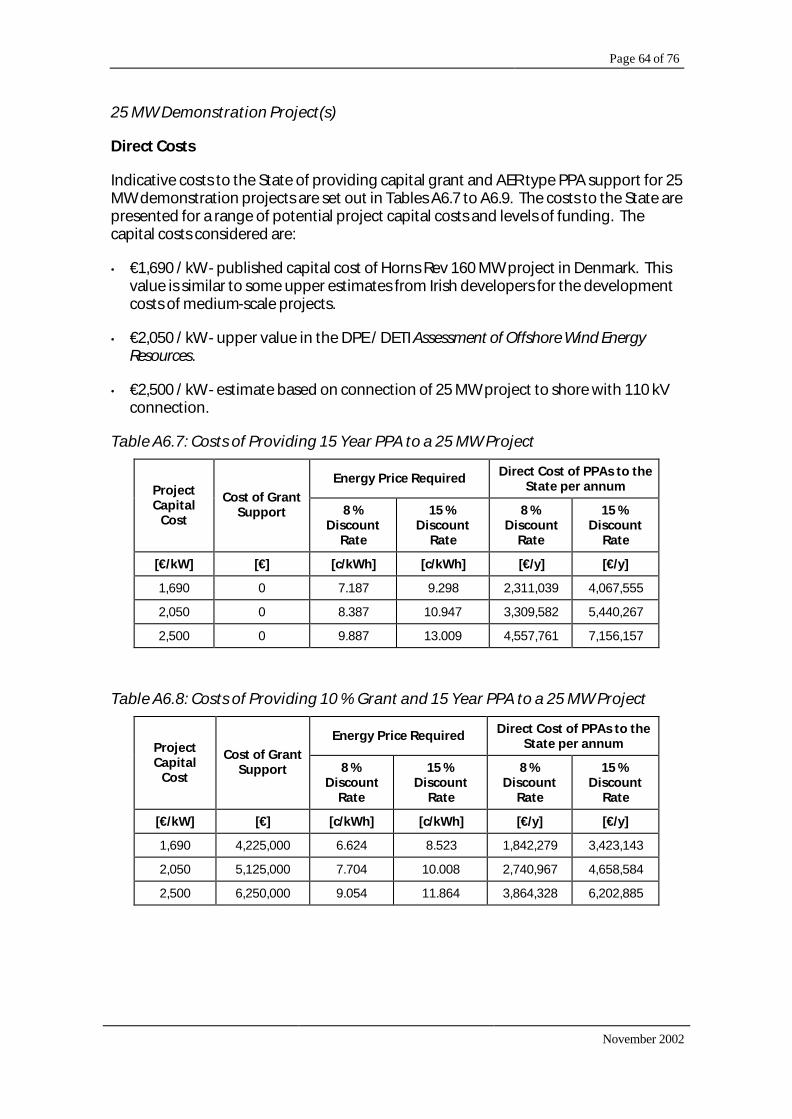
Page 64 of 76
November 2002
25 MW Demonstration Project(s)
Direct Costs
Indicative costs to the State of providing capital grant and AER type PPA support for 25 MW demonstration projects are set out in Tables A6.7 to A6.9. The costs to the State are presented for a range of potential project capital costs and levels of funding. The capital costs considered are:
• €1,690 / kW - published capital cost of Horns Rev 160 MW project in Denmark. This value is similar to some upper estimates from Irish developers for the development costs of medium-scale projects.
• €2,050 / kW - upper value in the DPE / DETI Assessment of Offshore Wind Energy Resources.
• €2,500 / kW - estimate based on connection of 25 MW project to shore with 110 kV connection.
Table A6.7: Costs of Providing 15 Year PPA to a 25 MW Project
Energy Price Required Direct Cost of PPAs to the State per annum Project
Capital Cost
Cost of Grant Support 8 %
Discount Rate
15 % Discount
Rate
8 % Discount
Rate
15 % Discount
Rate
[€/kW] [€] [c/kWh] [c/kWh] [€/y] [€/y]
1,690 0 7.187 9.298 2,311,039 4,067,555
2,050 0 8.387 10.947 3,309,582 5,440,267
2,500 0 9.887 13.009 4,557,761 7,156,157
Table A6.8: Costs of Providing 10 % Grant and 15 Year PPA to a 25 MW Project
Energy Price Required Direct Cost of PPAs to the State per annum Project
Capital Cost
Cost of Grant Support 8 %
Discount Rate
15 % Discount
Rate
8 % Discount
Rate
15 % Discount
Rate
[€/kW] [€] [c/kWh] [c/kWh] [€/y] [€/y]
1,690 4,225,000 6.624 8.523 1,842,279 3,423,143
2,050 5,125,000 7.704 10.008 2,740,967 4,658,584
2,500 6,250,000 9.054 11.864 3,864,328 6,202,885

Page 65 of 76
November 2002
Table A6.9: Costs of Providing 25 % Grant and 15 Year PPA to a 25 MW Project
Energy Price Required Direct Cost of PPAs to the State per annum Project
Capital Cost
Cost of Grant Support 8 %
Discount Rate
15 % Discount
Rate
8 % Discount
Rate
15 % Discount
Rate
[€/kW] [€] [c/kWh] [c/kWh] [€/y] [€/y]
1,690 10,562,500 5.779 7.362 1,139,138 2,456,525
2,050 12,812,500 6.679 8.599 1,888,045 3,486,059
2,500 15,625,000 7.804 10.145 2,824,179 4,772,976

Page 66 of 76
November 2002
Direct Benefits
Indicative values for the cost to the State per tonne of CO2 saved on an NPV basis and the annual royalty payable to the State are set out in Tables A6.10 to A6.12 below for 25 MW projects in receipt of 0 %, 10 % and 25 % grant support and 15 year PPAs.
Table A6.10: Benefits of Providing 15 Year PPA to a 25 MW Project
Cost to State per Tonne of CO2 Saved (NPV Basis)
Royalties to the State per annum Project
Capital Cost
Tonnes of CO2 Saved
per Annum 8 %
Discount Rate
15 % Discount
Rate
8 % Discount
Rate
15 % Discount
Rate
[€/kW] [Tonne] [€/Tonne] [€/Tonne] [€/y] [€/y]
1,690 60,000 22 26 244,526 288,439
2,050 60,000 32 35 269,490 322,757
2,500 60,000 43 47 300,694 365,654
Table A6.11: Benefits of Providing 10 % Grant and 15 Year PPA to a 25 MW Project
Cost to State per Tonne of CO2 Saved (NPV Basis)
Royalties to the State per annum Project
Capital Cost
Tonnes of CO2 Saved
per Annum 8 %
Discount Rate
15 % Discount
Rate
8 % Discount
Rate
15 % Discount
Rate
[€/kW] [Tonne] [€/Tonne] [€/Tonne] [€/y] [€/y]
1,690 60,000 22 26 232,807 272,329
2,050 60,000 31 35 255,274 303,215
2,500 60,000 43 46 283,358 341,822
Table A6.12: Benefits of Providing 25 % Grant and 15 Year PPA to a 25 MW Project
Cost to State per Tonne of CO2 Saved (NPV Basis)
Royalties to the State per annum Project
Capital Cost
Tonnes of CO2 Saved
per Annum 8 %
Discount Rate
15 % Discount
Rate
8 % Discount
Rate
15 % Discount
Rate
[€/kW] [Tonne] [€/Tonne] [€/Tonne] [€/y] [€/y]
1,690 60,000 22 26 215,228 248,163
2,050 60,000 31 35 233,951 273,902
2,500 60,000 43 46 257,355 306,074

Page 67 of 76
November 2002
50 MW Demonstration Project(s)
Direct Costs
Indicative costs to the State of providing capital grant and AER type PPA support for 50 MW demonstration projects are set out in Tables A6.13 to A6.15. The costs to the State are presented for a range of potential project capital costs and levels of funding. The capital costs considered are:
• €1,420 / kW - lower value in the DPE / DETI Assessment of Offshore Wind Energy Resources. This is similar to some lower estimates from Irish developers for the development costs of medium-scale projects.
• €1,690 / kW - published capital cost for the Horns Rev 160 MW project in Denmark. This is similar to some upper estimates from Irish developers for the development costs of large-scale projects.
• €2,050 / kW - upper value in the DPE / DETI Assessment of Offshore Wind Energy Resources.
Table A6.13: Costs of Providing 15 Year PPA to a 50 MW Project
Energy Price Required Direct Cost of PPAs to the State per annum Project
Capital Cost
Cost of Grant Support 8 %
Discount Rate
15 % Discount
Rate
8 % Discount
Rate
15 % Discount
Rate
[€/kW] [€] [c/kWh] [c/kWh] [€/y] [€/y]
1,420 0 6.287 8.061 3,124,264 6,076,041
1,690 0 7.187 9.298 4,622,078 8,135,109
2,050 0 8.387 10.947 6,619,164 10,880,534
Table A6.14: Costs of Providing 10 % Grant and 15 Year PPA to a 50 MW Project
Energy Price Required Direct Cost of PPAs to the State per annum Project
Capital Cost
Cost of Grant Support 8 %
Discount Rate
15 % Discount
Rate
8 % Discount
Rate
15 % Discount
Rate
[€/kW] [€] [c/kWh] [c/kWh] [€/y] [€/y]
1,420 7,100,000 5.814 7.410 2,336,524 4,993,124
1,690 8,450,000 6.624 8.523 3,684,557 6,846,285
2,050 10,250,000 7.704 10.008 5,481,935 9,317,167

Page 68 of 76
November 2002
Table A6.15: Costs of Providing 25 % Grant and 15 Year PPA to a 50 MW Project
Energy Price Required Direct Cost of PPAs to the State per annum Project
Capital Cost
Cost of Grant Support 8 %
Discount Rate
15 % Discount
Rate
8 % Discount
Rate
15 % Discount
Rate
[€/kW] [€] [c/kWh] [c/kWh] [€/y] [€/y]
1,420 17,750,000 5.104 6.434 1,154,915 3,368,748
1,690 21,125,000 5.779 7.362 2,278,276 4,913,049
2,050 25,625,000 6.679 8.599 3,776,090 6,972,117

Page 69 of 76
November 2002
Direct Benefits
Indicative values for the cost to the State per tonne of CO2 saved on an NPV basis and the annual royalty payable to the State are set out in Tables A6.16 to A6.18 below for 50 MW projects in receipt of 0 %, 10 % and 25 % grant support and 15 year PPAs.
Table A6.16: Benefits of Providing 15 Year PPA to a 50 MW Project
Cost to State per Tonne of CO2 Saved (NPV Basis)
Royalties to the State per annum Project
Capital Cost
Tonnes of CO2 Saved
per Annum 8 %
Discount Rate
15 % Discount
Rate
8 % Discount
Rate
15 % Discount
Rate
[€/kW] [Tonne] [€/Tonne] [€/Tonne] [€/y] [€/y]
1,420 120,000 15 20 451,607 525,401
1,690 120,000 22 26 489,052 576,878
2,050 120,000 32 35 538,979 645,513
Table A6.17: Benefits of Providing 10 % Grant and 15 Year PPA to a 50 MW Project
Cost to State per Tonne of CO2 Saved (NPV Basis)
Royalties to the State per annum Project
Capital Cost
Tonnes of CO2 Saved
per Annum 8 %
Discount Rate
15 % Discount
Rate
8 % Discount
Rate
15 % Discount
Rate
[€/kW] [Tonne] [€/Tonne] [€/Tonne] [€/y] [€/y]
1,420 120,000 15 20 431,913 498,328
1,690 120,000 22 26 465,614 544,657
2,050 120,000 31 35 510,548 606,429
Table A6.18: Benefits of Providing 25 % Grant and 15 Year PPA to a 50 MW Project
Cost to State per Tonne of CO2 Saved (NPV Basis)
Royalties to the State per annum Project
Capital Cost
Tonnes of CO2 Saved
per Annum 8 %
Discount Rate
15 % Discount
Rate
8 % Discount
Rate
15 % Discount
Rate
[€/kW] [Tonne] [€/Tonne] [€/Tonne] [€/y] [€/y]
1,420 120,000 15 20 402,373 457,719
1,690 120,000 22 26 430,457 496,326
2,050 120,000 31 35 467,902 547,803
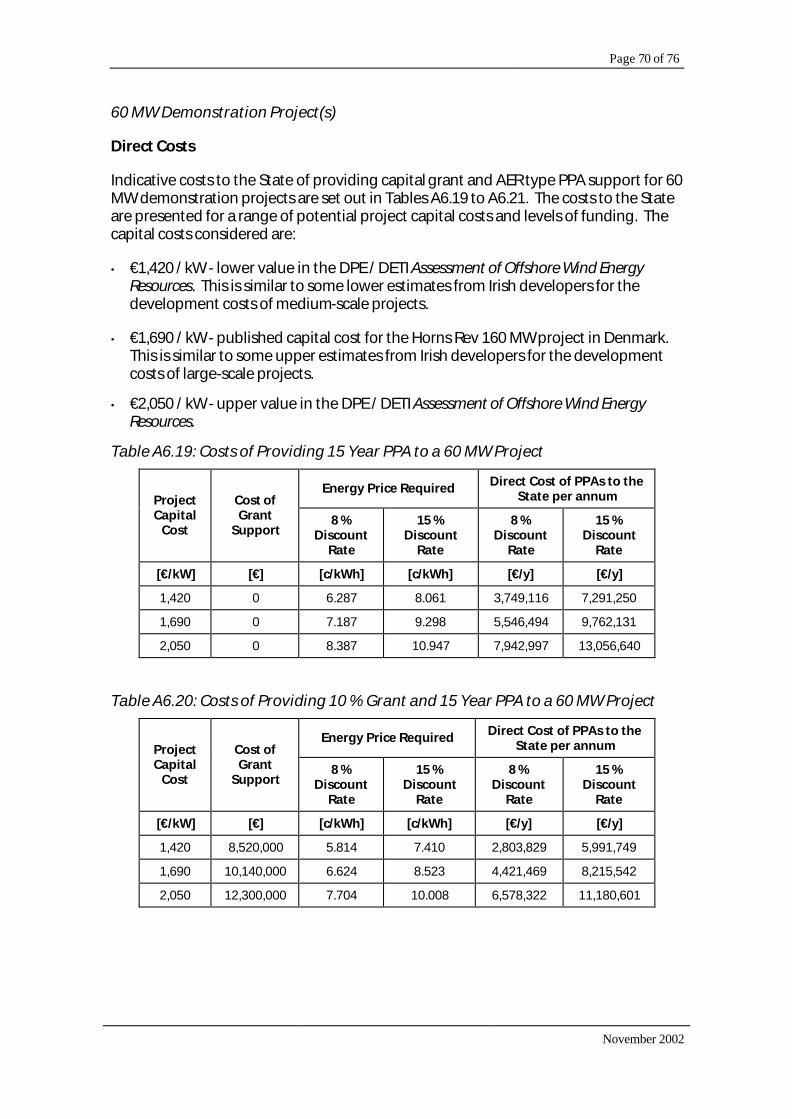
Page 70 of 76
November 2002
60 MW Demonstration Project(s)
Direct Costs
Indicative costs to the State of providing capital grant and AER type PPA support for 60 MW demonstration projects are set out in Tables A6.19 to A6.21. The costs to the State are presented for a range of potential project capital costs and levels of funding. The capital costs considered are:
• €1,420 / kW - lower value in the DPE / DETI Assessment of Offshore Wind Energy Resources. This is similar to some lower estimates from Irish developers for the development costs of medium-scale projects.
• €1,690 / kW - published capital cost for the Horns Rev 160 MW project in Denmark. This is similar to some upper estimates from Irish developers for the development costs of large-scale projects.
• €2,050 / kW - upper value in the DPE / DETI Assessment of Offshore Wind Energy Resources.
Table A6.19: Costs of Providing 15 Year PPA to a 60 MW Project
Energy Price Required Direct Cost of PPAs to the State per annum Project
Capital Cost
Cost of Grant
Support 8 %
Discount Rate
15 % Discount
Rate
8 % Discount
Rate
15 % Discount
Rate
[€/kW] [€] [c/kWh] [c/kWh] [€/y] [€/y]
1,420 0 6.287 8.061 3,749,116 7,291,250
1,690 0 7.187 9.298 5,546,494 9,762,131
2,050 0 8.387 10.947 7,942,997 13,056,640
Table A6.20: Costs of Providing 10 % Grant and 15 Year PPA to a 60 MW Project
Energy Price Required Direct Cost of PPAs to the State per annum Project
Capital Cost
Cost of Grant
Support 8 %
Discount Rate
15 % Discount
Rate
8 % Discount
Rate
15 % Discount
Rate
[€/kW] [€] [c/kWh] [c/kWh] [€/y] [€/y]
1,420 8,520,000 5.814 7.410 2,803,829 5,991,749
1,690 10,140,000 6.624 8.523 4,421,469 8,215,542
2,050 12,300,000 7.704 10.008 6,578,322 11,180,601

Page 71 of 76
November 2002
Table A6.21: Costs of Providing 25 % Grant and 15 Year PPA to a 60 MW Project
Energy Price Required Direct Cost of PPAs to the State per annum Project
Capital Cost
Cost of Grant
Support 8 %
Discount Rate
15 % Discount
Rate
8 % Discount
Rate
15 % Discount
Rate
[€/kW] [€] [c/kWh] [c/kWh] [c/kWh] [€/y]
1,420 21,300,000 5.104 6.434 1,385,897 4,042,497
1,690 25,350,000 5.779 7.362 2,733,931 5,895,569
2,050 30,750,000 6.679 8.599 4,531,308 8,366,541

Page 72 of 76
November 2002
Direct Benefits
Indicative values for the cost to the State per tonne of CO2 saved on an NPV basis and the annual royalty payable to the State are set out in Tables A6.22 to A6.24 below for 60 MW projects in receipt of 0 %, 10 % and 25 % grant support and 15 year PPAs.
Table A6.22: Benefits of Providing 15 Year PPA to a 60 MW Project
Cost to State per Tonne of CO2 Saved (NPV Basis)
Royalties to the State per annum Project
Capital Cost
Tonnes of CO2 Saved
per Annum 8 %
Discount Rate
15 % Discount
Rate
8 % Discount
Rate
15 % Discount
Rate
[€/kW] [Tonne] [€/Tonne] [€/Tonne] [€] [€]
1,420 144,000 15 20 541,928 630,481
1,690 144,000 22 26 586,862 692,253
2,050 144,000 32 35 646,775 774,616
Table A6.23: Benefits of Providing 10 % Grant and 15 Year PPA to a 60 MW Project
Cost to State per Tonne of CO2 Saved (NPV Basis)
Royalties to the State per annum Project
Capital Cost
Tonnes of CO2 Saved
per Annum 8 %
Discount Rate
15 % Discount
Rate
8 % Discount
Rate
15 % Discount
Rate
[€/kW] [Tonne] [€/Tonne] [€/Tonne] [€] [€]
1,420 144,000 15 20 518,296 597,994
1,690 144,000 22 26 558,737 653,589
2,050 144,000 31 35 612,658 727,715
Table A6.24: Benefits of Providing 25 % Grant and 15 Year PPA to a 60 MW Project
Cost to State per Tonne of CO2 Saved (NPV Basis)
Royalties to the State per annum Project
Capital Cost
Tonnes of CO2 Saved
per Annum 8 %
Discount Rate
15 % Discount
Rate
8 % Discount
Rate
15 % Discount
Rate
[€/kW] [Tonne] [€/Tonne] [€/Tonne] [€] [€]
1,420 144,000 15 20 482,848 549,263
1,690 144,000 22 26 516,548 595,592
2,050 144,000 31 35 561,483 657,364
In addition there would be 48,000 tonnes of fuel oil imports avoided per annum (€6.2 m) for each 60 MW project installed.

Page 73 of 76
November 2002
100 MW Demonstration Project(s)
Direct Costs
Indicative costs to the State of providing capital grant and AER type PPA support for 100 MW demonstration projects are set out in Tables A6.25 to A6.27. The costs to the State are presented for a range of potential project capital costs and levels of funding. The capital costs considered are:
• €1,420 / kW - lower value in the DPE / DETI Assessment of Offshore Wind Energy Resources. This is similar to some lower estimates from Irish developers for the development costs of medium-scale projects.
• €1,690 / kW - published capital cost for the Horns Rev 160 MW project in Denmark. This is similar to some upper estimates from Irish developers for the development costs of large-scale projects.
• €2,050 / kW - upper value in the DPE / DETI Assessment of Offshore Wind Energy Resources.
Table A6.25: Costs of Providing 15 Year PPA to a 100 MW Project
Energy Price Required Direct Cost of PPAs to the State per annum Project
Capital Cost
Cost of Grant Support 8 %
Discount Rate
15 % Discount
Rate
8 % Discount
Rate
15 % Discount
Rate
[€/kW] [€] [c/kWh] [c/kWh] [€/y] [€/y]
1,420 0 6.287 8.061 6,248,527 12,152,083
1,690 0 7.187 9.298 9,244,156 16,270,219
2,050 0 8.387 10.947 13,238,329 21,761,067
Table A6.26: Costs of Providing 10 % Grant and 15 Year PPA to a 100 MW Project
Energy Price Required Direct Cost of PPAs to the State per annum Project
Capital Cost
Cost of Grant Support 8 %
Discount Rate
15 % Discount
Rate
8 % Discount
Rate
15 % Discount
Rate
[€/kW] [€] [c/kWh] [c/kWh] [€/y] [€/y]
1,420 14,200,000 5.814 7.410 4,673,048 9,986,248
1,690 16,900,000 6.624 8.523 7,369,114 13,692,571
2,050 20,500,000 7.704 10.008 10,963,870 18,634,334

Page 74 of 76
November 2002
Table A6.27: Costs of Providing 25 % Grant and 15 Year PPA to a 100 MW Project
Energy Price Required Direct Cost of PPAs to the State per annum Project
Capital Cost
Cost of Grant Support 8 %
Discount Rate
15 % Discount
Rate
8 % Discount
Rate
15 % Discount
Rate
[€/kW] [€] [c/kWh] [c/kWh] [c/kWh] [€/y]
1,420 35,500,000 5.104 6.434 2,309,829 6,737,496
1,690 42,250,000 5.779 7.362 4,556,551 9,826,098
2,050 51,250,000 6.679 8.599 7,552,181 13,944,234
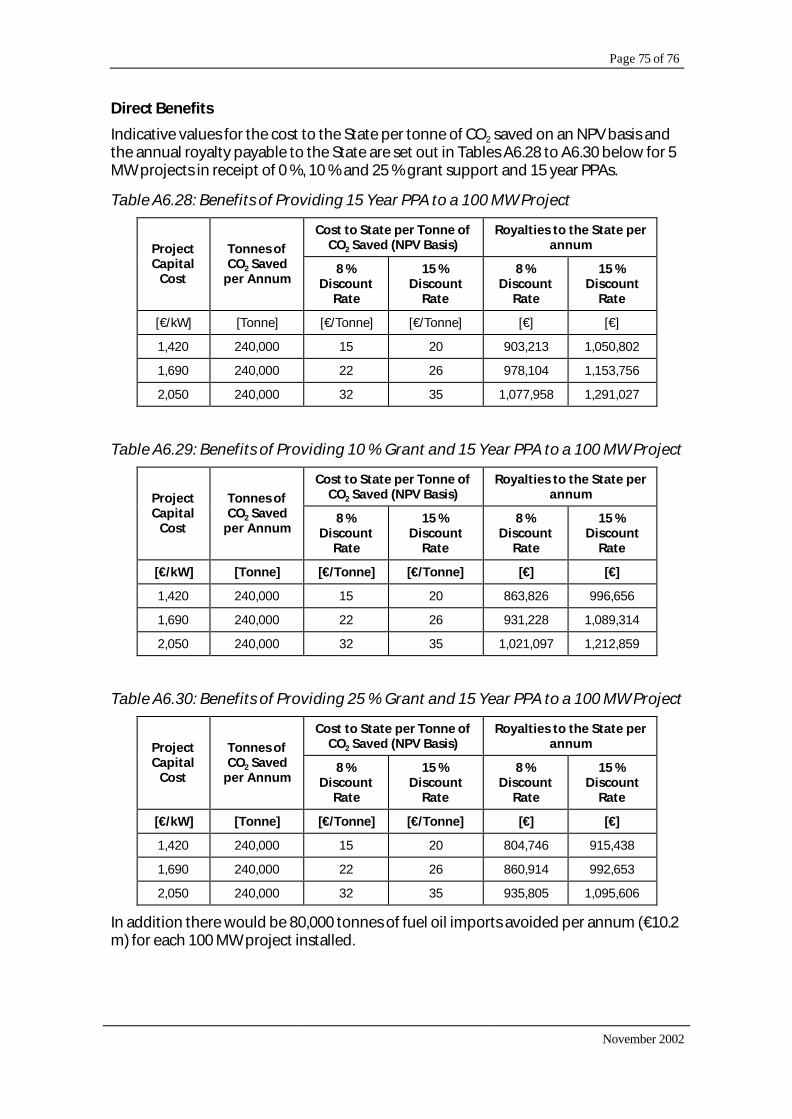
Page 75 of 76
November 2002
Direct Benefits
Indicative values for the cost to the State per tonne of CO2 saved on an NPV basis and the annual royalty payable to the State are set out in Tables A6.28 to A6.30 below for 5 MW projects in receipt of 0 %, 10 % and 25 % grant support and 15 year PPAs.
Table A6.28: Benefits of Providing 15 Year PPA to a 100 MW Project
Cost to State per Tonne of CO2 Saved (NPV Basis)
Royalties to the State per annum Project
Capital Cost
Tonnes of CO2 Saved
per Annum 8 %
Discount Rate
15 % Discount
Rate
8 % Discount
Rate
15 % Discount
Rate
[€/kW] [Tonne] [€/Tonne] [€/Tonne] [€] [€]
1,420 240,000 15 20 903,213 1,050,802
1,690 240,000 22 26 978,104 1,153,756
2,050 240,000 32 35 1,077,958 1,291,027
Table A6.29: Benefits of Providing 10 % Grant and 15 Year PPA to a 100 MW Project
Cost to State per Tonne of CO2 Saved (NPV Basis)
Royalties to the State per annum Project
Capital Cost
Tonnes of CO2 Saved
per Annum 8 %
Discount Rate
15 % Discount
Rate
8 % Discount
Rate
15 % Discount
Rate
[€/kW] [Tonne] [€/Tonne] [€/Tonne] [€] [€]
1,420 240,000 15 20 863,826 996,656
1,690 240,000 22 26 931,228 1,089,314
2,050 240,000 32 35 1,021,097 1,212,859
Table A6.30: Benefits of Providing 25 % Grant and 15 Year PPA to a 100 MW Project
Cost to State per Tonne of CO2 Saved (NPV Basis)
Royalties to the State per annum Project
Capital Cost
Tonnes of CO2 Saved
per Annum 8 %
Discount Rate
15 % Discount
Rate
8 % Discount
Rate
15 % Discount
Rate
[€/kW] [Tonne] [€/Tonne] [€/Tonne] [€] [€]
1,420 240,000 15 20 804,746 915,438
1,690 240,000 22 26 860,914 992,653
2,050 240,000 32 35 935,805 1,095,606
In addition there would be 80,000 tonnes of fuel oil imports avoided per annum (€10.2 m) for each 100 MW project installed.
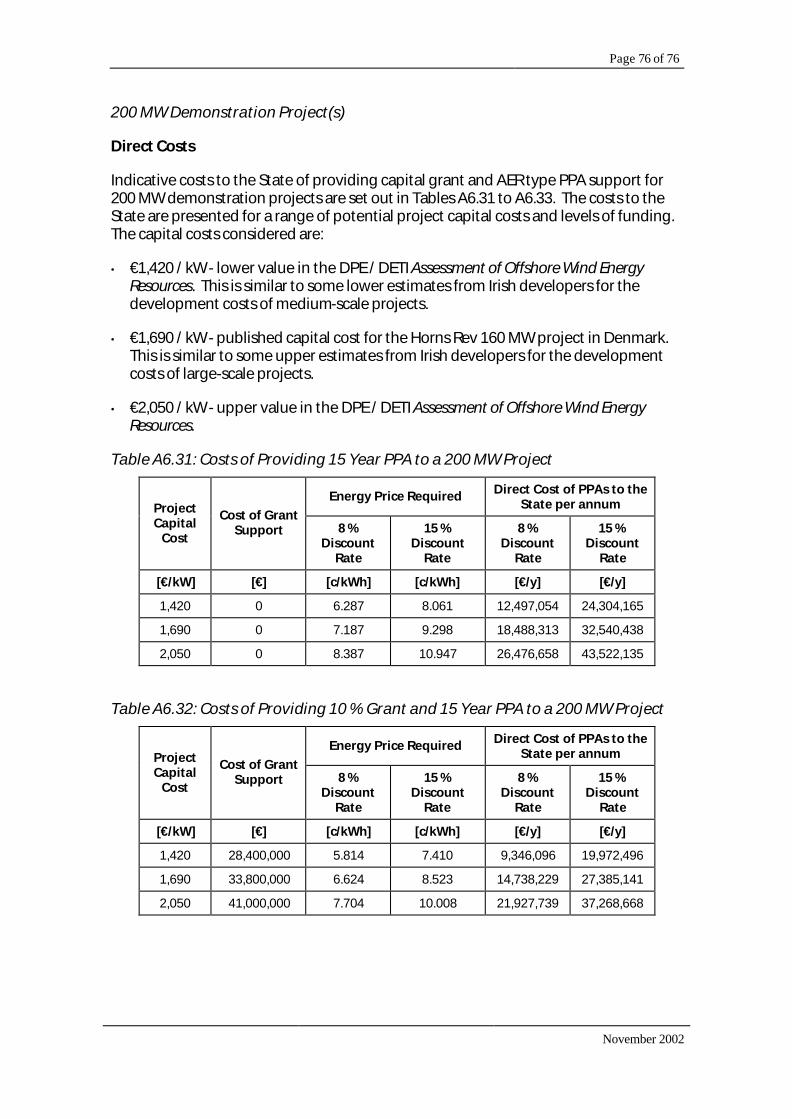
Page 76 of 76
November 2002
200 MW Demonstration Project(s)
Direct Costs
Indicative costs to the State of providing capital grant and AER type PPA support for 200 MW demonstration projects are set out in Tables A6.31 to A6.33. The costs to the State are presented for a range of potential project capital costs and levels of funding. The capital costs considered are:
• €1,420 / kW - lower value in the DPE / DETI Assessment of Offshore Wind Energy Resources. This is similar to some lower estimates from Irish developers for the development costs of medium-scale projects.
• €1,690 / kW - published capital cost for the Horns Rev 160 MW project in Denmark. This is similar to some upper estimates from Irish developers for the development costs of large-scale projects.
• €2,050 / kW - upper value in the DPE / DETI Assessment of Offshore Wind Energy Resources.
Table A6.31: Costs of Providing 15 Year PPA to a 200 MW Project
Energy Price Required Direct Cost of PPAs to the State per annum Project
Capital Cost
Cost of Grant Support 8 %
Discount Rate
15 % Discount
Rate
8 % Discount
Rate
15 % Discount
Rate
[€/kW] [€] [c/kWh] [c/kWh] [€/y] [€/y]
1,420 0 6.287 8.061 12,497,054 24,304,165
1,690 0 7.187 9.298 18,488,313 32,540,438
2,050 0 8.387 10.947 26,476,658 43,522,135
Table A6.32: Costs of Providing 10 % Grant and 15 Year PPA to a 200 MW Project
Energy Price Required Direct Cost of PPAs to the State per annum Project
Capital Cost
Cost of Grant Support 8 %
Discount Rate
15 % Discount
Rate
8 % Discount
Rate
15 % Discount
Rate
[€/kW] [€] [c/kWh] [c/kWh] [€/y] [€/y]
1,420 28,400,000 5.814 7.410 9,346,096 19,972,496
1,690 33,800,000 6.624 8.523 14,738,229 27,385,141
2,050 41,000,000 7.704 10.008 21,927,739 37,268,668

Page 77 of 76
November 2002
Table A6.33: Costs of Providing 25 % Grant and 15 Year PPA to a 200 MW Project
Energy Price Required Direct Cost of PPAs to the State per annum Project
Capital Cost
Cost of Grant Support 8 %
Discount Rate
15 % Discount
Rate
8 % Discount
Rate
15 % Discount
Rate
[€/kW] [€] [c/kWh] [c/kWh] [€/y] [€/y]
1,420 71,000,000 5.104 6.434 4,619,658 13,474,992
1,690 84,500,000 5.779 7.362 9,113,102 19,652,196
2,050 102,500,000 6.679 8.599 15,104,361 27,888,469

Page 78 of 76
November 2002
Direct Benefits
Indicative values for the cost to the State per tonne of CO2 saved on an NPV basis and the annual royalty payable to the State are set out in Tables A6.34 to A6.36 below for 5 MW projects in receipt of 0 %, 10 % and 25 % grant support and 15 year PPAs.
Table A6.34: Benefits of Providing 15 Year PPA to a 200 MW Project
Cost to State per Tonne of CO2 Saved (NPV Basis)
Royalties to the State per annum Project
Capital Cost
Tonnes of CO2 Saved
per Annum 8 %
Discount Rate
15 % Discount
Rate
8 % Discount
Rate
15 % Discount
Rate
[€/kW] [Tonne] [€/Tonne] [€/Tonne] [€] [€]
1,420 480,000 15 20 1,806,427 2,101,605
1,690 480,000 22 26 1,956,208 2,307,511
2,050 480,000 32 35 2,155,917 2,582,054
Table A6.35: Benefits of Providing 10 % Grant and 15 Year PPA to a 200 MW Project
Cost to State per Tonne of CO2 Saved (NPV Basis)
Royalties to the State per annum Project
Capital Cost
Tonnes of CO2 Saved
per Annum 8 %
Discount Rate
15 % Discount
Rate
8 % Discount
Rate
15 % Discount
Rate
[€/kW] [Tonne] [€/Tonne] [€/Tonne] [€] [€]
1,420 480,000 15 20 1,727,653 1,993,313
1,690 480,000 22 26 1,862,456 2,178,629
2,050 480,000 32 35 2,042,194 2,425,717
Table A6.36: Benefits of Providing 25 % Grant and 15 Year PPA to a 200 MW Project
Cost to State per Tonne of CO2 Saved (NPV Basis)
Royalties to the State per annum Project
Capital Cost
Tonnes of CO2 Saved per
Annum 8 %
Discount Rate
15 % Discount
Rate
8 % Discount
Rate
15 % Discount
Rate
[€/kW] [Tonne] [€/Tonne] [€/Tonne] [€] [€]
1,420 480,000 15 20 1,609,492 1,830,875
1,690 480,000 22 26 1,721,828 1,985,305
2,050 480,000 32 35 1,871,609 2,191,212
In addition there would be 160,000 tonnes of fuel oil imports avoided (€20.5 m) for each 200 MW project installed.