cost accounting manual - ca notes and study...
TRANSCRIPT

1 © For Suggestions &
STUDY NOTESSTUDY NOTESSTUDY NOTESSTUDY NOTES
Cost Accounting Manual
For Suggestions & Feedbacks, contact: ATAUSH SHAFI ([email protected])
STUDY NOTESSTUDY NOTESSTUDY NOTESSTUDY NOTES FOR COST FOR COST FOR COST FOR COST
ACCOUNTINGACCOUNTINGACCOUNTINGACCOUNTING
BYBYBYBY
ATAUSH SHAFIATAUSH SHAFIATAUSH SHAFIATAUSH SHAFI
Last Updated on: Tuesday, January 01
Cost Accounting Manual 2013
ATAUSH SHAFI ([email protected])
FOR COST FOR COST FOR COST FOR COST
January 01, 2013

Cost Accounting Manual 2013
2 © For Suggestions & Feedbacks, contact: ATAUSH SHAFI ([email protected])
Table of Contents
CIMA CIMA CIMA CIMA OFFICIAL TERMINOLOGYOFFICIAL TERMINOLOGYOFFICIAL TERMINOLOGYOFFICIAL TERMINOLOGY .................................................................................... 3
COST OF COST OF COST OF COST OF GOODS SOLD FORMULEGOODS SOLD FORMULEGOODS SOLD FORMULEGOODS SOLD FORMULE ................................................................................ 13
COST CLASSIFICATIONCOST CLASSIFICATIONCOST CLASSIFICATIONCOST CLASSIFICATION .................................................................................................. 17
PROCESS COSTINGPROCESS COSTINGPROCESS COSTINGPROCESS COSTING ........................................................................................................... 18
BYBYBYBY----PRODUCTPRODUCTPRODUCTPRODUCT ...................................................................................................................... 30
DECISION MAKINGDECISION MAKINGDECISION MAKINGDECISION MAKING ........................................................................................................... 35
BUDGETINGBUDGETINGBUDGETINGBUDGETING ........................................................................................................................ 66
STANDARD COSTINGSTANDARD COSTINGSTANDARD COSTINGSTANDARD COSTING ...................................................................................................... 76
MATERIAL COSTINGMATERIAL COSTINGMATERIAL COSTINGMATERIAL COSTING ...................................................................................................... 100
FACTORY OVERHEADFACTORY OVERHEADFACTORY OVERHEADFACTORY OVERHEAD ................................................................................................... 112
BREAK EVEN ANALYSISBREAK EVEN ANALYSISBREAK EVEN ANALYSISBREAK EVEN ANALYSIS .............................................................................................. 117
ABSORPTION/MARGINAL COSTINGABSORPTION/MARGINAL COSTINGABSORPTION/MARGINAL COSTINGABSORPTION/MARGINAL COSTING ........................................................................ 128
LABORLABORLABORLABOR ................................................................................................................................. 134
COST CYCLECOST CYCLECOST CYCLECOST CYCLE ...................................................................................................................... 139
JOB ORDER COSTINGJOB ORDER COSTINGJOB ORDER COSTINGJOB ORDER COSTING .................................................................................................... 148
PAST PAPERSPAST PAPERSPAST PAPERSPAST PAPERS ................................................................................................................... 150
IMPORTANT POINTS IN EACH PAST PAPERSIMPORTANT POINTS IN EACH PAST PAPERSIMPORTANT POINTS IN EACH PAST PAPERSIMPORTANT POINTS IN EACH PAST PAPERS ...................................................... 169
EXAM RUBRICEXAM RUBRICEXAM RUBRICEXAM RUBRIC .................................................................................................................. 173
Cost Accounting Manual 2013
3 © For Suggestions & Feedbacks, contact: ATAUSH SHAFI ([email protected])
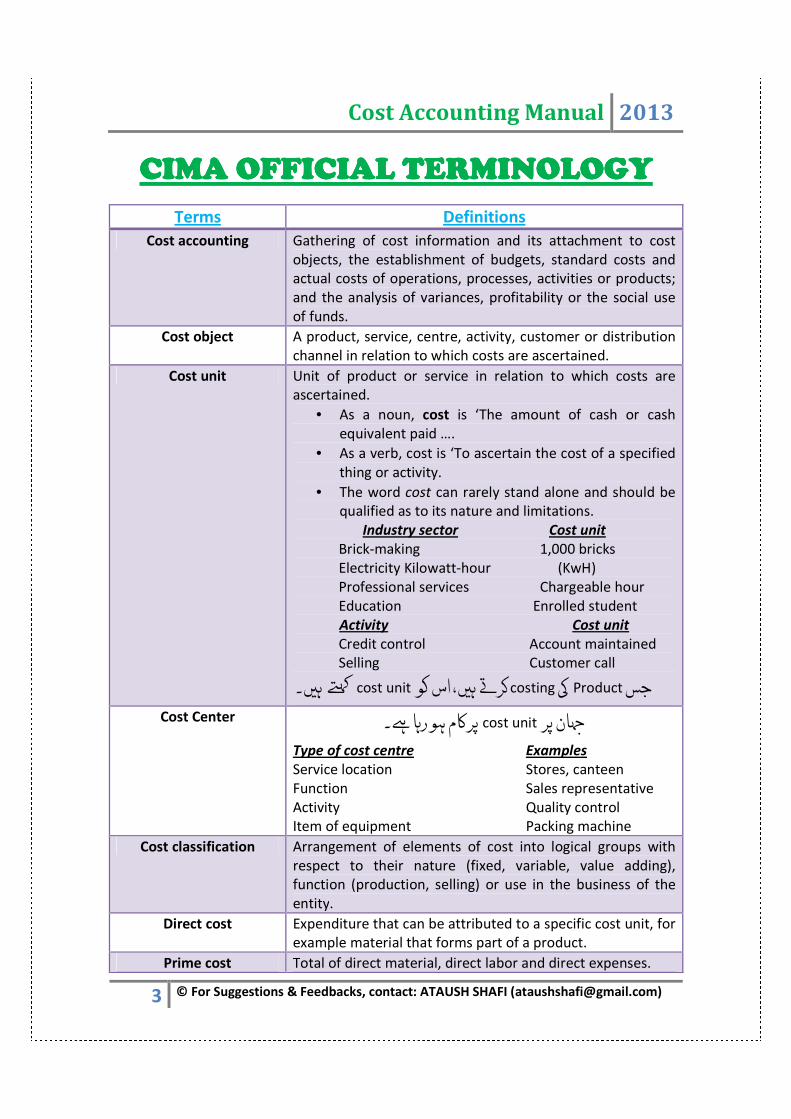
CIMA CIMA CIMA CIMA OFFICIAL TERMINOLOGYOFFICIAL TERMINOLOGYOFFICIAL TERMINOLOGYOFFICIAL TERMINOLOGY
Terms Definitions
Cost accounting Gathering of cost information and its attachment to cost
objects, the establishment of budgets, standard costs and
actual costs of operations, processes, activities or products;
and the analysis of variances, profitability or the social use
of funds.
Cost object A product, service, centre, activity, customer or distribution
channel in relation to which costs are ascertained.
Cost unit Unit of product or service in relation to which costs are
ascertained.
• As a noun, cost is ‘The amount of cash or cash
equivalent paid ….
• As a verb, cost is ‘To ascertain the cost of a specified
thing or activity.
• The word cost can rarely stand alone and should be
qualified as to its nature and limitations.
Industry sector Cost unit
Brick-making 1,000 bricks
Electricity Kilowatt-hour (KwH)
Professional services Chargeable hour
Education Enrolled student
Activity Cost unit
Credit control Account maintained
Selling Customer call
� �ð Product �� costing �� اس �� �� ���ö cost unit �� �� ���� Cost Center � ��ن �� �� cost unit ���� !�م �� ر�� ��
Type of cost centre Examples
Service location Stores, canteen
Function Sales representative
Activity Quality control
Item of equipment Packing machine
Cost classification Arrangement of elements of cost into logical groups with
respect to their nature (fixed, variable, value adding),
function (production, selling) or use in the business of the
entity.
Direct cost Expenditure that can be attributed to a specific cost unit, for
example material that forms part of a product.
Prime cost Total of direct material, direct labor and direct expenses.
Cost Accounting Manual 2013
4 © For Suggestions & Feedbacks, contact: ATAUSH SHAFI ([email protected])
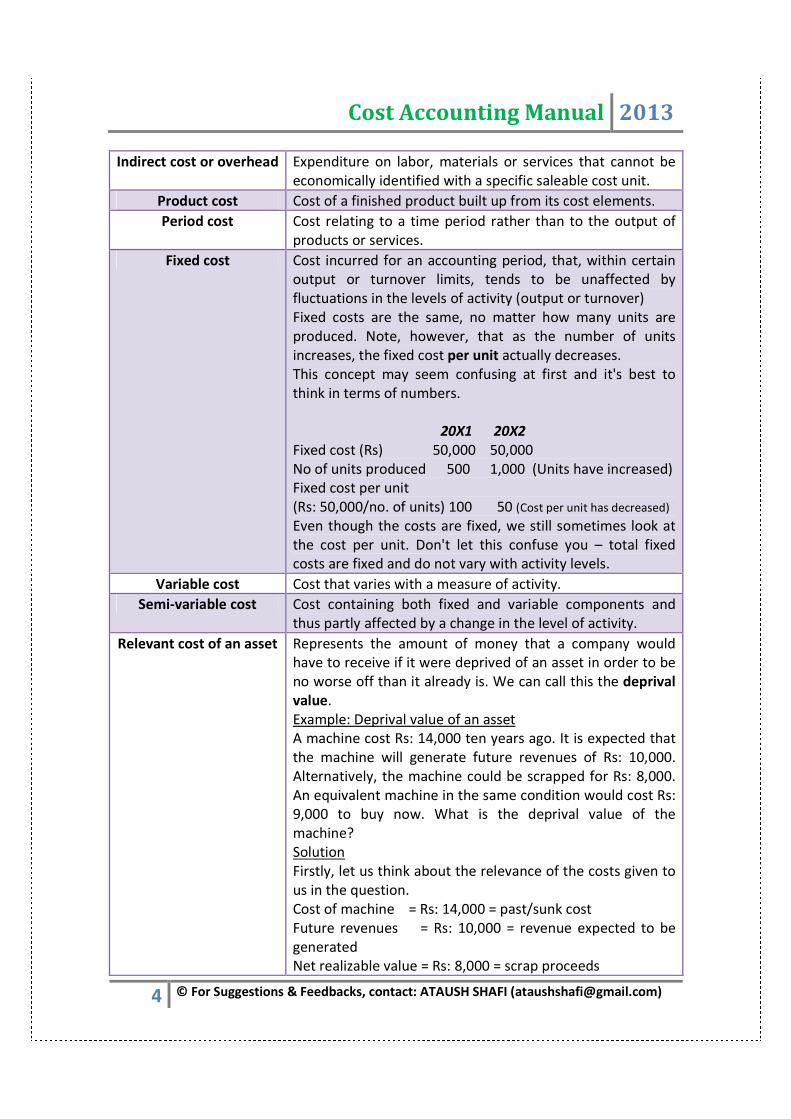
Indirect cost or overhead Expenditure on labor, materials or services that cannot be
economically identified with a specific saleable cost unit.
Product cost Cost of a finished product built up from its cost elements.
Period cost Cost relating to a time period rather than to the output of
products or services.
Fixed cost Cost incurred for an accounting period, that, within certain
output or turnover limits, tends to be unaffected by
fluctuations in the levels of activity (output or turnover)
Fixed costs are the same, no matter how many units are
produced. Note, however, that as the number of units
increases, the fixed cost per unit actually decreases.
This concept may seem confusing at first and it's best to
think in terms of numbers.
20X1 20X2
Fixed cost (Rs) 50,000 50,000
No of units produced 500 1,000 (Units have increased)
Fixed cost per unit
(Rs: 50,000/no. of units) 100 50 (Cost per unit has decreased)
Even though the costs are fixed, we still sometimes look at
the cost per unit. Don't let this confuse you – total fixed
costs are fixed and do not vary with activity levels.
Variable cost Cost that varies with a measure of activity.
Semi-variable cost Cost containing both fixed and variable components and
thus partly affected by a change in the level of activity.
Relevant cost of an asset Represents the amount of money that a company would
have to receive if it were deprived of an asset in order to be
no worse off than it already is. We can call this the deprival
value.
Example: Deprival value of an asset
A machine cost Rs: 14,000 ten years ago. It is expected that
the machine will generate future revenues of Rs: 10,000.
Alternatively, the machine could be scrapped for Rs: 8,000.
An equivalent machine in the same condition would cost Rs:
9,000 to buy now. What is the deprival value of the
machine?
Solution
Firstly, let us think about the relevance of the costs given to
us in the question.
Cost of machine = Rs: 14,000 = past/sunk cost
Future revenues = Rs: 10,000 = revenue expected to be
generated
Net realizable value = Rs: 8,000 = scrap proceeds

Cost Accounting Manual 2013
5 © For Suggestions & Feedbacks, contact: ATAUSH SHAFI ([email protected])
Replacement cost = Rs: 9,000
When calculating the deprival value of an asset, use the
following diagram.
LOWER OF
REPLACEMENT HIGHER OF
COST (Rs: 10,000)
(Rs: 9,000)
NRV EXPECTED REVENUES
(Rs: 8,000) (Rs: 10,000)
Therefore, the deprival value of the machine is the lower of
the replacement cost and Rs: 10,000. The deprival value is
therefore Rs: 9,000.
Relevant range Activity levels within which assumptions about cost
behavior in breakeven analysis remain valid
The relevant range also broadly represents the activity
levels at which an organization has had experience of
operating at in the past and for which cost information is
available. It can therefore be dangerous to attempt to
predict costs at activity levels which are outside the relevant
range.
Apportion To spread indirect revenues or costs over two or more cost
units, centers, accounts or time periods.
Re-apportion The re-spread of costs apportioned to service departments
to production departments.
Overhead absorption
rate
A means of attributing overhead to a product or service,
based for example on direct labour hours, direct labour cost
or machine hours. There are a number of different bases of
absorption (or 'overhead recovery rates') which can be
used. Examples are as follows.
1- A percentage of direct materials cost
2- A rate per machine hour
3- A percentage of direct labour cost
4- A rate per direct labour hour
5- A percentage of prime cost
6- A rate per unit
Marginal cost Part of the cost of one unit of product or service that would
be avoided if the unit was not produced, or that would
increase if one extra unit were produced.
Contribution Sales value – variable cost of sales
Marginal (or variable)
costing
Assigns only variable costs to cost units while fixed costs are
written off as period costs.
FIFO (first in, first out) Used to price issues of goods or materials based on the cost

Cost Accounting Manual 2013
6 © For Suggestions & Feedbacks, contact: ATAUSH SHAFI ([email protected])
of the oldest units held, irrespective of the sequence in
which the actual issue of units held takes place. Closing
stock is, therefore, valued at the cost of the oldest
purchases.
LIFO (last in, first out) Used to price issues of goods or materials based on the cost
of the most recently received units. Cost of sales in the
income statement is, therefore, valued at the cost of the
most recent purchases.
Average cost Used to price issues of goods or materials at the weighted
average cost of all units held.
Cost-volume-profit
analysis (CVP
Study of the effects on future profit of changes in fixed cost,
variable cost, sales price, quantity and mix.
Breakeven point Level of activity at which there is neither profit nor loss.
C/S ratio (P/V ratio) A measure of how much contribution is earned from each
Rs: 1 of sales.
Margin of safety Indicates the percentage by which forecast revenue exceeds
or falls short of that required to break even.
As well as being interested in the breakeven point,
management may also be interested in the amount by
which actual sales can fall below anticipated sales without a
loss being incurred. This is the margin of safety.
Limiting factor or key
factor
Anything which limits the activity of an entity. An entity
seeks to optimize the benefit it obtains from the limiting
factor. Examples are a shortage of supply of a resource or a
restriction on sales demand at a particular price.
It is assumed in limiting factor analysis that management
wishes to maximize profit and that profit will be maximized
when contribution is maximized (given no change in fixed
cost expenditure incurred). In other words, marginal costing
ideas are applied.
Standard cost Planned unit cost of a product, component or service.
Standard costing Control technique that reports variances by comparing
actual costs to pre-set standards so facilitating action
through management by exception.
Management by
exception
Practice of concentrating on activities that require attention
and ignoring those which appear to be conforming to
expectations. Typically standard cost variances or variances
from budget are used to identify those activities that require
attention
Performance standard Ideal standards are based on the most favorable operating
conditions, with no wastage, no inefficiencies, no idle time
and no breakdowns. These standards are likely to have an

Cost Accounting Manual 2013
7 © For Suggestions & Feedbacks, contact: ATAUSH SHAFI ([email protected])
unfavorable motivational impact, because employees will
often feel that the goals are unattainable and not work so
hard.
Attainable standards are based on efficient (but not
perfect) operating conditions. Some allowance is made for
wastage, inefficiencies, machine breakdowns and fatigue. If
well-set they provide a useful psychological incentive, and
for this reason they should be introduced whenever
possible. The consent and co-operation of employees
involved in improving the standard are required.
Current standards are standards based on current working
conditions (current wastage, current inefficiencies). The
disadvantage of current standards is that they do not
attempt to improve on current levels of efficiency, which
may be poor and capable of significant improvement.
Basic standards are standards which are kept unaltered
over a long period of time, and may be out-of-date. They are
used to show changes in efficiency or performance over an
extended time period. Basic standards are perhaps the least
useful and least common type of standard in use.
Variance The difference between a planned, budgeted, or standard
cost and the actual cost incurred. The same comparisons
may be made for revenues.
Direct material total
variance
Measurement of the difference between the standard
material cost of the output produced and the actual
material cost incurred.
Direct material price
variance
Difference between the actual prices paid for the purchased
materials and their standard cost.
Direct material usage
variance
Measures efficiency in the use of material, by comparing
standard material usage for actual production with actual
material used, the difference is valued at standard cost.
Direct labor total
variance
Indicates the difference between the standard direct labor
cost of the output which has been produced and the actual
direct labor cost incurred.
Direct labor rate
variance
Indicates the actual cost of any change from the standard
labor rate of remuneration.
Direct labor efficiency
variance
Standard labor cost of any change from the standard level of
labor efficiency.
Direct labour idle time
variance
Occurs when the hours paid exceed the hours worked and
there is an extra cost caused by this idle time. Its
computation increases the accuracy of the labor efficiency
variance.

Cost Accounting Manual 2013
8 © For Suggestions & Feedbacks, contact: ATAUSH SHAFI ([email protected])
Variable production
overhead total variance
Measures the difference between variable overhead that
should be used for actual output and variable production
overhead actually used. Variable production overhead
expenditure variance Indicates the actual cost of any change from the standard
rate per hour.
Variable production OVH
efficiency variance
Standard variable overhead cost of any change from the
standard level of efficiency.
Sales price variance Change in revenue caused by the actual selling price
differing from that budgeted.
Sales volume
contribution variance
The sales volume variance in units is the difference between
the actual units sold and the budgeted quantity. This
variance in units can be valued in one of three ways:
• In terms of standard revenue,
• Standard gross margin or
• Standard contribution margin.
(a) At the standard gross profit margin per unit. This is the
sales volume profit variance and it measures the change in
profit (in an absorption costing system) caused by the sales
volume differing from budget.
(b) At the standard contribution per unit. This is the sales
volume contribution variance and it measures the change
in profit (in a marginal costing system) caused by the sales
volume differing from budget.
(c) At the standard revenue per unit. This is the sales
volume revenue variance and it measures the change in
sales revenue caused by sales volume differing from that
budgeted.
Suppose that a company budgets to sell 8,000 units of
product J for Rs: 12 per unit. The standard variable cost per
unit is Rs: 4 and the standard full cost is Rs: 7 per unit.
Actual sales were 7,700 units, at Rs: 12.50 per unit.
The sales volume variance in units is 300 units adverse
(8,000 units budgeted – 7,700 units sold). The variance is
adverse because actual sales volume was less than
budgeted. The sales volume variance in units can be
evaluated in the three ways described above.
(a) Sales volume profit variance = 300 units × standard gross
profit margin per unit
= 300 units × Rs: (12 – 7) = Rs: 1,500 (A)
Cost Accounting Manual 2013
9 © For Suggestions & Feedbacks, contact: ATAUSH SHAFI ([email protected])
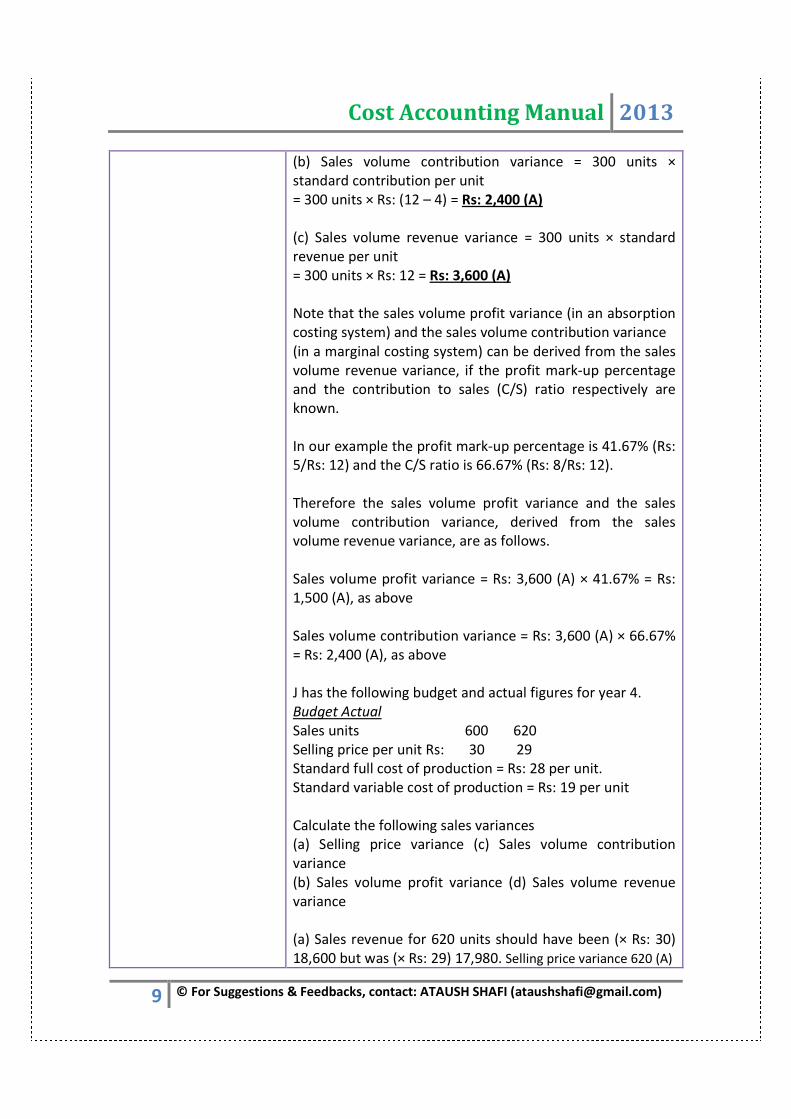
(b) Sales volume contribution variance = 300 units ×
standard contribution per unit
= 300 units × Rs: (12 – 4) = Rs: 2,400 (A)
(c) Sales volume revenue variance = 300 units × standard
revenue per unit
= 300 units × Rs: 12 = Rs: 3,600 (A)
Note that the sales volume profit variance (in an absorption
costing system) and the sales volume contribution variance
(in a marginal costing system) can be derived from the sales
volume revenue variance, if the profit mark-up percentage
and the contribution to sales (C/S) ratio respectively are
known.
In our example the profit mark-up percentage is 41.67% (Rs:
5/Rs: 12) and the C/S ratio is 66.67% (Rs: 8/Rs: 12).
Therefore the sales volume profit variance and the sales
volume contribution variance, derived from the sales
volume revenue variance, are as follows.
Sales volume profit variance = Rs: 3,600 (A) × 41.67% = Rs:
1,500 (A), as above
Sales volume contribution variance = Rs: 3,600 (A) × 66.67%
= Rs: 2,400 (A), as above
J has the following budget and actual figures for year 4.
Budget Actual
Sales units 600 620
Selling price per unit Rs: 30 29
Standard full cost of production = Rs: 28 per unit.
Standard variable cost of production = Rs: 19 per unit
Calculate the following sales variances
(a) Selling price variance (c) Sales volume contribution
variance
(b) Sales volume profit variance (d) Sales volume revenue
variance
Answer
(a) Sales revenue for 620 units should have been (× Rs: 30)
18,600 but was (× Rs: 29) 17,980. Selling price variance 620 (A)
Cost Accounting Manual 2013
10 © For Suggestions & Feedbacks, contact: ATAUSH SHAFI ([email protected])
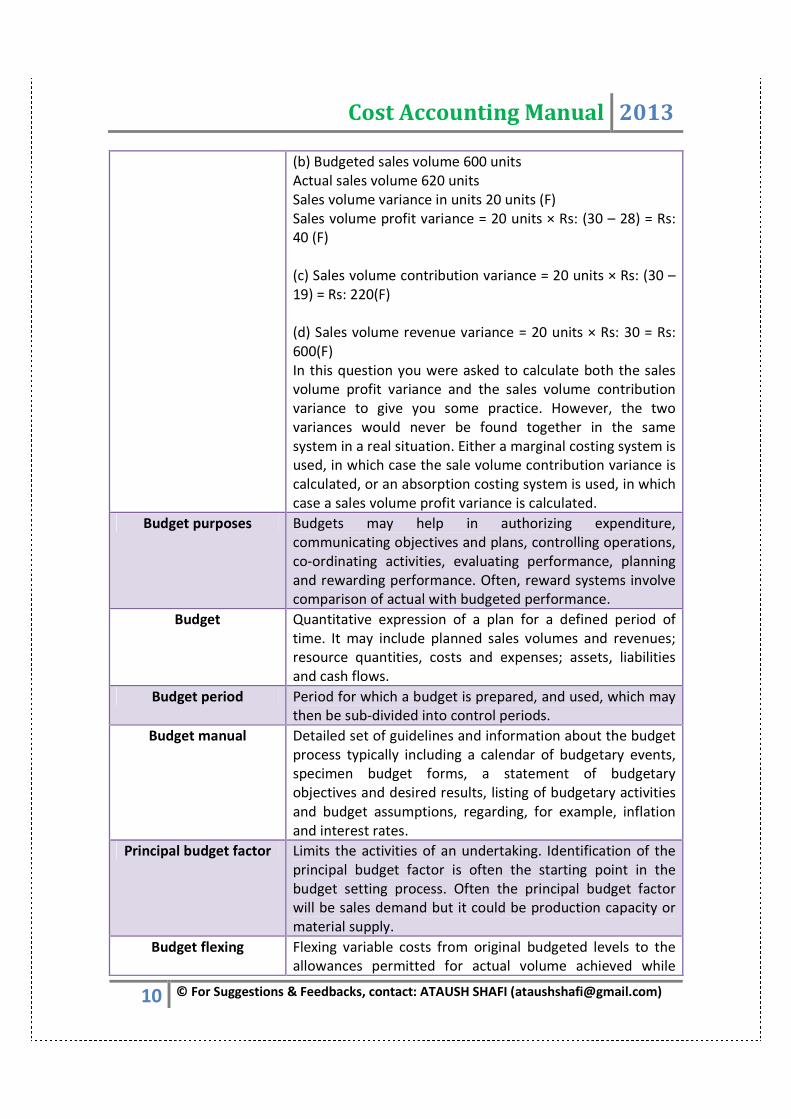
(b) Budgeted sales volume 600 units
Actual sales volume 620 units
Sales volume variance in units 20 units (F)
Sales volume profit variance = 20 units × Rs: (30 – 28) = Rs:
40 (F)
(c) Sales volume contribution variance = 20 units × Rs: (30 –
19) = Rs: 220(F)
(d) Sales volume revenue variance = 20 units × Rs: 30 = Rs:
600(F)
In this question you were asked to calculate both the sales
volume profit variance and the sales volume contribution
variance to give you some practice. However, the two
variances would never be found together in the same
system in a real situation. Either a marginal costing system is
used, in which case the sale volume contribution variance is
calculated, or an absorption costing system is used, in which
case a sales volume profit variance is calculated.
Budget purposes Budgets may help in authorizing expenditure,
communicating objectives and plans, controlling operations,
co-ordinating activities, evaluating performance, planning
and rewarding performance. Often, reward systems involve
comparison of actual with budgeted performance.
Budget Quantitative expression of a plan for a defined period of
time. It may include planned sales volumes and revenues;
resource quantities, costs and expenses; assets, liabilities
and cash flows.
Budget period Period for which a budget is prepared, and used, which may
then be sub-divided into control periods.
Budget manual Detailed set of guidelines and information about the budget
process typically including a calendar of budgetary events,
specimen budget forms, a statement of budgetary
objectives and desired results, listing of budgetary activities
and budget assumptions, regarding, for example, inflation
and interest rates.
Principal budget factor Limits the activities of an undertaking. Identification of the
principal budget factor is often the starting point in the
budget setting process. Often the principal budget factor
will be sales demand but it could be production capacity or
material supply.
Budget flexing Flexing variable costs from original budgeted levels to the
allowances permitted for actual volume achieved while
Cost Accounting Manual 2013
11 © For Suggestions & Feedbacks, contact: ATAUSH SHAFI ([email protected])
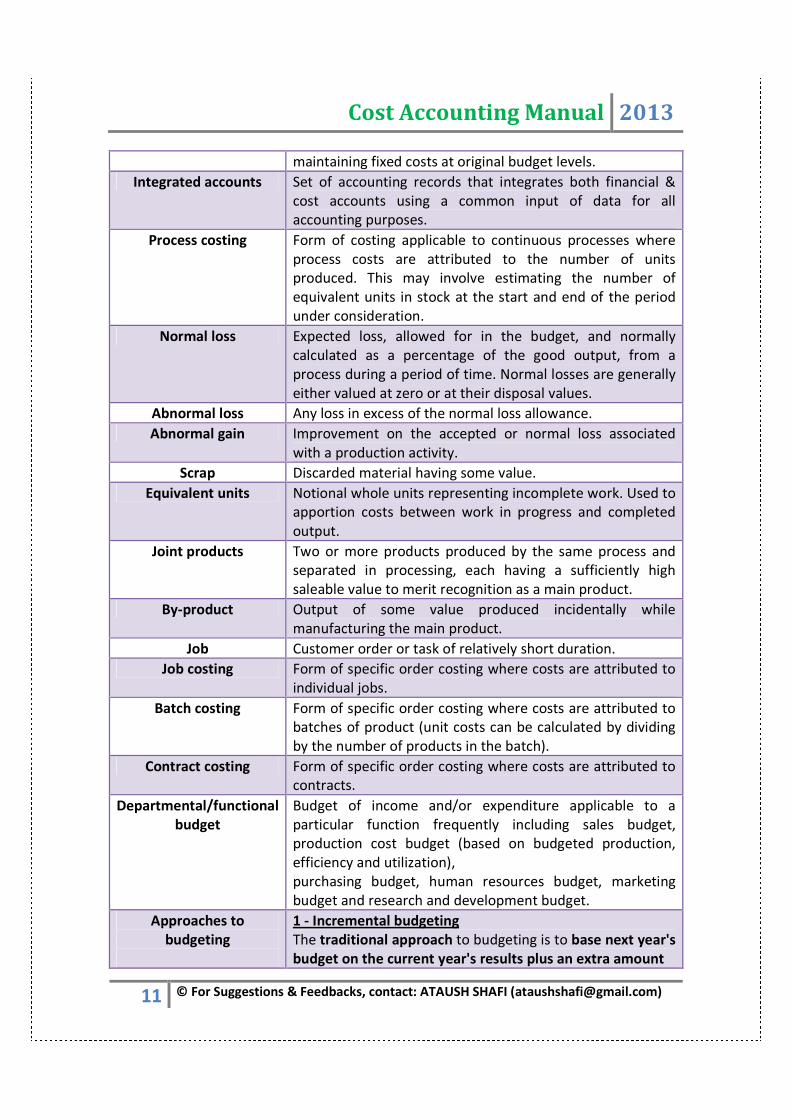
maintaining fixed costs at original budget levels.
Integrated accounts Set of accounting records that integrates both financial &
cost accounts using a common input of data for all
accounting purposes.
Process costing Form of costing applicable to continuous processes where
process costs are attributed to the number of units
produced. This may involve estimating the number of
equivalent units in stock at the start and end of the period
under consideration.
Normal loss Expected loss, allowed for in the budget, and normally
calculated as a percentage of the good output, from a
process during a period of time. Normal losses are generally
either valued at zero or at their disposal values.
Abnormal loss Any loss in excess of the normal loss allowance.
Abnormal gain Improvement on the accepted or normal loss associated
with a production activity.
Scrap Discarded material having some value.
Equivalent units Notional whole units representing incomplete work. Used to
apportion costs between work in progress and completed
output.
Joint products Two or more products produced by the same process and
separated in processing, each having a sufficiently high
saleable value to merit recognition as a main product.
By-product Output of some value produced incidentally while
manufacturing the main product.
Job Customer order or task of relatively short duration.
Job costing Form of specific order costing where costs are attributed to
individual jobs.
Batch costing Form of specific order costing where costs are attributed to
batches of product (unit costs can be calculated by dividing
by the number of products in the batch).
Contract costing Form of specific order costing where costs are attributed to
contracts.
Departmental/functional
budget
Budget of income and/or expenditure applicable to a
particular function frequently including sales budget,
production cost budget (based on budgeted production,
efficiency and utilization),
purchasing budget, human resources budget, marketing
budget and research and development budget.
Approaches to
budgeting
1 - Incremental budgeting
The traditional approach to budgeting is to base next year's
budget on the current year's results plus an extra amount
Cost Accounting Manual 2013
12 © For Suggestions & Feedbacks, contact: ATAUSH SHAFI ([email protected])
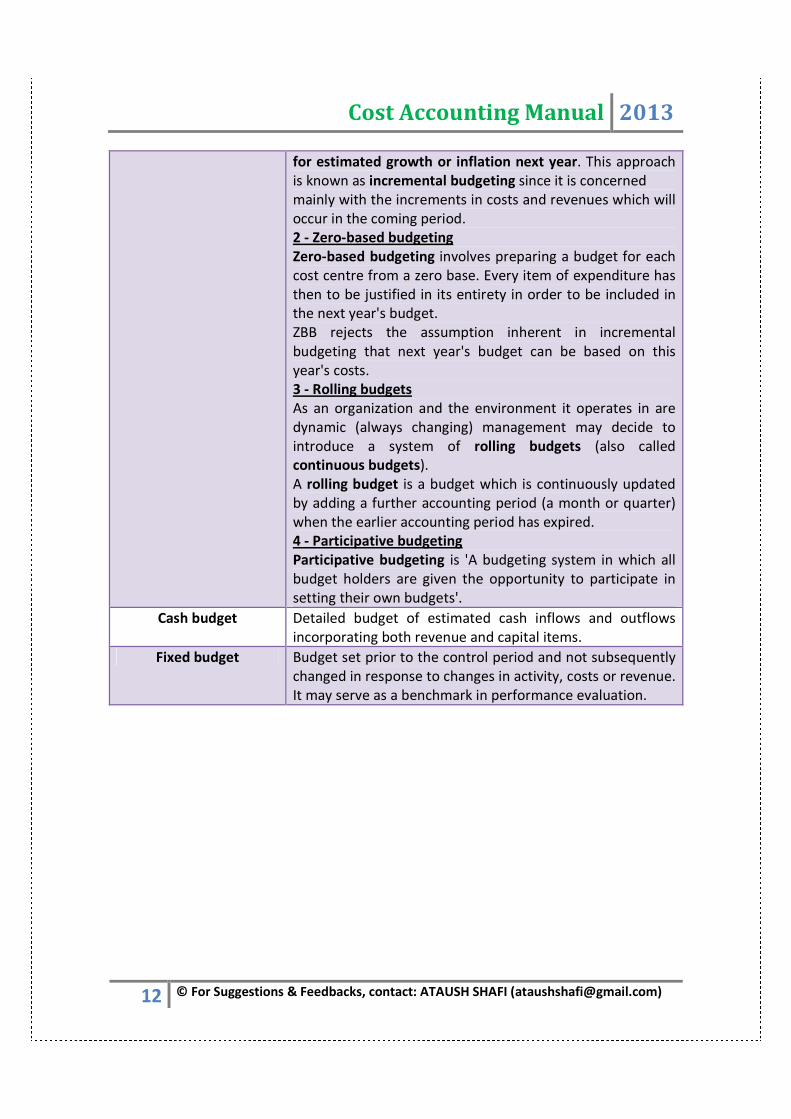
for estimated growth or inflation next year. This approach
is known as incremental budgeting since it is concerned
mainly with the increments in costs and revenues which will
occur in the coming period.
2 - Zero-based budgeting
Zero-based budgeting involves preparing a budget for each
cost centre from a zero base. Every item of expenditure has
then to be justified in its entirety in order to be included in
the next year's budget.
ZBB rejects the assumption inherent in incremental
budgeting that next year's budget can be based on this
year's costs.
3 - Rolling budgets
As an organization and the environment it operates in are
dynamic (always changing) management may decide to
introduce a system of rolling budgets (also called
continuous budgets).
A rolling budget is a budget which is continuously updated
by adding a further accounting period (a month or quarter)
when the earlier accounting period has expired.
4 - Participative budgeting
Participative budgeting is 'A budgeting system in which all
budget holders are given the opportunity to participate in
setting their own budgets'.
Cash budget Detailed budget of estimated cash inflows and outflows
incorporating both revenue and capital items.
Fixed budget Budget set prior to the control period and not subsequently
changed in response to changes in activity, costs or revenue.
It may serve as a benchmark in performance evaluation.

Cost Accounting Manual 2013
13 © For Suggestions & Feedbacks, contact: ATAUSH SHAFI ([email protected])
COST OF GOODS SOLD FORMULECOST OF GOODS SOLD FORMULECOST OF GOODS SOLD FORMULECOST OF GOODS SOLD FORMULE
ITEMS FORMULAE
1 Prime/Basic/Flat Cost Direct Material + Direct Labor+ Direct Expenses
2 Number of Unit Made Unit Sold + Closing unit of finished goods -
Opening unit of finished goods
3 Per unit Cost Cost of Good Manufactured / Unit Made
4 Work-In-Process Closing Stock Direct Material + Direct Labor + Factory
Overhead
5 Gross Profit Sales – Cost of Goods Sold
6 Finished Goods Closing Unit Per unit cost * F.G close unit
7 Sales Gross Profit + Cost of goods sold
8 Under/Over Applied Actual FOH – Applied FOH (Actual Hours * FOH
Applied Rate)
9 Unit Consumed Opening Stock +Purchases – Closing Stock
10 Gross Profit/Net Profit Per Unit Gross Profit or Net Profit / unit sold
11 FOH Applied Rate Total FOH cost / Capacity Level * 100
12 Sales in Net Income Net Income / % * 100
13 Gross Profit/Net Profit to Sales Gross Profit or Net Profit / Net sales *100
14 Purchases (Raw Material) Raw Material in Process + R.M. Closing – R.M.
Opening
15 Total Manufacturing Cost Direct Material + Direct Labor + Direct Expenses
+ Factory Overhead
16 Conversion Cost Direct Labor + Factory Overhead
17 Per Unit Sale Price Profit + Operating cost + Per unit cost
18 % of Cost Sale Price Purchase at cost / Purchase at sale *100
19 Purchase at Sale Price Sales + Closing stock – Opening stock
20 Under/Over FOH Adjustment Under or Over applied / Cost Of Goods Sold or
Work-In-Process or Finished Goods * 100
21 Cost Of Goods Sold Per Unit Cost of Goods Sold / unit sold
22 Number of Unit Sold Total Gross Profit last year / Expected Gross
Profit per unit * 100
23 Cost Of Goods Manufactured Total Manufacturing Cost + Open Work-In-
Process – Closing Work-In-Process
24 Cost Of Goods Sold Cost Of Goods Manufactured + Open Finished
Goods – Closing Finished Goods
25 Increase by/ Decrease by Increase by = Less & Decrease by = Add
Cost Accounting Manual 2013
14 © For Suggestions & Feedbacks, contact: ATAUSH SHAFI ([email protected])
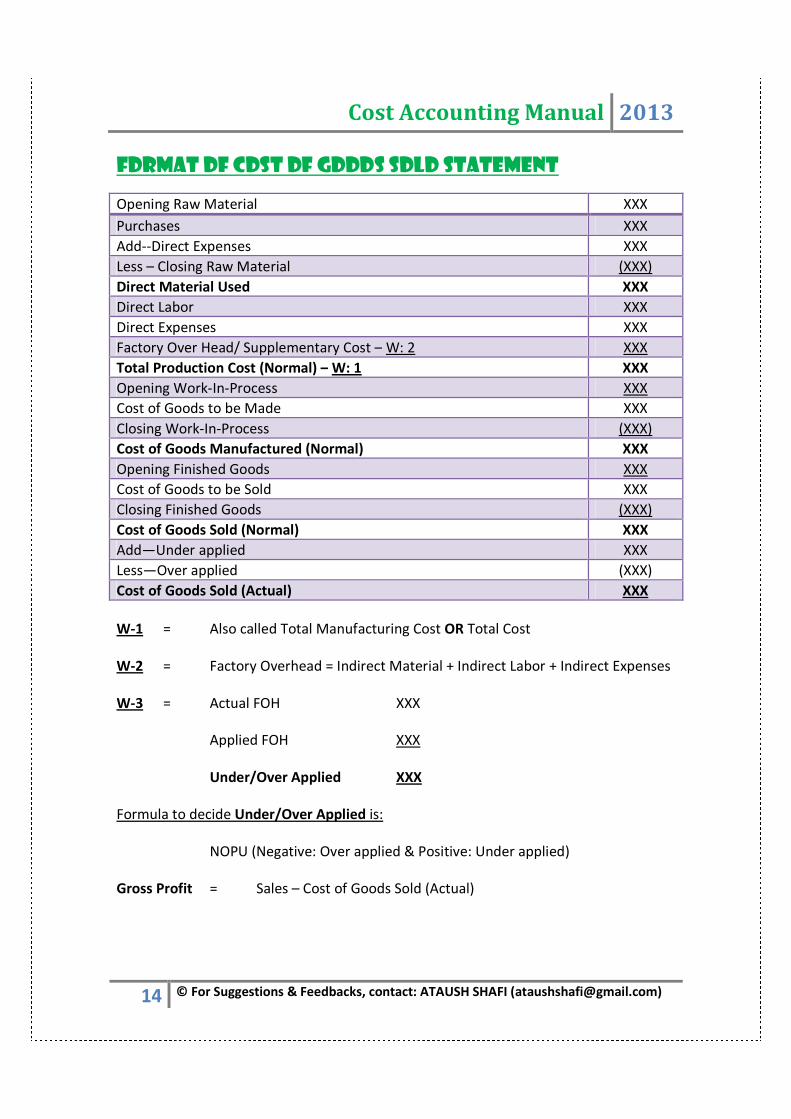
Format of cost of goods sold statement
Opening Raw Material XXX
Purchases XXX
Add--Direct Expenses XXX
Less – Closing Raw Material (XXX)
Direct Material Used XXX
Direct Labor XXX
Direct Expenses XXX
Factory Over Head/ Supplementary Cost – W: 2 XXX
Total Production Cost (Normal) – W: 1 XXX
Opening Work-In-Process XXX
Cost of Goods to be Made XXX
Closing Work-In-Process (XXX)
Cost of Goods Manufactured (Normal) XXX
Opening Finished Goods XXX
Cost of Goods to be Sold XXX
Closing Finished Goods (XXX)
Cost of Goods Sold (Normal) XXX
Add—Under applied XXX
Less—Over applied (XXX)
Cost of Goods Sold (Actual) XXX
W-1 = Also called Total Manufacturing Cost OR Total Cost
W-2 = Factory Overhead = Indirect Material + Indirect Labor + Indirect Expenses
W-3 = Actual FOH XXX
Applied FOH XXX
Under/Over Applied XXX
Formula to decide Under/Over Applied is:
NOPU (Negative: Over applied & Positive: Under applied)
Gross Profit = Sales – Cost of Goods Sold (Actual)

Cost Accounting Manual 2013
15 © For Suggestions & Feedbacks, contact: ATAUSH SHAFI ([email protected])
Problems in preparation of cogs statement
Assume : Gross Profit = 290,000
Sales = 600,000
COGS = 310,000
Gross Profit Margin
Rate
Gross Profit margin rate = Gross Profit/ Sales x 100
This ratio identifies the ratio of gross profit over sales. In this ratio
sale is held equal to 100%. The %age of cost of goods sold is 100 –
the %age margin. It means that if margin is 25%, then %age cost of
goods sold will be 75%. E.g.: 290,000/600,000 x 100 = 48.33%.
Gross Profit
Markup Rate
Gross Profit markup rate = Gross Profit/Cost of goods sold x 100
This ratio identifies the ratio of gross profit over cost of goods sold.
In this ratio cost of goods sold is held equal to 100%. The %age of
sales is 100 + the %age of markup. It means that if markup is 25%
then %age of sales will be 125%. E.g.: 290,000/310,000 x 100 =
93.5%. These ratios are also known as cost structure ratios.
In case of In case of
Margin Markup
Sales 100% 125%
Cost of goods sold 75% 100%
Gross profit 25% 25%
As shown above in both of the cases gross profit is 25% but the base
is different. Where the sale is 100% the cost of goods sold is 75%,
where the cost of goods sold is 100% the sales is 125%.
At this stage sometimes sales figure is missing and it is required to
calculate gross profit using the margin rate (based on sales). The
given information in this case is cost of goods sold. Most of the
students make a common error, they straight away calculate gross
profit %age on the figure of cost of goods sold, this is wrong in this
situation as the base is the figure of sales which is not given. Here
the following formula will be used to calculate gross profit:
Required information =
given information x %age of required information
%age of given information
In the above situation where cost of goods sold is given and gross
profit is to be calculated using the margin rate (based on sales),
following calculations will be followed:
Gross profit = Cost of goods sold (absolute amount) x 25%/75%
Same concept is followed where cost of goods sold figure is missing
and it is required to calculate gross profit using the markup rate
Cost Accounting Manual 2013
16 © For Suggestions & Feedbacks, contact: ATAUSH SHAFI ([email protected])
(based on cost of goods sold). The given information in this case is
that of sales. Most of the students make a common error, they
straight away calculate gross profit %age on sales, this is wrong, as
the base should be cost of goods sold where markup rate is to be
used. Here again the above formula will be used to calculate gross
profit:
Required information =
given information x %age of required information
%age of given information
In the above situation where sales is given and gross profit is to be
calculated using the markup rate (based on cost of goods sold),
following calculations will be followed:
Gross profit = Sales (absolute amount) x 25%/125%
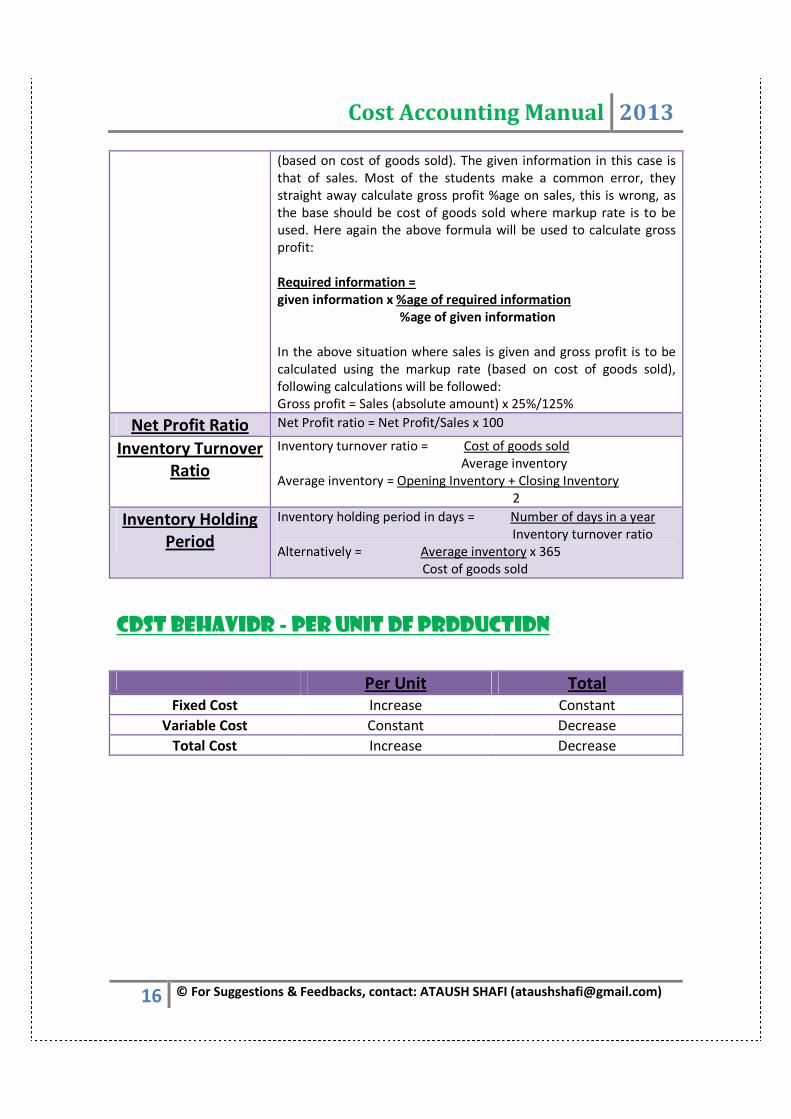
Net Profit Ratio Net Profit ratio = Net Profit/Sales x 100
Inventory Turnover
Ratio
Inventory turnover ratio = Cost of goods sold
Average inventory
Average inventory = Opening Inventory + Closing Inventory
2
Inventory Holding
Period
Inventory holding period in days = Number of days in a year
Inventory turnover ratio
Alternatively = Average inventory x 365
Cost of goods sold
Cost behavior - per unit of production
Per Unit Total
Fixed Cost Increase Constant
Variable Cost Constant Decrease
Total Cost Increase Decrease

17 © For Suggestions &
COST CLASSIFICATIONCOST CLASSIFICATIONCOST CLASSIFICATIONCOST CLASSIFICATION
Cost Accounting Manual
For Suggestions & Feedbacks, contact: ATAUSH SHAFI ([email protected])
COST CLASSIFICATIONCOST CLASSIFICATIONCOST CLASSIFICATIONCOST CLASSIFICATION
Cost Accounting Manual 2013
ATAUSH SHAFI ([email protected])
COST CLASSIFICATIONCOST CLASSIFICATIONCOST CLASSIFICATIONCOST CLASSIFICATION
Cost Accounting Manual 2013
18 © For Suggestions & Feedbacks, contact: ATAUSH SHAFI ([email protected])
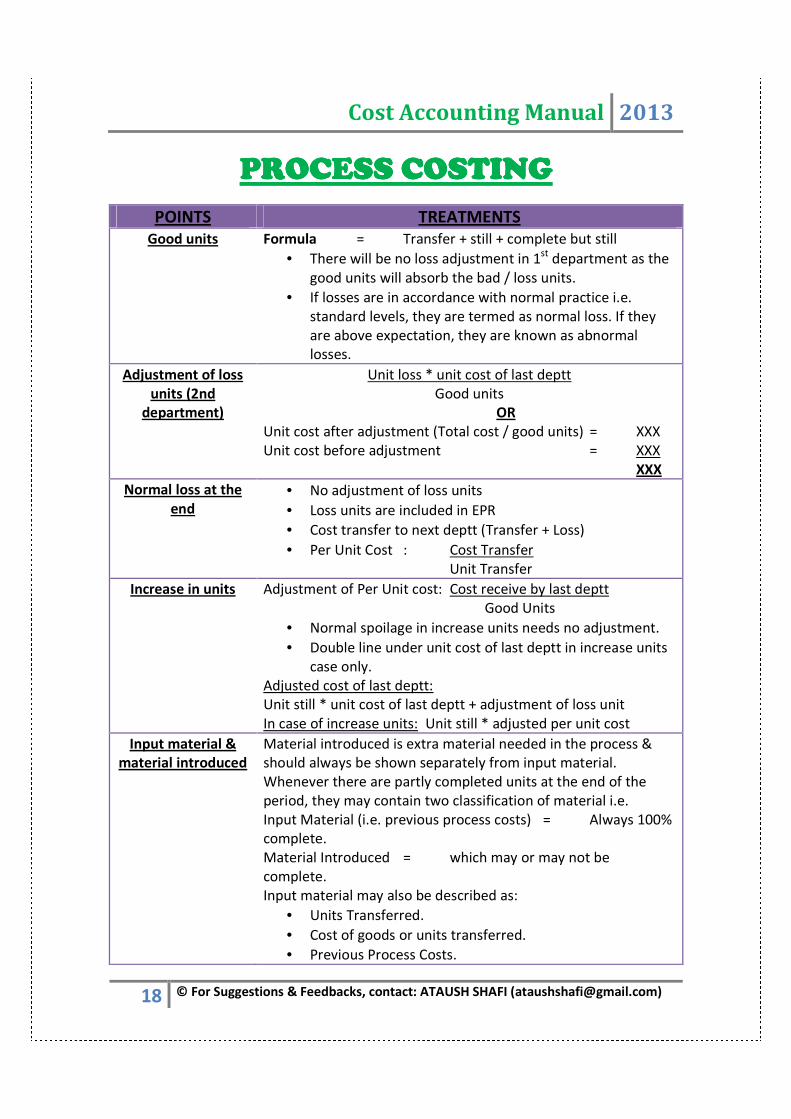
PROCESS COSTINGPROCESS COSTINGPROCESS COSTINGPROCESS COSTING
POINTS TREATMENTS
Good units
Formula = Transfer + still + complete but still
• There will be no loss adjustment in 1st
department as the
good units will absorb the bad / loss units.
• If losses are in accordance with normal practice i.e.
standard levels, they are termed as normal loss. If they
are above expectation, they are known as abnormal
losses.
Adjustment of loss
units (2nd
department)
Unit loss * unit cost of last deptt
Good units
OR
Unit cost after adjustment (Total cost / good units) = XXX
Unit cost before adjustment = XXX
XXX
Normal loss at the
end
• No adjustment of loss units
• Loss units are included in EPR
• Cost transfer to next deptt (Transfer + Loss)
• Per Unit Cost : Cost Transfer
Unit Transfer
Increase in units
Adjustment of Per Unit cost: Cost receive by last deptt
Good Units
• Normal spoilage in increase units needs no adjustment.
• Double line under unit cost of last deptt in increase units
case only.
Adjusted cost of last deptt:
Unit still * unit cost of last deptt + adjustment of loss unit
In case of increase units: Unit still * adjusted per unit cost
Input material &
material introduced
Material introduced is extra material needed in the process &
should always be shown separately from input material.
Whenever there are partly completed units at the end of the
period, they may contain two classification of material i.e.
Input Material (i.e. previous process costs) = Always 100%
complete.
Material Introduced = which may or may not be
complete.
Input material may also be described as:
• Units Transferred.
• Cost of goods or units transferred.
• Previous Process Costs.
Cost Accounting Manual 2013
19 © For Suggestions & Feedbacks, contact: ATAUSH SHAFI ([email protected])
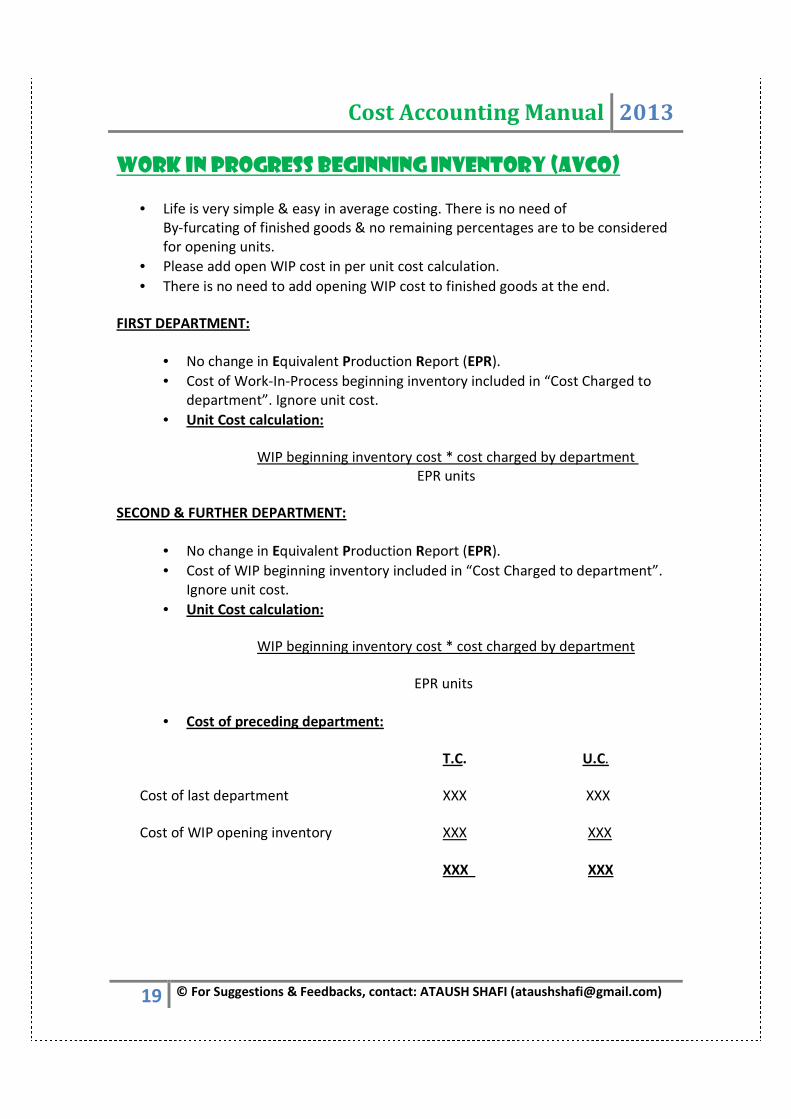
WORK IN PROGRESS BEGINNING INVENTORY (AVCO)
• Life is very simple & easy in average costing. There is no need of
By-furcating of finished goods & no remaining percentages are to be considered
for opening units.
• Please add open WIP cost in per unit cost calculation.
• There is no need to add opening WIP cost to finished goods at the end.
FIRST DEPARTMENT:
• No change in Equivalent Production Report (EPR).
• Cost of Work-In-Process beginning inventory included in “Cost Charged to
department”. Ignore unit cost.
• Unit Cost calculation:
WIP beginning inventory cost * cost charged by department
EPR units
SECOND & FURTHER DEPARTMENT:
• No change in Equivalent Production Report (EPR).
• Cost of WIP beginning inventory included in “Cost Charged to department”.
Ignore unit cost.
• Unit Cost calculation:
WIP beginning inventory cost * cost charged by department
EPR units
• Cost of preceding department:
T.C. U.C.
Cost of last department XXX XXX
Cost of WIP opening inventory XXX XXX
XXX XXX
Cost Accounting Manual 2013
20 © For Suggestions & Feedbacks, contact: ATAUSH SHAFI ([email protected])
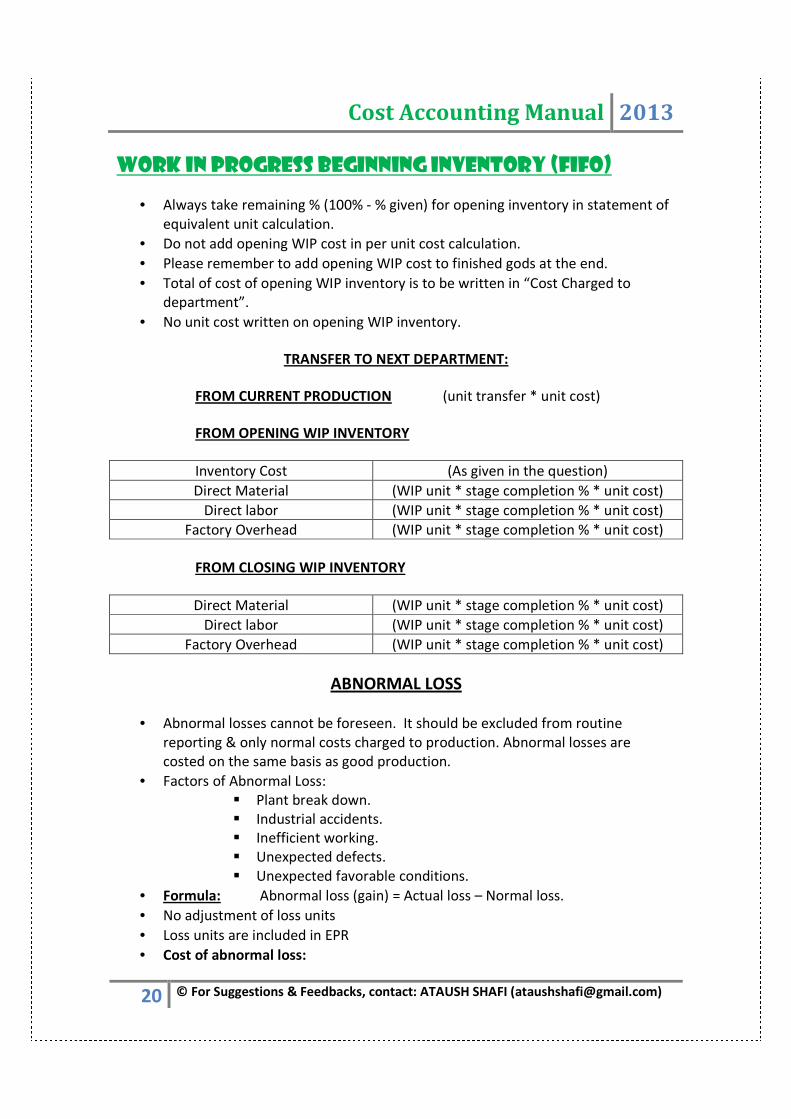
WORK IN PROGRESS BEGINNING INVENTORY (FIFO)
• Always take remaining % (100% - % given) for opening inventory in statement of
equivalent unit calculation.
• Do not add opening WIP cost in per unit cost calculation.
• Please remember to add opening WIP cost to finished gods at the end.
• Total of cost of opening WIP inventory is to be written in “Cost Charged to
department”.
• No unit cost written on opening WIP inventory.
TRANSFER TO NEXT DEPARTMENT:
FROM CURRENT PRODUCTION (unit transfer * unit cost)
FROM OPENING WIP INVENTORY
Inventory Cost (As given in the question)
Direct Material (WIP unit * stage completion % * unit cost)
Direct labor (WIP unit * stage completion % * unit cost)
Factory Overhead (WIP unit * stage completion % * unit cost)
FROM CLOSING WIP INVENTORY
Direct Material (WIP unit * stage completion % * unit cost)
Direct labor (WIP unit * stage completion % * unit cost)
Factory Overhead (WIP unit * stage completion % * unit cost)
ABNORMAL LOSS
• Abnormal losses cannot be foreseen. It should be excluded from routine
reporting & only normal costs charged to production. Abnormal losses are
costed on the same basis as good production.
• Factors of Abnormal Loss:
� Plant break down.
� Industrial accidents.
� Inefficient working.
� Unexpected defects.
� Unexpected favorable conditions.
• Formula: Abnormal loss (gain) = Actual loss – Normal loss.
• No adjustment of loss units
• Loss units are included in EPR
• Cost of abnormal loss:

Cost Accounting Manual 2013
21 © For Suggestions & Feedbacks, contact: ATAUSH SHAFI ([email protected])
Last deptt XXX (unit loss * unit cost)
Material XXX (unit loss * unit cost)
Labor XXX (unit loss * unit cost)
FOH XXX (unit loss * unit cost)
EQUIVALENT PRODUCTION REPORT
FOR FIFO
Previous
Deptt
Direct
Material
Direct
Labor
FOH
Transfer XXX XXX XXX XXX
Opening WIP ( Given) XXX XXX XXX XXX
Abnormal Loss XXX XXX XXX XXX
Abnormal Gain (XXX) (XXX) (XXX) (XXX)
Current Production XXX XXX XXX XXX
Opening WIP (1 – % * 100) XXX XXX XXX XXX
Closing WIP ( Given) XXX XXX XXX XXX
TOTAL UNITS XXX XXX XXX XXX
FOR OTHERS
Previous Deptt Direct
Material
Direct
Labor
FOH
Transfer XXX XXX XXX XXX
Closing WIP XXX XXX XXX XXX
Abnormal Loss XXX XXX XXX XXX
Abnormal Gain (XXX) (XXX) (XXX) (XXX)
Normal Loss (2nd Deptt) XXX XXX XXX XXX
Normal Loss at end XXX XXX XXX XXX
TOTAL UNITS XXX XXX XXX XXX
COST PER UNIT = Total costs/Total equivalent production units
TOTAL COST FOR PERIOD = Value of completed units + Value of W-I-P
• An equivalent unit means ‘equal to one finished unit of output’.
• One fully-finished unit of production = 1 equivalent unit
• One unit 50% complete = 0.50 equivalent units. 400 units 50% complete = 200
equivalent units.
• One unit 20% complete = 0.20 equivalent units. 400 units 20% complete = 80
equivalent units.
Cost Accounting Manual 2013
22 © For Suggestions & Feedbacks, contact: ATAUSH SHAFI ([email protected])
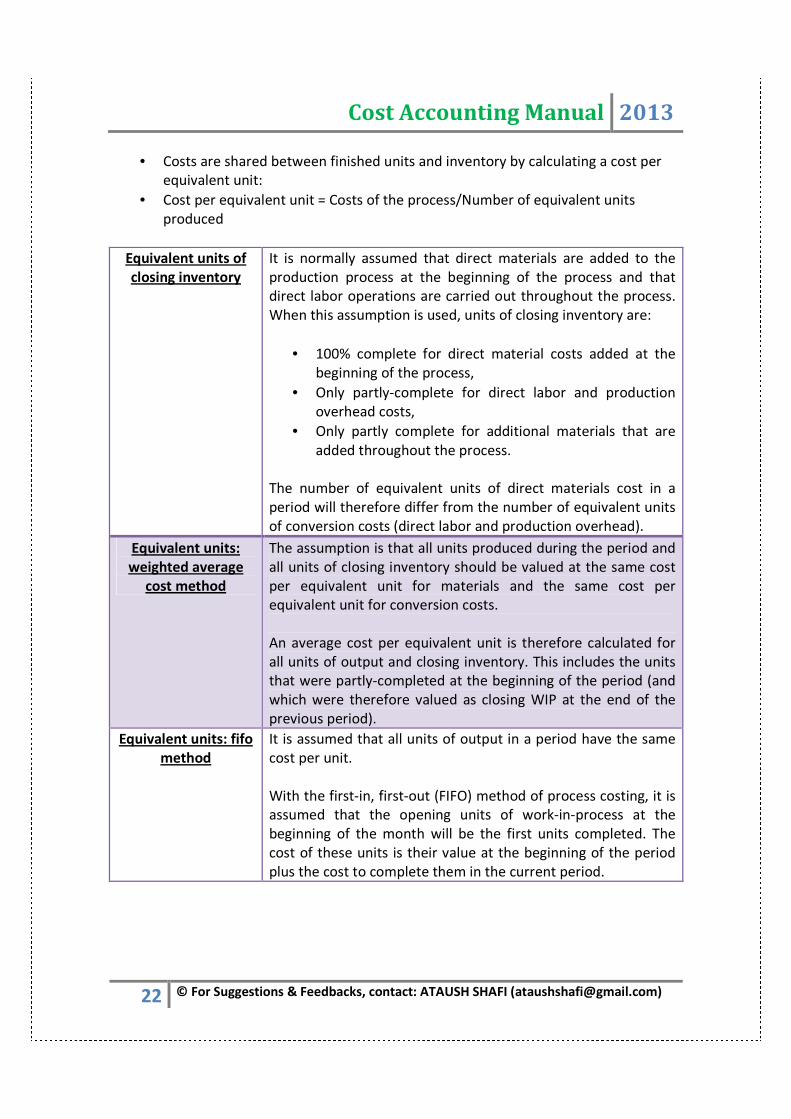
• Costs are shared between finished units and inventory by calculating a cost per
equivalent unit:
• Cost per equivalent unit = Costs of the process/Number of equivalent units
produced
Equivalent units of
closing inventory
It is normally assumed that direct materials are added to the
production process at the beginning of the process and that
direct labor operations are carried out throughout the process.
When this assumption is used, units of closing inventory are:
• 100% complete for direct material costs added at the
beginning of the process,
• Only partly-complete for direct labor and production
overhead costs,
• Only partly complete for additional materials that are
added throughout the process.
The number of equivalent units of direct materials cost in a
period will therefore differ from the number of equivalent units
of conversion costs (direct labor and production overhead).
Equivalent units:
weighted average
cost method
The assumption is that all units produced during the period and
all units of closing inventory should be valued at the same cost
per equivalent unit for materials and the same cost per
equivalent unit for conversion costs.
An average cost per equivalent unit is therefore calculated for
all units of output and closing inventory. This includes the units
that were partly-completed at the beginning of the period (and
which were therefore valued as closing WIP at the end of the
previous period).
Equivalent units: fifo
method
It is assumed that all units of output in a period have the same
cost per unit.
With the first-in, first-out (FIFO) method of process costing, it is
assumed that the opening units of work-in-process at the
beginning of the month will be the first units completed. The
cost of these units is their value at the beginning of the period
plus the cost to complete them in the current period.

Cost Accounting Manual 2013
23 © For Suggestions & Feedbacks, contact: ATAUSH SHAFI ([email protected])
PROCESS ACCOUNT - VARIATIONS
S.No American Approach British Approach
1 CPR Process A/C
2 Departments Processes
3 Work in process Work in progress
4 No abnormal gain concept abnormal gain concept
5 Scrap value of Normal Loss is
ignored
Scrap value of Normal Loss is considered
6 Normal Loss is calculated at the end
of process
Normal Loss is considered from
beginning & considered specific value
while computing cost of finished goods
7 % of Normal Loss is applied on input
/output
% of Normal Loss is always applied on
input
PROCESS ACCOUNT – BRITISH APPROACH
Particulars Qty Amount Particulars Qty Amount
Rs. Rs.
Opening Balance XXX XXX Transfer to next deptt XXX XXX
Direct Material XXX Normal Loss XXX XXX
Direct Labor XXX Abnormal Loss XXX XXX
Factory Overhead XXX
Additional Overhead XXX
Direct Expenses XXX
FOH Allocated XXX
Abnormal Gain XXX XXX
TOTAL XXX TOTAL XXX
Notes:
1. The output of one process becomes the input to the next until the finished
product is made in the final process.
2. Process account is no more than a ledger with debit & credit entries.
3. Quantity column is just a memorandum column which means that we just have
to balance it.
4. Direct labor & factory overhead may be treated together as conversion cost.
5. Valuation of abnormal loss = Total Cost – Scrap/Normal production
6. Valuation of abnormal gain = Total Cost – Scrap/Normal production

Cost Accounting Manual 2013
24 © For Suggestions & Feedbacks, contact: ATAUSH SHAFI ([email protected])
7. Normal loss VS Abnormal loss
Points Normal Loss Abnormal Loss
Nature Unavoidable Avoidable
Existence Inherent Non- Inherent
Factors 1. Shrinkage
2. evaporation
3. spoilage
1. Unforeseen factors
2. Abnormal conditions like:
• Maladministration
• Bad design
• Negligence on part of labor
Inclusion Credited to process account Credited to process account
6. Normal loss = normal loss units * scrap value
• Normal loss is not given in cost if it does not have a scrap value.
• Units of normal loss are valued at zero equivalent units i.e. they don’t
carry any of the process costs.
• Normal loss types:
Start During End
Not included in EPR Not included in EPR Included in EPR
7. Abnormal loss = abnormal loss units * per unit cost
8. Abnormal Gain = abnormal gain units * per unit cost
9. How to determine Abnormal Loss / Gain?
Total Units XXX
Normal Loss (XXX)
Transfer (XXX)
Abnormal Loss/ Gain XXX
DECISION RULE
Positive Abnormal Loss
Negative Abnormal Gain
10. Cost Per Unit:
Total cost – Normal Loss scrap value – NRV of by product produced
Total units – Normal loss Units – By Product Units
OR
Cost Accounting Manual 2013
25 © For Suggestions & Feedbacks, contact: ATAUSH SHAFI ([email protected])
Transfer + Abnormal Loss – Abnormal Gain
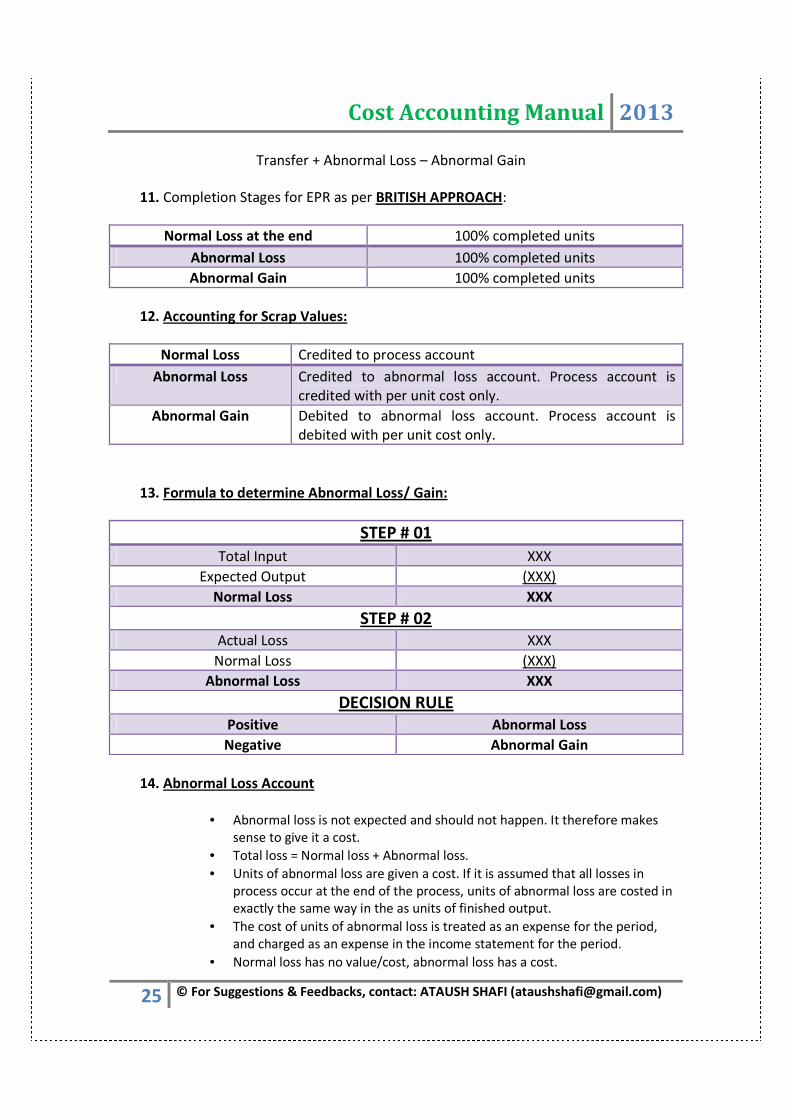
11. Completion Stages for EPR as per BRITISH APPROACH:
Normal Loss at the end 100% completed units
Abnormal Loss 100% completed units
Abnormal Gain 100% completed units
12. Accounting for Scrap Values:
Normal Loss Credited to process account
Abnormal Loss Credited to abnormal loss account. Process account is
credited with per unit cost only.
Abnormal Gain Debited to abnormal loss account. Process account is
debited with per unit cost only.
13. Formula to determine Abnormal Loss/ Gain:
STEP # 01
Total Input XXX
Expected Output (XXX)
Normal Loss XXX
STEP # 02
Actual Loss XXX
Normal Loss (XXX)
Abnormal Loss XXX
DECISION RULE
Positive Abnormal Loss
Negative Abnormal Gain
14. Abnormal Loss Account
• Abnormal loss is not expected and should not happen. It therefore makes
sense to give it a cost.
• Total loss = Normal loss + Abnormal loss.
• Units of abnormal loss are given a cost. If it is assumed that all losses in
process occur at the end of the process, units of abnormal loss are costed in
exactly the same way in the as units of finished output.
• The cost of units of abnormal loss is treated as an expense for the period,
and charged as an expense in the income statement for the period.
• Normal loss has no value/cost, abnormal loss has a cost.

Cost Accounting Manual 2013
26 © For Suggestions & Feedbacks, contact: ATAUSH SHAFI ([email protected])
• Scrap value treatment of abnormal loss.
� The cost of expected units of output is calculated in the usual way. In the WIP account
the cost of abnormal loss = units of abnormal loss × cost per expected unit of output.
� The scrap value of abnormal loss is set off against the cost of abnormal loss in the
abnormal loss account, not the process account (WIP).
Debit: Cash (= scrap value: money from sale of the scrapped units)
Credit: Abnormal loss account (abnormal loss units × scrap value per unit)
� The net cost of abnormal loss (= cost of abnormal loss minus its scrap value) is then
transferred as a cost to the cost accounting income statement at the end of the
accounting period.
Particulars Qty Amount Particulars Qty Amount
Rs. Rs.
Process Account XXX XXX Scrap Account (units *
scrap value)
XXX XXX
Profit & Loss Account XXX XXX
TOTAL XXX TOTAL XXX
15. Abnormal Gain Account
• Actual loss = Normal loss – Abnormal gain
• The differences between costing for abnormal loss and costing for abnormal gain
are that:
� Abnormal gain is a benefit rather than a cost: whereas abnormal loss is
written off as a cost at the end of the financial period, abnormal gain is an
adjustment that increases the profit for the period.
� Abnormal gain is recorded as a debit entry in the process account, because it
is a benefit.
� The other half of the double entry is recorded in an abnormal gain account.
At the end of the period, the balance on the abnormal gain account is then
transferred to the income statement as a benefit for the period, adding to
profit.
• When loss has a scrap value, the value of abnormal gain is actually less than the
amount shown in the WIP account. This is because actual revenue from scrap
will be less than the expected revenue, due to the fact that actual loss is less
than the expected loss.
• Accounting for the scrap value of abnormal gain is similar to accounting for the
scrap value of abnormal loss.
� In the process account (WIP), abnormal gain is valued at the cost per
expected unit of output.
� The scrap value of normal loss is normal loss units × scrap value per unit.
Cost Accounting Manual 2013
27 © For Suggestions & Feedbacks, contact: ATAUSH SHAFI ([email protected])
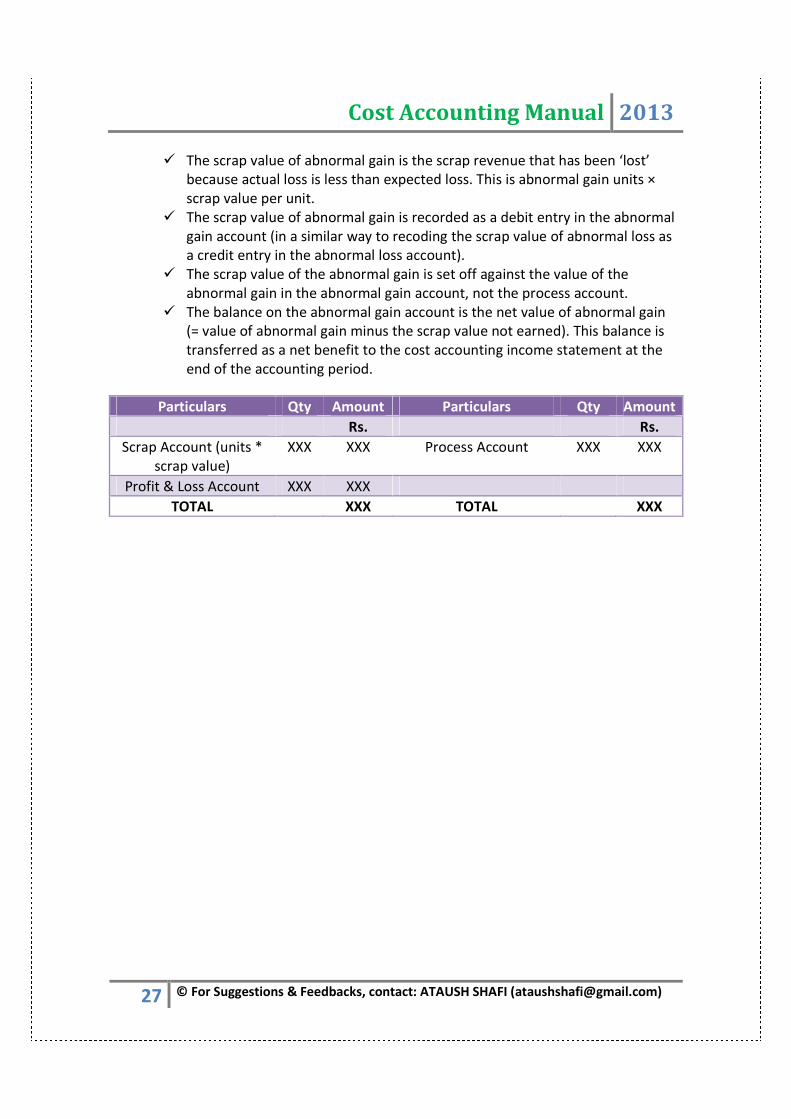
� The scrap value of abnormal gain is the scrap revenue that has been ‘lost’
because actual loss is less than expected loss. This is abnormal gain units ×
scrap value per unit.
� The scrap value of abnormal gain is recorded as a debit entry in the abnormal
gain account (in a similar way to recoding the scrap value of abnormal loss as
a credit entry in the abnormal loss account).
� The scrap value of the abnormal gain is set off against the value of the
abnormal gain in the abnormal gain account, not the process account.
� The balance on the abnormal gain account is the net value of abnormal gain
(= value of abnormal gain minus the scrap value not earned). This balance is
transferred as a net benefit to the cost accounting income statement at the
end of the accounting period.
Particulars Qty Amount Particulars Qty Amount
Rs. Rs.
Scrap Account (units *
scrap value)
XXX XXX Process Account XXX XXX
Profit & Loss Account XXX XXX
TOTAL XXX TOTAL XXX
Cost Accounting Manual 2013
28 © For Suggestions & Feedbacks, contact: ATAUSH SHAFI ([email protected])
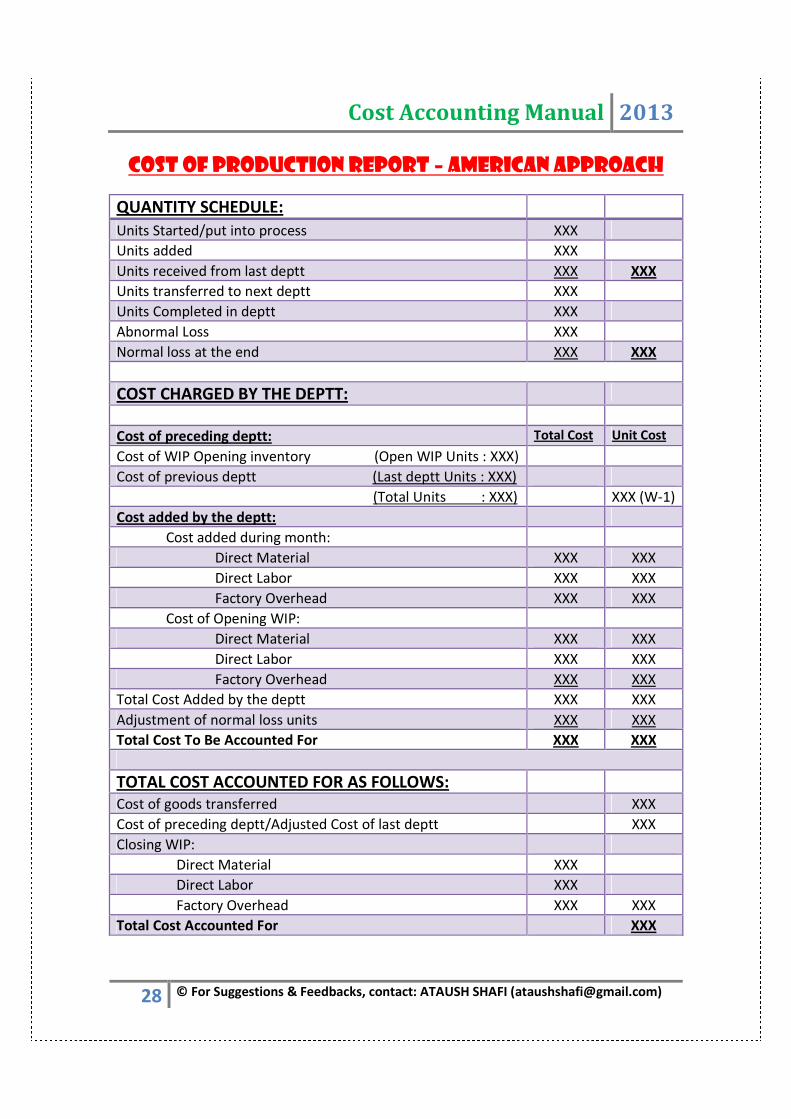
COST OF PRODUCTION REPORT – AMERICAN APPROACH
QUANTITY SCHEDULE:
Units Started/put into process XXX
Units added XXX
Units received from last deptt XXX XXX
Units transferred to next deptt XXX
Units Completed in deptt XXX
Abnormal Loss XXX
Normal loss at the end XXX XXX
COST CHARGED BY THE DEPTT:
Cost of preceding deptt: Total Cost Unit Cost
Cost of WIP Opening inventory (Open WIP Units : XXX)
Cost of previous deptt (Last deptt Units : XXX)
(Total Units : XXX) XXX (W-1)
Cost added by the deptt:
Cost added during month:
Direct Material XXX XXX
Direct Labor XXX XXX
Factory Overhead XXX XXX
Cost of Opening WIP:
Direct Material XXX XXX
Direct Labor XXX XXX
Factory Overhead XXX XXX
Total Cost Added by the deptt XXX XXX
Adjustment of normal loss units XXX XXX
Total Cost To Be Accounted For XXX XXX
TOTAL COST ACCOUNTED FOR AS FOLLOWS:
Cost of goods transferred XXX
Cost of preceding deptt/Adjusted Cost of last deptt XXX
Closing WIP:
Direct Material XXX
Direct Labor XXX
Factory Overhead XXX XXX
Total Cost Accounted For XXX

Cost Accounting Manual 2013
29 © For Suggestions & Feedbacks, contact: ATAUSH SHAFI ([email protected])
Notes:
1. Direct labor & factory overhead may be treated together as conversion cost.
2. Normal loss types:
Start During End
Not included in EPR Not included in EPR Included in EPR
3. There is no concept of Abnormal Loss in American system.
4. There is no concept of Abnormal Gain in American system.
5. Adjustment of normal loss units (2nd Deptt & Above)
Unit loss * unit cost of last deptt
Good Units
6. Cost Per Unit:
Total cost – Normal Loss scrap value
EPR units
7. Completion Stages for EPR as per AMERICAN APPROACH:
Normal Loss at the end Inspection %
Abnormal Loss Inspection %
Abnormal Gain Inspection %
Cost Accounting Manual 2013
30 © For Suggestions & Feedbacks, contact: ATAUSH SHAFI ([email protected])
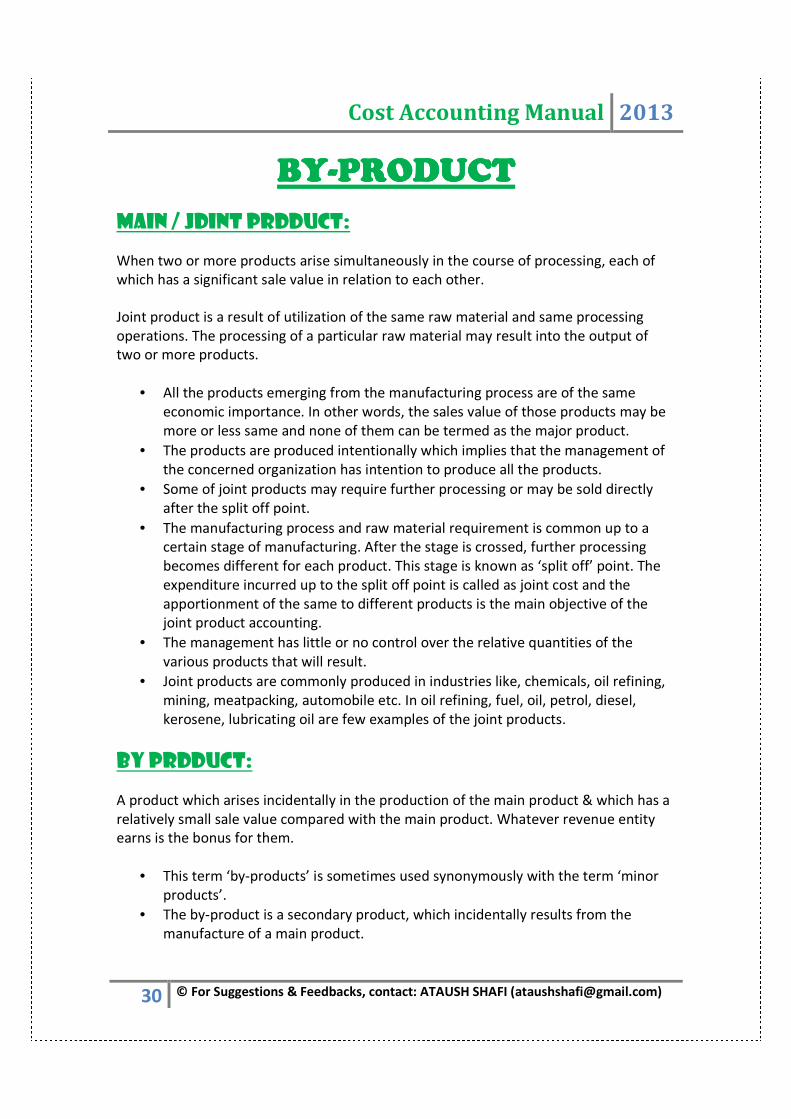
BYBYBYBY----PRODUCTPRODUCTPRODUCTPRODUCT
Main / JoinT product:
When two or more products arise simultaneously in the course of processing, each of
which has a significant sale value in relation to each other.
Joint product is a result of utilization of the same raw material and same processing
operations. The processing of a particular raw material may result into the output of
two or more products.
• All the products emerging from the manufacturing process are of the same
economic importance. In other words, the sales value of those products may be
more or less same and none of them can be termed as the major product.
• The products are produced intentionally which implies that the management of
the concerned organization has intention to produce all the products.
• Some of joint products may require further processing or may be sold directly
after the split off point.
• The manufacturing process and raw material requirement is common up to a
certain stage of manufacturing. After the stage is crossed, further processing
becomes different for each product. This stage is known as ‘split off’ point. The
expenditure incurred up to the split off point is called as joint cost and the
apportionment of the same to different products is the main objective of the
joint product accounting.
• The management has little or no control over the relative quantities of the
various products that will result.
• Joint products are commonly produced in industries like, chemicals, oil refining,
mining, meatpacking, automobile etc. In oil refining, fuel, oil, petrol, diesel,
kerosene, lubricating oil are few examples of the joint products.
By Product:
A product which arises incidentally in the production of the main product & which has a
relatively small sale value compared with the main product. Whatever revenue entity
earns is the bonus for them.
• This term ‘by-products’ is sometimes used synonymously with the term ‘minor
products’.
• The by-product is a secondary product, which incidentally results from the
manufacture of a main product.
Cost Accounting Manual 2013
31 © For Suggestions & Feedbacks, contact: ATAUSH SHAFI ([email protected])
• By–products are also produced from the same raw material and same process
operations but they are secondary results of operation. The main difference
between the joint product and by-product is that there is no intention to
produce the by-product while the joint products are produced intentionally. The
relationship between the by-product and the main product changes with
changes in economic or industrial conditions or with advancement of science.
• What was once a by-product of an industry may become a main product and one
time main product may become a by-product subsequently. For example, during
the Second World War, glycerin, a by-product in soap making was in such a
demand that it became virtually the main product while the soap was reduced to
the by-product.
• What is by-product of one industry may be a main product of another industry.
• Normally in continuous process industry, the by–products emerge. Some of the
examples of by-products are given below:
� In sugar manufacturing, bagasse [residual of sugarcane after the
juice is extracted], molasses [residual of sugarcane juice after the
impurities are taken out] and press mud are the three by-
products, which emerge at different stages of manufacturing.
� In cotton textile, the cotton-seed, which is taken out before the
manufacturing process, is a by-product.
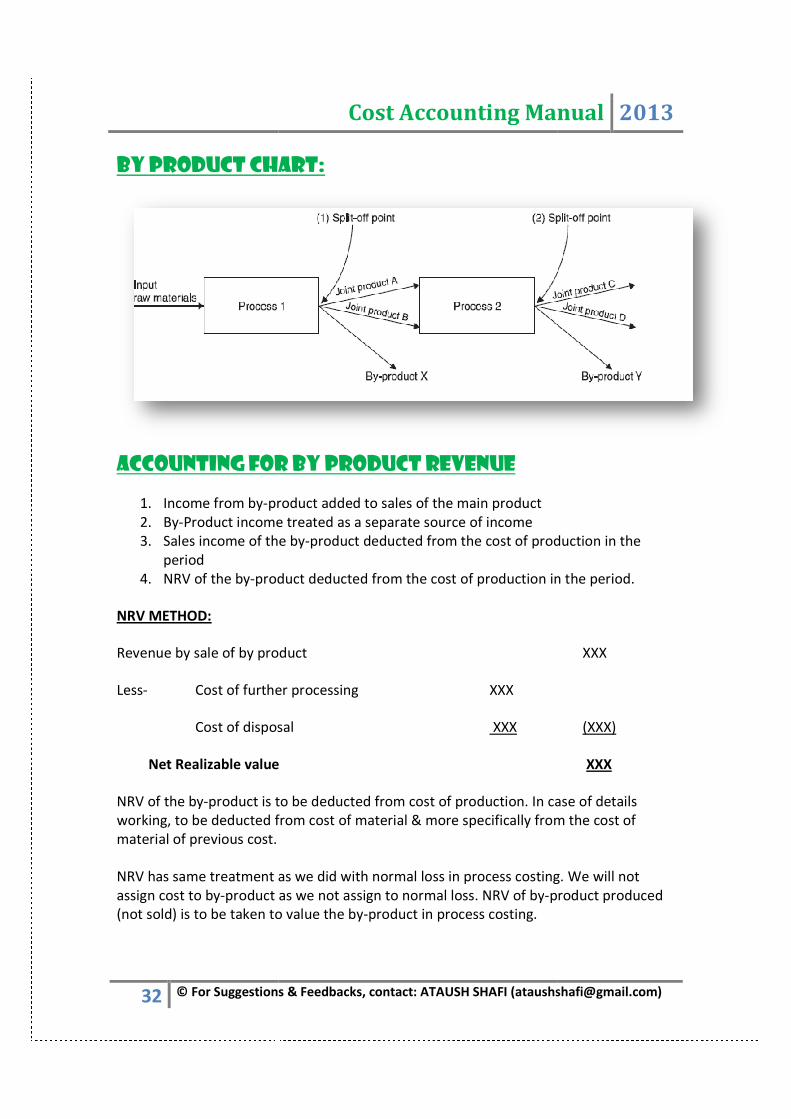
Split off point: Split off point also called separation point consists of all the costs
incurred prior to separation point.
This is a point up to which, input factors are commonly used for production of multiple
products, which can be either joint products or by-products. After this point, the joint
products or byproducts gain individual identity. In other words, up to a certain stage,
the manufacturing process is the same for all the products and a stage comes after
which, the individual processing becomes different and distinct. For example, in a dairy,
several products like, milk, ghee, butter, milk powder, ice-cream etc. may be produced.
The common material is milk. The pasteurization of milk is a common process for all the
products and after this process; each product has to be processed separately. All costs
before split off point/ separation point is common cost or joint cost that is irrelevant for
decision making purposes.
Joint Costs: Joint cost is the pre-separation cost of commonly used input factors for
the production of multiple products. In other words, all costs incurred before or up to
the split off point are termed as joint costs or pre separation costs and the
apportionment of these costs is the main objective of joint product accounting. Costs
incurred after the split off point are post separation costs and can be easily identified
with the products.
32 © For Suggestions &
BY PRODUCT CHART:
ACCOUNTING FOR BY PRODUCT REVENUE
1. Income from by-product added to sales of the main product
2. By-Product income treated as a separate source of income
3. Sales income of the by
period
4. NRV of the by-product deducted
NRV METHOD:
Revenue by sale of by product
Less- Cost of further processing
Cost of disposal
Net Realizable value
NRV of the by-product is to be
working, to be deducted from cost of material & mor
material of previous cost.
NRV has same treatment as we did with normal loss in process costing. We will not
assign cost to by-product as we not assign to normal loss. NRV of by
(not sold) is to be taken to value the by
Cost Accounting Manual
For Suggestions & Feedbacks, contact: ATAUSH SHAFI ([email protected])
BY PRODUCT CHART:
FOR BY PRODUCT REVENUE
product added to sales of the main product
Product income treated as a separate source of income
Sales income of the by-product deducted from the cost of production in the
product deducted from the cost of production in the period.
Revenue by sale of by product
Cost of further processing XXX
Cost of disposal XXX
Net Realizable value
product is to be deducted from cost of production. In case of details
ted from cost of material & more specifically from the cost of
NRV has same treatment as we did with normal loss in process costing. We will not
product as we not assign to normal loss. NRV of by-product produced
(not sold) is to be taken to value the by-product in process costing.
Cost Accounting Manual 2013
ATAUSH SHAFI ([email protected])
product deducted from the cost of production in the
from the cost of production in the period.
XXX
(XXX)
XXX
deducted from cost of production. In case of details
e specifically from the cost of
NRV has same treatment as we did with normal loss in process costing. We will not
product produced
Cost Accounting Manual 2013
33 © For Suggestions & Feedbacks, contact: ATAUSH SHAFI ([email protected])
Normal Loss By-Product
Scrap value NRV
Not assign cost Not assign cost
PER UNIT COST FORMULA:
Total cost – scrap value of normal loss – NRV of by-product produced
Equivalent units – By-product
ALLOCATION OF JOINT COSTS
MARKET VALUE/ SALE VALUE METHOD
Total joint product cost * 100
Total market cost
= Answer * each market value = apportionment of joint cost
The assumption behind this method is that the price obtained for an item is directly
related to its cost.
AVERAGE UNIT COST METHOD
Total joint product cost * 100
Total number of unit produced
= Answer * quantity produce = apportionment of joint cost
WEIGHTED AVERAGE METHOD
Total joint product cost * 100
Total number of unit weight
= Answer * individual weight = apportionment of joint cost
Cost Accounting Manual 2013
34 © For Suggestions & Feedbacks, contact: ATAUSH SHAFI ([email protected])
NRV METHOD
Final sale value XXX
Less- Subsequent processing costs XXX
Joint cost XXX
NOTE:
• It must be emphasized that whatever method is used for apportioning joint
costs, it is a convention only & its accuracy cannot be tested. It is totally
unsuitable for any form of decision making.
• The amount of joint cost & the method by which joint costs are apportioned are
irrelevant.
JOINT VS BY PRODUCT:
DIFFERENCE JOINT PRODUCT BY PRODUCT
SALE VALUE High Low
FURTHER PROCESS After spit off point Not economical
ACCOUNTING Allocate on various bases Many Methods
INTENTION TO PRODUCE Intentionally No intention
Decision Making Point:
1. Joint cost is irrelevant for decision making.
2. Loss on individual joint product is irrelevant. The key to decision is that
process as a whole is profitable.
3. Method:
Incremental Revenue = XXX
Incremental Costs = XXX
Incremental Profit = XXX
Cost Accounting Manual 2013
35 © For Suggestions & Feedbacks, contact: ATAUSH SHAFI ([email protected])
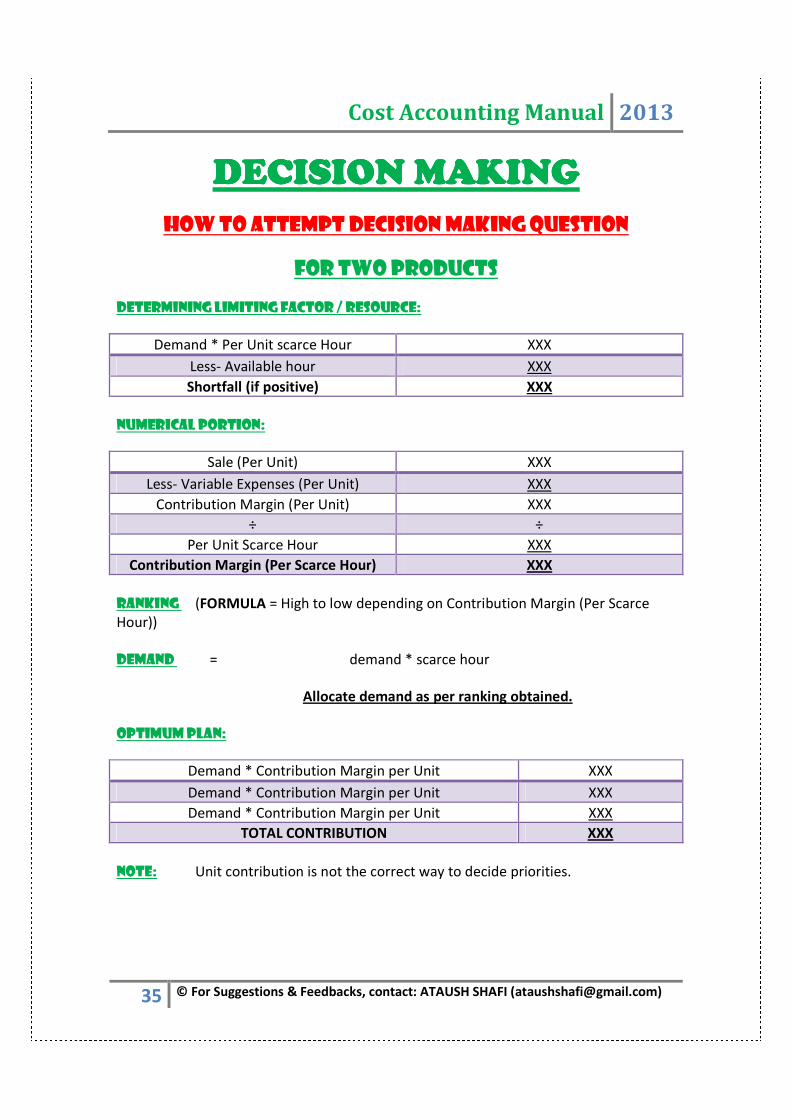
DECISION MAKINGDECISION MAKINGDECISION MAKINGDECISION MAKING
HOW TO ATTEMPT DECISION MAKING QUESTION
FOR TWO PRODUCTS
DETERMINING LIMITING FACTOR / RESOURCE:
Demand * Per Unit scarce Hour XXX
Less- Available hour XXX
Shortfall (if positive) XXX
NUMERICAL PORTION:
Sale (Per Unit) XXX
Less- Variable Expenses (Per Unit) XXX
Contribution Margin (Per Unit) XXX
÷ ÷
Per Unit Scarce Hour XXX
Contribution Margin (Per Scarce Hour) XXX
RANKING (FORMULA = High to low depending on Contribution Margin (Per Scarce
Hour))
DEMAND = demand * scarce hour
Allocate demand as per ranking obtained.
Optimum Plan:
Demand * Contribution Margin per Unit XXX
Demand * Contribution Margin per Unit XXX
Demand * Contribution Margin per Unit XXX
TOTAL CONTRIBUTION XXX
Note: Unit contribution is not the correct way to decide priorities.
Cost Accounting Manual 2013
36 © For Suggestions & Feedbacks, contact: ATAUSH SHAFI ([email protected])
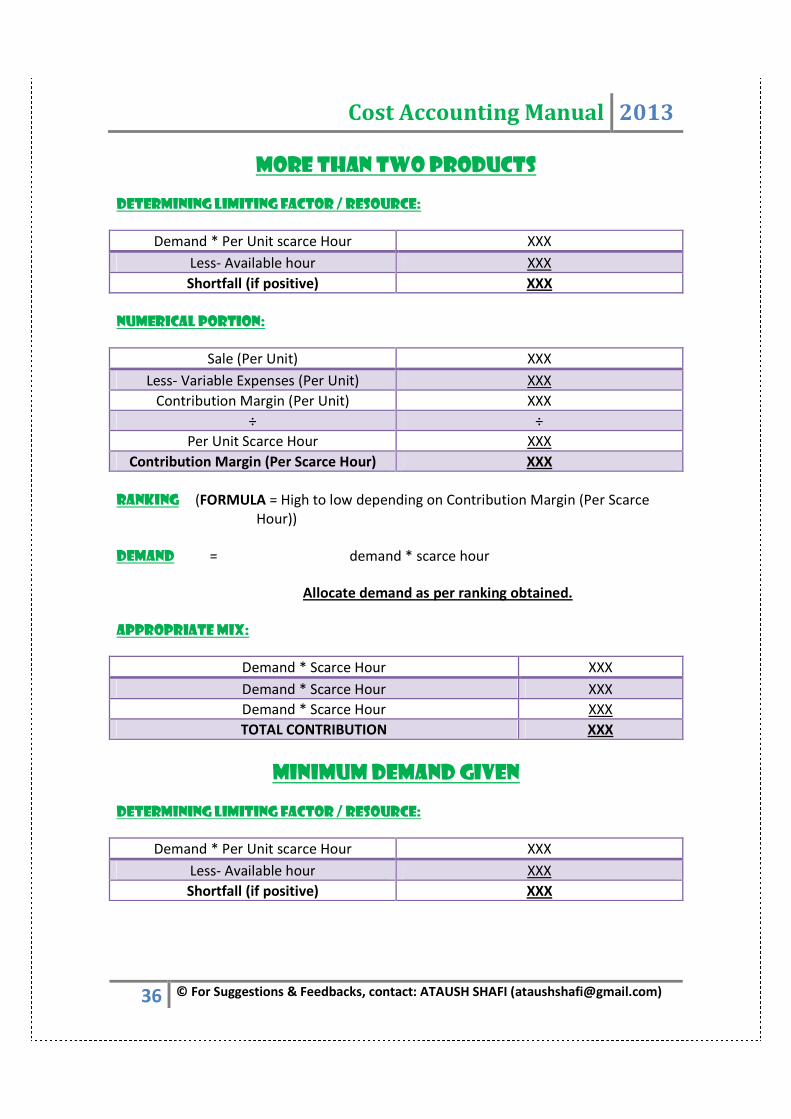
MORE THAN TWO PRODUCTS
DETERMINING LIMITING FACTOR / RESOURCE:
Demand * Per Unit scarce Hour XXX
Less- Available hour XXX
Shortfall (if positive) XXX
NUMERICAL PORTION:
Sale (Per Unit) XXX
Less- Variable Expenses (Per Unit) XXX
Contribution Margin (Per Unit) XXX
÷ ÷
Per Unit Scarce Hour XXX
Contribution Margin (Per Scarce Hour) XXX
RANKING (FORMULA = High to low depending on Contribution Margin (Per Scarce
Hour))
DEMAND = demand * scarce hour
Allocate demand as per ranking obtained.
Appropriate Mix:
Demand * Scarce Hour XXX
Demand * Scarce Hour XXX
Demand * Scarce Hour XXX
TOTAL CONTRIBUTION XXX
MINIMUM DEMAND GIVEN
DETERMINING LIMITING FACTOR / RESOURCE:
Demand * Per Unit scarce Hour XXX
Less- Available hour XXX
Shortfall (if positive) XXX
Cost Accounting Manual 2013
37 © For Suggestions & Feedbacks, contact: ATAUSH SHAFI ([email protected])
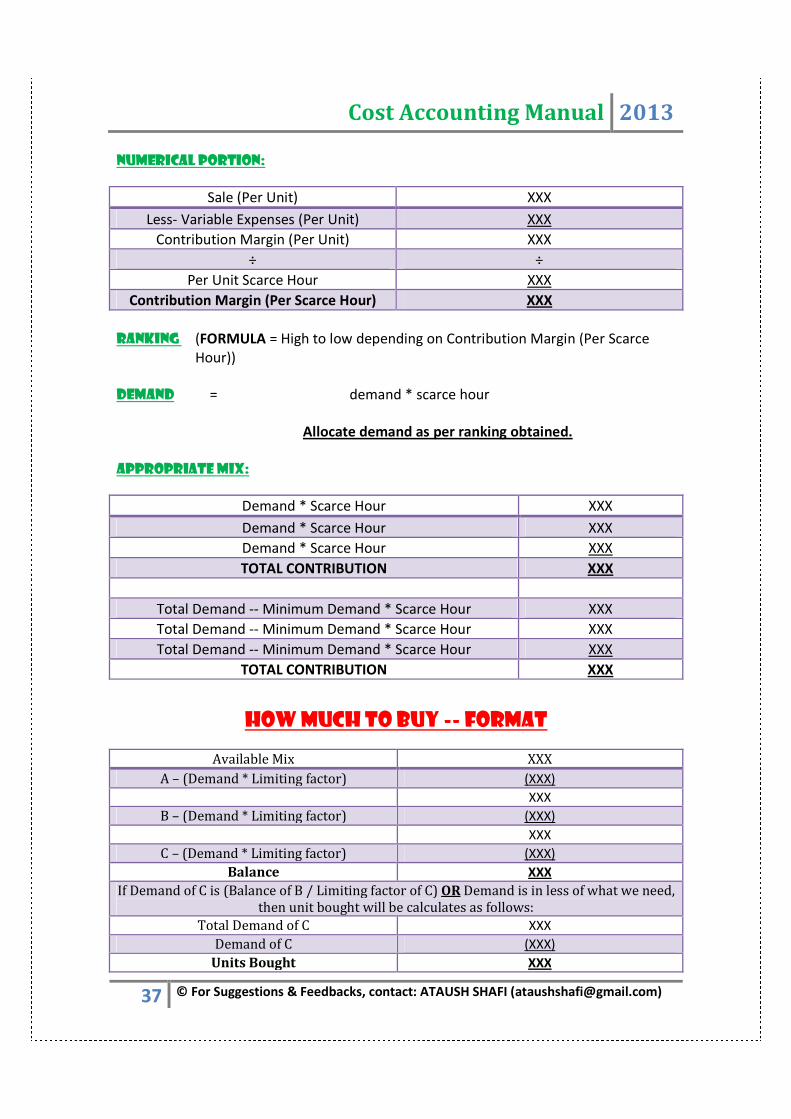
NUMERICAL PORTION:
Sale (Per Unit) XXX
Less- Variable Expenses (Per Unit) XXX
Contribution Margin (Per Unit) XXX
÷ ÷
Per Unit Scarce Hour XXX
Contribution Margin (Per Scarce Hour) XXX
RANKING (FORMULA = High to low depending on Contribution Margin (Per Scarce
Hour))
DEMAND = demand * scarce hour
Allocate demand as per ranking obtained.
Appropriate Mix:
Demand * Scarce Hour XXX
Demand * Scarce Hour XXX
Demand * Scarce Hour XXX
TOTAL CONTRIBUTION XXX
Total Demand -- Minimum Demand * Scarce Hour XXX
Total Demand -- Minimum Demand * Scarce Hour XXX
Total Demand -- Minimum Demand * Scarce Hour XXX
TOTAL CONTRIBUTION XXX
HOW MUCH TO BUY -- FORMAT
Available Mix XXX
A – (Demand * Limiting factor) (XXX)
XXX
B – (Demand * Limiting factor) (XXX)
XXX
C – (Demand * Limiting factor) (XXX)
Balance XXX
If Demand of C is (Balance of B / Limiting factor of C) OR Demand is in less of what we need,
then unit bought will be calculates as follows:
Total Demand of C XXX
Demand of C (XXX)
Units Bought XXX
Cost Accounting Manual 2013
38 © For Suggestions & Feedbacks, contact: ATAUSH SHAFI ([email protected])
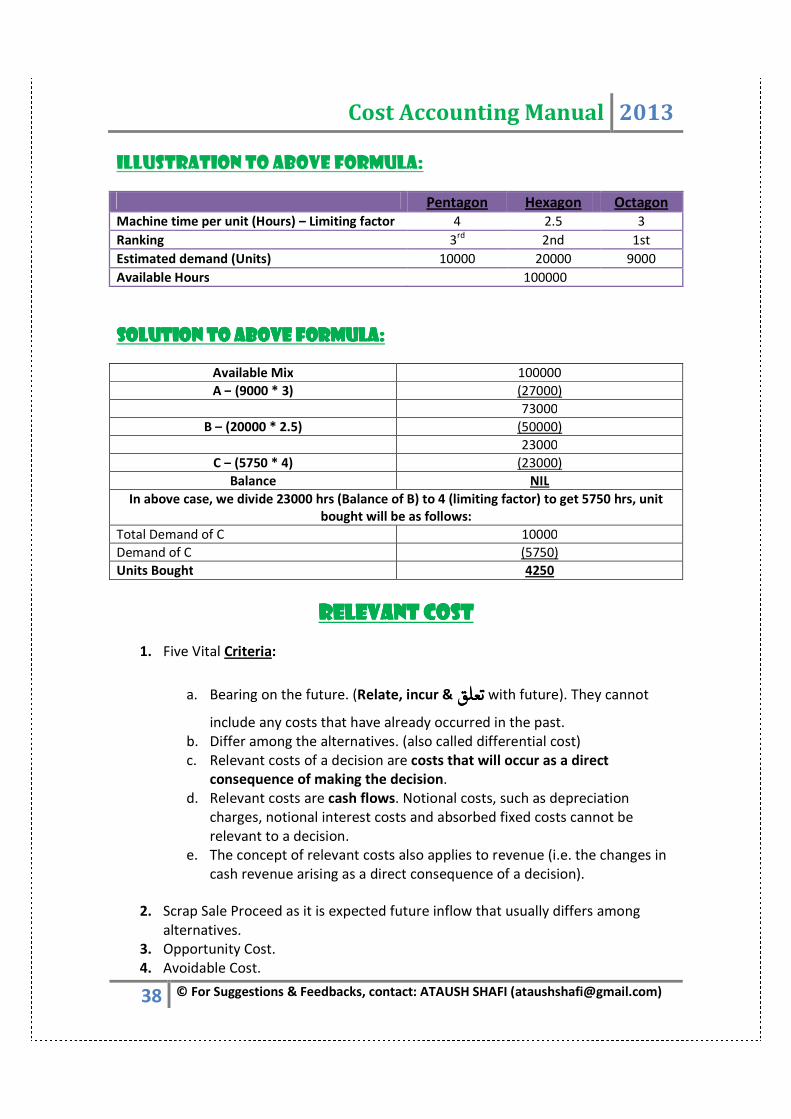
Illustration to above formula:
Pentagon Hexagon Octagon
Machine time per unit (Hours) – Limiting factor 4 2.5 3
Ranking 3rd 2nd 1st
Estimated demand (Units) 10000 20000 9000
Available Hours 100000
Solution to above formula: Solution to above formula: Solution to above formula: Solution to above formula:
Available Mix 100000
A – (9000 * 3) (27000)
73000
B – (20000 * 2.5) (50000)
23000
C – (5750 * 4) (23000)
Balance NIL
In above case, we divide 23000 hrs (Balance of B) to 4 (limiting factor) to get 5750 hrs, unit
bought will be as follows:
Total Demand of C 10000
Demand of C (5750)
Units Bought 4250
RELEVANT COSTRELEVANT COSTRELEVANT COSTRELEVANT COST
1. Five Vital Criteria:
a. Bearing on the future. (Relate, incur & "#$%"#$%"#$%"#$% with future). They cannot
include any costs that have already occurred in the past.
b. Differ among the alternatives. (also called differential cost)
c. Relevant costs of a decision are costs that will occur as a direct
consequence of making the decision.
d. Relevant costs are cash flows. Notional costs, such as depreciation
charges, notional interest costs and absorbed fixed costs cannot be
relevant to a decision.
e. The concept of relevant costs also applies to revenue (i.e. the changes in
cash revenue arising as a direct consequence of a decision).
2. Scrap Sale Proceed as it is expected future inflow that usually differs among
alternatives.
3. Opportunity Cost.
4. Avoidable Cost.
Cost Accounting Manual 2013
39 © For Suggestions & Feedbacks, contact: ATAUSH SHAFI ([email protected])
5. Depreciation on new equipment that is to be purchased.
6. Future Cost that differ between alternatives.
7. Variable Overhead.
8. Additional Cost.
9. Actual Overhead.
10. Incremental cost that could be avoided if contract not undertaken. Provided that
this additional cost is a cash flow.
11. Differential cost provided that this additional cost is a cash flow.
12. Relevant cost & revenue are those that are affected by change in level of activity.
13. Directly attributable fixed cost that although fixed are relevant to decision:
14. Increase if certain extra activities are undertaken.
15. Decrease or eliminated entirely if a decision were taken either to reduce the
scale of operation or shut down entirely.
IRRELEVANT COSTIRRELEVANT COSTIRRELEVANT COSTIRRELEVANT COST
1. Book value as it is past / historical cost. Book Value is irrelevant even if income
taxes are considered. Book Value is essential information for predicting the
amount & timing of future tax cash flows, but, by itself, the book value is
irrelevant.
2. Depreciation on old equipment as it is past cost. Historical cost depreciation that
has been calculated in the conventional manner. Such depreciation calculations
do not result in any future cash flows. They are merely the book entries that are
designed to spread the original cost of an asset over its useful life.
3. Fixed cost is irrelevant. Fixed overheads that will not increase or decrease as a
result of the decision being taken. If the actual amount of overhead incurred by
the company will not alter, then the overhead is not a relevant cost. This is true
even if the amount of overhead to be absorbed by a particular cost unit alters as
a result of the company’s cost accounting procedures for overheads.
4. Unitized fixed cost.
5. Discretionary cost is fixed cost.
6. Allocated/Absorbed/General overhead.
7. Unavoidable Cost because the decision will not affect the cost in any way.
8. Sunk / Past Cost. (Water under the bridges—do not affect the future).
9. Original cost is irrelevant.
10. Estimation cost is past cost.
11. Administration overhead, estimating & design department cost is sunk cost.
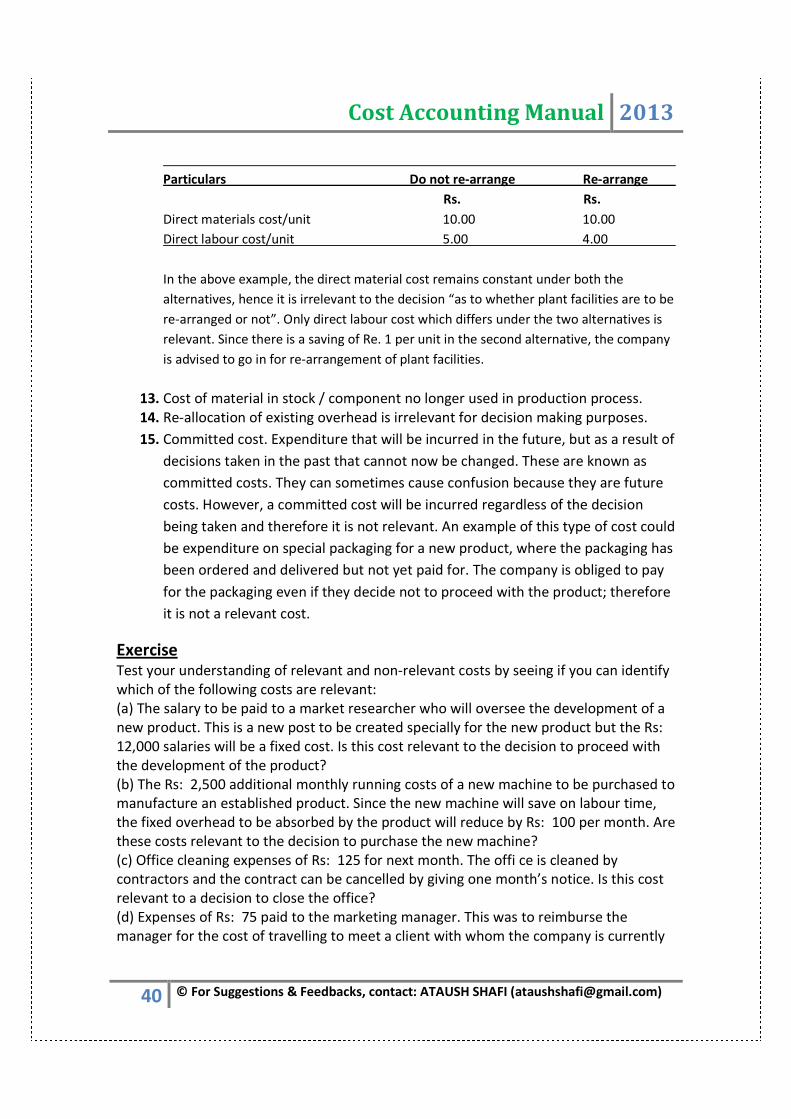
12. Future Cost that don’t differ between alternatives. Even among future costs,
those variable costs which will not differ under various alternatives are
irrelevant. For example, a company proposes to re-arrange plant facilities and
estimates its future cost under two alternative choices, as under:
Cost Accounting Manual 2013
40 © For Suggestions & Feedbacks, contact: ATAUSH SHAFI ([email protected])
Particulars Do not re-arrange Re-arrange
Rs. Rs.
Direct materials cost/unit 10.00 10.00
Direct labour cost/unit 5.00 4.00
In the above example, the direct material cost remains constant under both the
alternatives, hence it is irrelevant to the decision “as to whether plant facilities are to be
re-arranged or not”. Only direct labour cost which differs under the two alternatives is
relevant. Since there is a saving of Re. 1 per unit in the second alternative, the company
is advised to go in for re-arrangement of plant facilities.
13. Cost of material in stock / component no longer used in production process.
14. Re-allocation of existing overhead is irrelevant for decision making purposes.
15. Committed cost. Expenditure that will be incurred in the future, but as a result of
decisions taken in the past that cannot now be changed. These are known as
committed costs. They can sometimes cause confusion because they are future
costs. However, a committed cost will be incurred regardless of the decision
being taken and therefore it is not relevant. An example of this type of cost could
be expenditure on special packaging for a new product, where the packaging has
been ordered and delivered but not yet paid for. The company is obliged to pay
for the packaging even if they decide not to proceed with the product; therefore
it is not a relevant cost.
Exercise Test your understanding of relevant and non-relevant costs by seeing if you can identify
which of the following costs are relevant:
(a) The salary to be paid to a market researcher who will oversee the development of a
new product. This is a new post to be created specially for the new product but the Rs:
12,000 salaries will be a fixed cost. Is this cost relevant to the decision to proceed with
the development of the product?
(b) The Rs: 2,500 additional monthly running costs of a new machine to be purchased to
manufacture an established product. Since the new machine will save on labour time,
the fixed overhead to be absorbed by the product will reduce by Rs: 100 per month. Are
these costs relevant to the decision to purchase the new machine?
(c) Office cleaning expenses of Rs: 125 for next month. The offi ce is cleaned by
contractors and the contract can be cancelled by giving one month’s notice. Is this cost
relevant to a decision to close the office?
(d) Expenses of Rs: 75 paid to the marketing manager. This was to reimburse the
manager for the cost of travelling to meet a client with whom the company is currently
Cost Accounting Manual 2013
41 © For Suggestions & Feedbacks, contact: ATAUSH SHAFI ([email protected])
negotiating a major contract. Is this cost relevant to the decision to continue
negotiations?
Solution (a) The salary is a relevant cost of Rs: 12,000. Do not be fooled by the mention of the
fact that it is a fixed cost, it is a cost that is relevant to the decision to proceed with the
future development of the new product. This is an example of a directly attributable
fixed cost. A directly attributable fixed cost may also be called a product-specific fixed
cost.
(b) The Rs: 2,500 additional running costs are relevant to the decision to purchase the
new machine. The saving in overhead absorption is not relevant since we are not told
that the total overhead expenditure will be altered. The saving in labour cost would be
relevant but we shall assume that this has been accounted for in determining the
additional monthly running costs.
(c) This is not a relevant cost for next month since it will be incurred even if the contract
is cancelled today. If a decision is being made to close the office, this cost cannot be
included as a saving to be made next month. However, it will be saved in the months
after that so it will become a relevant cost saving from month 2 onwards.
(d) This is not a relevant cost of the decision to continue with the contract. The Rs: 75 is
sunk and cannot be recovered even if the company does not proceed with the
negotiations.
NOTIONAL COSTNOTIONAL COSTNOTIONAL COSTNOTIONAL COST
The value of benefit where no actual cost is incurred. There is no actual outflow of cash.
Notional costs such as notional rent and notional interest. These are only relevant if
they represent an identified lost opportunity to use the premises or the finance for
some alternative purpose. In these circumstances, the notional costs would be
opportunity costs.
PPPPOINTS TO CONSIDER IN CLOSE OF BUSINESSOINTS TO CONSIDER IN CLOSE OF BUSINESSOINTS TO CONSIDER IN CLOSE OF BUSINESSOINTS TO CONSIDER IN CLOSE OF BUSINESS
1. Difficult to recapture market due to heavy advertising expenses.
2. Fear of retrenchment of worker.
3. Loss to reputation of business.
4. Temporary close down is not good if relationship with supplier adversely
affected in any way.
5. Fear of non-collection of dues.
6. Plant become obsolete & heavy capital expenditure needed to restart the
business.

Cost Accounting Manual 2013
42 © For Suggestions & Feedbacks, contact: ATAUSH SHAFI ([email protected])
CONTINUE PRODUCTION IF SALE PRICE IS BELOW MARGINAL COSTCONTINUE PRODUCTION IF SALE PRICE IS BELOW MARGINAL COSTCONTINUE PRODUCTION IF SALE PRICE IS BELOW MARGINAL COSTCONTINUE PRODUCTION IF SALE PRICE IS BELOW MARGINAL COST
1. Introducing new product.
2. Exploring foreign market.
3. Purchase of large quantity of material.
4. Eliminate competitor.
5. Perishable nature of goods.
6. Employee cannot be retrenched.
7. Sale of one product at below marginal cost pushes up sale of other product.
DECISION MAKING TIPSDECISION MAKING TIPSDECISION MAKING TIPSDECISION MAKING TIPS
1. In heavy demand → High C/M ratio will earn high profit due to high contribution.
2. In Low demand → Low Break Even Point means high profit as it starts earning
profit at low level of sales.
3. Don’t eliminate the product if the contribution is positive.
4. Don’t accept order from local market if price is below sale price as it will affect
the relationship.
5. To foreigner, it should be accepted if price is below sale price.
6. Cost that is relevant in one situation might be irrelevant in other situation.
MAKE OR BUY / OUTSOURCINGMAKE OR BUY / OUTSOURCINGMAKE OR BUY / OUTSOURCINGMAKE OR BUY / OUTSOURCING
It is the process of obtaining good/service by outside supplier.
Revenue XXX
Less- Cost XXX
Savings XXX
Avoidable cost XXX (XXX)
XXX
UTILISATION OF STORAGE CAPACITYUTILISATION OF STORAGE CAPACITYUTILISATION OF STORAGE CAPACITYUTILISATION OF STORAGE CAPACITY
Accept orders if these questions are replied in “Yes”:
1. Spare capacity available.
2. Contribution is positive.
Incremental Revenue XXX
Incremental Cost XXX
Incremental Contribution XXX

Cost Accounting Manual 2013
43 © For Suggestions & Feedbacks, contact: ATAUSH SHAFI ([email protected])
REVELANT RANGE OF ACTIVITYREVELANT RANGE OF ACTIVITYREVELANT RANGE OF ACTIVITYREVELANT RANGE OF ACTIVITY
Range within which unit price are likely to be constant.
1. Step is large.
2. Step is small. Reason is that cost is variable cost.
In short term, cost is fixed which become variable with the passage of time.
ACCEPT OR REJECTACCEPT OR REJECTACCEPT OR REJECTACCEPT OR REJECT
Sale price > variable manufacturing cost → Accept order.
Sale price < variable manufacturing cost → Reject order.
Here, variable manufacturing cost means:
Variable manufacturing cost XXX
Add-- Opportunity Cost XXX
Less—Savings XXX
TOTAL XXX
MAKE OR BUY = Variable manufacturing cost > Buy cost → Buy.
Variable manufacturing cost < Buy cost → Make.
MAXIMUM PRICE = Variable manufacturing cost.
OPPORTUNITY COST = The maximum available contribution to profit forgone (or
passed up / loss of revenue) by using limited resources for particular purposes. This cost
will never appear in the set of double entry cost accounts.
The best way to demonstrate opportunity costs is to consider some examples:
(a) A company has some obsolete material in stock that it is considering using for a
special contract. If the material is not used on the contract it can either be sold back to
the supplier for Rs: 2 per tonne or it can be used on another contract in place of a
different material that would usually cost Rs: 2.20 per tonne. The opportunity cost of
using the material on the special contract is Rs: 2.20 per tonne. This is the value of the
next best alternative use for the material, or the benefit forgone by not using it for the
other contract.
Cost Accounting Manual 2013
44 © For Suggestions & Feedbacks, contact: ATAUSH SHAFI ([email protected])
(b) C is deciding whether or not to take a skiing holiday this year. The travel agent is
quoting an all-inclusive holiday cost of Rs: 675 for a week. C will lose the chance to earn
Rs: 200 for a part-time job during the week that the holiday would be taken. The
relevant cost of taking the holiday is Rs: 875. This is made up of the out-of-pocket cost
of Rs: 675, plus the Rs: 200 opportunity cost that is the part-time wages forgone.
NOTIONAL COSTS AND OPPORTUNITY COSTS Notional costs and opportunity costs are in fact very similar. This is particularly
noticeable in the case of notional rent. The notional rent could be the rental that the
company is forgoing by occupying the premises itself, i.e. it could be an opportunity
cost. However, it is only a true opportunity cost if the company can actually identify a
forgone opportunity to rent the premises. If nobody is willing to pay the rent, then it is
not an opportunity cost.
INCREMENTAL COST: Increase of output due to change in cost result in change in
activity level. Also called Differential Cost.
DECREMENT COST: A differential cost is therefore an amount by which future costs
will be higher or lower, if a particular course of action is chosen.
OUT OF POCKET EXPENSES: Those costs that entail current or near future outlays for
the decision at hand. E.g the business man can either use his car to attend meeting at
cost of Rs: 25/- or he can drive to the station (cost Rs: 1/-) & let the train take the train
at cost of Rs: 20/-. The out of pocket expense is the additional cash expense of Rs: 51-25
= 26.
SUNK COST: Money already spent that cannot now be recovered. More specifically
“water under the bridges” OR “bygones are bygones”. An example of a sunk cost is
expenditure that has been incurred in developing a new product. The money cannot be
recovered even if a decision is taken to abandon any further development of the
product. The cost is therefore not relevant to future decisions concerning the product.
DIRECTLY ATTRIBUTABLE FC: This cost has two features:
• Increase if certain extra activities were undertaken.
• Decrease or be eliminated entirely if a decision were taken either to reduce
the scale of operations or shut down entirely.

Cost Accounting Manual 2013
45 © For Suggestions & Feedbacks, contact: ATAUSH SHAFI ([email protected])
SCARCE RESOURCE / LIMITING FACTORSCARCE RESOURCE / LIMITING FACTORSCARCE RESOURCE / LIMITING FACTORSCARCE RESOURCE / LIMITING FACTOR
Anything that limits the activity of an entity is called limiting factor. E.g:
1. Demand
2. Material
3. Labor hour
4. Machine hour
No Limiting Factor High CM ratio is good.
Limiting Factor High contribution per scarce resource is
good.
INCREMENTAL ANALYSISINCREMENTAL ANALYSISINCREMENTAL ANALYSISINCREMENTAL ANALYSIS
Incremental analysis considers only that item of revenue, cost & volume that will change
if new program is implemented.
Expected C/M (Expected sale * C/M ratio) XXX
Previous C/M (Old sale * C/M ratio) XXX
Increased C/M XXX
Less- Additional Sales XXX
Increased Net Operating Income XXX
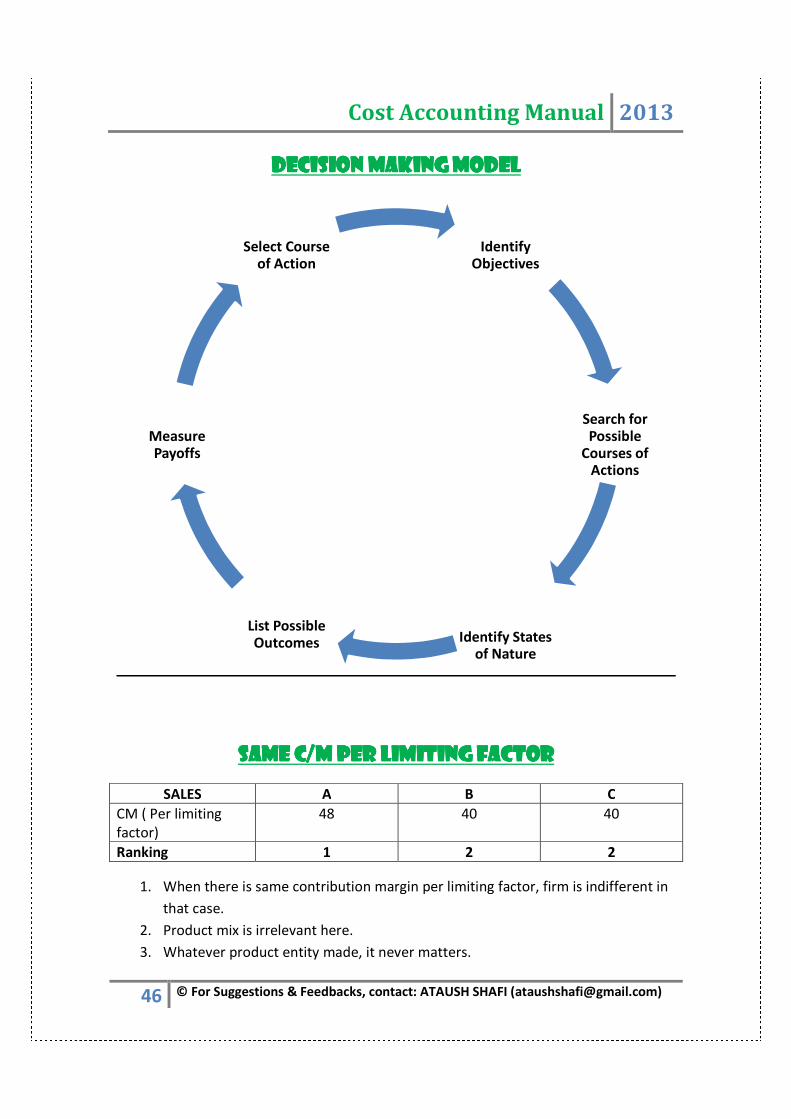
Cost Accounting Manual 2013
46 © For Suggestions & Feedbacks, contact: ATAUSH SHAFI ([email protected])
DECISION MAKING MODELDECISION MAKING MODELDECISION MAKING MODELDECISION MAKING MODEL
SAME C/M PER LIMITING FACTORSAME C/M PER LIMITING FACTORSAME C/M PER LIMITING FACTORSAME C/M PER LIMITING FACTOR
SALES A B C
CM ( Per limiting
factor)
48 40 40
Ranking 1 2 2
1. When there is same contribution margin per limiting factor, firm is indifferent in
that case.
2. Product mix is irrelevant here.
3. Whatever product entity made, it never matters.
Identify Objectives
Search for Possible
Courses of Actions
Identify States of Nature
List Possible Outcomes
Measure Payoffs
Select Course of Action

Cost Accounting Manual 2013
47 © For Suggestions & Feedbacks, contact: ATAUSH SHAFI ([email protected])
SPECIAL ORDERSPECIAL ORDERSPECIAL ORDERSPECIAL ORDER
CONCEPTCONCEPTCONCEPTCONCEPTSSSS
CASE # 1: Quantity is not same but VC per unit is same, then we will get total cost
by this formula: quantity * VC per unit
A B TOTAL
Qty 100 300 400
VC Per unit 3 3 3
Total VC 300 900 1200
CASE # 2: Quantity is same but VC per unit is not same, then we will get total cost
by this formula: quantity * VC per unit
A B TOTAL
Qty 200 200 400
VC Per unit 2 3
Total VC 400 600 1000
CASE # 3: Quantity is not same & VC per unit is also not same, then we will get total
cost by this formula: weighted average cost
A B TOTAL
Qty 300 500 800
VC Per unit 1 4
Total VC 300 2000 2300
� � اور &� ��� � �() �* + �� و,� �� -�� Loss اس
�� Opportunity Lossا*� �� ����
� � اور &� ��� � �() �* + �� و,� �� -�� ا*� Gain اس
Opportunity Gain �� �� ����
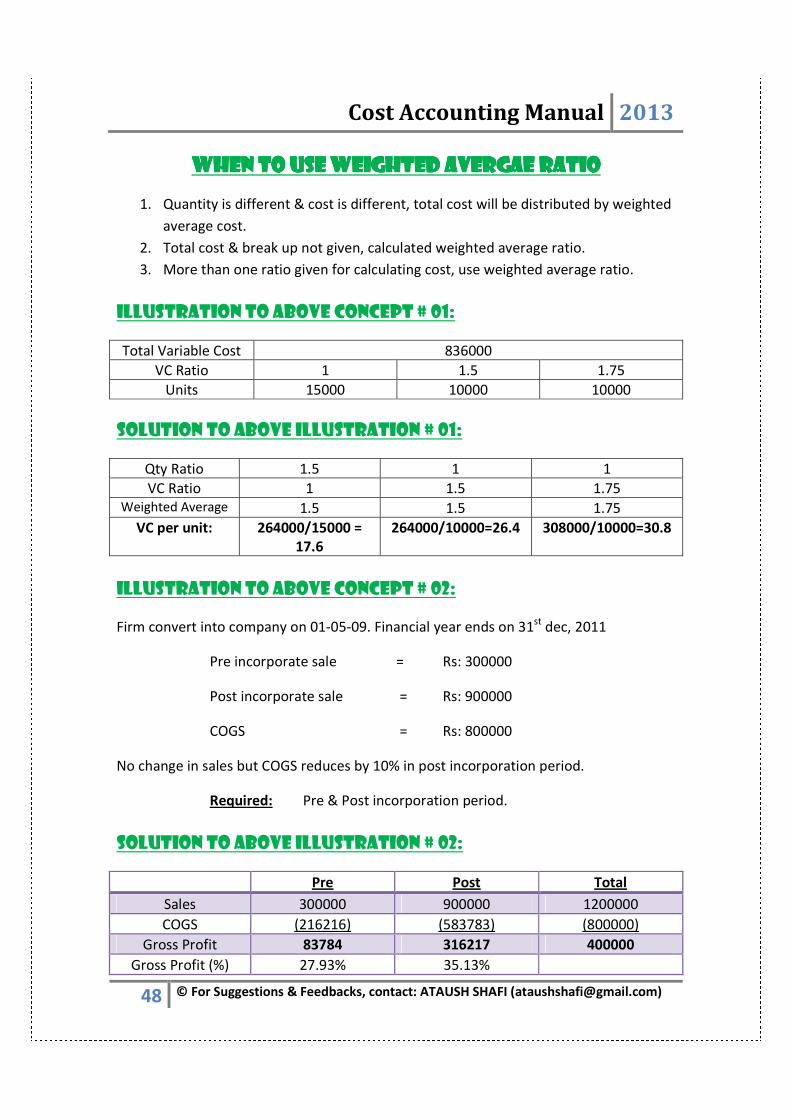
Cost Accounting Manual 2013
48 © For Suggestions & Feedbacks, contact: ATAUSH SHAFI ([email protected])
WHENWHENWHENWHEN TO USE WEIGHTED AVERGAE RATIOTO USE WEIGHTED AVERGAE RATIOTO USE WEIGHTED AVERGAE RATIOTO USE WEIGHTED AVERGAE RATIO
1. Quantity is different & cost is different, total cost will be distributed by weighted
average cost.
2. Total cost & break up not given, calculated weighted average ratio.
3. More than one ratio given for calculating cost, use weighted average ratio.
Illustration to above concept # 01:
Total Variable Cost 836000
VC Ratio 1 1.5 1.75
Units 15000 10000 10000
Solution to above illustration # 01:
Qty Ratio 1.5 1 1
VC Ratio 1 1.5 1.75
Weighted Average 1.5 1.5 1.75
VC per unit:
264000/15000 =
17.6
264000/10000=26.4 308000/10000=30.8
Illustration to above concept # 02:
Firm convert into company on 01-05-09. Financial year ends on 31st
dec, 2011
Pre incorporate sale = Rs: 300000
Post incorporate sale = Rs: 900000
COGS = Rs: 800000
No change in sales but COGS reduces by 10% in post incorporation period.
Required: Pre & Post incorporation period.
Solution to above illustration # 02:
Pre Post Total
Sales 300000 900000 1200000
COGS (216216) (583783) (800000)
Gross Profit 83784 316217 400000
Gross Profit (%) 27.93% 35.13%
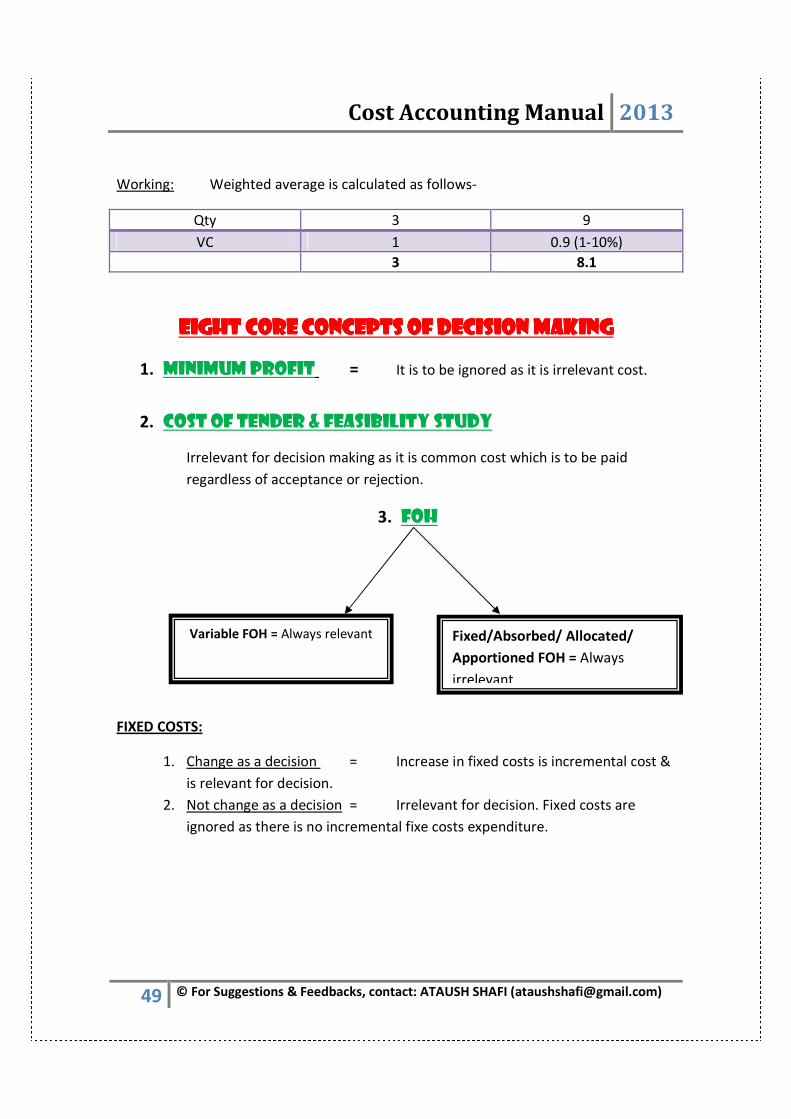
Cost Accounting Manual 2013
49 © For Suggestions & Feedbacks, contact: ATAUSH SHAFI ([email protected])
Working: Weighted average is calculated as follows-
Qty 3 9
VC 1 0.9 (1-10%)
3 8.1
EIGHT CORE CONCEPTS OF DECISION MAKINGEIGHT CORE CONCEPTS OF DECISION MAKINGEIGHT CORE CONCEPTS OF DECISION MAKINGEIGHT CORE CONCEPTS OF DECISION MAKING
1. MINIMUM PROFIT = It is to be ignored as it is irrelevant cost.
2. COST OF TENDER & FEASIBILITY STUDY
Irrelevant for decision making as it is common cost which is to be paid
regardless of acceptance or rejection.
3. FOH
FIXED COSTS:
1. Change as a decision = Increase in fixed costs is incremental cost &
is relevant for decision.
2. Not change as a decision = Irrelevant for decision. Fixed costs are
ignored as there is no incremental fixe costs expenditure.
Variable FOH = Always relevant
Fixed/Absorbed/ Allocated/
Apportioned FOH = Always
irrelevant

50 © For Suggestions &
Variable Cost
(No of hr * per hr
Labor - 2
Full Capacity
Spare Capacity
Cost Accounting Manual
For Suggestions & Feedbacks, contact: ATAUSH SHAFI ([email protected])
4. LABOR - 1
LABOR - 2
Labor
Variable Cost
(No of hr * per hr rate)
Committed Cost
1 - Irrelevant upto committed level
2 - Relevant over & above that level
Shift in Labor
1 - Variable Cost
2 - Opportunity Cost ( No of hr * per hr
contribution)
Full CapacityAdditional work cannot be done/
undertaken
Hire Staff
Not Hire Staff
Spare CapacityAdditional work can
be done/ undertakenNIL Relevant Cost
Cost Accounting Manual 2013
ATAUSH SHAFI ([email protected])
Shift in Labor
Variable Cost
Opportunity Cost ( No of hr * per hr
contribution)
Hire Staff Current Pay
Not Hire Staff
1 - Variable Expense
+
2 - Lost Contribution
NIL Relevant Cost

51 © For Suggestions &
Regular Use/ Alternative Use /
Replacement
Current replacement price ( No of kg used * per
kg)
Regular Use
Raw Material bought for
regular use = Current
replacement Price
Raw Material not bought
for regular use = Loss of
contribution margin of
regular use
Cost Accounting Manual
For Suggestions & Feedbacks, contact: ATAUSH SHAFI ([email protected])
5. MATERIAL
Material
replacement price (
Non - Regular Use / Non - Alternative
Use / Non -Replacement
Have no resale value
Resale Value
Have some value OR reslae value
Higher of other value OR reslae
value
RAW MATERIAL ALREADY PURCHASED
No Regular / Alternative Use
Scrap Value = Loss of scrap
value
No Scrap Value = NIL
Cost of disposal = Savings of
cost of disposal (opportunity
gain)
2
Cost Accounting Manual 2013
ATAUSH SHAFI ([email protected])
No resale value OR other use
ZERO
Alternative Use
Higher of
1 – Scrap value
OR
2 – Value in alternative use
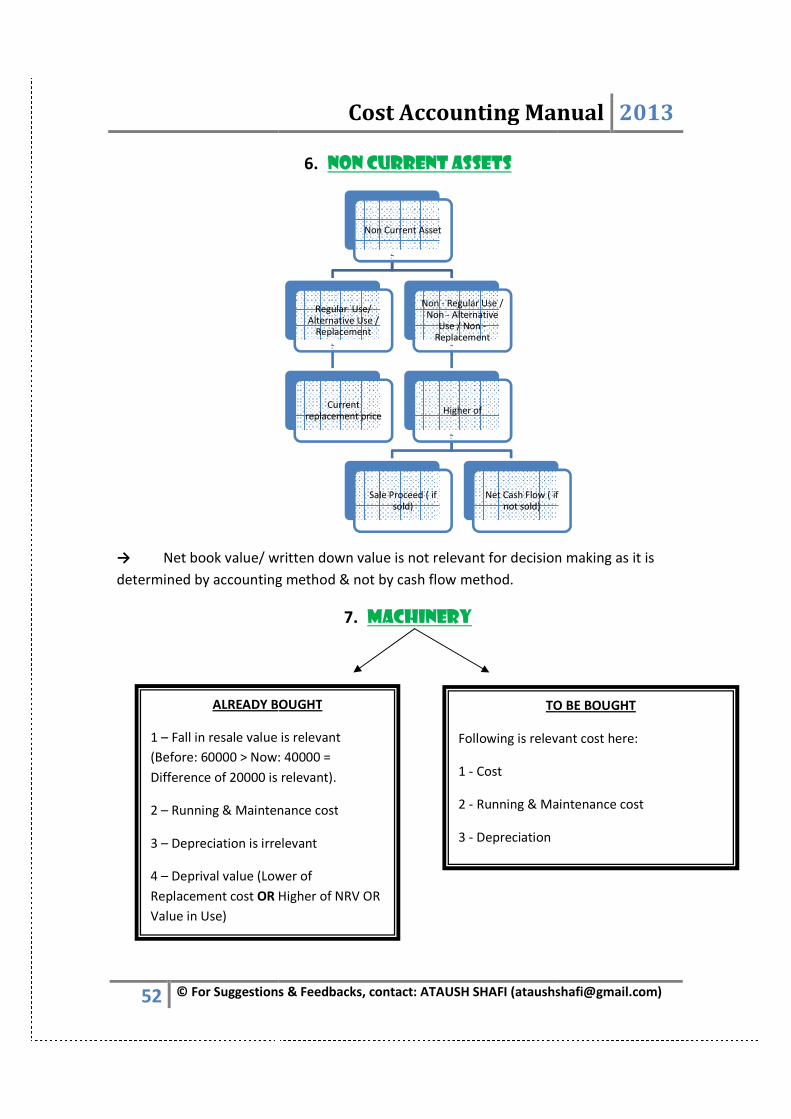
52 © For Suggestions &
→ Net book value/ written down value is not relevant for decision making as it is
determined by accounting method & not by cash flow method.
ALREADY BOUGHT
1 – Fall in resale value is relevant
(Before: 60000 > Now: 40000 =
Difference of 20000 is relevant).
2 – Running & Maintenance cost
3 – Depreciation is irrelevant
4 – Deprival value (Lower of
Replacement cost OR Higher of NRV OR
Value in Use)
Cost Accounting Manual
For Suggestions & Feedbacks, contact: ATAUSH SHAFI ([email protected])
6. NON CURRENT ASSETS
Net book value/ written down value is not relevant for decision making as it is
determined by accounting method & not by cash flow method.
7. MACHINERY
Non Current Asset
Regular Use/ Alternative Use /
Replacement
Current replacement price
Non - Regular Use / Non - Alternative
Use / Non -Replacement
Higher of
Sale Proceed ( if sold)
Net Cash Flow ( if not sold)
ALREADY BOUGHT
Fall in resale value is relevant
(Before: 60000 > Now: 40000 =
Difference of 20000 is relevant).
Running & Maintenance cost
Depreciation is irrelevant
Deprival value (Lower of
Higher of NRV OR
TO BE BOUGHT
Following is relevant cost here:
1 - Cost
2 - Running & Maintenance cost
3 - Depreciation
Cost Accounting Manual 2013
ATAUSH SHAFI ([email protected])
Net book value/ written down value is not relevant for decision making as it is
Net Cash Flow ( if
TO BE BOUGHT
Following is relevant cost here:
Running & Maintenance cost
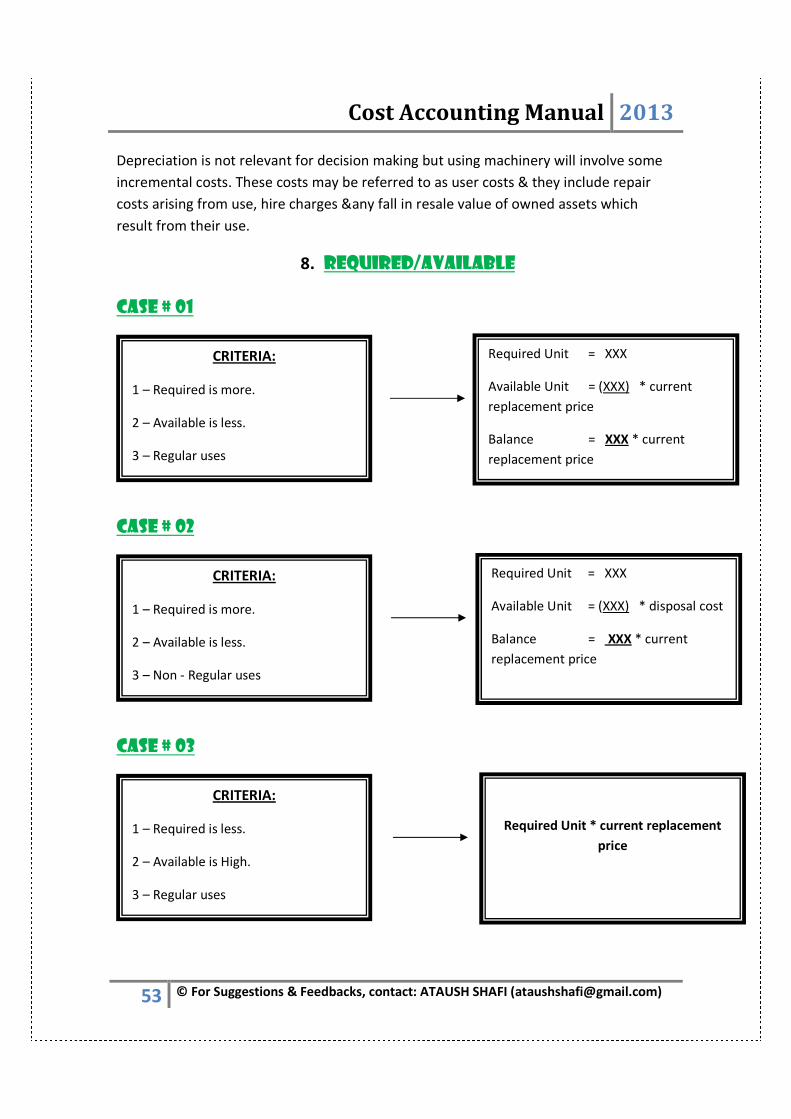
Cost Accounting Manual 2013
53 © For Suggestions & Feedbacks, contact: ATAUSH SHAFI ([email protected])
Depreciation is not relevant for decision making but using machinery will involve some
incremental costs. These costs may be referred to as user costs & they include repair
costs arising from use, hire charges &any fall in resale value of owned assets which
result from their use.
8. REQUIRED/AVAILABLE
CASE # 01
CASE # 02
CASE # 03
CRITERIA:
1 – Required is more.
2 – Available is less.
3 – Regular uses
Required Unit = XXX
Available Unit = (XXX) * current
replacement price
Balance = XXX * current
replacement price
CRITERIA:
1 – Required is more.
2 – Available is less.
3 – Non - Regular uses
Required Unit = XXX
Available Unit = (XXX) * disposal cost
Balance = XXX * current
replacement price
CRITERIA:
1 – Required is less.
2 – Available is High.
3 – Regular uses
Required Unit * current replacement
price
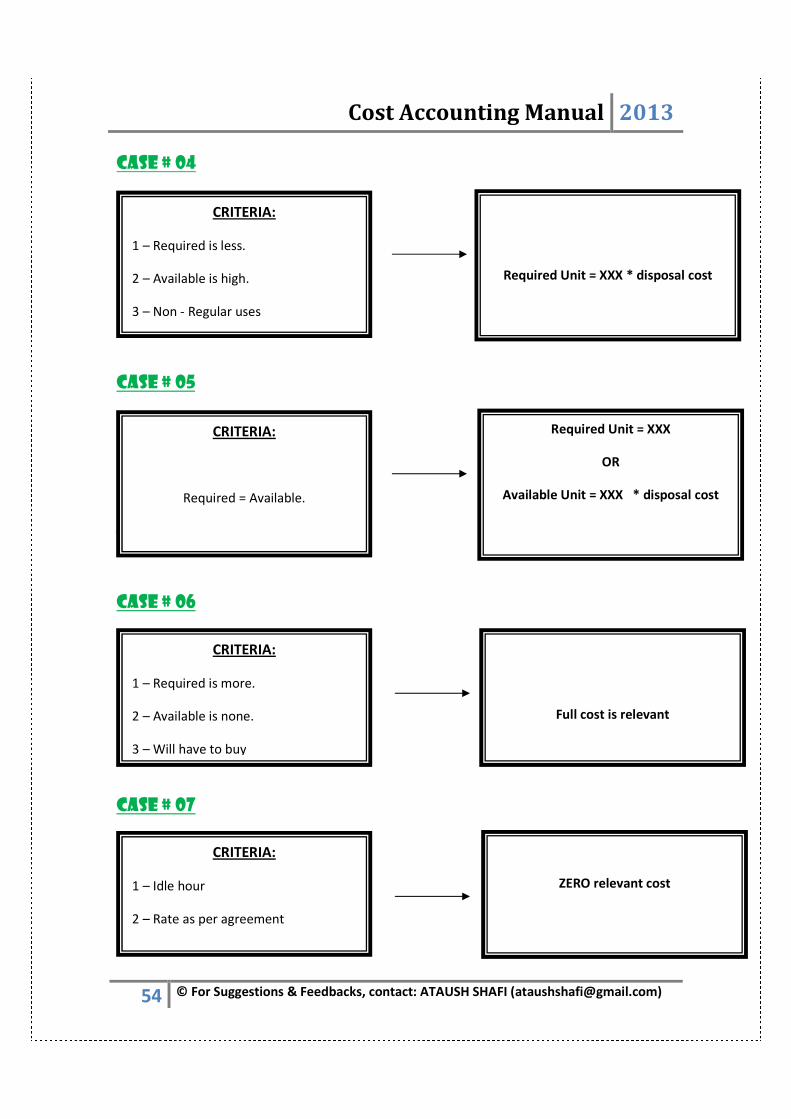
Cost Accounting Manual 2013
54 © For Suggestions & Feedbacks, contact: ATAUSH SHAFI ([email protected])
CASE # 04
CASE # 05
CASE # 06
CASE # 06
CASE # 07
Full cost is relevant
CRITERIA:
1 – Required is more.
2 – Available is none.
3 – Will have to buy
CRITERIA:
1 – Required is less.
2 – Available is high.
3 – Non - Regular uses
Required Unit = XXX * disposal cost
CRITERIA:
Required = Available.
Required Unit = XXX
OR
Available Unit = XXX * disposal cost
CRITERIA:
1 – Idle hour
2 – Rate as per agreement
ZERO relevant cost
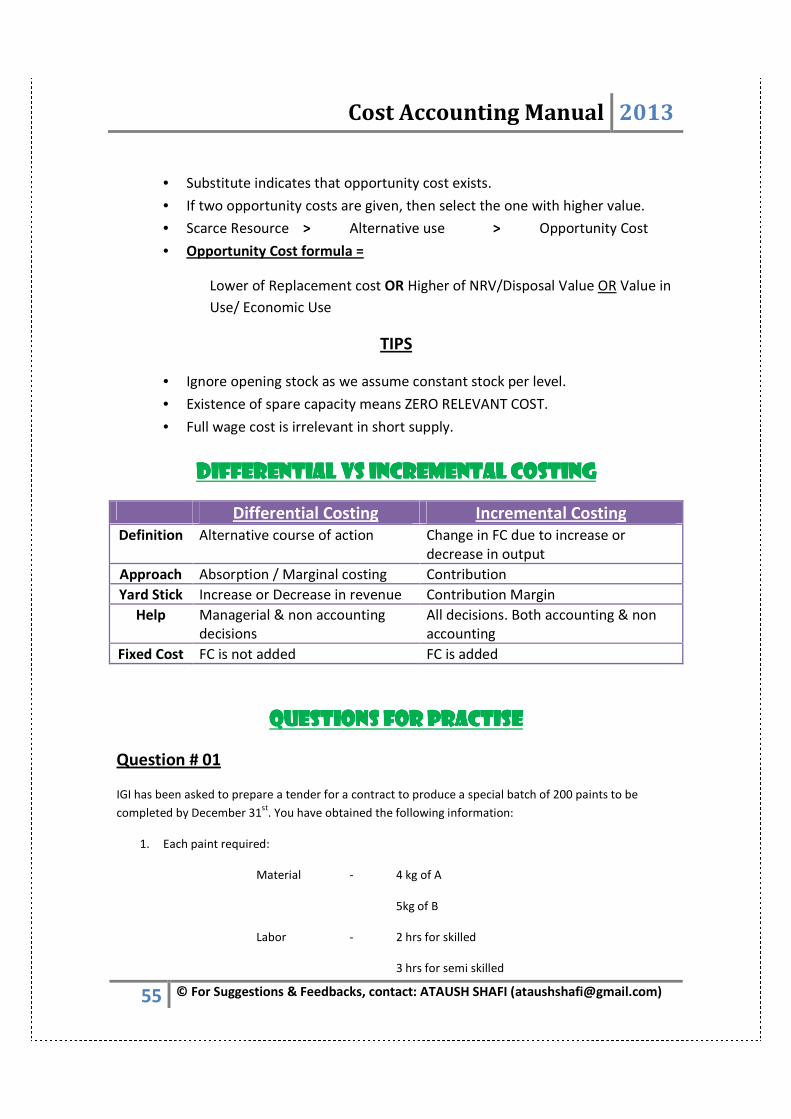
Cost Accounting Manual 2013
55 © For Suggestions & Feedbacks, contact: ATAUSH SHAFI ([email protected])
• Substitute indicates that opportunity cost exists.
• If two opportunity costs are given, then select the one with higher value.
• Scarce Resource > Alternative use > Opportunity Cost
• Opportunity Cost formula =
Lower of Replacement cost OR Higher of NRV/Disposal Value OR Value in
Use/ Economic Use
TIPS
• Ignore opening stock as we assume constant stock per level.
• Existence of spare capacity means ZERO RELEVANT COST.
• Full wage cost is irrelevant in short supply.
DIFFERENTIAL VS INCREMENTAL COSTINGDIFFERENTIAL VS INCREMENTAL COSTINGDIFFERENTIAL VS INCREMENTAL COSTINGDIFFERENTIAL VS INCREMENTAL COSTING
Differential Costing Incremental Costing
Definition Alternative course of action Change in FC due to increase or
decrease in output
Approach Absorption / Marginal costing Contribution
Yard Stick Increase or Decrease in revenue Contribution Margin
Help Managerial & non accounting
decisions
All decisions. Both accounting & non
accounting
Fixed Cost FC is not added FC is added
QUESTIONS FOQUESTIONS FOQUESTIONS FOQUESTIONS FORRRR PRACTISEPRACTISEPRACTISEPRACTISE
Question # 01
IGI has been asked to prepare a tender for a contract to produce a special batch of 200 paints to be
completed by December 31st
. You have obtained the following information:
1. Each paint required:
Material - 4 kg of A
5kg of B
Labor - 2 hrs for skilled
3 hrs for semi skilled
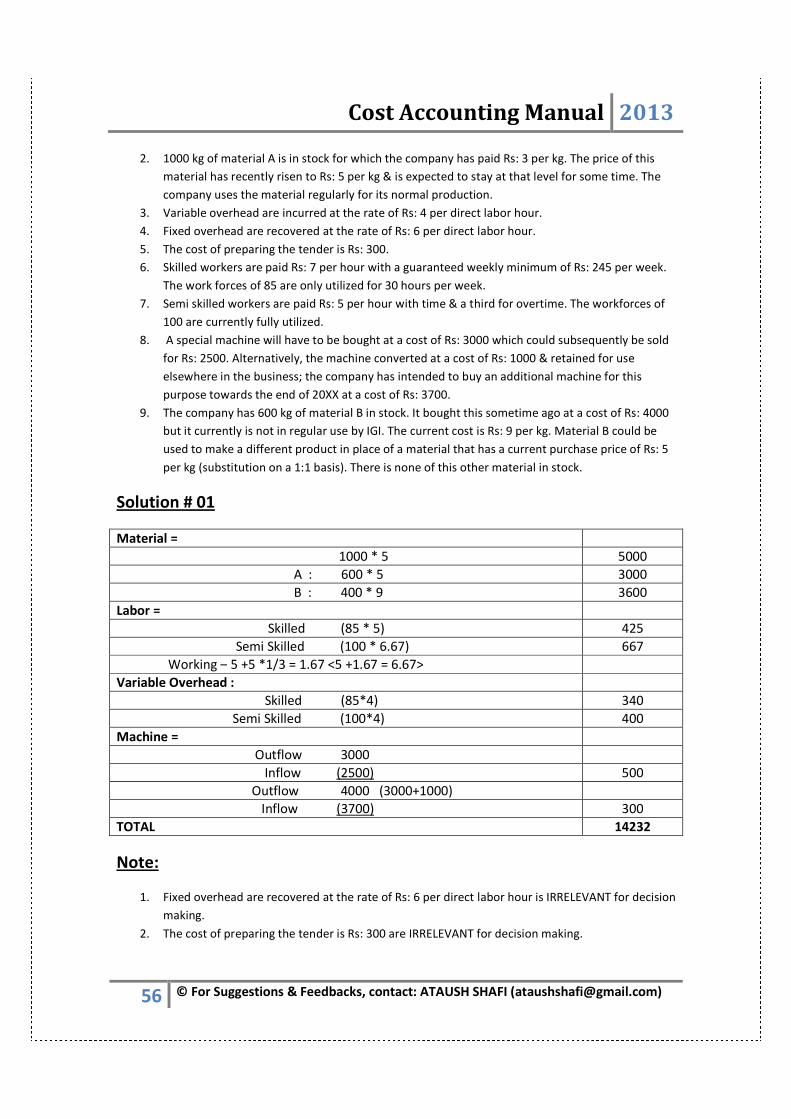
Cost Accounting Manual 2013
56 © For Suggestions & Feedbacks, contact: ATAUSH SHAFI ([email protected])
2. 1000 kg of material A is in stock for which the company has paid Rs: 3 per kg. The price of this
material has recently risen to Rs: 5 per kg & is expected to stay at that level for some time. The
company uses the material regularly for its normal production.
3. Variable overhead are incurred at the rate of Rs: 4 per direct labor hour.
4. Fixed overhead are recovered at the rate of Rs: 6 per direct labor hour.
5. The cost of preparing the tender is Rs: 300.
6. Skilled workers are paid Rs: 7 per hour with a guaranteed weekly minimum of Rs: 245 per week.
The work forces of 85 are only utilized for 30 hours per week.
7. Semi skilled workers are paid Rs: 5 per hour with time & a third for overtime. The workforces of
100 are currently fully utilized.
8. A special machine will have to be bought at a cost of Rs: 3000 which could subsequently be sold
for Rs: 2500. Alternatively, the machine converted at a cost of Rs: 1000 & retained for use
elsewhere in the business; the company has intended to buy an additional machine for this
purpose towards the end of 20XX at a cost of Rs: 3700.
9. The company has 600 kg of material B in stock. It bought this sometime ago at a cost of Rs: 4000
but it currently is not in regular use by IGI. The current cost is Rs: 9 per kg. Material B could be
used to make a different product in place of a material that has a current purchase price of Rs: 5
per kg (substitution on a 1:1 basis). There is none of this other material in stock.
Solution # 01
Material =
1000 * 5 5000
A : 600 * 5 3000
B : 400 * 9 3600
Labor =
Skilled (85 * 5) 425
Semi Skilled (100 * 6.67) 667
Working – 5 +5 *1/3 = 1.67 <5 +1.67 = 6.67>
Variable Overhead :
Skilled (85*4) 340
Semi Skilled (100*4) 400
Machine =
Outflow 3000
Inflow (2500) 500
Outflow 4000 (3000+1000)
Inflow (3700) 300
TOTAL 14232
Note:
1. Fixed overhead are recovered at the rate of Rs: 6 per direct labor hour is IRRELEVANT for decision
making.
2. The cost of preparing the tender is Rs: 300 are IRRELEVANT for decision making.

Cost Accounting Manual 2013
57 © For Suggestions & Feedbacks, contact: ATAUSH SHAFI ([email protected])
Question # 02
Mr. Bill Gates has been asked to quote a price for a special contract. He ahs recently prepared his tender
but has asked you to review it for him.
He has pointed out to you that he wants to quote the minimum price as he believes this will lead to more
lucrative work in the future. Mr. Bill Gates tender:
Material:
A : 2000 kg @ Rs: 10 per kg 20000
B : 1000 kg @ Rs: 15 per kg 15000
C : 500 kg @ Rs: 40 per kg 20000
D : 50 liter @ Rs: 12 per liter 600
Labor:
Skilled : 1000 hrs @ Rs: 25 per hr 25000
Semi - Skilled : 2000 hrs @ Rs: 15 per hr 30000
Un Skilled : 500 hrs @ Rs: 10 per hr 5000
Fixed overhead : 3500 hrs @ Rs: 12 per hr 42000
Costs of preparing the tender :
Mr. Bill Gates time 1000
Other expenses 500
Minimum profit (5% of total costs) 7725
Minimum tender price 166825
Other information:
Material – A: 1000 kgs of this material is in stock of Rs: 5 per kg. Mr. Bill Gates has no alternative use for
his material & intends selling it for Rs: 2 per kg. However, if he sold any he would have to pay a fixed sum
of Rs: 300 to cover delivery costs. The current purchase price is Rs: 10 per kg.
Material – B: there is plenty of this material in stock at a cost of Rs: 18 per kg. . The current purchase price
ahs fallen to Rs: 15 per kg. This material is constantly used by Mr. Bill Gates in his business.
Material – C: the total amount in stock of Rs: 500 kgs was bought for Rs: 10000 some time ago for
another one- off contract which never happened. Mr. Bill Gates is considering selling it for Rs: 6000 in
total or using it as a substitute for another material constantly used in normal production. If used in this
latter manner, it would save Rs: 8000 of the other material. Current purchase price is Rs: 40 per kg.
Material – D: there are 100 liters of this material in stock. It is dangerous & is not used in this contract,
will have to be disposed of at a cost to Mr. Bill Gates of Rs: 50 per liter. The current purchase price is Rs:
12 per liter.
Skilled Labor: Mr. Bill Gates only hires skilled labor when he needs it. Rs: 25 per hour is the current hourly
rate.
Semi Skilled labor: Mr. Bill Gates has workforce of 50 semi skilled laborers who are not currently fully
employed. They are on normal contracts & the number of spare hours currently available for this project
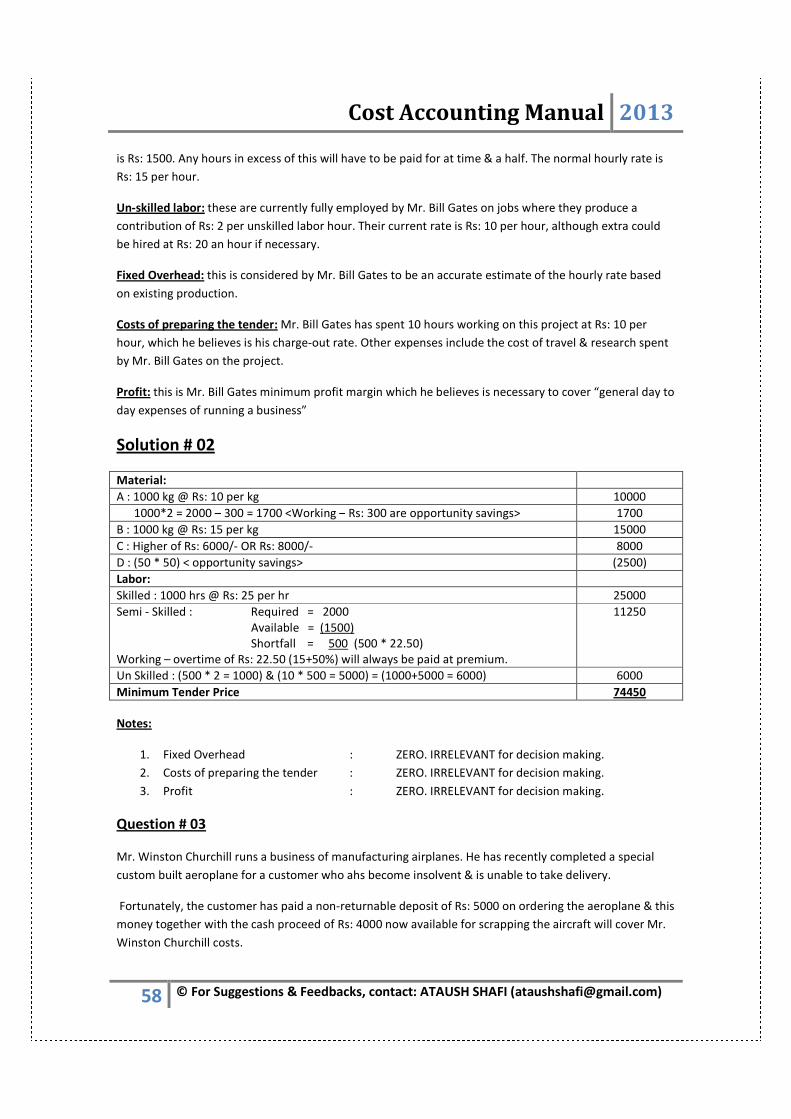
Cost Accounting Manual 2013
58 © For Suggestions & Feedbacks, contact: ATAUSH SHAFI ([email protected])
is Rs: 1500. Any hours in excess of this will have to be paid for at time & a half. The normal hourly rate is
Rs: 15 per hour.
Un-skilled labor: these are currently fully employed by Mr. Bill Gates on jobs where they produce a
contribution of Rs: 2 per unskilled labor hour. Their current rate is Rs: 10 per hour, although extra could
be hired at Rs: 20 an hour if necessary.
Fixed Overhead: this is considered by Mr. Bill Gates to be an accurate estimate of the hourly rate based
on existing production.
Costs of preparing the tender: Mr. Bill Gates has spent 10 hours working on this project at Rs: 10 per
hour, which he believes is his charge-out rate. Other expenses include the cost of travel & research spent
by Mr. Bill Gates on the project.
Profit: this is Mr. Bill Gates minimum profit margin which he believes is necessary to cover “general day to
day expenses of running a business”
Solution # 02
Material:
A : 1000 kg @ Rs: 10 per kg 10000
1000*2 = 2000 – 300 = 1700 <Working – Rs: 300 are opportunity savings> 1700
B : 1000 kg @ Rs: 15 per kg 15000
C : Higher of Rs: 6000/- OR Rs: 8000/- 8000
D : (50 * 50) < opportunity savings> (2500)
Labor:
Skilled : 1000 hrs @ Rs: 25 per hr 25000
Semi - Skilled : Required = 2000
Available = (1500)
Shortfall = 500 (500 * 22.50)
Working – overtime of Rs: 22.50 (15+50%) will always be paid at premium.
11250
Un Skilled : (500 * 2 = 1000) & (10 * 500 = 5000) = (1000+5000 = 6000) 6000
Minimum Tender Price 74450
Notes:
1. Fixed Overhead : ZERO. IRRELEVANT for decision making.
2. Costs of preparing the tender : ZERO. IRRELEVANT for decision making.
3. Profit : ZERO. IRRELEVANT for decision making.
Question # 03
Mr. Winston Churchill runs a business of manufacturing airplanes. He has recently completed a special
custom built aeroplane for a customer who ahs become insolvent & is unable to take delivery.
Fortunately, the customer has paid a non-returnable deposit of Rs: 5000 on ordering the aeroplane & this
money together with the cash proceed of Rs: 4000 now available for scrapping the aircraft will cover Mr.
Winston Churchill costs.

Cost Accounting Manual 2013
59 © For Suggestions & Feedbacks, contact: ATAUSH SHAFI ([email protected])
Mr. Winston Churchill has suddenly met a new customer, BOB, who is interested in buying the aircraft but
only after certain information. Bob wants to know how much the aeroplane will cost & has asked Mr.
Winston Churchill to prepare a tender for them.
Mr. Winston Churchill has investigated the modifications required & prepared a costing statement:
Material:
A : 5 kg @ Rs: 100 per kg 500
B : 10 kg @ Rs: 150 per kg 1500
C : 10 kg @ Rs: 75 per kg 750
D : 7 kg @ Rs: 10 per kg 700
Labor:
Skilled : 100 hrs @ Rs: 10 per hr 1000
Semi - Skilled : 75 hrs @ Rs: 7 per hr 525
Un Skilled : 80 hrs @ Rs: 5 per hr 400
Variable overhead : 255 hrs @ Rs: 3 per hr 765
Fixed overhead : 255 hrs @ Rs: 2 per hr 510
Costs of preparing the statement 100
Minimum tender price 6750
He is uncertain about the price at which to tender and has asked you to review his figures for a fee of Rs:
150. You establish the followings:
Material – A: there are 12 kg in stock originally purchased for Rs: 100 per kg. The price has recently risen
to Rs: 130 per kg. Mr. Winston Churchill normally sells material for Rs: 120 per kg. Mr. Winston Churchill
keeps stock of Material – A as it is essential component for all of his aeroplanes.
Material – B: the price of Rs: 150 per kg for material B also represent the historical cost of purchase of the
10 kg which are in stock. Mr. Winston Churchill normally sells material B to his customers as separate
accessory. He has recently buying stocks at Rs: 160 per kg & selling them on for Rs: 20 per kg.
Material – C: this is no use elsewhere in the business although Mr. Winston Churchill has 4 kg in stock &
could sell these for a total of Rs: 100. The price on the costing statement was the historical cost of
purchase, which has not changed for some time.
Material – D: there are 20 kg of this in stock & these are of no use elsewhere in the business. It will be
necessary to dispose of any remaining Material – D at a lump sum cost of Rs: 200.
Labor: skilled labor is paid on hourly basis at a rate shown in the statement above with a guaranteed
minimum wage rate of Rs: 300 per week. Mr. Winston Churchill has 15 skilled workers, all of whom are
working only 25 hours per week at present. Semi skilled labor is currently fully employed but could be
diverted from a product which earns a contribution (after semi skilled labor) of Rs: 6 per semi skilled labor
hour. Alternatively semi skilled labor could be hired at a cost of Rs: 20 per hour. Unskilled labor is hired on
a causal basis. The contract will need to be completed in one week.
Overhead: the variable overhead recovery rate of Rs: 3 per labor hour worked were established by a
detailed investigation of the business costs. The fixed overhead absorption rate of Rs: 2 per hour is
designed to cover general overhead of the whole business of Rs: 210, the rent of workshop to carry out
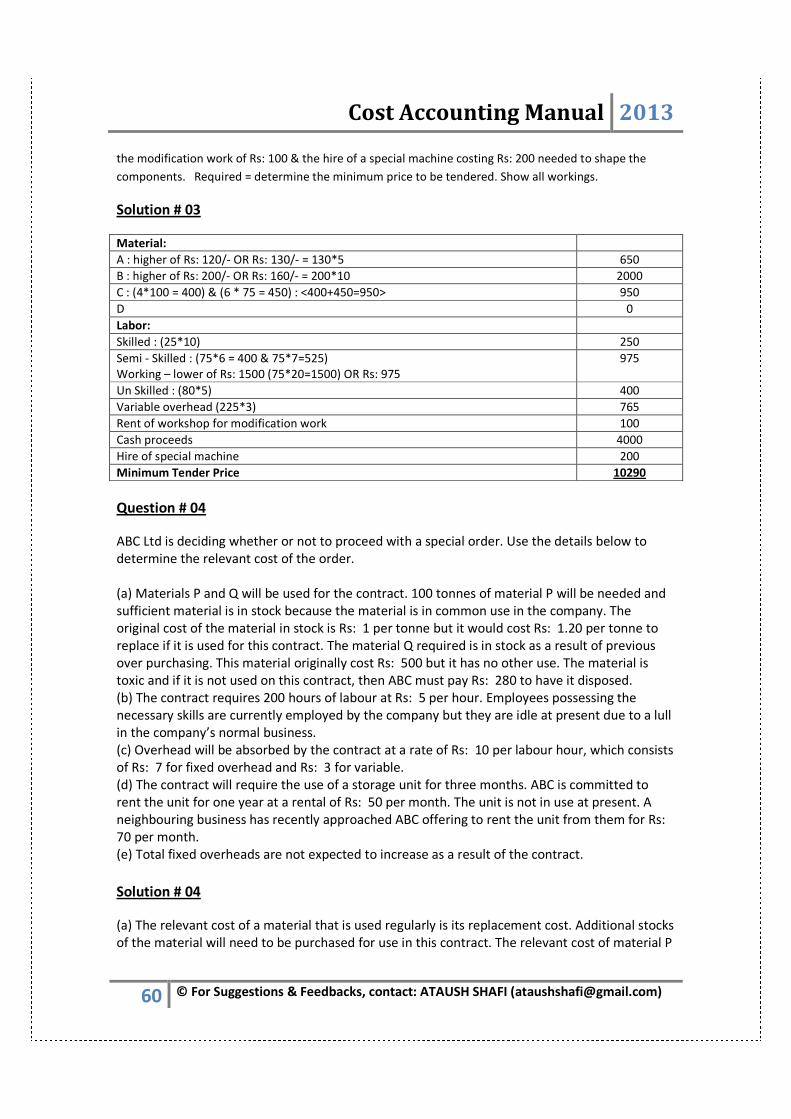
Cost Accounting Manual 2013
60 © For Suggestions & Feedbacks, contact: ATAUSH SHAFI ([email protected])
the modification work of Rs: 100 & the hire of a special machine costing Rs: 200 needed to shape the
components. Required = determine the minimum price to be tendered. Show all workings.
Solution # 03
Material:
A : higher of Rs: 120/- OR Rs: 130/- = 130*5 650
B : higher of Rs: 200/- OR Rs: 160/- = 200*10 2000
C : (4*100 = 400) & (6 * 75 = 450) : <400+450=950> 950
D 0
Labor:
Skilled : (25*10) 250
Semi - Skilled : (75*6 = 400 & 75*7=525)
Working – lower of Rs: 1500 (75*20=1500) OR Rs: 975
975
Un Skilled : (80*5) 400
Variable overhead (225*3) 765
Rent of workshop for modification work 100
Cash proceeds 4000
Hire of special machine 200
Minimum Tender Price 10290
Question # 04
ABC Ltd is deciding whether or not to proceed with a special order. Use the details below to
determine the relevant cost of the order.
(a) Materials P and Q will be used for the contract. 100 tonnes of material P will be needed and
sufficient material is in stock because the material is in common use in the company. The
original cost of the material in stock is Rs: 1 per tonne but it would cost Rs: 1.20 per tonne to
replace if it is used for this contract. The material Q required is in stock as a result of previous
over purchasing. This material originally cost Rs: 500 but it has no other use. The material is
toxic and if it is not used on this contract, then ABC must pay Rs: 280 to have it disposed.
(b) The contract requires 200 hours of labour at Rs: 5 per hour. Employees possessing the
necessary skills are currently employed by the company but they are idle at present due to a lull
in the company’s normal business.
(c) Overhead will be absorbed by the contract at a rate of Rs: 10 per labour hour, which consists
of Rs: 7 for fixed overhead and Rs: 3 for variable.
(d) The contract will require the use of a storage unit for three months. ABC is committed to
rent the unit for one year at a rental of Rs: 50 per month. The unit is not in use at present. A
neighbouring business has recently approached ABC offering to rent the unit from them for Rs:
70 per month.
(e) Total fixed overheads are not expected to increase as a result of the contract.
Solution # 04
(a) The relevant cost of a material that is used regularly is its replacement cost. Additional stocks
of the material will need to be purchased for use in this contract. The relevant cost of material P
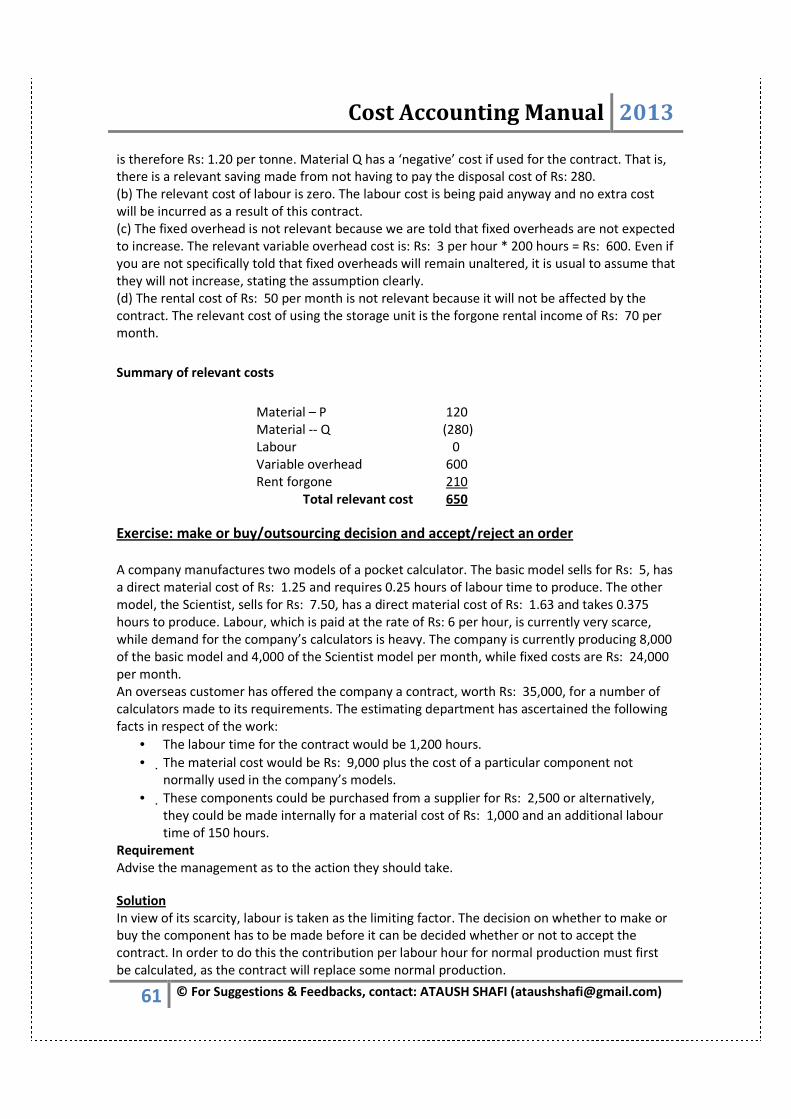
Cost Accounting Manual 2013
61 © For Suggestions & Feedbacks, contact: ATAUSH SHAFI ([email protected])
is therefore Rs: 1.20 per tonne. Material Q has a ‘negative’ cost if used for the contract. That is,
there is a relevant saving made from not having to pay the disposal cost of Rs: 280.
(b) The relevant cost of labour is zero. The labour cost is being paid anyway and no extra cost
will be incurred as a result of this contract.
(c) The fixed overhead is not relevant because we are told that fixed overheads are not expected
to increase. The relevant variable overhead cost is: Rs: 3 per hour * 200 hours = Rs: 600. Even if
you are not specifically told that fixed overheads will remain unaltered, it is usual to assume that
they will not increase, stating the assumption clearly.
(d) The rental cost of Rs: 50 per month is not relevant because it will not be affected by the
contract. The relevant cost of using the storage unit is the forgone rental income of Rs: 70 per
month.
Summary of relevant costs
Material – P 120
Material -- Q (280)
Labour 0
Variable overhead 600
Rent forgone 210
Total relevant cost 650
Exercise: make or buy/outsourcing decision and accept/reject an order
A company manufactures two models of a pocket calculator. The basic model sells for Rs: 5, has
a direct material cost of Rs: 1.25 and requires 0.25 hours of labour time to produce. The other
model, the Scientist, sells for Rs: 7.50, has a direct material cost of Rs: 1.63 and takes 0.375
hours to produce. Labour, which is paid at the rate of Rs: 6 per hour, is currently very scarce,
while demand for the company’s calculators is heavy. The company is currently producing 8,000
of the basic model and 4,000 of the Scientist model per month, while fixed costs are Rs: 24,000
per month.
An overseas customer has offered the company a contract, worth Rs: 35,000, for a number of
calculators made to its requirements. The estimating department has ascertained the following
facts in respect of the work:
• The labour time for the contract would be 1,200 hours.
• The material cost would be Rs: 9,000 plus the cost of a particular component not
normally used in the company’s models.
• These components could be purchased from a supplier for Rs: 2,500 or alternatively,
they could be made internally for a material cost of Rs: 1,000 and an additional labour
time of 150 hours.
Requirement
Advise the management as to the action they should take.
Solution
In view of its scarcity, labour is taken as the limiting factor. The decision on whether to make or
buy the component has to be made before it can be decided whether or not to accept the
contract. In order to do this the contribution per labour hour for normal production must first
be calculated, as the contract will replace some normal production.

Cost Accounting Manual 2013
62 © For Suggestions & Feedbacks, contact: ATAUSH SHAFI ([email protected])
Normal products Basic Scientist
Model - 1 Model – 2
Rs: Rs:
Selling price 5.00 7.50
Materials 1.25 1.63
Labour 1.50 2.25 (2.75) (3.88)
Contribution 2.25 3.62
÷ ÷ ÷
Limiting Factor 0.25 0.375
Contribution per direct labour hour 9.00 9.65
Therefore, if the company is to make the component it would be better to reduce production of
the basic model, in order to accommodate the special order. The company should now compare
the costs of making or buying the component. An opportunity cost arises due to the lost
contribution on the basic model.
Special contract Manufacture of component
Rs:
Materials 1,000
Labour (Rs: 6 *150 hours) 900
Opportunity cost (150 hours * Rs: 9.00) 1,350
3,250
Since this is higher than the bought-in price of Rs: 2,500 the company would be advised to buy
the component from the supplier if they accept the contract. The contract can now be
evaluated:
Contract contribution
Rs:
Sales revenue 35,000
Materials 9,000
Component 2,500
Labour (Rs: 6 * 1,200) 7,200 (18,700)
Contribution 16,300
Contribution per direct labour hour 13.58
Since the contribution is higher than either of the existing products, the company should accept
the contract assuming this would not prejudice the market for existing products. As the
customer is overseas this seems a reasonable assumption.
Because the contribution is higher for the Scientist model it would be wise to reduce production
of the basic model. However, the hours spent on producing the basic model per month are
8,000 units * 0.25 hours = 2,000, and so the contract would displace more than a fortnight’s
production of the basic model. The recommendation assumes that this can be done without
harming long-term sales of the basic model.

Cost Accounting Manual 2013
63 © For Suggestions & Feedbacks, contact: ATAUSH SHAFI ([email protected])
Exercise: discontinuing a product
Wye plc makes and sells four products. The profit and loss statement for April is as follows:
Product W X Y Z Total
Rs: Rs: Rs: Rs: Rs:
Sales 30,000 20,000 35,000 15,000 100,000
Cost of sales 16,000 8,000 22,000 10,000 56,000
Gross profit 14,000 12,000 13,000 5,000 44,000
Overhead cost:
Selling 8,000 7,000 8,500 6,500 30,000
Administration 2,000 2,000 2,000 2,000 8,000
Net profit 4,000 3,000 2,500 (3,500) 6,000
The management team is concerned about the results, particularly those of product Z, and it has
been suggested that Wye plc would be better off if it ceased production of product Z. The
production manager has said that if product Z was discontinued the resources which would
become available could be used to increase production of product Y by 40 per cent. You have
analyzed the cost structures of each of the products and discovered the following:
Product W X Y Z Total
Rs: Rs: Rs: Rs: Rs:
Variable costs 4,800 1,600 13,200 5,000 24,600
Fixed costs 11,200 6,400 8,800 5,000 31,400
Total 16,000 8,000 22,000 10,000 56,000
The total fixed costs figure includes Rs: 20,000 which is not specific to any one product, and
which has been apportioned to each product on the basis of sales values. If the quantity of any
product increases by more than 25 per cent, then the specific fixed production costs of the
product will increase by 30 per cent.
The selling overhead comprises a fixed cost of Rs: 5,000 per product plus a variable cost
which varies in proportion to sales value. The fixed cost is not specific to any product but the
sales director believes that it should be shared equally by the four products.
The administration cost is a central overhead cost; it is not affected by the products made.
Requirements
(a) Prepare a statement which shows clearly the results of continuing to produce products W, X,
Y and Z at the same volumes as were achieved in April. Present your statement in a format
suitable for management decision-making
(b) (i) Prepare a statement showing clearly the results if product Z is discontinued, and
the number of units of Y is increased in accordance with the production manager’s statement.
(Assume that no change in selling price per unit is necessary to sell the additional units.)
(ii) Reconcile the profit calculated in (a) and (b) (i) above; advice the management team as to
whether product Z should be discontinued.
(c) Explain briefly any non-financial factors which should be considered before discontinuing a
product.

Cost Accounting Manual 2013
64 © For Suggestions & Feedbacks, contact: ATAUSH SHAFI ([email protected])
Solution
(a) The profit statement needs to be restated in a marginal costing format if it is to be useful for
decision-making.
Product W X Y Z Total
Rs: Rs: Rs: Rs: Rs:
Sales 30,000 20,000 35,000 15,000 100,000
Variable Cost of sales 4,800 1,600 13,200 5,000
Variable selling overhead* 3,000 2,000 3,500 1,500
Contribution 22,200 16,400 18,300 8,500
Specific fixed costs (W1) 5,200 2,400 1,800 2,000
Net benefit 17,000 14,000 16,500 6,500 54,000
Non-specific fixed cost of sales (20,000)
Fixed selling overhead (W2) (20,000)
Administration costs (8,000)
Net profit 6,000
*Total overhead less Rs: 5,000 fixed cost
Workings
1.
Product W X Y Z Total
Rs: Rs: Rs: Rs: Rs:
Fixed costs 11,200 6,400 8,800 5,000 31,400
Non-specific fixed cost* 6,000 4,000 7,000 3,000 20,000
Specific fixed costs 5,200 2,400 1,800 2,000 11,400
*Given as Rs: 20,000 apportioned on the basis of sales values (3:2:3.5:1.5)
2. Rs: 5,000 per product *4 = Rs: 20,000
(b) (i) Z discontinued
Rs:
Contribution from 40% additional sales of Y (Rs: 18,300 * 0.4) 7,320
Additional specific fixed costs (Rs: 1,800 * 0.3) (540)
Loss of net benefit from Z (6,500)
Net gain 280
(ii) Profit reconciliation
Rs:
Existing profit 6,000
Discontinuation of Z (6,500)
Additional contribution from Y 7,320
Additional specific fixed costs (540)
Profit if Z is discontinued and sales of Y substituted 6,280
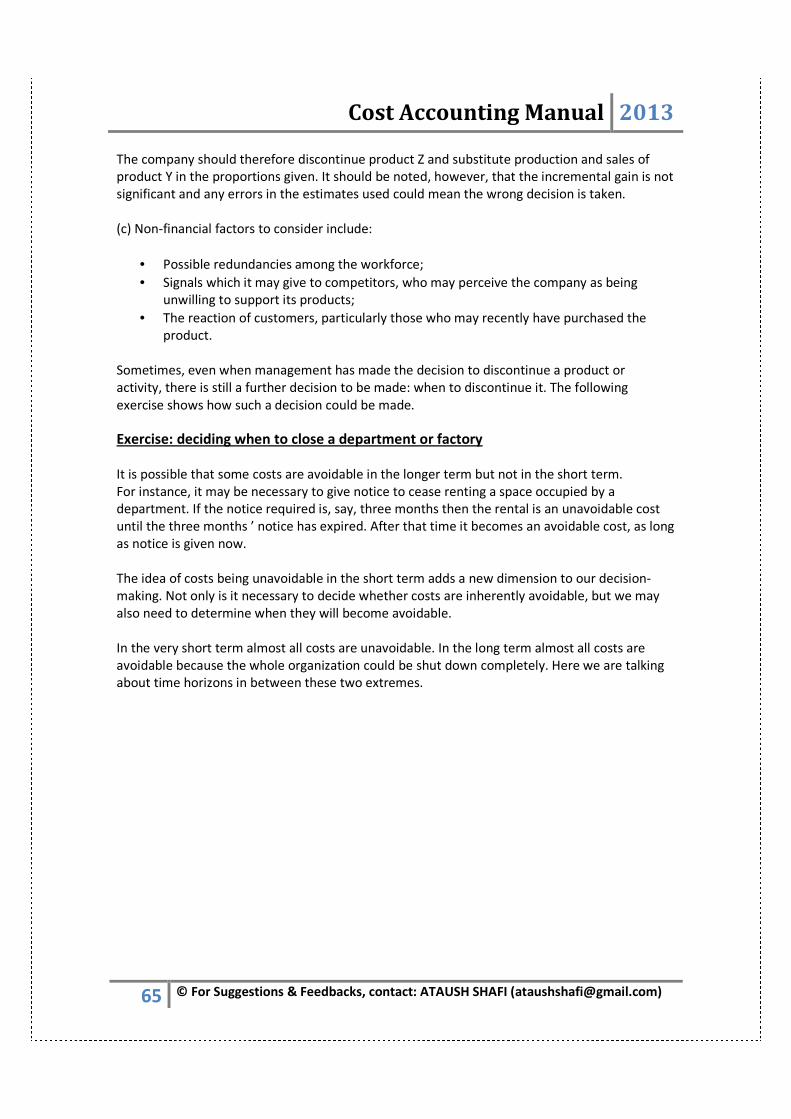
Cost Accounting Manual 2013
65 © For Suggestions & Feedbacks, contact: ATAUSH SHAFI ([email protected])
The company should therefore discontinue product Z and substitute production and sales of
product Y in the proportions given. It should be noted, however, that the incremental gain is not
significant and any errors in the estimates used could mean the wrong decision is taken.
(c) Non-financial factors to consider include:
• Possible redundancies among the workforce;
• Signals which it may give to competitors, who may perceive the company as being
unwilling to support its products;
• The reaction of customers, particularly those who may recently have purchased the
product.
Sometimes, even when management has made the decision to discontinue a product or
activity, there is still a further decision to be made: when to discontinue it. The following
exercise shows how such a decision could be made.
Exercise: deciding when to close a department or factory
It is possible that some costs are avoidable in the longer term but not in the short term.
For instance, it may be necessary to give notice to cease renting a space occupied by a
department. If the notice required is, say, three months then the rental is an unavoidable cost
until the three months ’ notice has expired. After that time it becomes an avoidable cost, as long
as notice is given now.
The idea of costs being unavoidable in the short term adds a new dimension to our decision-
making. Not only is it necessary to decide whether costs are inherently avoidable, but we may
also need to determine when they will become avoidable.
In the very short term almost all costs are unavoidable. In the long term almost all costs are
avoidable because the whole organization could be shut down completely. Here we are talking
about time horizons in between these two extremes.

Cost Accounting Manual 2013
66 © For Suggestions & Feedbacks, contact: ATAUSH SHAFI ([email protected])
BUDGETINGBUDGETINGBUDGETINGBUDGETING
Budgetary control Use of budget to control organization activities.
Need for budgeting
• To set standards.
• To motivate managers.
• Performance evaluation
• To co-ordinate between different managers.
• To co-ordinate between different departments.
Master budget Summary of company plan that sets specific target for sale,
production, distribution & financing activities.
Responsibility accounting Manager should be held responsible for those items that manager
usually control to significant event or for any deviation.
Rolling/continual/perpetu
al budgeting
Twelve months budget that rolls forward one month as current
month is completed. It shows current prices.
Human factor in
Budgeting
Budget program will be succeeded if budget have complete
acceptance & support of person who occupy key management
positions. Top management should not use budget to
blame/pressurize employees. Use of budget in such a negative way
will breed hostility, tension, mistrust rather than cooperation &
productivity.
Incremental approach
budgeting
In this approach, previous year budget is a baseline. Past data is
used to forecast future. Its biggest disadvantage is that anomalies
have been transferred to future.
Zero base budgeting Justify all budgeted expenditures before its inclusion in the budget.
Its baseline is zero rather than last year budget. It requires
considerable documentation. A more detailed approach & past
mistakes can not be carried forward.
Estimate Predetermination of future event either on simple guess or
scientific principles.
Forecast Assessment of probable future event.
Budget Padding Underestimating revenue & over estimating cost.
Budget Implication of a forecast & related to planned event.
Budgetary Slack The difference between the revenue or cost projection that a
person provides & a realistic estimate of the revenue or cost.
BUDGET VS FORECASTBUDGET VS FORECASTBUDGET VS FORECASTBUDGET VS FORECAST
BUDGET FORECAST
Relate to planned event. Concern with probable event.
Comprise whole business unit. Cover limited function.
Planned separately for each account period. Cover long period.
Tool of control. Not a tool for control.
Budget starts when forecast ends & convert it into
budget.
Forecast end with forecast of likely event.
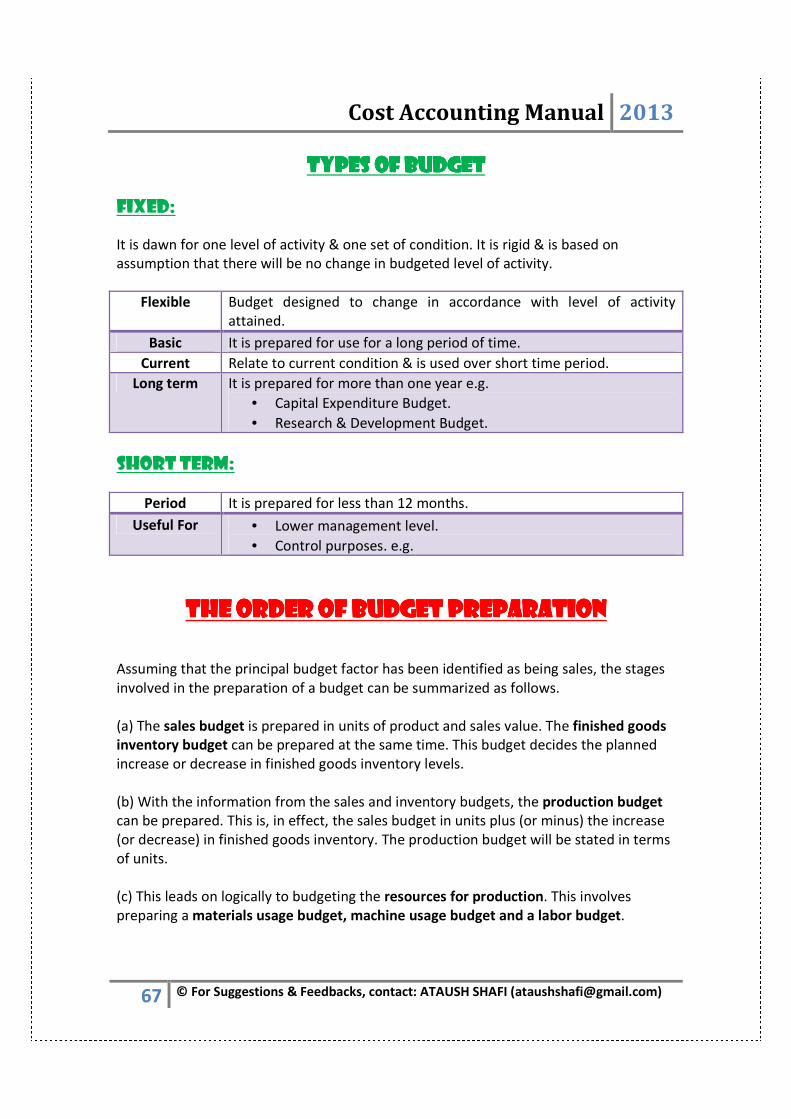
Cost Accounting Manual 2013
67 © For Suggestions & Feedbacks, contact: ATAUSH SHAFI ([email protected])
TYPES OF BUDGETTYPES OF BUDGETTYPES OF BUDGETTYPES OF BUDGET
FIXED:
It is dawn for one level of activity & one set of condition. It is rigid & is based on
assumption that there will be no change in budgeted level of activity.
Flexible Budget designed to change in accordance with level of activity
attained.
Basic It is prepared for use for a long period of time.
Current Relate to current condition & is used over short time period.
Long term It is prepared for more than one year e.g.
• Capital Expenditure Budget.
• Research & Development Budget.
SHORT TERM:
Period It is prepared for less than 12 months.
Useful For • Lower management level.
• Control purposes. e.g.
THE ORDER OF BUDGET PREPARATIONTHE ORDER OF BUDGET PREPARATIONTHE ORDER OF BUDGET PREPARATIONTHE ORDER OF BUDGET PREPARATION
Assuming that the principal budget factor has been identified as being sales, the stages
involved in the preparation of a budget can be summarized as follows.
(a) The sales budget is prepared in units of product and sales value. The finished goods
inventory budget can be prepared at the same time. This budget decides the planned
increase or decrease in finished goods inventory levels.
(b) With the information from the sales and inventory budgets, the production budget
can be prepared. This is, in effect, the sales budget in units plus (or minus) the increase
(or decrease) in finished goods inventory. The production budget will be stated in terms
of units.
(c) This leads on logically to budgeting the resources for production. This involves
preparing a materials usage budget, machine usage budget and a labor budget.
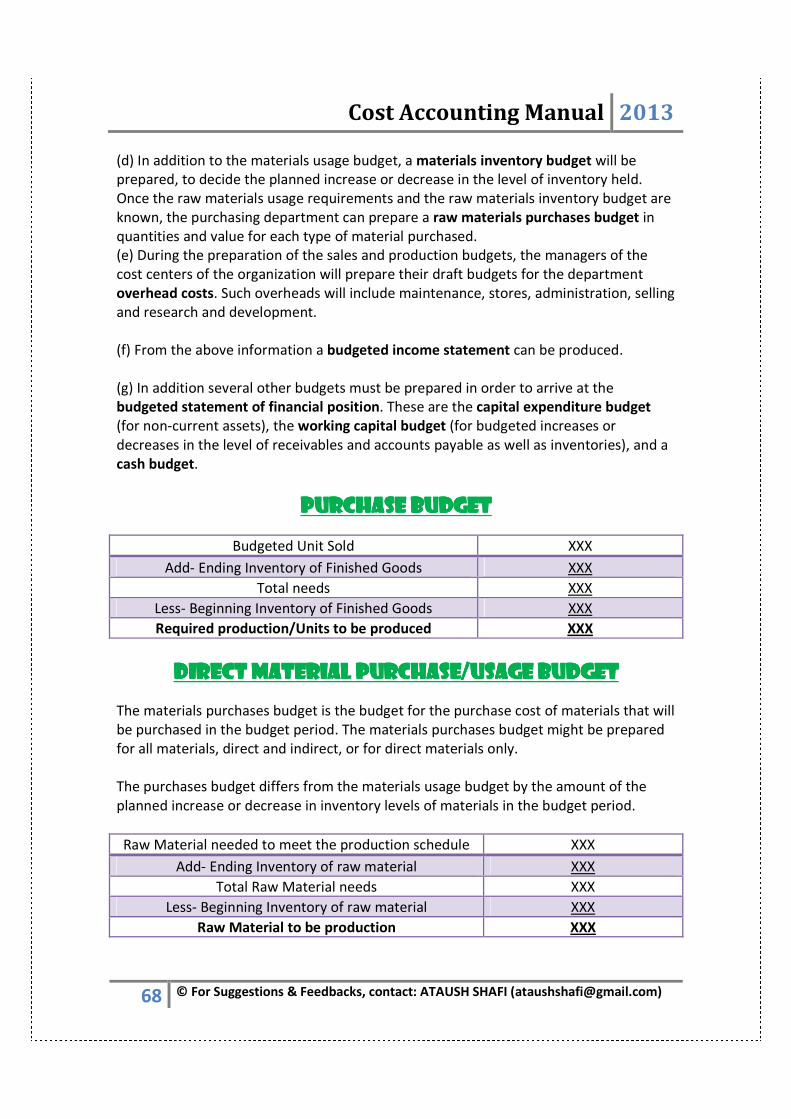
Cost Accounting Manual 2013
68 © For Suggestions & Feedbacks, contact: ATAUSH SHAFI ([email protected])
(d) In addition to the materials usage budget, a materials inventory budget will be
prepared, to decide the planned increase or decrease in the level of inventory held.
Once the raw materials usage requirements and the raw materials inventory budget are
known, the purchasing department can prepare a raw materials purchases budget in
quantities and value for each type of material purchased.
(e) During the preparation of the sales and production budgets, the managers of the
cost centers of the organization will prepare their draft budgets for the department
overhead costs. Such overheads will include maintenance, stores, administration, selling
and research and development.
(f) From the above information a budgeted income statement can be produced.
(g) In addition several other budgets must be prepared in order to arrive at the
budgeted statement of financial position. These are the capital expenditure budget
(for non-current assets), the working capital budget (for budgeted increases or
decreases in the level of receivables and accounts payable as well as inventories), and a
cash budget.
PURCHASE BUDGETPURCHASE BUDGETPURCHASE BUDGETPURCHASE BUDGET
Budgeted Unit Sold XXX
Add- Ending Inventory of Finished Goods XXX
Total needs XXX
Less- Beginning Inventory of Finished Goods XXX
Required production/Units to be produced XXX
DIRECT MATERIALDIRECT MATERIALDIRECT MATERIALDIRECT MATERIAL PURCHASEPURCHASEPURCHASEPURCHASE/USAGE/USAGE/USAGE/USAGE BUDGETBUDGETBUDGETBUDGET
The materials purchases budget is the budget for the purchase cost of materials that will
be purchased in the budget period. The materials purchases budget might be prepared
for all materials, direct and indirect, or for direct materials only.
The purchases budget differs from the materials usage budget by the amount of the
planned increase or decrease in inventory levels of materials in the budget period.
Raw Material needed to meet the production schedule XXX
Add- Ending Inventory of raw material XXX
Total Raw Material needs XXX
Less- Beginning Inventory of raw material XXX
Raw Material to be production XXX
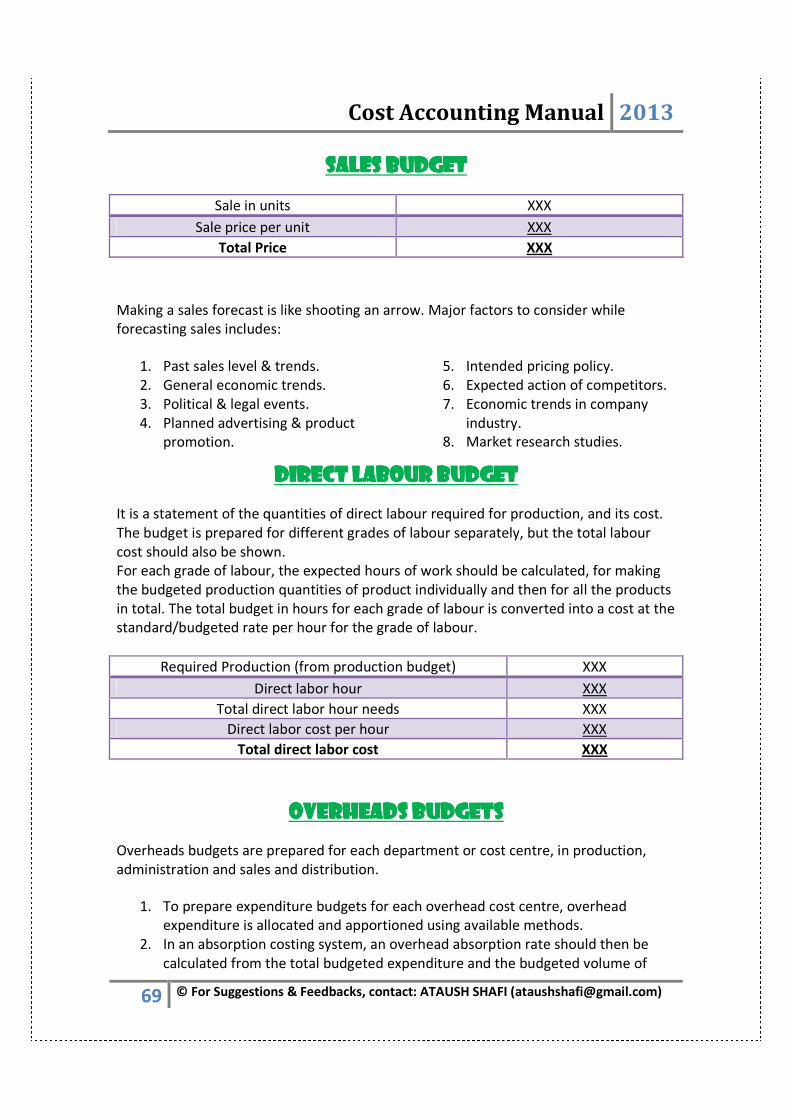
Cost Accounting Manual 2013
69 © For Suggestions & Feedbacks, contact: ATAUSH SHAFI ([email protected])
SALES BUDGETSALES BUDGETSALES BUDGETSALES BUDGET
Sale in units XXX
Sale price per unit XXX
Total Price XXX
Making a sales forecast is like shooting an arrow. Major factors to consider while
forecasting sales includes:
1. Past sales level & trends.
2. General economic trends.
3. Political & legal events.
4. Planned advertising & product
promotion.
5. Intended pricing policy.
6. Expected action of competitors.
7. Economic trends in company
industry.
8. Market research studies.
DIRECT LABOUR BUDGETDIRECT LABOUR BUDGETDIRECT LABOUR BUDGETDIRECT LABOUR BUDGET
It is a statement of the quantities of direct labour required for production, and its cost.
The budget is prepared for different grades of labour separately, but the total labour
cost should also be shown.
For each grade of labour, the expected hours of work should be calculated, for making
the budgeted production quantities of product individually and then for all the products
in total. The total budget in hours for each grade of labour is converted into a cost at the
standard/budgeted rate per hour for the grade of labour.
Required Production (from production budget) XXX
Direct labor hour XXX
Total direct labor hour needs XXX
Direct labor cost per hour XXX
Total direct labor cost XXX
OVERHEADS BUDGETSOVERHEADS BUDGETSOVERHEADS BUDGETSOVERHEADS BUDGETS
Overheads budgets are prepared for each department or cost centre, in production,
administration and sales and distribution.
1. To prepare expenditure budgets for each overhead cost centre, overhead
expenditure is allocated and apportioned using available methods.
2. In an absorption costing system, an overhead absorption rate should then be
calculated from the total budgeted expenditure and the budgeted volume of

Cost Accounting Manual 2013
70 © For Suggestions & Feedbacks, contact: ATAUSH SHAFI ([email protected])
activity. When flexed budgets are prepared, overhead costs might be divided
into variable and fixed costs.
Direct Material XXX
Direct labor XXX
Variable Overhead XXX
Fixed Overhead XXX
Total Overhead cost XXX
BUDGETARY CONTROLBUDGETARY CONTROLBUDGETARY CONTROLBUDGETARY CONTROL
One of the main purposes of budgeting is budgetary control and the control of costs.
Costs can be controlled by comparing budgets with the results actually achieved.
Differences between expected results and actual results are known as variances.
Variances can be either favorable (F) or adverse (A) depending on whether the results
achieved are better or worse than expected. Favourable variances increase profits and
adverse variances decrease profits.
There are three different types of budget.
1. Fixed budgets
2. Flexed budgets
3. Flexible budgets.
Fixed budgets
1. The original budget prepared at the beginning of a budget period is known as the
fixed budget.
2. A fixed budget is a budget for a specific volume of output and sales activity, and
it is the ‘master plan’ for the financial year that the company tries to achieve.
3. The term ‘fixed’ in ‘fixed budget’ means that the output and sales volumes are
for a fixed amount or quantity.
4. A fixed budget might be suitable as a plan, provided that the business
environment is fairly stable and sales and production volumes should be
predictable with reasonable accuracy.
5. Fixed budgets are not suitable for budgetary control reporting because the
variances calculated with a fixed budget can provide misleading information

Cost Accounting Manual 2013
71 © For Suggestions & Feedbacks, contact: ATAUSH SHAFI ([email protected])
Flexed budgets
1. A flexed budget is a budget prepared to show the revenue, costs and profits that
should have been expected from the actual volumes of production and sale.
2. A flexed budget is prepared for the actual volume of sales and output, and it
allows for the fact that sales revenues and variable costs should be expected to
increase or fall with increases or falls in sales and output.
3. A flexed budget is prepared at the end of the budget period when the actual
results are known. It is used to compare:
1. the actual results with the flexed budget
2. the fixed budget with the flexed budget.
4. If a flexed budget is compared with the actual results for a period, the
differences between the two (variances) are much more meaningful than if the
fixed budget and actual results are compared.
Flexible budgets
Flexible budgets are not the same as flexed budgets, although they are similar.
Flexed budgets are prepared at the end of a budget period and look back at what costs,
revenues and profits should have been in a period (based on actual activity levels). They
are used to calculate variances for the purpose of management control and control
reporting (budgetary control).
Flexible budgets are forward-looking and are prepared at the beginning of a budget
period when the fixed (original) budget is prepared. Flexible budgets are prepared to
show the results that would be expected at different levels of activity, for example, at
75%, 80% and 85% of the full capacity. They might be prepared when there is
uncertainty about what the actual volumes of sales and production will be, and several
budgets are therefore prepared for a number of different possible outcomes.
CASH BUDGETCASH BUDGETCASH BUDGETCASH BUDGET
Opening Cash balance XXX YYY ZZZ
Add- Receipts from debtors XXX YYY ZZZ
Add- Sales of Capital items XXX YYY ZZZ
Add- Any loan received XXX YYY ZZZ
Add- Proceed for share issues XXX YYY ZZZ
Add- Any other cash receipts XXX YYY ZZZ
= Total Cash Available XXX YYY ZZZ
Less- Payments to creditors XXX YYY ZZZ
Less- Cash purchases XXX YYY ZZZ
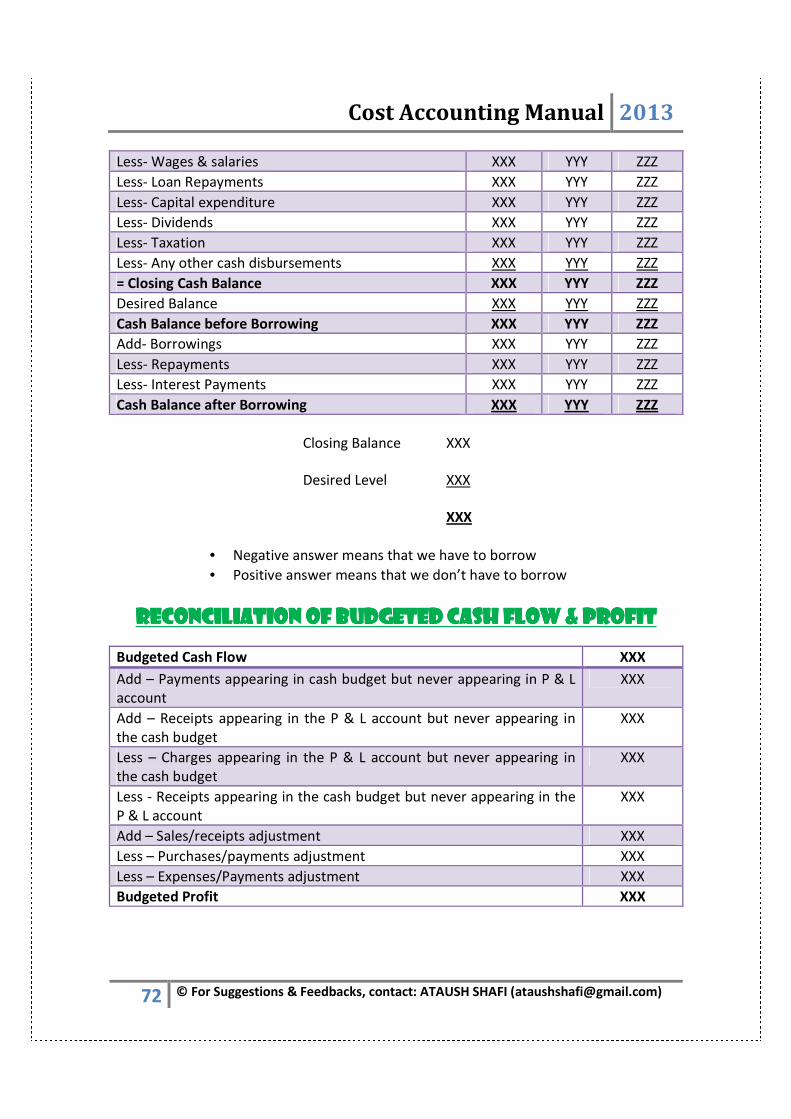
Cost Accounting Manual 2013
72 © For Suggestions & Feedbacks, contact: ATAUSH SHAFI ([email protected])
Less- Wages & salaries XXX YYY ZZZ
Less- Loan Repayments XXX YYY ZZZ
Less- Capital expenditure XXX YYY ZZZ
Less- Dividends XXX YYY ZZZ
Less- Taxation XXX YYY ZZZ
Less- Any other cash disbursements XXX YYY ZZZ
= Closing Cash Balance XXX YYY ZZZ
Desired Balance XXX YYY ZZZ
Cash Balance before Borrowing XXX YYY ZZZ
Add- Borrowings XXX YYY ZZZ
Less- Repayments XXX YYY ZZZ
Less- Interest Payments XXX YYY ZZZ
Cash Balance after Borrowing XXX YYY ZZZ
Closing Balance XXX
Desired Level XXX
XXX
• Negative answer means that we have to borrow
• Positive answer means that we don’t have to borrow
RECONCILIATION OF BUDGETED CASH FLOW & PROFITRECONCILIATION OF BUDGETED CASH FLOW & PROFITRECONCILIATION OF BUDGETED CASH FLOW & PROFITRECONCILIATION OF BUDGETED CASH FLOW & PROFIT
Budgeted Cash Flow XXX
Add – Payments appearing in cash budget but never appearing in P & L
account
XXX
Add – Receipts appearing in the P & L account but never appearing in
the cash budget
XXX
Less – Charges appearing in the P & L account but never appearing in
the cash budget
XXX
Less - Receipts appearing in the cash budget but never appearing in the
P & L account
XXX
Add – Sales/receipts adjustment XXX
Less – Purchases/payments adjustment XXX
Less – Expenses/Payments adjustment XXX
Budgeted Profit XXX

Cost Accounting Manual 2013
73 © For Suggestions & Feedbacks, contact: ATAUSH SHAFI ([email protected])
BUDGETARY CONTROL ANALYSISBUDGETARY CONTROL ANALYSISBUDGETARY CONTROL ANALYSISBUDGETARY CONTROL ANALYSIS
Fixed
Budget
Flexible
Budget
Actual
budget
Budget
Variances
Production & Sales (Units) XXX XXX XXX XXX
Sales XXX XXX XXX XXX
Variable Costs XXX XXX XXX XXX
DM XXX XXX XXX XXX
DL XXX XXX XXX XXX
V/FOH XXX XXX XXX XXX
Semi – Variable Costs XXX XXX XXX XXX
Fixed Costs XXX XXX XXX XXX
Total costs XXX XXX XXX XXX
Profit XXX XXX XXX XXX
NOTE:
1. Variances are calculated by comparing actual results & the flexible budgets, not
actual budgets & the original budgets.
2. The correct approach is as follows:
• Identify fixed & variable costs
• Produce a flexible budget using marginal costing techniques.
Flexible Budgeting: Important points include:
1. No concern with actual results.
2. Classification of cost by behaviors is the most important element in
flexible budgeting.
3. If cost is variable, identify that it is variable with reference to: no of units/
no of hours.
4. If cost is semi variable, then normally high & low method is used to
apportion fixed & variable portion.
5. Please remember that DO NOT flex fixed cost.
STEPS IN THE PREPARATION OF CAPITAL EXPENDITURE STEPS IN THE PREPARATION OF CAPITAL EXPENDITURE STEPS IN THE PREPARATION OF CAPITAL EXPENDITURE STEPS IN THE PREPARATION OF CAPITAL EXPENDITURE BUDGETSBUDGETSBUDGETSBUDGETS
Step - 1: An accountant or budget officer should be responsible for the
capital expenditure budget. Their tasks should include communicating between
interested parties, providing necessary data to assist in budget preparation, drawing up
a timetable to ensure that proper consultation takes place and so on.

Cost Accounting Manual 2013
74 © For Suggestions & Feedbacks, contact: ATAUSH SHAFI ([email protected])
Step - 2: Sales, production and related budgets cover, in general, a 12-
month period. A detailed capital expenditure budget should be prepared for the
budget period but additional budgets should be drawn up for both the medium and
long term. This requires an in-depth consideration of the organisation's requirements
for land, buildings, plant, machinery, vehicles, fixtures and fittings and so on for the
short, medium and long term.
Step - 3: The budget covering the 12 month period should be broken down into
monthly or quarterly spending, and details incorporated into the cash
budget.
Step - 4 Suitable financing must be arranged as necessary.
Step - 5 The capital expenditure budget should take account of the principal
budget factor. If available funds are limiting the organisation's activities
then they will more than likely limit capital expenditure.
Step - 6 As part of the overall budget coordination process, the capital
expenditure budget must be reviewed in relation to the other budgets. Proposed
expansion of production may well require significant non-current asset expenditure
which should be reflected in the budget.
Step - 7 The capital expenditure budget should be updated on a regular basis
since both the timing and amount of expenditure can change at short
notice.
PREPARATION OF FLEXIBLE PREPARATION OF FLEXIBLE PREPARATION OF FLEXIBLE PREPARATION OF FLEXIBLE BUDGETSBUDGETSBUDGETSBUDGETS
Step - 1 The first step in the preparation of a flexible budget is the determination
of cost behaviour patterns, which means deciding whether costs are
fixed, variable or semi-variable.
• Fixed costs are easy to spot. They remain constant as activity levels change.
• For non-fixed costs, divide each cost figure by the related activity level. If the
cost is a variable cost, the cost per unit will remain constant. If the cost is a semi-
variable cost, the unit rate will reduce as activity levels increase.
Step - 2 The second step in the preparation of a flexible budget is to calculate the
budget cost allowance for each cost item.
Budget cost allowance = budgeted fixed cost* + (number of units ×
variable cost per unit) **
* Nil for variable cost
** Nil for fixed cost

Cost Accounting Manual 2013
75 © For Suggestions & Feedbacks, contact: ATAUSH SHAFI ([email protected])
Semi-variable costs therefore need splitting into their fixed and variable components so
that the budget cost allowance can be calculated.

Cost Accounting Manual 2013
76 © For Suggestions & Feedbacks, contact: ATAUSH SHAFI ([email protected])
STANDARD COSTINGSTANDARD COSTINGSTANDARD COSTINGSTANDARD COSTING
1. The term standard refers to pre- determined, estimated unit costs & revenues.
2. Often called “ Budget for an individual unit of production”
3. Standard cost system applies to standard cost center.
4. Sale variance applies to revenue center.
5. Benchmark for measuring performance.
STANDARD COSTING: Pre-determined estimated unit cost used for stock
valuation & control. It may be used both in absorption costing & marginal costing.
7 � cost 156 1234 1234 1234 1234 : : : : /�ٹ /�ٹ /�ٹ /�ٹ )� �, 1289156 � 7)� �, 1289156 � 7)� �, 1289156 � 7)� �, 1289 Actual Production ٔ 79 �; ٔ 79 �; ٔ 79 �; ٔ 79 �;����ٗ ٗ ٗ ٗ .
COMPARISONS:
Standard will be compared to Actual
Standard will NOT be compared to Budgeted
Budgeted will be compared to Budgeted
Actual will NOT be compared to Actual
STANDARD HOUR: Hour which measure the amount of work that should be
performed in one hour under standard condition.
SUITABILITY: Common / repetitive operations. E.g. manufacturing & service.
LESSONS:
1. Clearly label variance as ADVERSE or FAVORABLE.
2. Flexed budgeted figures are to be used.
3. In marginal costing, fixed volume variances will not exist.
STANDARD VS BUDGETED COST
STANDARD COST BUDGETED COST
Unit Amount Total Amount
Part of double entry system Not part of double entry system
Controlling cost Planning cost
Estimate of actual capacity Estimate of normal capacity
Cost expectation of per unit of activity Cost expectation of total unit of activity
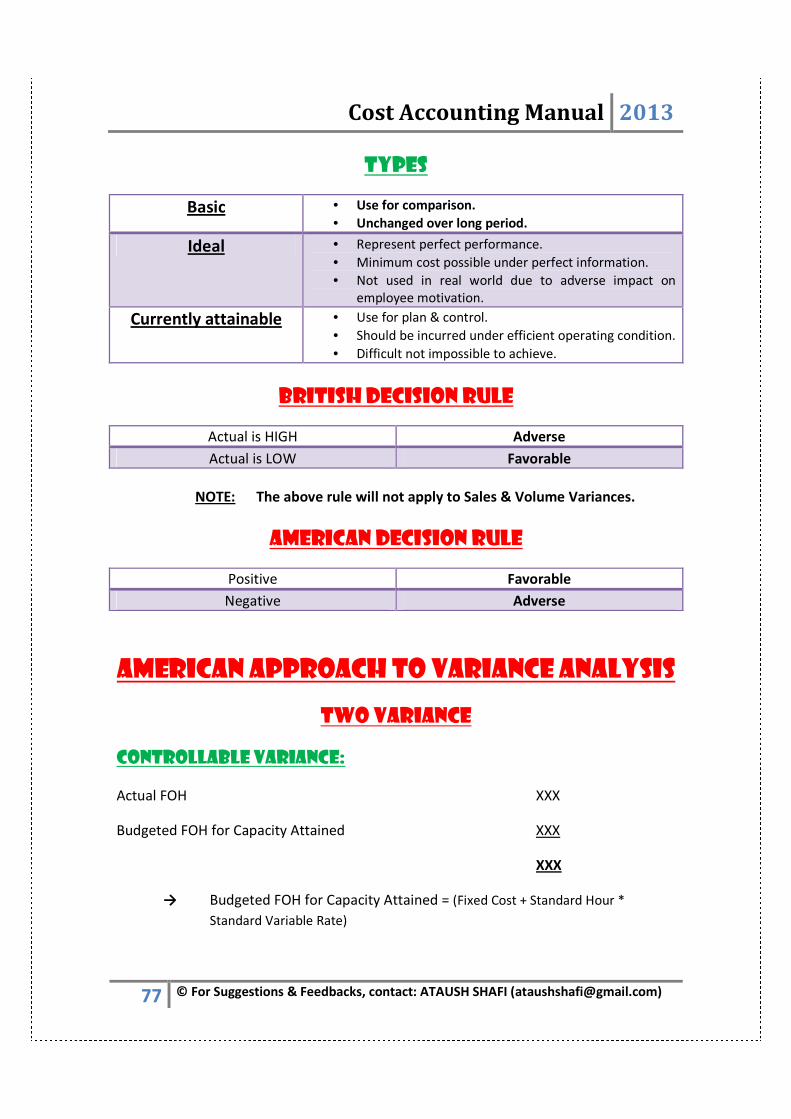
Cost Accounting Manual 2013
77 © For Suggestions & Feedbacks, contact: ATAUSH SHAFI ([email protected])
TYPES
Basic • Use for comparison.
• Unchanged over long period.
Ideal • Represent perfect performance.
• Minimum cost possible under perfect information.
• Not used in real world due to adverse impact on
employee motivation.
Currently attainable • Use for plan & control.
• Should be incurred under efficient operating condition.
• Difficult not impossible to achieve.
BRITISH DECISION RULE
Actual is HIGH Adverse
Actual is LOW Favorable
NOTE: The above rule will not apply to Sales & Volume Variances.
AMERICAN DECISION RULE
Positive Favorable
Negative Adverse
AMERICAN APPROACH TO VARIANCE ANALYSIS
TWO VARIANCE
CONTROLLABLE VARIANCE:
Actual FOH XXX
Budgeted FOH for Capacity Attained XXX
XXX
→ Budgeted FOH for Capacity Attained = (Fixed Cost + Standard Hour *
Standard Variable Rate)
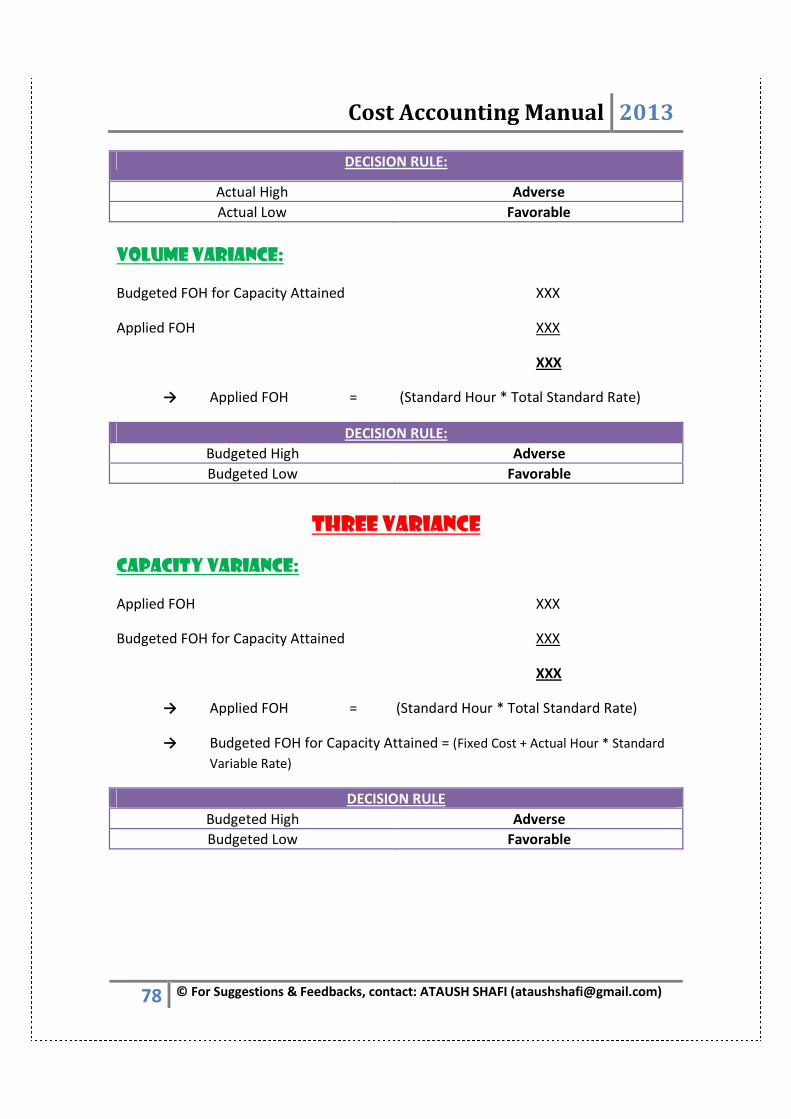
Cost Accounting Manual 2013
78 © For Suggestions & Feedbacks, contact: ATAUSH SHAFI ([email protected])
DECISION RULE:
Actual High Adverse
Actual Low Favorable
VOLUME VARIANCE:
Budgeted FOH for Capacity Attained XXX
Applied FOH XXX
XXX
→ Applied FOH = (Standard Hour * Total Standard Rate)
DECISION RULE:
Budgeted High Adverse
Budgeted Low Favorable
THREE VARIANCE
CAPACITY VARIANCE:
Applied FOH XXX
Budgeted FOH for Capacity Attained XXX
XXX
→ Applied FOH = (Standard Hour * Total Standard Rate)
→ Budgeted FOH for Capacity Attained = (Fixed Cost + Actual Hour * Standard
Variable Rate)
DECISION RULE
Budgeted High Adverse
Budgeted Low Favorable
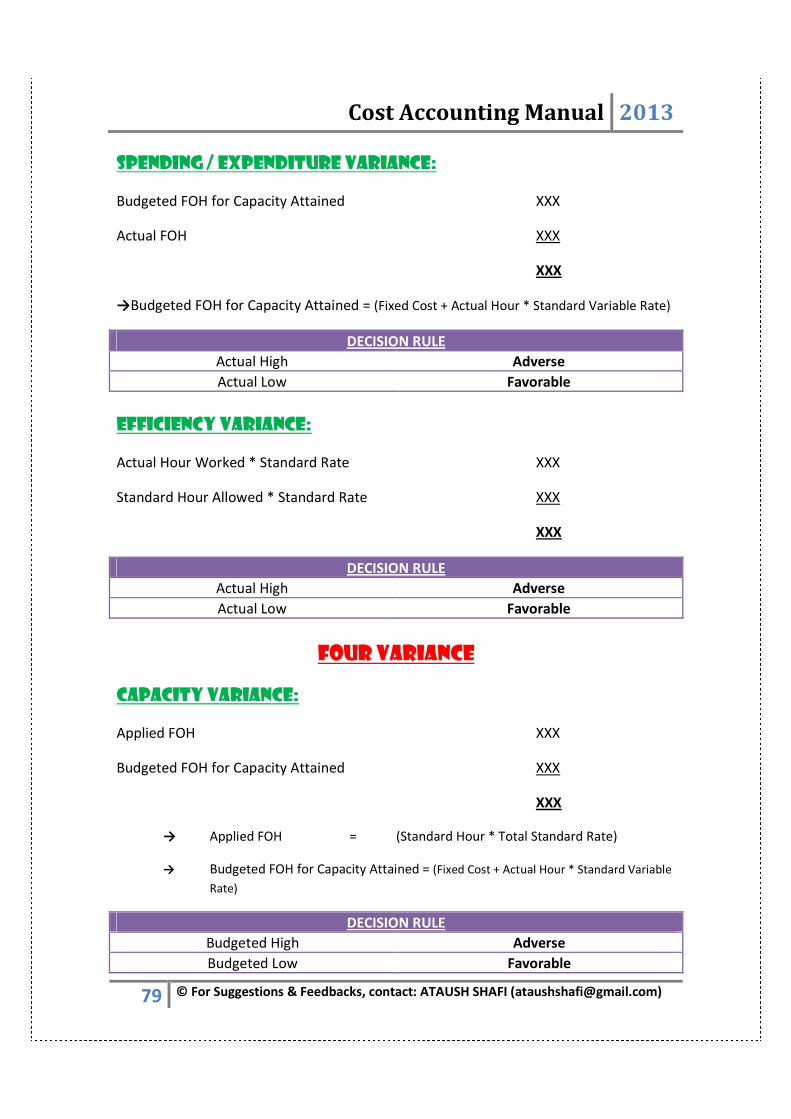
Cost Accounting Manual 2013
79 © For Suggestions & Feedbacks, contact: ATAUSH SHAFI ([email protected])
SPENDING / EXPENDITURE VARIANCE:
Budgeted FOH for Capacity Attained XXX
Actual FOH XXX
XXX
→Budgeted FOH for Capacity Attained = (Fixed Cost + Actual Hour * Standard Variable Rate)
DECISION RULE
Actual High Adverse
Actual Low Favorable
EFFICIENCY VARIANCE:
Actual Hour Worked * Standard Rate XXX
Standard Hour Allowed * Standard Rate XXX
XXX
DECISION RULE
Actual High Adverse
Actual Low Favorable
FOUR VARIANCE
CAPACITY VARIANCE:
Applied FOH XXX
Budgeted FOH for Capacity Attained XXX
XXX
→ Applied FOH = (Standard Hour * Total Standard Rate)
→ Budgeted FOH for Capacity Attained = (Fixed Cost + Actual Hour * Standard Variable
Rate)
DECISION RULE
Budgeted High Adverse
Budgeted Low Favorable
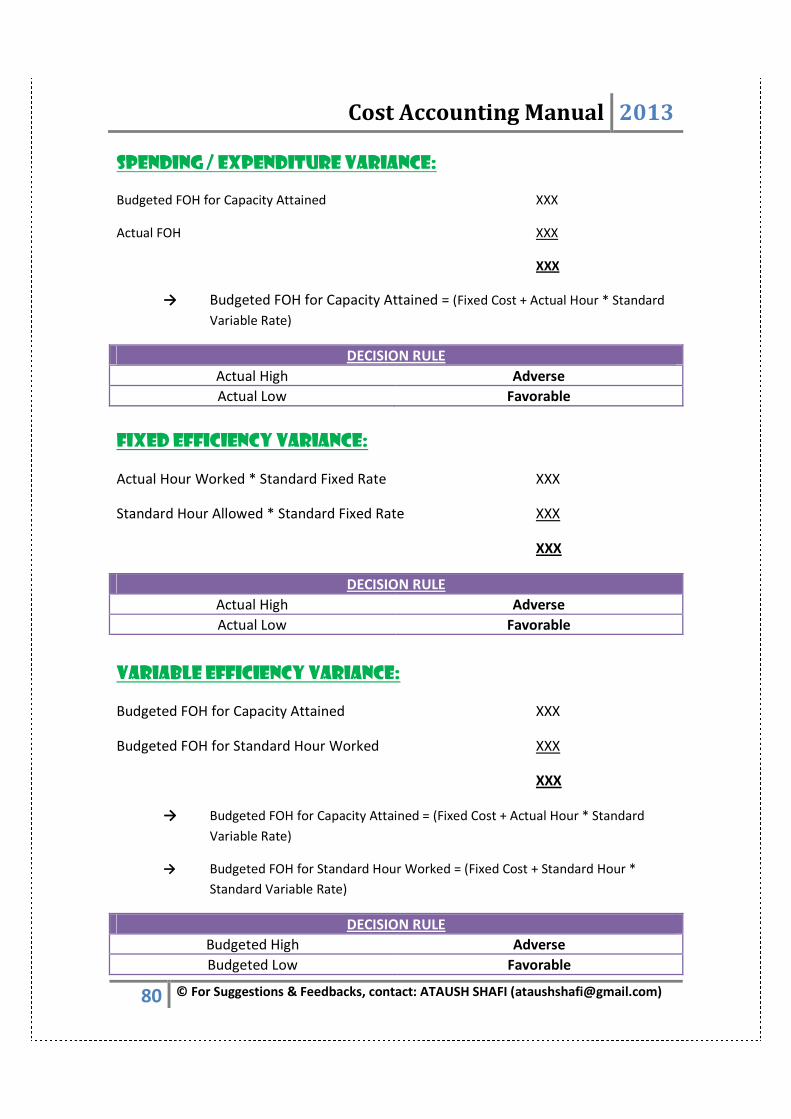
Cost Accounting Manual 2013
80 © For Suggestions & Feedbacks, contact: ATAUSH SHAFI ([email protected])
SPENDING / EXPENDITURE VARIANCE:
Budgeted FOH for Capacity Attained XXX
Actual FOH XXX
XXX
→ Budgeted FOH for Capacity Attained = (Fixed Cost + Actual Hour * Standard
Variable Rate)
DECISION RULE
Actual High Adverse
Actual Low Favorable
FIXED EFFICIENCY VARIANCE:
Actual Hour Worked * Standard Fixed Rate XXX
Standard Hour Allowed * Standard Fixed Rate XXX
XXX
DECISION RULE
Actual High Adverse
Actual Low Favorable
VARIABLE EFFICIENCY VARIANCE:
Budgeted FOH for Capacity Attained XXX
Budgeted FOH for Standard Hour Worked XXX
XXX
→ Budgeted FOH for Capacity Attained = (Fixed Cost + Actual Hour * Standard
Variable Rate)
→ Budgeted FOH for Standard Hour Worked = (Fixed Cost + Standard Hour *
Standard Variable Rate)
DECISION RULE
Budgeted High Adverse
Budgeted Low Favorable
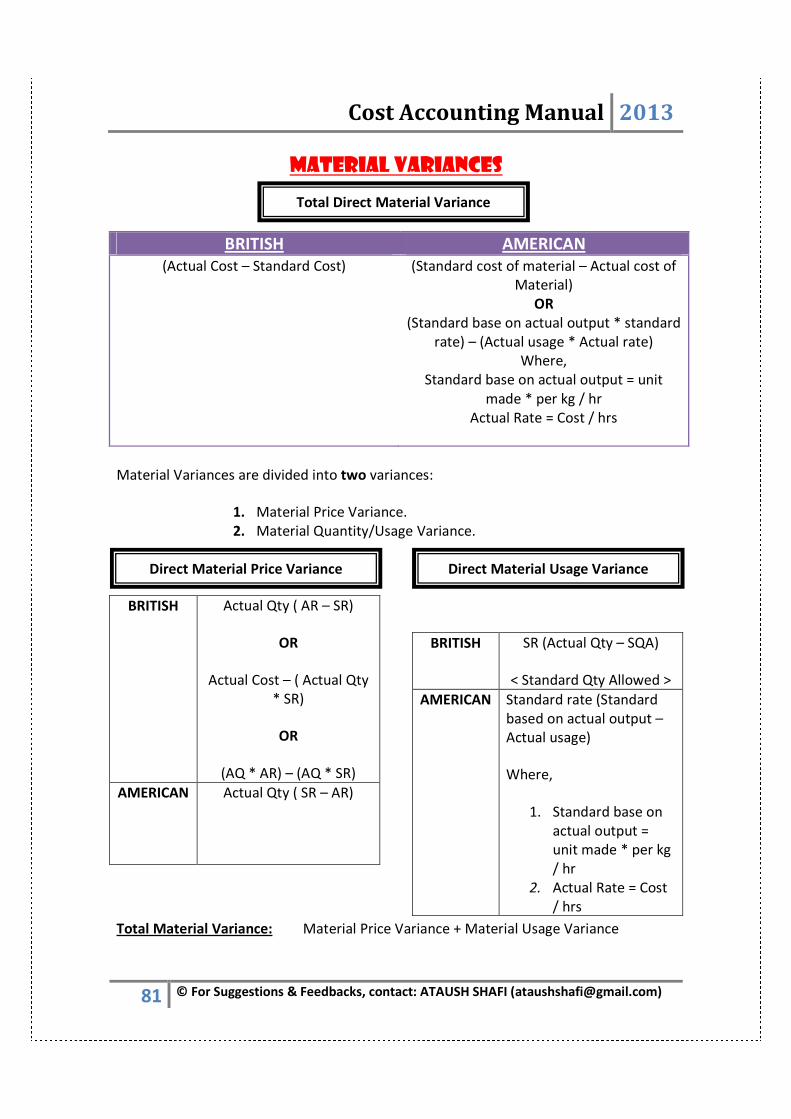
Cost Accounting Manual 2013
81 © For Suggestions & Feedbacks, contact: ATAUSH SHAFI ([email protected])
MATERIAL VARIANCES
BRITISH AMERICAN
(Actual Cost – Standard Cost) (Standard cost of material – Actual cost of
Material)
OR
(Standard base on actual output * standard
rate) – (Actual usage * Actual rate)
Where,
Standard base on actual output = unit
made * per kg / hr
Actual Rate = Cost / hrs
Material Variances are divided into two variances:
1. Material Price Variance.
2. Material Quantity/Usage Variance.
BRITISH Actual Qty ( AR – SR)
OR
Actual Cost – ( Actual Qty
* SR)
OR
(AQ * AR) – (AQ * SR)
AMERICAN Actual Qty ( SR – AR)
BRITISH SR (Actual Qty – SQA)
< Standard Qty Allowed >
AMERICAN Standard rate (Standard
based on actual output –
Actual usage)
Where,
1. Standard base on
actual output =
unit made * per kg
/ hr
2. Actual Rate = Cost
/ hrs
Total Material Variance: Material Price Variance + Material Usage Variance
Total Direct Material Variance
Direct Material Price Variance Direct Material Usage Variance

Cost Accounting Manual 2013
82 © For Suggestions & Feedbacks, contact: ATAUSH SHAFI ([email protected])
PRICE VARIANCE VARIATIONS
1 - PURCHASE QUANTITY
Raw Material
Purchase ( AQ * AR) Price Variance AQ (AR-SR)
Qty Variance SR (AQ -SQA)
WIP (SQA * SR)
Closing Stock ( Actual Qty – Qty Consumed) * SR
NOTE: Closing stock is recorded at SR.
BRITISH
(Actual Cost – Standard Cost)
SC = SQA * SR
AC = Consume cost (not purchase cost)
(O/BAL + PUR – C/BAL)
BRITISH SR (Actual Qty – SQA)
< Standard Qty Allowed >
BRITISH Actual Qty ( AR – SR)
OR
Actual Cost – ( Actual Qty
* SR)
Total Direct Material Variance
Direct Material Price Variance Direct Material Usage Variance
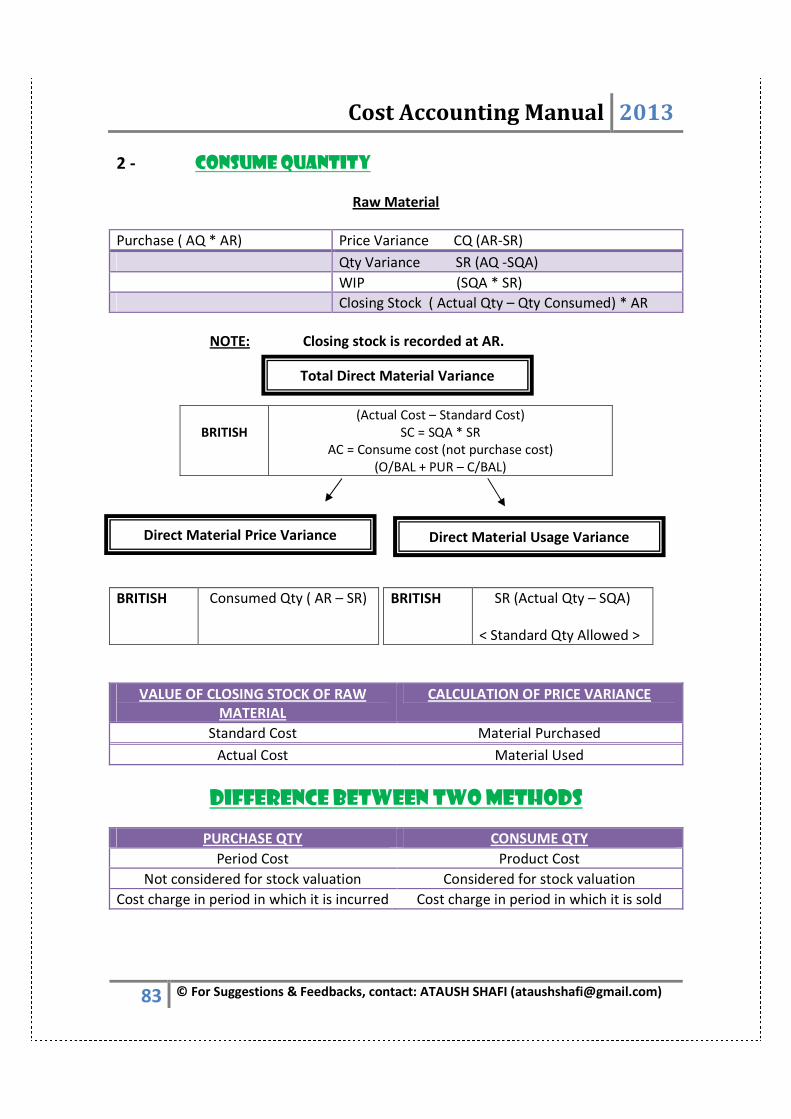
Cost Accounting Manual 2013
83 © For Suggestions & Feedbacks, contact: ATAUSH SHAFI ([email protected])
2 - CONSUME QUANTITY
Raw Material
Purchase ( AQ * AR) Price Variance CQ (AR-SR)
Qty Variance SR (AQ -SQA)
WIP (SQA * SR)
Closing Stock ( Actual Qty – Qty Consumed) * AR
NOTE: Closing stock is recorded at AR.
BRITISH
(Actual Cost – Standard Cost)
SC = SQA * SR
AC = Consume cost (not purchase cost)
(O/BAL + PUR – C/BAL)
BRITISH SR (Actual Qty – SQA)
< Standard Qty Allowed >
VALUE OF CLOSING STOCK OF RAW
MATERIAL
CALCULATION OF PRICE VARIANCE
Standard Cost Material Purchased
Actual Cost Material Used
DIFFERENCE BETWEEN TWO METHODS
PURCHASE QTY CONSUME QTY
Period Cost Product Cost
Not considered for stock valuation Considered for stock valuation
Cost charge in period in which it is incurred Cost charge in period in which it is sold
BRITISH Consumed Qty ( AR – SR)
Total Direct Material Variance
Direct Material Price Variance Direct Material Usage Variance
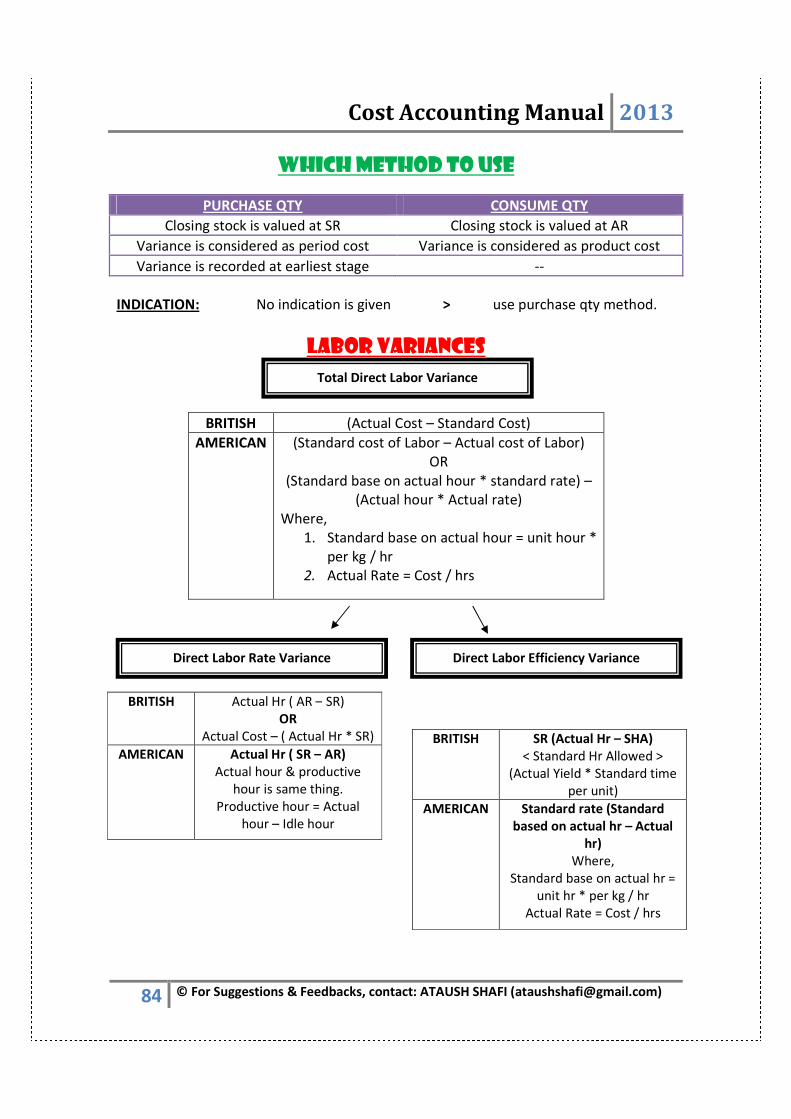
Cost Accounting Manual 2013
84 © For Suggestions & Feedbacks, contact: ATAUSH SHAFI ([email protected])
WHICH METHOD TO USE
PURCHASE QTY CONSUME QTY
Closing stock is valued at SR Closing stock is valued at AR
Variance is considered as period cost Variance is considered as product cost
Variance is recorded at earliest stage --
INDICATION: No indication is given > use purchase qty method.
LABOR VARIANCES
BRITISH (Actual Cost – Standard Cost)
AMERICAN (Standard cost of Labor – Actual cost of Labor)
OR
(Standard base on actual hour * standard rate) –
(Actual hour * Actual rate)
Where,
1. Standard base on actual hour = unit hour *
per kg / hr
2. Actual Rate = Cost / hrs
BRITISH Actual Hr ( AR – SR)
OR
Actual Cost – ( Actual Hr * SR)
AMERICAN Actual Hr ( SR – AR)
Actual hour & productive
hour is same thing.
Productive hour = Actual
hour – Idle hour
BRITISH SR (Actual Hr – SHA)
< Standard Hr Allowed >
(Actual Yield * Standard time
per unit)
AMERICAN Standard rate (Standard
based on actual hr – Actual
hr)
Where,
Standard base on actual hr =
unit hr * per kg / hr
Actual Rate = Cost / hrs
Total Direct Labor Variance
Direct Labor Rate Variance Direct Labor Efficiency Variance

Cost Accounting Manual 2013
85 © For Suggestions & Feedbacks, contact: ATAUSH SHAFI ([email protected])
Idle hour Variance: Standard rate * idle time
Where, Idle time = Actual hour – Productive hour
Note: Idle hour variance will always be adverse.
Total labor Variance: Labor Pay Rate Variance + Labor Efficiency Variance +
Idle hour Variance
VARIABLE FOH VARIANCES
FIXED FOH VARIANCE
Total Variable FOH Variance
AVC – (SHA * SVR)
Spending Variance
(AVC – SVC)
(AH * AVR) – (AH * SVR)
AH (AVR – SVR)
AVC – (AH * SR)
Variable Efficiency Variance
SVR (AH – SHA)
Total Fixed FOH Variance
(AFC – SFC)
Fixed Volume Variance
SR (BH-SHA)
Fixed Expenditure Variance
BFC-AFC
Capacity Variance
SFR (BH-AH)
SFR (BH –AH)
Fixed Efficiency Variance
SFR (AH-SHA)
FVR (AH – SHA)
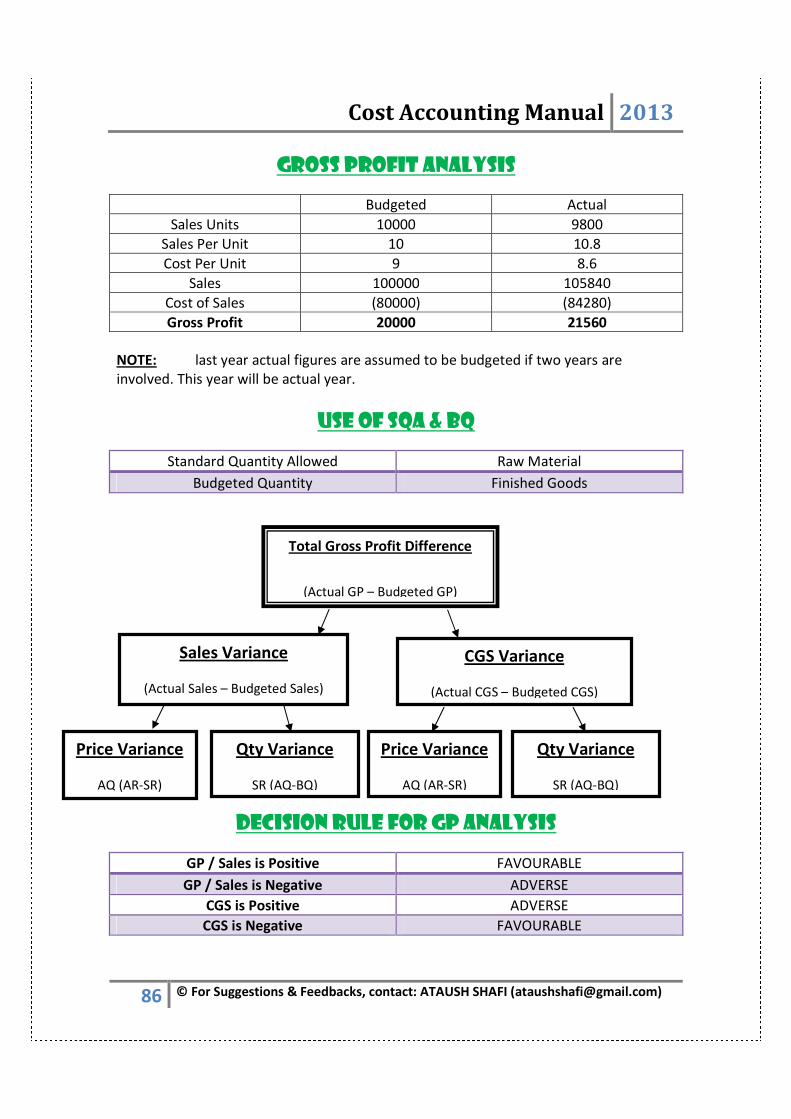
Cost Accounting Manual 2013
86 © For Suggestions & Feedbacks, contact: ATAUSH SHAFI ([email protected])
GROSS PROFIT ANALYSIS
Budgeted Actual
Sales Units 10000 9800
Sales Per Unit 10 10.8
Cost Per Unit 9 8.6
Sales 100000 105840
Cost of Sales (80000) (84280)
Gross Profit 20000 21560
NOTE: last year actual figures are assumed to be budgeted if two years are
involved. This year will be actual year.
USE OF SQA & BQ
Standard Quantity Allowed Raw Material
Budgeted Quantity Finished Goods
DECISION RULE FOR GP ANALYSIS
GP / Sales is Positive FAVOURABLE
GP / Sales is Negative ADVERSE
CGS is Positive ADVERSE
CGS is Negative FAVOURABLE
Total Gross Profit Difference
(Actual GP – Budgeted GP)
Sales Variance
(Actual Sales – Budgeted Sales)
CGS Variance
(Actual CGS – Budgeted CGS)
Price Variance
AQ (AR-SR)
Qty Variance
SR (AQ-BQ)
Price Variance
AQ (AR-SR)
Qty Variance
SR (AQ-BQ)
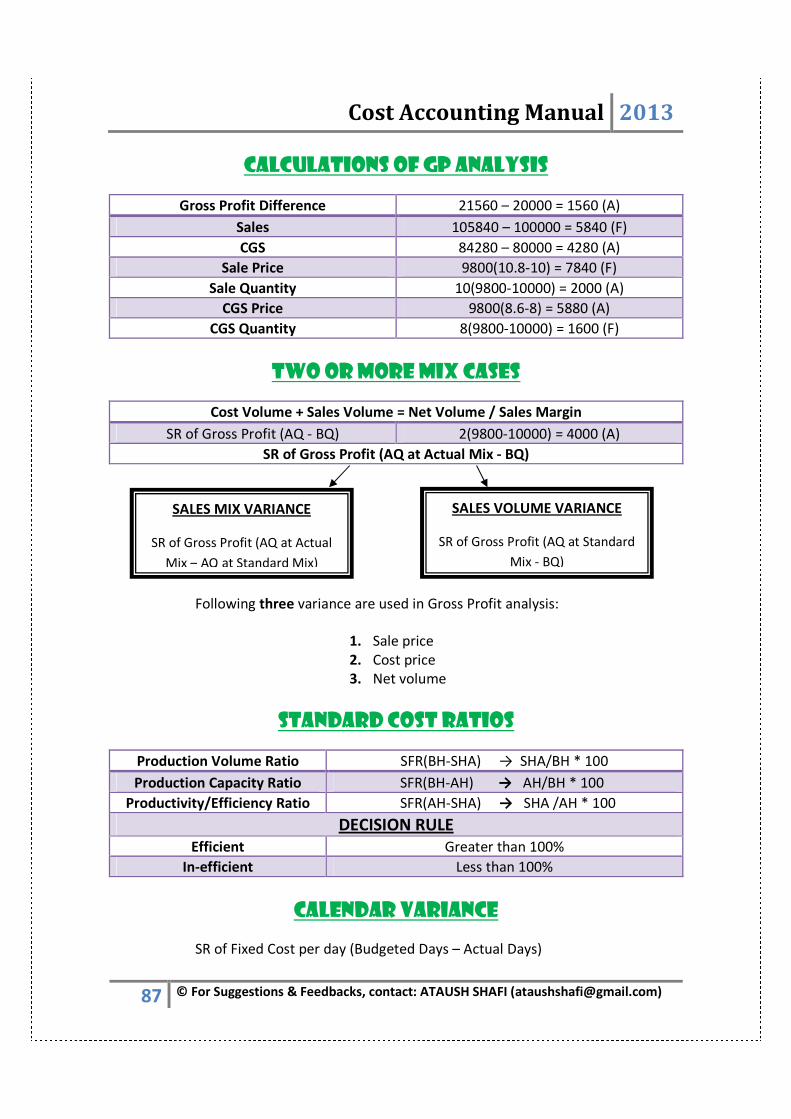
Cost Accounting Manual 2013
87 © For Suggestions & Feedbacks, contact: ATAUSH SHAFI ([email protected])
CALCULATIONS OF GP ANALYSIS
Gross Profit Difference 21560 – 20000 = 1560 (A)
Sales 105840 – 100000 = 5840 (F)
CGS 84280 – 80000 = 4280 (A)
Sale Price 9800(10.8-10) = 7840 (F)
Sale Quantity 10(9800-10000) = 2000 (A)
CGS Price 9800(8.6-8) = 5880 (A)
CGS Quantity 8(9800-10000) = 1600 (F)
TWO OR MORE MIX CASES
Cost Volume + Sales Volume = Net Volume / Sales Margin
SR of Gross Profit (AQ - BQ) 2(9800-10000) = 4000 (A)
SR of Gross Profit (AQ at Actual Mix - BQ)
Following three variance are used in Gross Profit analysis:
1. Sale price
2. Cost price
3. Net volume
STANDARD COST RATIOS
Production Volume Ratio SFR(BH-SHA) → SHA/BH * 100
Production Capacity Ratio SFR(BH-AH) → AH/BH * 100
Productivity/Efficiency Ratio SFR(AH-SHA) → SHA /AH * 100
DECISION RULE
Efficient Greater than 100%
In-efficient Less than 100%
CALENDAR VARIANCE
SR of Fixed Cost per day (Budgeted Days – Actual Days)
SALES MIX VARIANCE
SR of Gross Profit (AQ at Actual
Mix – AQ at Standard Mix)
SALES VOLUME VARIANCE
SR of Gross Profit (AQ at Standard
Mix - BQ)
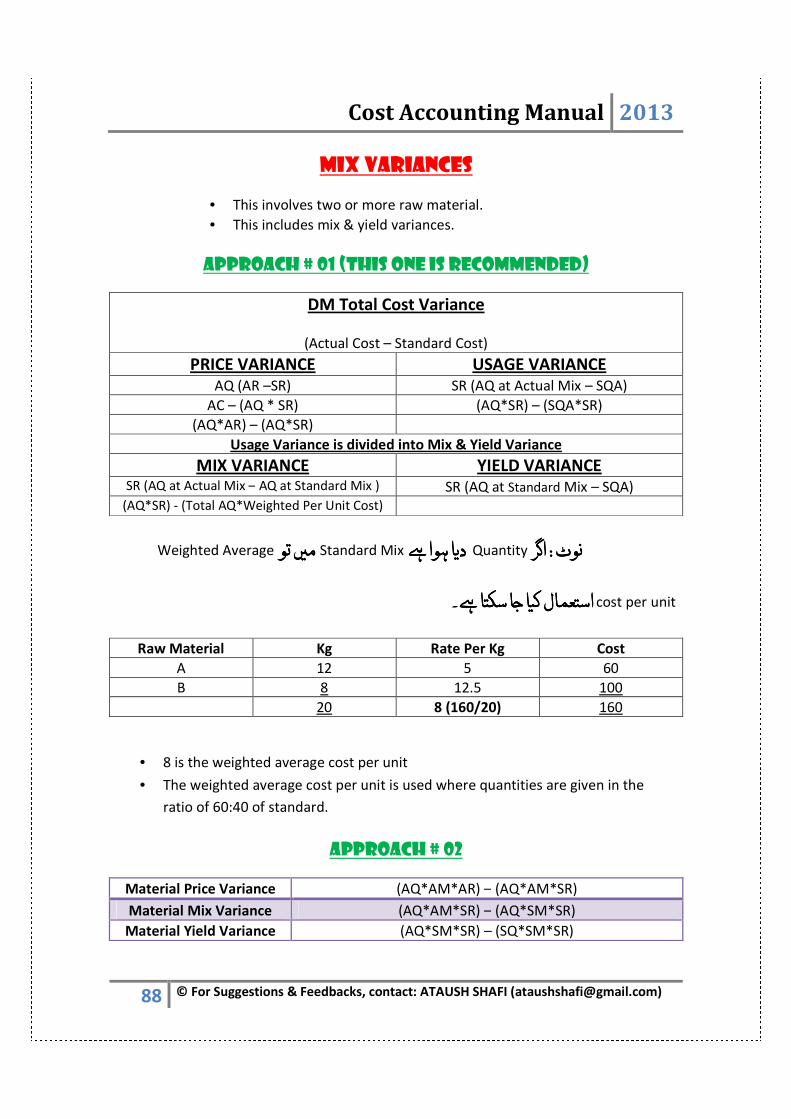
Cost Accounting Manual 2013
88 © For Suggestions & Feedbacks, contact: ATAUSH SHAFI ([email protected])
MIX VARIANCES
• This involves two or more raw material.
• This includes mix & yield variances.
APPROACH # 01 (THIS ONE IS RECOMMENDED)
DM Total Cost Variance
(Actual Cost – Standard Cost)
PRICE VARIANCE USAGE VARIANCE AQ (AR –SR) SR (AQ at Actual Mix – SQA)
AC – (AQ * SR) (AQ*SR) – (SQA*SR)
(AQ*AR) – (AQ*SR)
Usage Variance is divided into Mix & Yield Variance
MIX VARIANCE YIELD VARIANCE SR (AQ at Actual Mix – AQ at Standard Mix ) SR (AQ at Standard Mix – SQA)
(AQ*SR) - (Total AQ*Weighted Per Unit Cost)
� ��ا �� Quantity ا=�ا=�ا=�ا=�: : : : /�ٹ /�ٹ /�ٹ /�ٹ � ��ا ��د� � ��ا ��د� � ��ا ��د� � ?� Standard Mixد� �@ �? � �@ �? � �@ �? � �@Weighted Average
cost per unit �� �3AB � �, � C4 3$)�لBا�� �3AB � �, � C4 3$)�لBا�� �3AB � �, � C4 3$)�لBا�� �3AB � �, � C4 3$)�لBا.
Raw Material Kg Rate Per Kg Cost
A 12 5 60
B 8 12.5 100
20 8 (160/20) 160
• 8 is the weighted average cost per unit
• The weighted average cost per unit is used where quantities are given in the
ratio of 60:40 of standard.
APPROACH # 02
Material Price Variance (AQ*AM*AR) – (AQ*AM*SR)
Material Mix Variance (AQ*AM*SR) – (AQ*SM*SR)
Material Yield Variance (AQ*SM*SR) – (SQ*SM*SR)
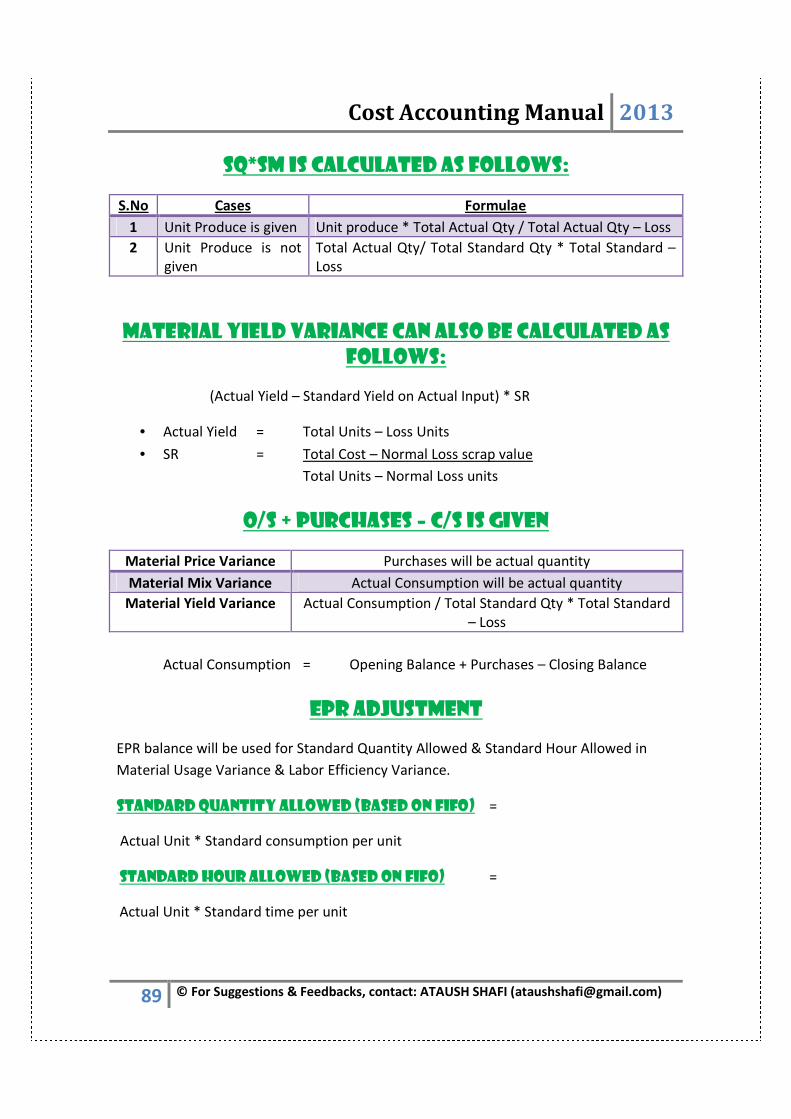
Cost Accounting Manual 2013
89 © For Suggestions & Feedbacks, contact: ATAUSH SHAFI ([email protected])
SQ*SM is calculated as follows:
S.No Cases Formulae
1 Unit Produce is given Unit produce * Total Actual Qty / Total Actual Qty – Loss
2 Unit Produce is not
given
Total Actual Qty/ Total Standard Qty * Total Standard –
Loss
Material Yield Variance can also be calculated as follows:
(Actual Yield – Standard Yield on Actual Input) * SR
• Actual Yield = Total Units – Loss Units
• SR = Total Cost – Normal Loss scrap value
Total Units – Normal Loss units
O/S + PURCHASES – C/S IS GIVEN
Material Price Variance Purchases will be actual quantity
Material Mix Variance Actual Consumption will be actual quantity
Material Yield Variance Actual Consumption / Total Standard Qty * Total Standard
– Loss
Actual Consumption = Opening Balance + Purchases – Closing Balance
EPR ADJUSTMENT
EPR balance will be used for Standard Quantity Allowed & Standard Hour Allowed in
Material Usage Variance & Labor Efficiency Variance.
Standard Quantity Allowed (Based on FIFO) =
Actual Unit * Standard consumption per unit
Standard Hour Allowed (Based on FIFO) =
Actual Unit * Standard time per unit
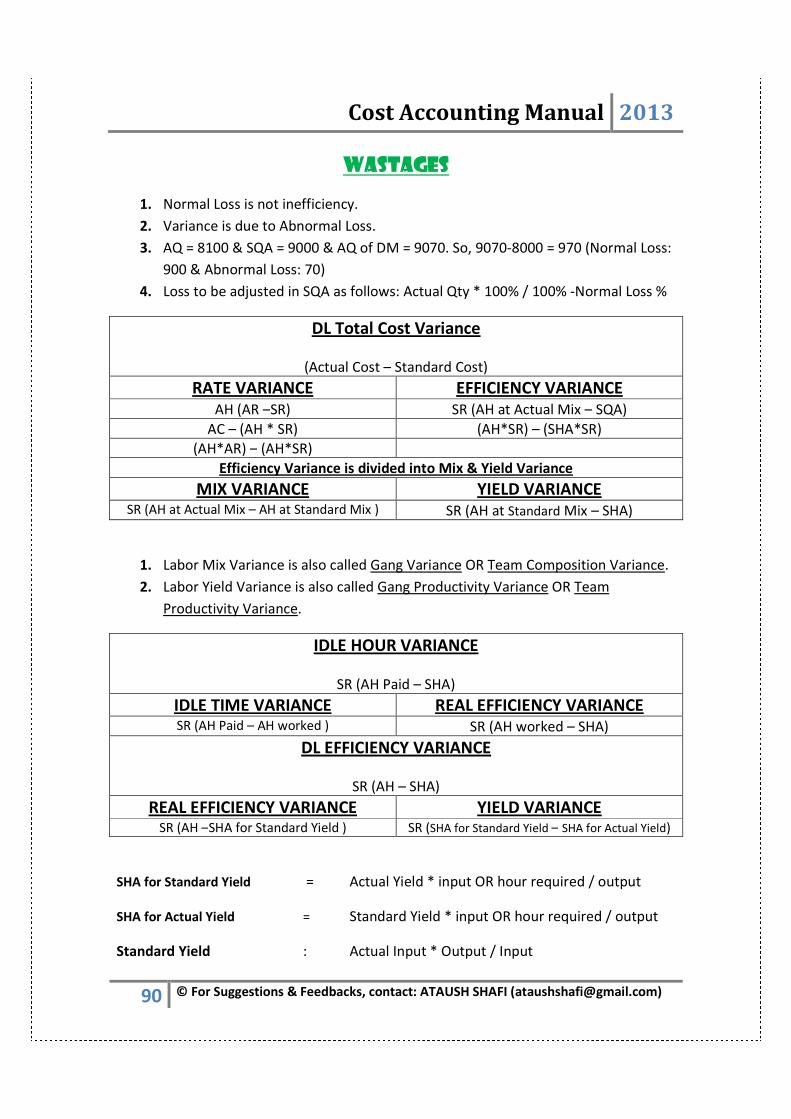
Cost Accounting Manual 2013
90 © For Suggestions & Feedbacks, contact: ATAUSH SHAFI ([email protected])
WASTAGES
1. Normal Loss is not inefficiency.
2. Variance is due to Abnormal Loss.
3. AQ = 8100 & SQA = 9000 & AQ of DM = 9070. So, 9070-8000 = 970 (Normal Loss:
900 & Abnormal Loss: 70)
4. Loss to be adjusted in SQA as follows: Actual Qty * 100% / 100% -Normal Loss %
DL Total Cost Variance
(Actual Cost – Standard Cost)
RATE VARIANCE EFFICIENCY VARIANCE AH (AR –SR) SR (AH at Actual Mix – SQA)
AC – (AH * SR) (AH*SR) – (SHA*SR)
(AH*AR) – (AH*SR)
Efficiency Variance is divided into Mix & Yield Variance
MIX VARIANCE YIELD VARIANCE SR (AH at Actual Mix – AH at Standard Mix ) SR (AH at Standard Mix – SHA)
1. Labor Mix Variance is also called Gang Variance OR Team Composition Variance.
2. Labor Yield Variance is also called Gang Productivity Variance OR Team
Productivity Variance.
IDLE HOUR VARIANCE
SR (AH Paid – SHA)
IDLE TIME VARIANCE REAL EFFICIENCY VARIANCE SR (AH Paid – AH worked ) SR (AH worked – SHA)
DL EFFICIENCY VARIANCE
SR (AH – SHA)
REAL EFFICIENCY VARIANCE YIELD VARIANCE SR (AH –SHA for Standard Yield ) SR (SHA for Standard Yield – SHA for Actual Yield)
SHA for Standard Yield = Actual Yield * input OR hour required / output
SHA for Actual Yield = Standard Yield * input OR hour required / output
Standard Yield : Actual Input * Output / Input
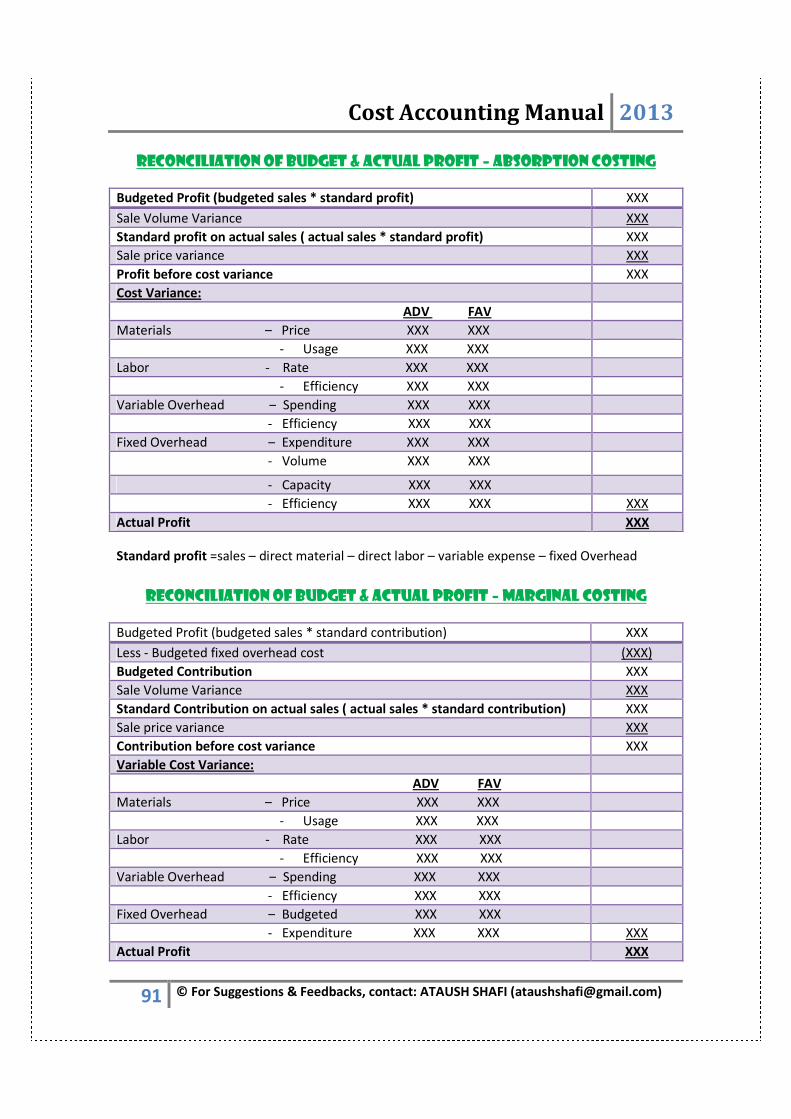
Cost Accounting Manual 2013
91 © For Suggestions & Feedbacks, contact: ATAUSH SHAFI ([email protected])
RECONCILIATION OF BUDGET & ACTUAL PROFIT – ABSORPTION COSTING
Budgeted Profit (budgeted sales * standard profit) XXX
Sale Volume Variance XXX
Standard profit on actual sales ( actual sales * standard profit) XXX
Sale price variance XXX
Profit before cost variance XXX
Cost Variance:
ADV FAV
Materials – Price XXX XXX
- Usage XXX XXX
Labor - Rate XXX XXX
- Efficiency XXX XXX
Variable Overhead – Spending XXX XXX
- Efficiency XXX XXX
Fixed Overhead – Expenditure XXX XXX
- Volume XXX XXX
- Capacity XXX XXX
- Efficiency XXX XXX XXX
Actual Profit XXX
Standard profit =sales – direct material – direct labor – variable expense – fixed Overhead
RECONCILIATION OF BUDGET & ACTUAL PROFIT – MARGINAL COSTING
Budgeted Profit (budgeted sales * standard contribution) XXX
Less - Budgeted fixed overhead cost (XXX)
Budgeted Contribution XXX
Sale Volume Variance XXX
Standard Contribution on actual sales ( actual sales * standard contribution) XXX
Sale price variance XXX
Contribution before cost variance XXX
Variable Cost Variance:
ADV FAV
Materials – Price XXX XXX
- Usage XXX XXX
Labor - Rate XXX XXX
- Efficiency XXX XXX
Variable Overhead – Spending XXX XXX
- Efficiency XXX XXX
Fixed Overhead – Budgeted XXX XXX
- Expenditure XXX XXX XXX
Actual Profit XXX

Cost Accounting Manual 2013
92 © For Suggestions & Feedbacks, contact: ATAUSH SHAFI ([email protected])
Standard contribution =sales – direct material – direct labor – variable expense.
COST RECONCILIATION STATEMENT
Standard Cost XXX
Cost Variance:
Adv Fav
XXX XXX
XXX XXX
XXX XXX
XXX XXX XXX
Actual Cost XXX
1. Favorable – LESS
2. Adverse = ADD
3. It includes only cost variance.
PROFIT RECONCILIATION STATEMENT
Budgeted Profit XXX
Sale Variance:
Adv Fav
XXX XXX
XXX XXX
XXX XXX
XXX XXX XXX
Cost Variance:
Adv Fav
XXX XXX
XXX XXX
XXX XXX
XXX XXX XXX
Actual Cost XXX
1. Favorable – ADD
2. Adverse = LESS
3. It includes cost & sales variance.
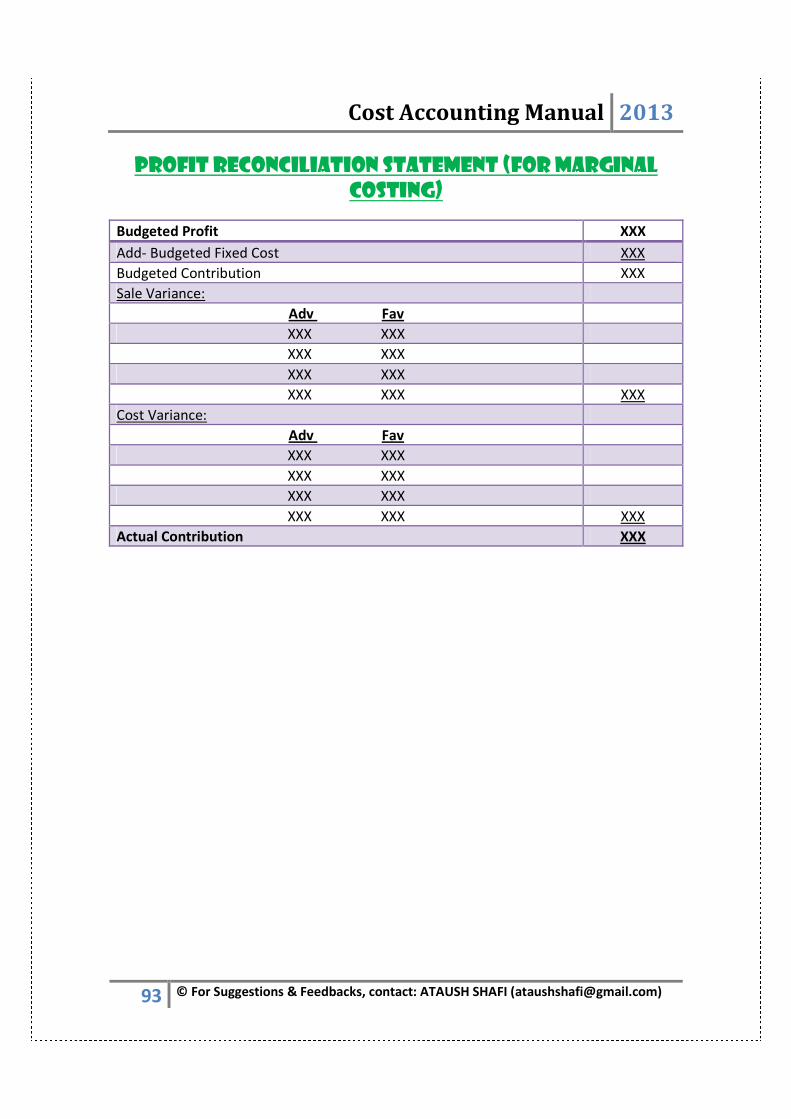
Cost Accounting Manual 2013
93 © For Suggestions & Feedbacks, contact: ATAUSH SHAFI ([email protected])
PROFIT RECONCILIATION STATEMENT (FOR MARGINAL COSTING)
Budgeted Profit XXX
Add- Budgeted Fixed Cost XXX
Budgeted Contribution XXX
Sale Variance:
Adv Fav
XXX XXX
XXX XXX
XXX XXX
XXX XXX XXX
Cost Variance:
Adv Fav
XXX XXX
XXX XXX
XXX XXX
XXX XXX XXX
Actual Contribution XXX
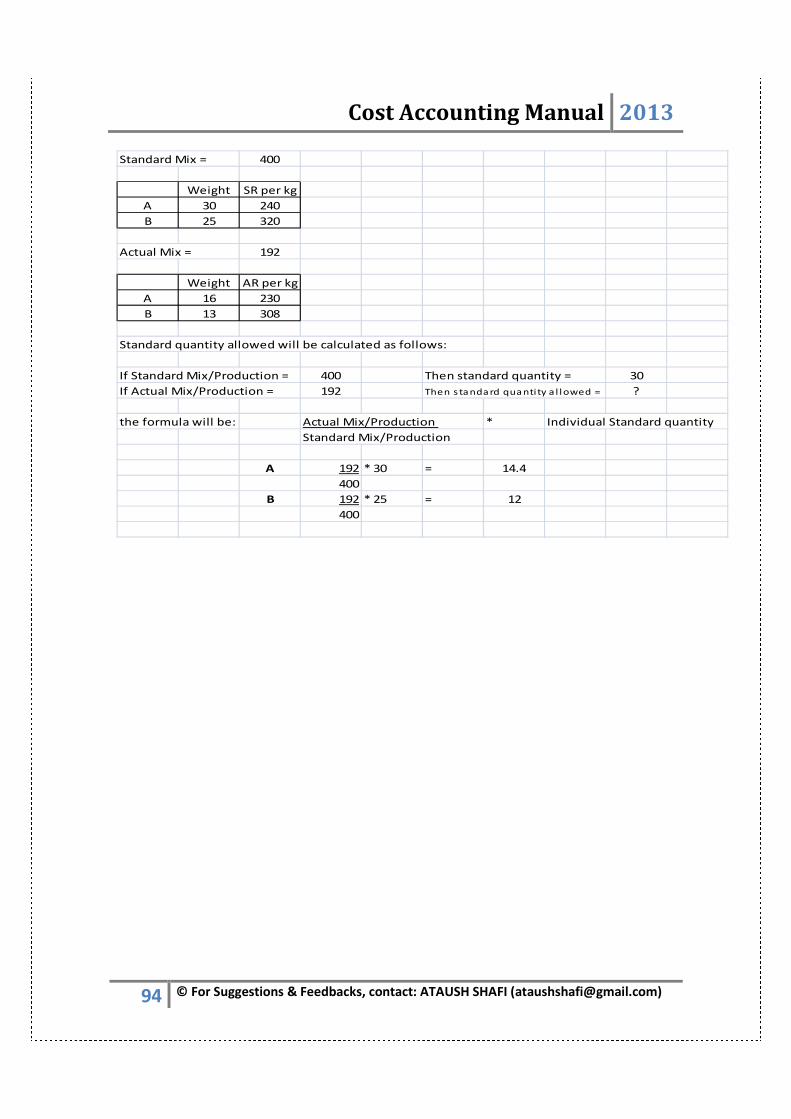
Cost Accounting Manual 2013
94 © For Suggestions & Feedbacks, contact: ATAUSH SHAFI ([email protected])
Standard Mix = 400
Weight SR per kg
A 30 240
B 25 320
Actual Mix = 192
Weight AR per kg
A 16 230
B 13 308
Standard quantity allowed will be calculated as follows:
If Standard Mix/Production = 400 Then standard quantity = 30
If Actual Mix/Production = 192 Then s tandard quantity a l lowed = ?
the formula will be: Actual Mix/Production * Individual Standard quantity
Standard Mix/Production
A 192 * 30 = 14.4
400
B 192 * 25 = 12
400
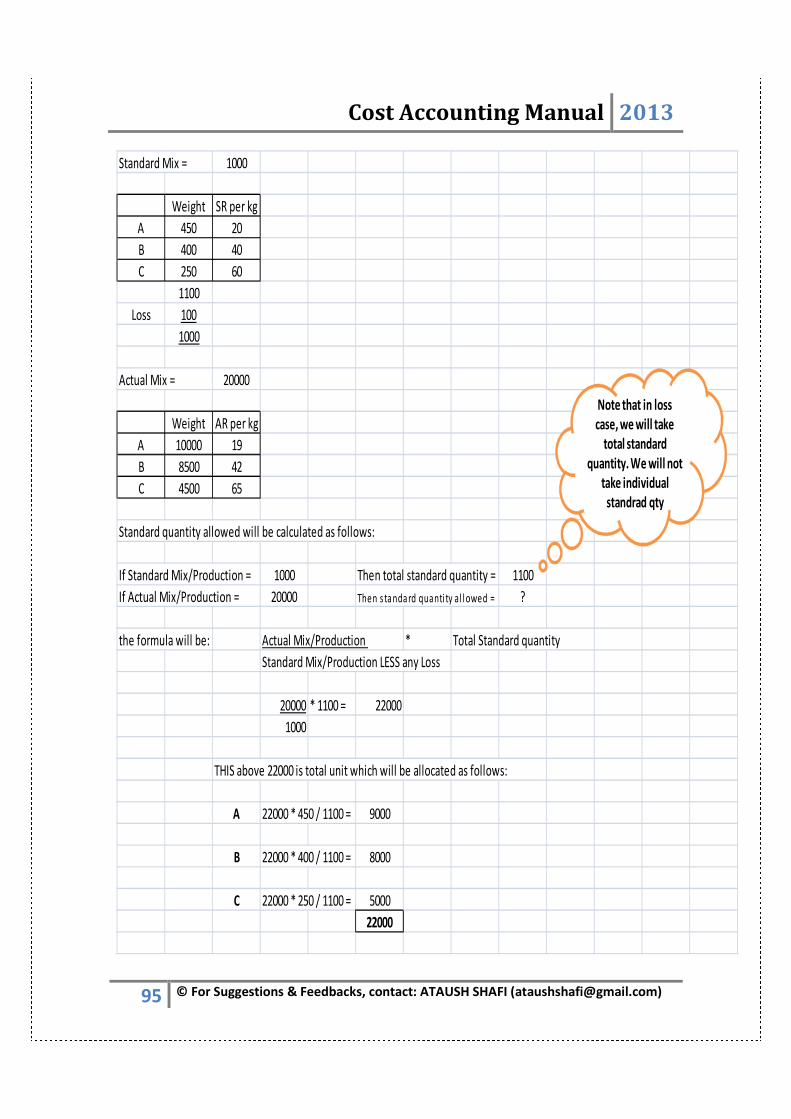
Cost Accounting Manual 2013
95 © For Suggestions & Feedbacks, contact: ATAUSH SHAFI ([email protected])
Standard Mix = 1000
Weight SR per kg
A 450 20
B 400 40
C 250 60
1100
Loss 100
1000
Actual Mix = 20000
Weight AR per kg
A 10000 19
B 8500 42
C 4500 65
Standard quantity allowed will be calculated as follows:
If Standard Mix/Production = 1000 Then total standard quantity = 1100
If Actual Mix/Production = 20000 Then s tandard quanti ty al lowed = ?
the formula will be: Actual Mix/Production * Total Standard quantity
Standard Mix/Production LESS any Loss
20000 * 1100 = 22000
1000
THIS above 22000 is total unit which will be allocated as follows:
A 22000 * 450 / 1100 = 9000
B 22000 * 400 / 1100 = 8000
C 22000 * 250 / 1100 = 5000
22000
Note that in loss
case, we will take
total standard
quantity. We will not
take individual
standrad qty

Cost Accounting Manual 2013
96 © For Suggestions & Feedbacks, contact: ATAUSH SHAFI ([email protected])
Standard Mix = 1900
Weight SR per kg Rs
A 1000 10 10000
B 600 12 7200
C 400 14 5600
2000
Loss 100
1900
Actual Mix = THIS WILL NEVER BE GIVEN IN QUESTION.
Opening
StockPurchases
Closing
Stock
Consump
tionAR per kg
A 200 1200 300 1100 9.5
B 100 800 200 700 12.5
C 400 700 500 600 14
2400
Wastage of 200 is also occurred.
Standard quantity allowed will be calculated as follows:
If Standard Mix/Production = 1900 Then individual standard cost = 10000
If Actual Mix/Production = 2400 Then s tandard quanti ty a l lowed = ?
the formula will be: Actual Mix/Production * Individual Standard Cost
Standard Mix/Production LESS any Loss
A 2400 - 200 * 10000 = 11578
1900
B 2400 - 200 * 7200 = 8336
1900
C 2400 - 200 * 5600 = 6484
1900
Note that we will take
Individual standard
cost in this case

Cost Accounting Manual 2013
97 © For Suggestions & Feedbacks, contact: ATAUSH SHAFI ([email protected])
Standard Mix = 1000 kg
Qty SR per kg
A 450 20
B 400 40
C 250 60
1100
Standard Loss 100
Standard Output 1000
Actual Mix = 20000 kg
Qty SR per kg
A 10000 19
B 8500 42
C 4500 65
Material Price Variance =
A 10000 (F)
B 17000 (A)
C 22500 (A)
29500 (A)
Material Mix Variance =
A 11820 (A)
B 5480 (A)
C 43620 (F)
26320 (F)
A = 9409
B = 8363
C = 5227
MATERIAL MIX VARIANCES ILLUSTRATION
23000 * 450 /1100
23000 *400 /1100
23000 *250 / 1100
Actual Qty (AR -SR)
SR ( Actual Qty at Actual Mix - Actual Qty at Standard Mix)
Actual Qty at Standard Mix is calculated as follows:
10000 (19-20) =
8500 (42-40) =
4500 (65-60) =
20 (10000 - 9409) =
40 (8500 - 8363) =
60 (4500 - 5227) =

Cost Accounting Manual 2013
98 © For Suggestions & Feedbacks, contact: ATAUSH SHAFI ([email protected])
Material Yield Variance =
A 8180 (A)
B 14520 (A)
C 13620 (A)
36320 (A)
If Standard Mix/Production = 1000 Then standard quantity = 450
If Actual Mix/Production = 20000 Then standard quanti ty a l lowed = ?
the formula will be: Actual Mix/Production * Individual Standard quantity
Standard Mix/Production
A 20000 * 450 = 9000
1000
B 20000 * 400 = 8000
1000
C 20000 * 200 = 5000
1000
Material Usage Variance =
A 20000 (A)
B 20000 (A)
C 30000 (F)
10000 (A)
OR
Material Usage Variance = Material Mix Variance +Material Yield Variance
26320 (F) + 36320 (A) = 10000 (A)
Material Cost Variance =
= (10000 * 19) - (9000 * 20)
(8500 * 42) - (8000 * 40)
(4500 * 65) - (5000 * 60)
= (190000+357000+292500) - (180000+320000+300000)
= 839500 - 800000 = 39500 (A)
OR
Material Cost Variance = Material Price Variance +Material Usage Variance
29500 (A) + 10000 (A) = 39500 (A)
(Actual Cost - Standard Cost)
SR ( Actual Qty at Standard Mix - Standard Qty Allowed)
SR ( Actual Qty at Actual Mix - Standard Qty Allowed)
20 (10000 - 9000) =
40 (8500 - 8000) =
60 (4500 - 5000) =
Standard Qty Allowed is calculated as follows:
20 (9409 - 9000) =
40 (8363 - 8000) =
60 (5227 - 5000) =

Cost Accounting Manual 2013
99 © For Suggestions & Feedbacks, contact: ATAUSH SHAFI ([email protected])
Budgeted sales is as follows:
A 800 units @ 100 per unit
B 700 units @ 200 per unit
Actual sales is as follows:
A 900 units @ 110 per unit
B 800 units @ 180 per unit
Cost per unit:
A 80
B 170
Calculate sales variances.
Sales Price Variance =
A 9000 (F)
B 16000 (A)
7000 (A)
Sales Mix Variance =
A 140 (A)
B 210 (F)
70 (F)
A = 907
B = 793
A 100 - 80 = 20
B 200 - 170 = 30
Sales Volume Variance =
A 2140 (F)
B 2790 (F)
4930 (F)
Sales Usage Variance =
A 2000 (F)
B 3000 (F)
5000 (F)
30 (800 - 700) =
SR of Gross Proft is calculated as follows:
SR of Gross Profit ( Actual Qty at Actual Mix - Actual Qty at Standard Mix)
AR of Gross Proft is calculated as follows:
Standard Sales - Standrad Cost
Actual Sales - Standrad Cost
20 (900 - 907) =
30 (800 - 793) =
Actual Qty at Standard Mix is calculated as follows:
1700 * 800/1500
1700 *700/1500
SR of Gross Profit ( Actual Qty at Standard Mix - Budgeted Qty)
20 (907 - 800) =
30 (793 - 700) =
SR of Gross Profit ( Actual Qty at Actual Mix - Budgeted Qty)
20 (900 - 800) =
Actual Qty (AR -SR)
900 (110-100) =
800 (180-200) =
SALE MIX VARIANCES ILLUSTRATION

Cost Accounting Manual 2013
100 © For Suggestions & Feedbacks, contact: ATAUSH SHAFI ([email protected])
MATERIAL COSTING
MATERIAL COSTING
MATERIAL COSTING METHODS
• First in first out (FIFO)
• Last in last out (LIFO)
• Highest in first out (HIFO)
• Standard Costing (SC) = Quantity issued * standard cost
• Replacement Costing (RC) = Quantity issued * replacement cost
• Average Costing (AVCO)
1. Cumulative Average Costing (CAC) = normal method that we use.
2. Periodic Average Costing (PAC)
Cost of unit received + cost of opening stock / No of unit received + no of opening stock
= answer * quantity issued (individual) XXX
Less- Cost of unit received + cost of opening stock XXX
Value of Closing stock XXX
LIFO VS FIFO COMPARISON
Method Price Income Statement Effect Balance Sheet Effect
CGS NI
LIFO Increase High Low Low Ending Inventory
FIFO Increase Low High High Ending Inventory
LIFO Decrease High High High Ending Inventory
FIFO Decrease Low Low Low Ending Inventory
FIFO LIFO WACO
COGS consists of First purchased Last purchased Average cost of all
item
Ending Inv. consists of Most recent
purchase
Earliest
purchase
Average cost of all
item

Cost Accounting Manual 2013
101 © For Suggestions & Feedbacks, contact: ATAUSH SHAFI ([email protected])
INVENTORY VALUATION METHODS
• Cost
• Sale price
• Lower of cost or market value
• Lower of cost or net realizable value
• Lower of cost or replacement value
FORMULAE
Total Material Turnover: Material Used/Average Material
Finished Goods Turnover: Finished Goods Sold/Average Material
Average Material: Opening stock + Closing stock/2
Day Requirement in Average Inventory: 365 / Turnover ratio
Date before Next Order:
• Frequency
• Day Supply left = unit in inventory /
EOQ * Frequency
• Next Order : Supply Left – Lead Time
LOWER OF COST & MARKET VALUE
CASE COST MARKET LCM
Replacement
Cost
NRV/Ceiling Adj NRV/
Floor
Market (Ltd by
floor & ceiling)
XX XX XX XX XX XX XX
1 2 3 2nd
number is
shown here
Low of
market or
cost 2 1 3
3 2 1
STORE LEDGER CARD
M/S ……………
Store ledger card / bin card
(Method name)
DATE RECEIVED ISSUED BALANCE
Unit U.P. Amount Unit U.P. Amount Unit U.P. Amount
XX-XX-200X XX XX XX XX XX XX XX XX XX
XX-XX-200X XX XX XX XX XX XX XX XX XX

Cost Accounting Manual 2013
102 © For Suggestions & Feedbacks, contact: ATAUSH SHAFI ([email protected])
DEFECTIVE UNITS
SPECIFIC (WIP) ENTIRE (FOH) Work in Process – Material
Work in Process – Labor
Work in Process – FOH
Material
Labor
Factory Over Head
Work in Process – Material
Work in Process – Labor
Work in Process – FOH
Material
Labor
Factory Over Head
Work in Process – Material
Work in Process – Labor
Work in Process – FOH
Material
Labor
Factory Over Head
Factory Over Head
Material
Labor
Factory Over Head
Finished Goods
Work in Process – Material
Work in Process – Labor
Work in Process – FOH
Finished Goods
Work in Process – Material
Work in Process – Labor
Work in Process – FOH
SPOILAGE UNITS
SPECIFIC (WIP) ENTIRE (FOH) Work in Process – Material
Work in Process – Labor
Work in Process – FOH
Material
Labor
Factory Over Head
Work in Process – Material
Work in Process – Labor
Work in Process – FOH
Material
Labor
Factory Over Head
Spoiled Goods
Factory Over Head
Work in Process – Material
Work in Process – Labor
Work in Process – FOH (Cost of Spoilage = DM+DL+FOH – Spoilage Scrap)
Spoiled Goods
Work in Process – Material
Work in Process – Labor
Work in Process – FOH
Finished Goods
Work in Process – Material
Work in Process – Labor
Work in Process – FOH
Finished Goods
Work in Process – Material
Work in Process – Labor
Work in Process – FOH

Cost Accounting Manual 2013
103 © For Suggestions & Feedbacks, contact: ATAUSH SHAFI ([email protected])
SPOILAGE CALCULATION
SPECIFIC (WIP) ENTIRE (FOH) Recovery
Recovery + loss
Per unit cost change Per unit cost do not change
FG cost: Total cost + Additional cost – Spoilage
cost
FG cost: Total cost – Spoilage cost
Spoilage distribution: Spoilage cost / total cost
* 100
Spoilage distribution: Particular cost / unit
made * 100
INVENTORY CONTROLS
WITHOUT SAFETY STOCK WITH SAFETY STOCK
Order Level / Point /
Re-Order Level:
Maximum usage during lead time
OR
Maximum usage * Max lead time
Normal /Average usage during
lead time + Safety Stock
OR
(Normal /Average usage *
lead time) + Safety Stock
Minimum Level / Sock
/ Point/ Buffer Level
Order Level - Normal /Average
usage during lead time
OR
Order Level – (Normal /Average
usage * lead time)
OR
(Maximum daily usage - Normal
/Average daily usage) * lead time
-
Maximum Level /
Stock / Point
Order Level + EOQ - Minimum
usage during lead time
OR
Order Level + EOQ – (Minimum
daily usage * lead time)
Order Level + EOQ - Normal
/Average usage during lead
time
OR
EOQ + Safety Stock
Safety Stock: (Maximum Usage – Average Usage)
* lead time
Average Stock Level:
½ (Minimum Level + Maximum
level)
OR
½ (Opening Stock + Closing Stock)
EOQ/2 + Safety Stock
Danger Level
Normal /Average usage during lead
time for urgent supply
OR
Normal /Average daily usage * lead
time for urgent supply
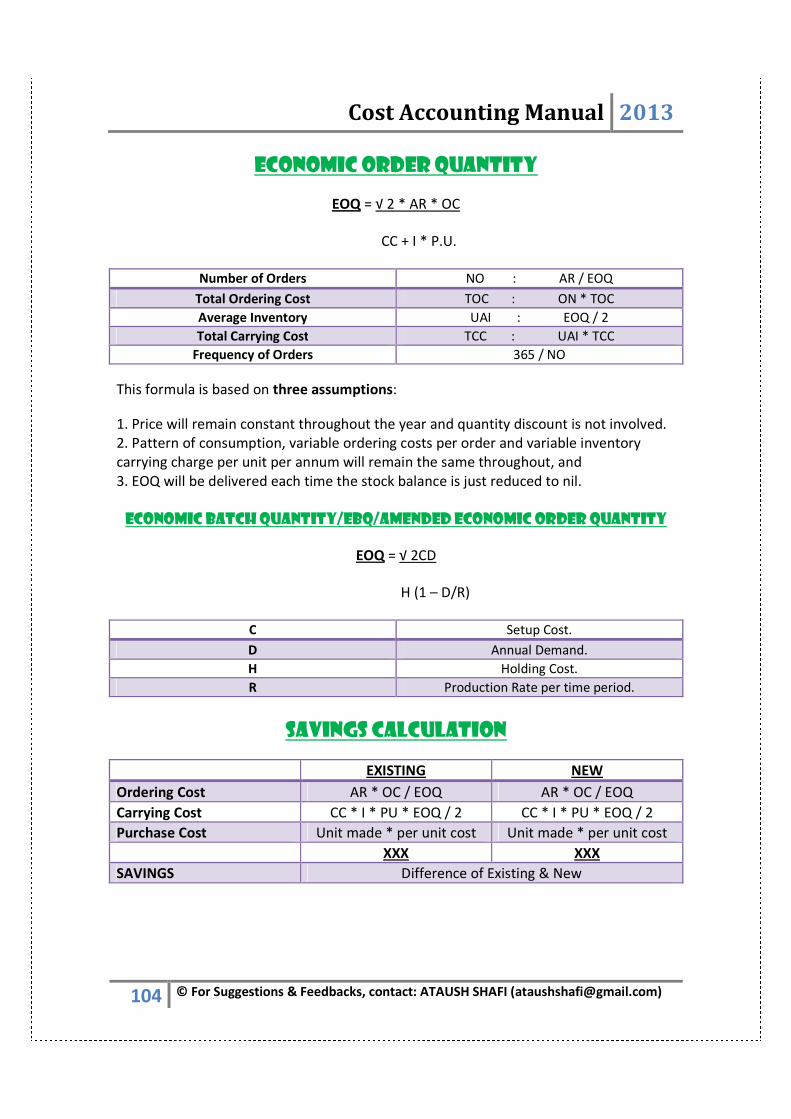
Cost Accounting Manual 2013
104 © For Suggestions & Feedbacks, contact: ATAUSH SHAFI ([email protected])
ECONOMIC ORDER QUANTITY
EOQ = √ 2 * AR * OC
CC + I * P.U.
Number of Orders NO : AR / EOQ
Total Ordering Cost TOC : ON * TOC
Average Inventory UAI : EOQ / 2
Total Carrying Cost TCC : UAI * TCC
Frequency of Orders 365 / NO
This formula is based on three assumptions:
1. Price will remain constant throughout the year and quantity discount is not involved.
2. Pattern of consumption, variable ordering costs per order and variable inventory
carrying charge per unit per annum will remain the same throughout, and
3. EOQ will be delivered each time the stock balance is just reduced to nil.
ECONOMIC BATCH QUANTITY/EBQ/AMENDED ECONOMIC ORDER QUANTITY
EOQ = √ 2CD
H (1 – D/R)
C Setup Cost.
D Annual Demand.
H Holding Cost.
R Production Rate per time period.
SAVINGS CALCULATION
EXISTING NEW
Ordering Cost AR * OC / EOQ AR * OC / EOQ
Carrying Cost CC * I * PU * EOQ / 2 CC * I * PU * EOQ / 2
Purchase Cost Unit made * per unit cost Unit made * per unit cost
XXX XXX
SAVINGS Difference of Existing & New

Cost Accounting Manual 2013
105 © For Suggestions & Feedbacks, contact: ATAUSH SHAFI ([email protected])
FORMATFORMATFORMATFORMAT
1. Factory cost = XXX
Contribution required = (FC + TP / total limiting factor hrs * limiting factor hr) = XXX
PRICE = XXX 2. Lowest price: Basic unit + Net Profit – Opening Profit / Capacity
INVENTORY ASSOCIATED COSTINVENTORY ASSOCIATED COSTINVENTORY ASSOCIATED COSTINVENTORY ASSOCIATED COST
Annual purchase cost = Irrelevant
Annual ordering cost = Relevant
Annual carrying cost = Relevant
COMPONENT OF PURCHASE COST COMPONENT OF PURCHASE COST COMPONENT OF PURCHASE COST COMPONENT OF PURCHASE COST
1. Invoice price
2. Discount
3. Insurance in transit
4. Commission or brokerage
5. Purchase related taxes & duties (non refundable & non adjustable)
6. Transportation cost if constant per unit
7. Non returnable container & packing
COMPONENT OF ORDERCOMPONENT OF ORDERCOMPONENT OF ORDERCOMPONENT OF ORDERING COSTING COSTING COSTING COST
1. Clerical cost per order
2. Inspection cost per order
3. Transportation cost if constant per order
COMPONENT OF CARRYING COST (HOLDING COST / STORAGE COST)COMPONENT OF CARRYING COST (HOLDING COST / STORAGE COST)COMPONENT OF CARRYING COST (HOLDING COST / STORAGE COST)COMPONENT OF CARRYING COST (HOLDING COST / STORAGE COST)
1. Insurance
2. Wastage
3. Material handling cost
4. Storage charged if constant per order
5. Interest / working capital cost
DM EOQ = Raw Material
WIP EBQ = Production
FG Working Capital Management = Store
DEBTORS Debtor Management
CASH
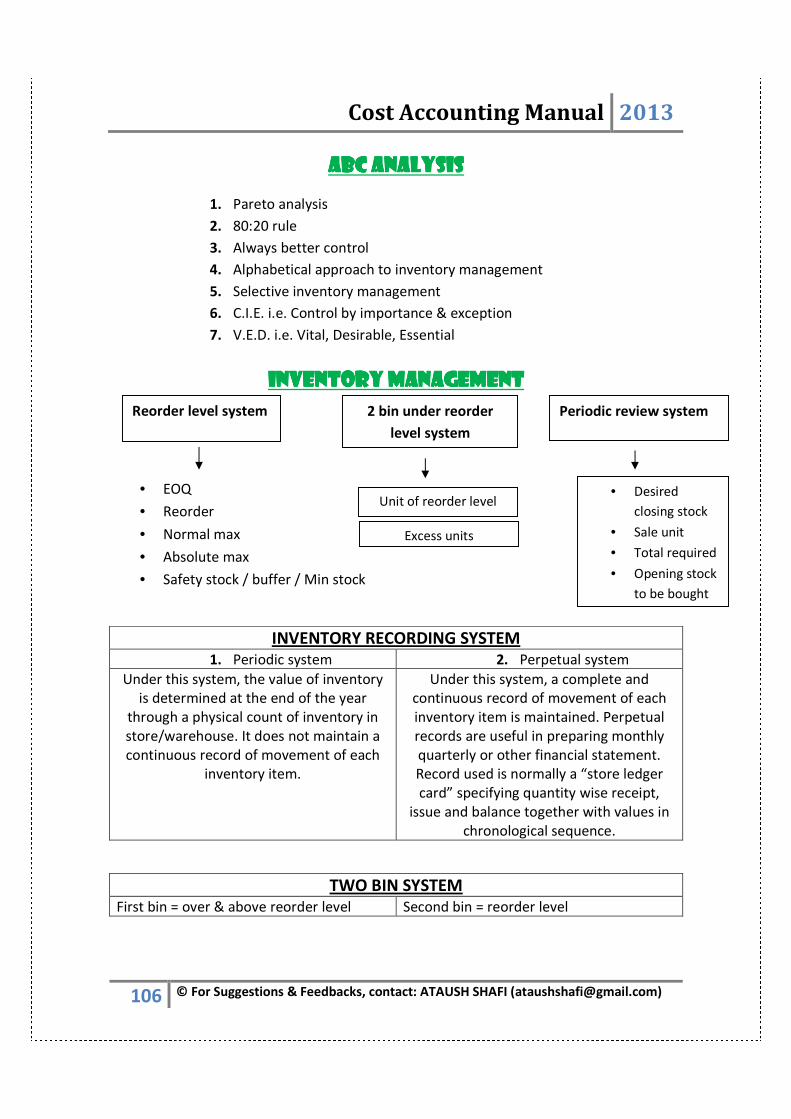
Cost Accounting Manual 2013
106 © For Suggestions & Feedbacks, contact: ATAUSH SHAFI ([email protected])
ABC ANALYSISABC ANALYSISABC ANALYSISABC ANALYSIS
1. Pareto analysis
2. 80:20 rule
3. Always better control
4. Alphabetical approach to inventory management
5. Selective inventory management
6. C.I.E. i.e. Control by importance & exception
7. V.E.D. i.e. Vital, Desirable, Essential
INVENTORY MANAGEMENTINVENTORY MANAGEMENTINVENTORY MANAGEMENTINVENTORY MANAGEMENT
• EOQ
• Reorder
• Normal max
• Absolute max
• Safety stock / buffer / Min stock
INVENTORY RECORDING SYSTEM 1. Periodic system 2. Perpetual system
Under this system, the value of inventory
is determined at the end of the year
through a physical count of inventory in
store/warehouse. It does not maintain a
continuous record of movement of each
inventory item.
Under this system, a complete and
continuous record of movement of each
inventory item is maintained. Perpetual
records are useful in preparing monthly
quarterly or other financial statement.
Record used is normally a “store ledger
card” specifying quantity wise receipt,
issue and balance together with values in
chronological sequence.
TWO BIN SYSTEM First bin = over & above reorder level Second bin = reorder level
Reorder level system 2 bin under reorder
level system
Periodic review system
Unit of reorder level
Excess units
• Desired
closing stock
• Sale unit
• Total required
• Opening stock
to be bought
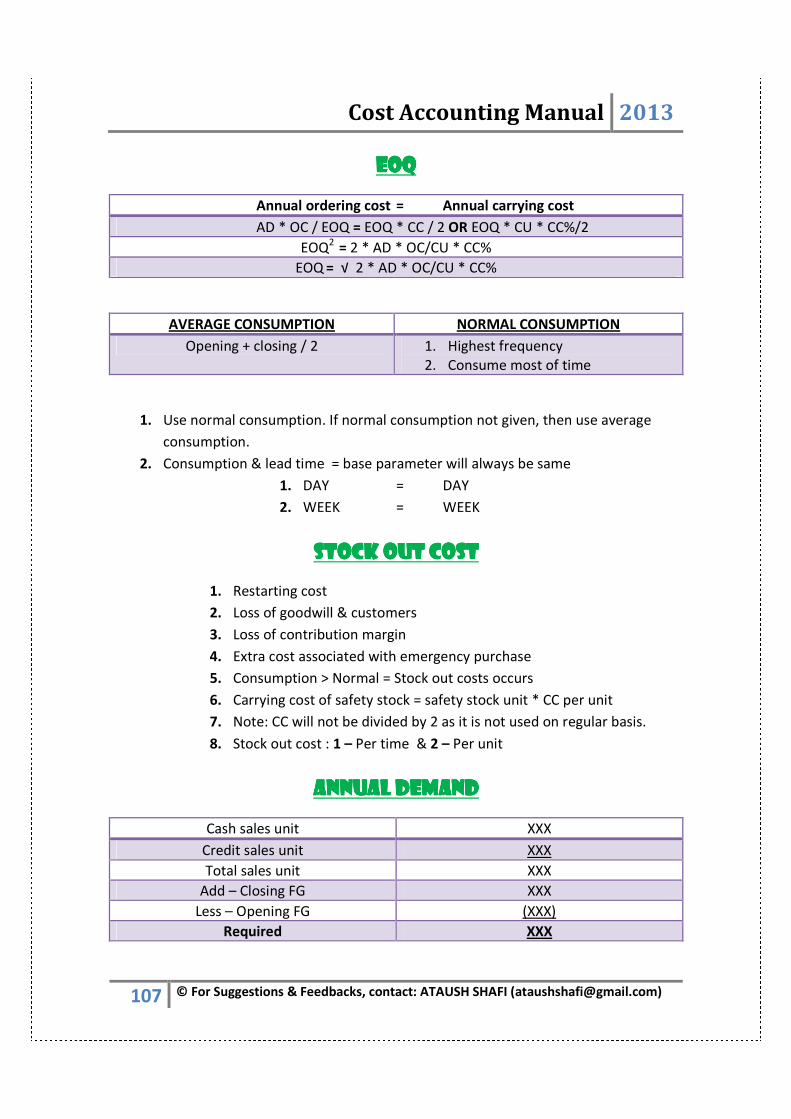
Cost Accounting Manual 2013
107 © For Suggestions & Feedbacks, contact: ATAUSH SHAFI ([email protected])
EOQEOQEOQEOQ
Annual ordering cost = Annual carrying cost
AD * OC / EOQ = EOQ * CC / 2 OR EOQ * CU * CC%/2
EOQ2
= 2 * AD * OC/CU * CC%
EOQ = √ 2 * AD * OC/CU * CC%
AVERAGE CONSUMPTION NORMAL CONSUMPTION
Opening + closing / 2 1. Highest frequency
2. Consume most of time
1. Use normal consumption. If normal consumption not given, then use average
consumption.
2. Consumption & lead time = base parameter will always be same
1. DAY = DAY
2. WEEK = WEEK
STOCK OUT COSTSTOCK OUT COSTSTOCK OUT COSTSTOCK OUT COST
1. Restarting cost
2. Loss of goodwill & customers
3. Loss of contribution margin
4. Extra cost associated with emergency purchase
5. Consumption > Normal = Stock out costs occurs
6. Carrying cost of safety stock = safety stock unit * CC per unit
7. Note: CC will not be divided by 2 as it is not used on regular basis.
8. Stock out cost : 1 – Per time & 2 – Per unit
ANNUAL DEMANDANNUAL DEMANDANNUAL DEMANDANNUAL DEMAND
Cash sales unit XXX
Credit sales unit XXX
Total sales unit XXX
Add – Closing FG XXX
Less – Opening FG (XXX)
Required XXX
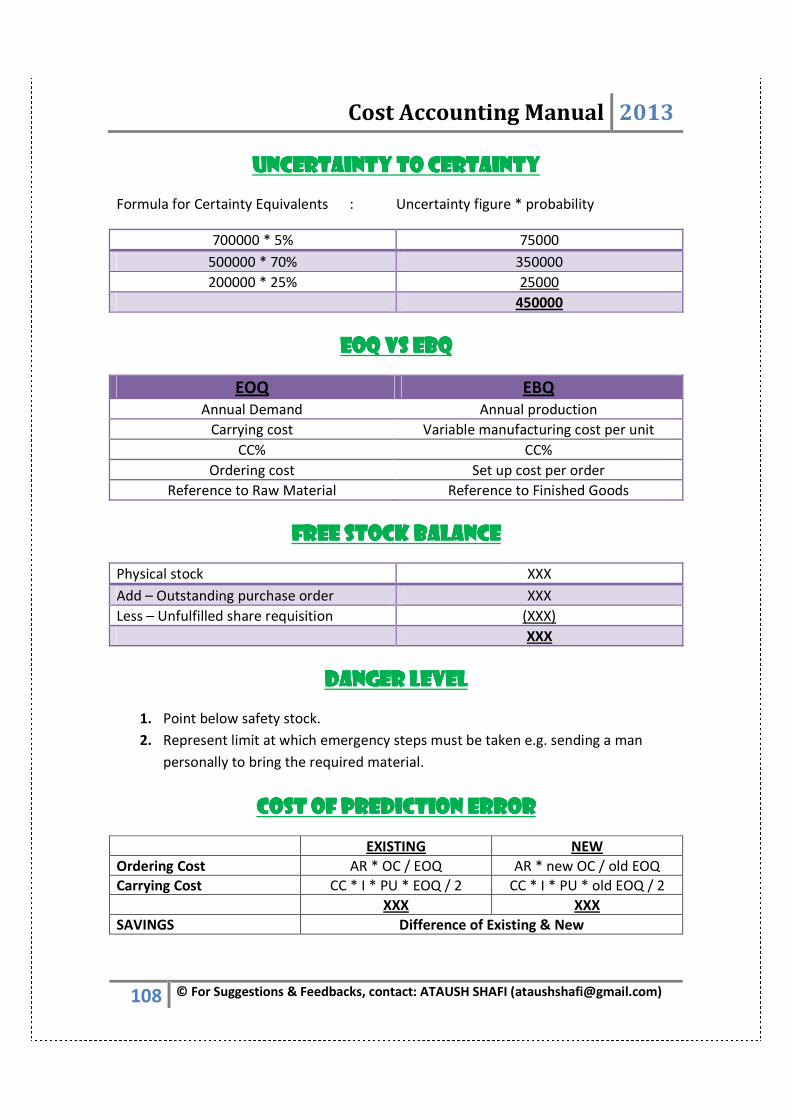
Cost Accounting Manual 2013
108 © For Suggestions & Feedbacks, contact: ATAUSH SHAFI ([email protected])
UNCERTAINTY TO CERTAINTYUNCERTAINTY TO CERTAINTYUNCERTAINTY TO CERTAINTYUNCERTAINTY TO CERTAINTY
Formula for Certainty Equivalents : Uncertainty figure * probability
700000 * 5% 75000
500000 * 70% 350000
200000 * 25% 25000
450000
EOQ VS EBQEOQ VS EBQEOQ VS EBQEOQ VS EBQ
EOQ EBQ
Annual Demand Annual production
Carrying cost Variable manufacturing cost per unit
CC% CC%
Ordering cost Set up cost per order
Reference to Raw Material Reference to Finished Goods
FREE STOCK BALANCEFREE STOCK BALANCEFREE STOCK BALANCEFREE STOCK BALANCE
Physical stock XXX
Add – Outstanding purchase order XXX
Less – Unfulfilled share requisition (XXX)
XXX
DANGER LEVELDANGER LEVELDANGER LEVELDANGER LEVEL
1. Point below safety stock.
2. Represent limit at which emergency steps must be taken e.g. sending a man
personally to bring the required material.
COST OF PREDICTION ERRORCOST OF PREDICTION ERRORCOST OF PREDICTION ERRORCOST OF PREDICTION ERROR
EXISTING NEW
Ordering Cost AR * OC / EOQ AR * new OC / old EOQ
Carrying Cost CC * I * PU * EOQ / 2 CC * I * PU * old EOQ / 2
XXX XXX
SAVINGS Difference of Existing & New

Cost Accounting Manual 2013
109 © For Suggestions & Feedbacks, contact: ATAUSH SHAFI ([email protected])
OTHER TYPES OF BEPOTHER TYPES OF BEPOTHER TYPES OF BEPOTHER TYPES OF BEP
Cash BEP In the Cash BEP, fixed cost taken at cash cost (only Cash cost). No
non cash item will be considered. E.g. Depreciation, Amortization
etc. Also called “Out of pocket fixed cost”. This BEP is used in slack
period for short time.
Composite BEP
(Overall BEP)
BEP in case of two or more than two products combined BEP for
one company.
Question:
Particulars Unit A Unit B
Sales Rs. 20 Rs. 45
Variable cost Rs. 15 Rs. 30
Contribution Rs. 05 Rs. 15
Sales mix 6000 Unit 4000 Unit
P/V Ratio 1/4 1/3
Product A and B sales different product at different price and
product have different cost and different sales mix. Required to find
combined BEP of company in Amount when fixed cost =360,000?
Answer:
IN UNIT RATIO – Avg. contribution per unit
(5*6 + 15*4)/10 = Rs. 9 per combo unit
360,000/9 = 40,000 units
A: 40000/10 * 6 = 24000, B: 40000/10 * 4 = 16000
IN SALES RATIO – Avg. P/V ratio per unit
(5*6 + 15*4)/(20*6 + 45*4) = 30%
360,000/30% = 1200,000
BEP in case of
opening stock
Question: Opening stock 6000 Unit @ Rs.10.00 (VC at 60%) =
60,000
Production 44000 Unit @ (fixed cost = 187000) = 484,000
Selling Price = Rs.10.50 in current year.
Answer:
Particulars Total Cost Variable cost Per U. Fixed cost
Opening stock 60,000 36,000 6.00 Not tr. In this
year
Produce units 484,000 297,000 6.75 187,000
Contribution required for absorption of fixed cost = Rs. 187,000
Contribution earn by opening units 6,000 *(10.5-6) = Rs. 27,000
Balance contribution = Rs. 160,000
= 160,000/3.75 = 42,667
= Total sale of units = 6,000+42,667 = 48,667.
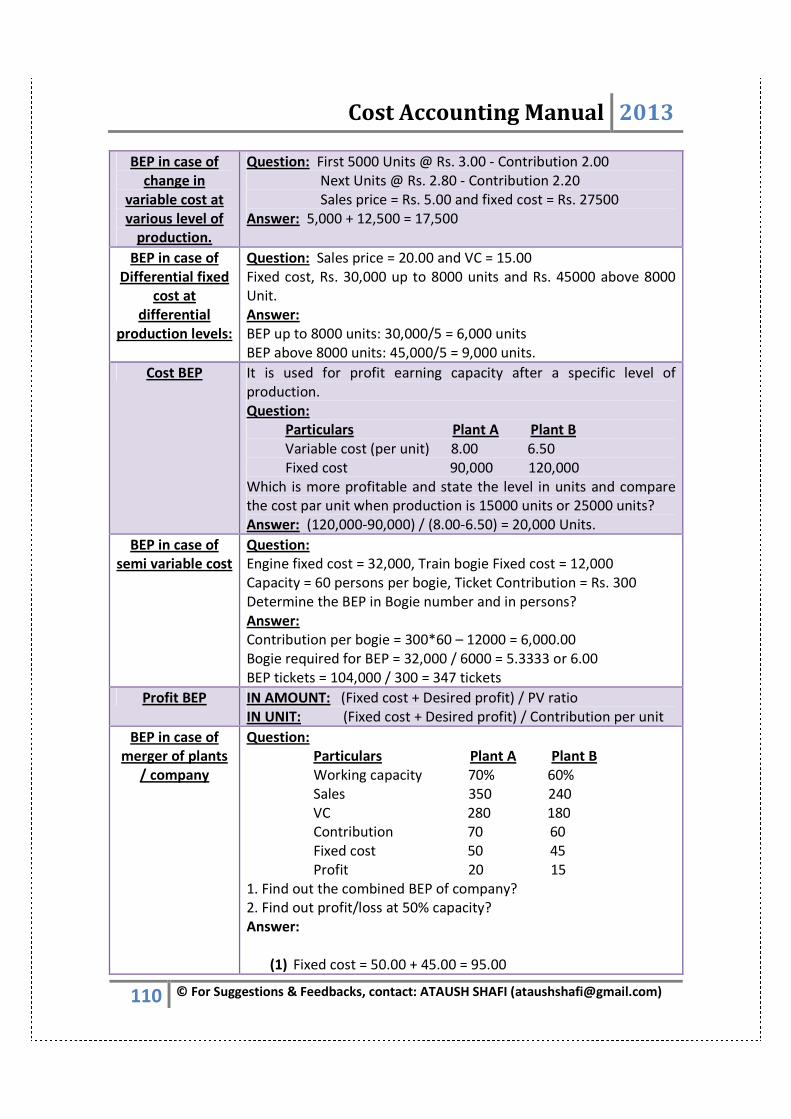
Cost Accounting Manual 2013
110 © For Suggestions & Feedbacks, contact: ATAUSH SHAFI ([email protected])
BEP in case of
change in
variable cost at
various level of
production.
Question: First 5000 Units @ Rs. 3.00 - Contribution 2.00
Next Units @ Rs. 2.80 - Contribution 2.20
Sales price = Rs. 5.00 and fixed cost = Rs. 27500
Answer: 5,000 + 12,500 = 17,500
BEP in case of
Differential fixed
cost at
differential
production levels:
Question: Sales price = 20.00 and VC = 15.00
Fixed cost, Rs. 30,000 up to 8000 units and Rs. 45000 above 8000
Unit.
Answer:
BEP up to 8000 units: 30,000/5 = 6,000 units
BEP above 8000 units: 45,000/5 = 9,000 units.
Cost BEP It is used for profit earning capacity after a specific level of
production.
Question:
Particulars Plant A Plant B
Variable cost (per unit) 8.00 6.50
Fixed cost 90,000 120,000
Which is more profitable and state the level in units and compare
the cost par unit when production is 15000 units or 25000 units?
Answer: (120,000-90,000) / (8.00-6.50) = 20,000 Units.
BEP in case of
semi variable cost
Question:
Engine fixed cost = 32,000, Train bogie Fixed cost = 12,000
Capacity = 60 persons per bogie, Ticket Contribution = Rs. 300
Determine the BEP in Bogie number and in persons?
Answer:
Contribution per bogie = 300*60 – 12000 = 6,000.00
Bogie required for BEP = 32,000 / 6000 = 5.3333 or 6.00
BEP tickets = 104,000 / 300 = 347 tickets
Profit BEP IN AMOUNT: (Fixed cost + Desired profit) / PV ratio
IN UNIT: (Fixed cost + Desired profit) / Contribution per unit
BEP in case of
merger of plants
/ company
Question:
Particulars Plant A Plant B
Working capacity 70% 60%
Sales 350 240
VC 280 180
Contribution 70 60
Fixed cost 50 45
Profit 20 15
1. Find out the combined BEP of company?
2. Find out profit/loss at 50% capacity?
Answer:
(1) Fixed cost = 50.00 + 45.00 = 95.00
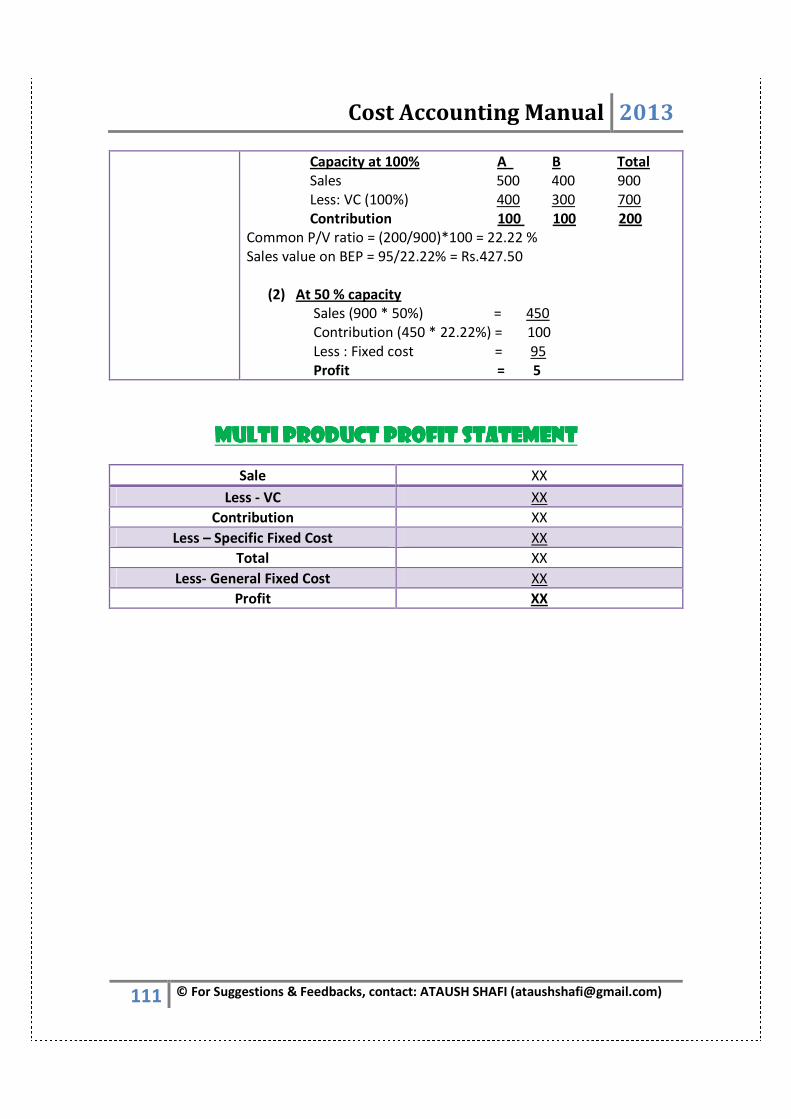
Cost Accounting Manual 2013
111 © For Suggestions & Feedbacks, contact: ATAUSH SHAFI ([email protected])
Capacity at 100% A B Total
Sales 500 400 900
Less: VC (100%) 400 300 700
Contribution 100 100 200
Common P/V ratio = (200/900)*100 = 22.22 %
Sales value on BEP = 95/22.22% = Rs.427.50
(2) At 50 % capacity
Sales (900 * 50%) = 450
Contribution (450 * 22.22%) = 100
Less : Fixed cost = 95
Profit = 5
MULTI PRODUCT PROFIT STATEMENTMULTI PRODUCT PROFIT STATEMENTMULTI PRODUCT PROFIT STATEMENTMULTI PRODUCT PROFIT STATEMENT
Sale XX
Less - VC XX
Contribution XX
Less – Specific Fixed Cost XX
Total XX
Less- General Fixed Cost XX
Profit XX
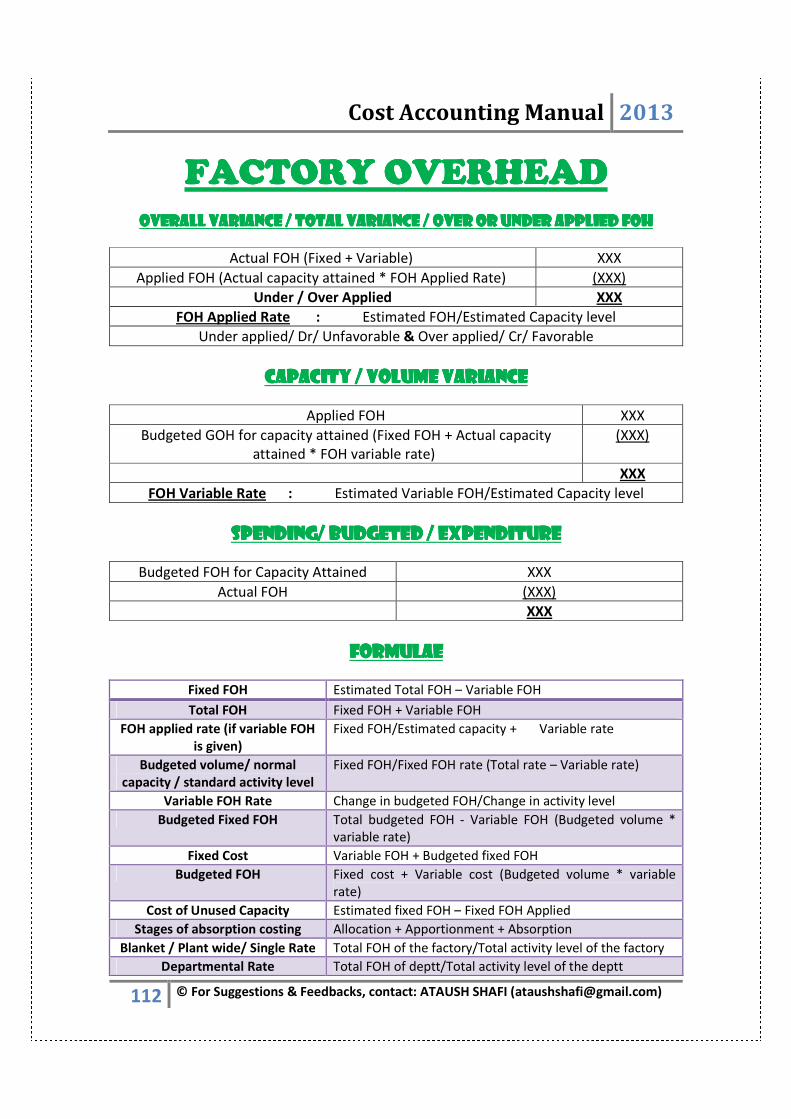
Cost Accounting Manual 2013
112 © For Suggestions & Feedbacks, contact: ATAUSH SHAFI ([email protected])
FACTORY OVERHEADFACTORY OVERHEADFACTORY OVERHEADFACTORY OVERHEAD
OVERALL VARIANCE / TOTAL VARIANCE / OVER OR UNDER APPLIED FOHOVERALL VARIANCE / TOTAL VARIANCE / OVER OR UNDER APPLIED FOHOVERALL VARIANCE / TOTAL VARIANCE / OVER OR UNDER APPLIED FOHOVERALL VARIANCE / TOTAL VARIANCE / OVER OR UNDER APPLIED FOH
Actual FOH (Fixed + Variable) XXX
Applied FOH (Actual capacity attained * FOH Applied Rate) (XXX)
Under / Over Applied XXX
FOH Applied Rate : Estimated FOH/Estimated Capacity level
Under applied/ Dr/ Unfavorable & Over applied/ Cr/ Favorable
CAPACITY / VOLUME VARIANCECAPACITY / VOLUME VARIANCECAPACITY / VOLUME VARIANCECAPACITY / VOLUME VARIANCE
Applied FOH XXX
Budgeted GOH for capacity attained (Fixed FOH + Actual capacity
attained * FOH variable rate)
(XXX)
XXX
FOH Variable Rate : Estimated Variable FOH/Estimated Capacity level
SPENDING/ BUDGETED / EXPENDITURESPENDING/ BUDGETED / EXPENDITURESPENDING/ BUDGETED / EXPENDITURESPENDING/ BUDGETED / EXPENDITURE
Budgeted FOH for Capacity Attained XXX
Actual FOH (XXX)
XXX
FORMULAEFORMULAEFORMULAEFORMULAE
Fixed FOH Estimated Total FOH – Variable FOH
Total FOH Fixed FOH + Variable FOH
FOH applied rate (if variable FOH
is given)
Fixed FOH/Estimated capacity + Variable rate
Budgeted volume/ normal
capacity / standard activity level
Fixed FOH/Fixed FOH rate (Total rate – Variable rate)
Variable FOH Rate Change in budgeted FOH/Change in activity level
Budgeted Fixed FOH Total budgeted FOH - Variable FOH (Budgeted volume *
variable rate)
Fixed Cost Variable FOH + Budgeted fixed FOH
Budgeted FOH Fixed cost + Variable cost (Budgeted volume * variable
rate)
Cost of Unused Capacity Estimated fixed FOH – Fixed FOH Applied
Stages of absorption costing Allocation + Apportionment + Absorption
Blanket / Plant wide/ Single Rate Total FOH of the factory/Total activity level of the factory
Departmental Rate Total FOH of deptt/Total activity level of the deptt
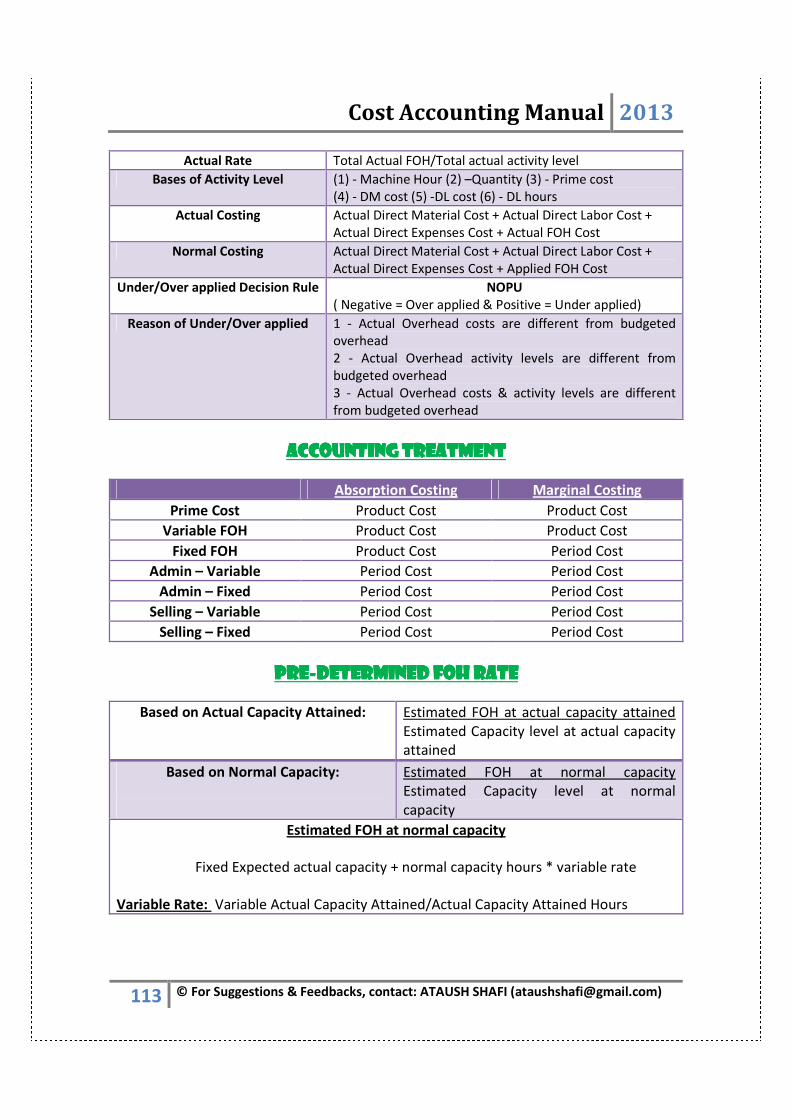
Cost Accounting Manual 2013
113 © For Suggestions & Feedbacks, contact: ATAUSH SHAFI ([email protected])
Actual Rate Total Actual FOH/Total actual activity level
Bases of Activity Level (1) - Machine Hour (2) –Quantity (3) - Prime cost
(4) - DM cost (5) -DL cost (6) - DL hours
Actual Costing Actual Direct Material Cost + Actual Direct Labor Cost +
Actual Direct Expenses Cost + Actual FOH Cost
Normal Costing Actual Direct Material Cost + Actual Direct Labor Cost +
Actual Direct Expenses Cost + Applied FOH Cost
Under/Over applied Decision Rule NOPU
( Negative = Over applied & Positive = Under applied)
Reason of Under/Over applied 1 - Actual Overhead costs are different from budgeted
overhead
2 - Actual Overhead activity levels are different from
budgeted overhead
3 - Actual Overhead costs & activity levels are different
from budgeted overhead
ACCOUNTING TREATMENTACCOUNTING TREATMENTACCOUNTING TREATMENTACCOUNTING TREATMENT
Absorption Costing Marginal Costing
Prime Cost Product Cost Product Cost
Variable FOH Product Cost Product Cost
Fixed FOH Product Cost Period Cost
Admin – Variable Period Cost Period Cost
Admin – Fixed Period Cost Period Cost
Selling – Variable Period Cost Period Cost
Selling – Fixed Period Cost Period Cost
PREPREPREPRE----DETERMINED FOH RATEDETERMINED FOH RATEDETERMINED FOH RATEDETERMINED FOH RATE
Based on Actual Capacity Attained:
Estimated FOH at actual capacity attained
Estimated Capacity level at actual capacity
attained
Based on Normal Capacity:
Estimated FOH at normal capacity
Estimated Capacity level at normal
capacity
Estimated FOH at normal capacity
Fixed Expected actual capacity + normal capacity hours * variable rate
Variable Rate: Variable Actual Capacity Attained/Actual Capacity Attained Hours
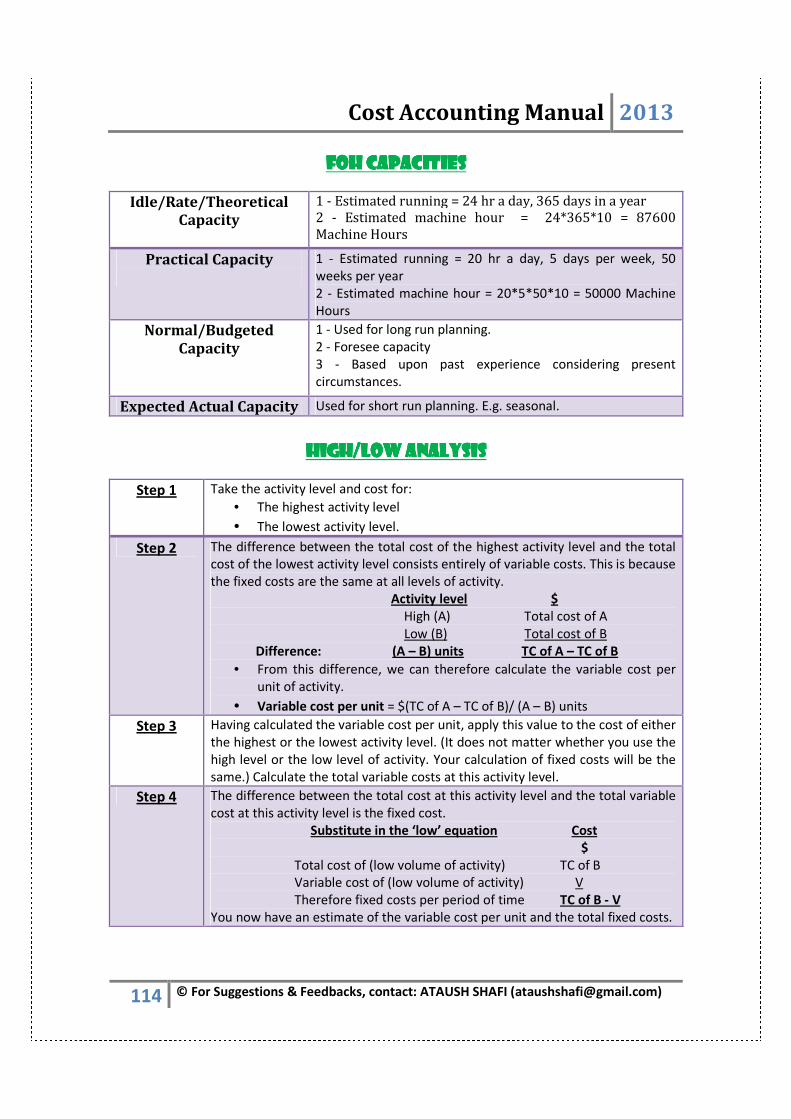
Cost Accounting Manual 2013
114 © For Suggestions & Feedbacks, contact: ATAUSH SHAFI ([email protected])
FOHFOHFOHFOH CAPACCAPACCAPACCAPACITIESITIESITIESITIES
Idle/Rate/Theoretical
Capacity
1 - Estimated running = 24 hr a day, 365 days in a year
2 - Estimated machine hour = 24*365*10 = 87600
Machine Hours
Practical Capacity
1 - Estimated running = 20 hr a day, 5 days per week, 50
weeks per year
2 - Estimated machine hour = 20*5*50*10 = 50000 Machine
Hours
Normal/Budgeted
Capacity
1 - Used for long run planning.
2 - Foresee capacity
3 - Based upon past experience considering present
circumstances.
Expected Actual Capacity Used for short run planning. E.g. seasonal.
HIGH/LOW ANALYSISHIGH/LOW ANALYSISHIGH/LOW ANALYSISHIGH/LOW ANALYSIS
Step 1 Take the activity level and cost for:
• The highest activity level
• The lowest activity level.
Step 2 The difference between the total cost of the highest activity level and the total
cost of the lowest activity level consists entirely of variable costs. This is because
the fixed costs are the same at all levels of activity.
Activity level $
High (A) Total cost of A
Low (B) Total cost of B
Difference: (A – B) units TC of A – TC of B
• From this difference, we can therefore calculate the variable cost per
unit of activity.
• Variable cost per unit = $(TC of A – TC of B)/ (A – B) units
Step 3 Having calculated the variable cost per unit, apply this value to the cost of either
the highest or the lowest activity level. (It does not matter whether you use the
high level or the low level of activity. Your calculation of fixed costs will be the
same.) Calculate the total variable costs at this activity level.
Step 4 The difference between the total cost at this activity level and the total variable
cost at this activity level is the fixed cost.
Substitute in the ‘low’ equation Cost
$
Total cost of (low volume of activity) TC of B
Variable cost of (low volume of activity) V
Therefore fixed costs per period of time TC of B - V
You now have an estimate of the variable cost per unit and the total fixed costs.
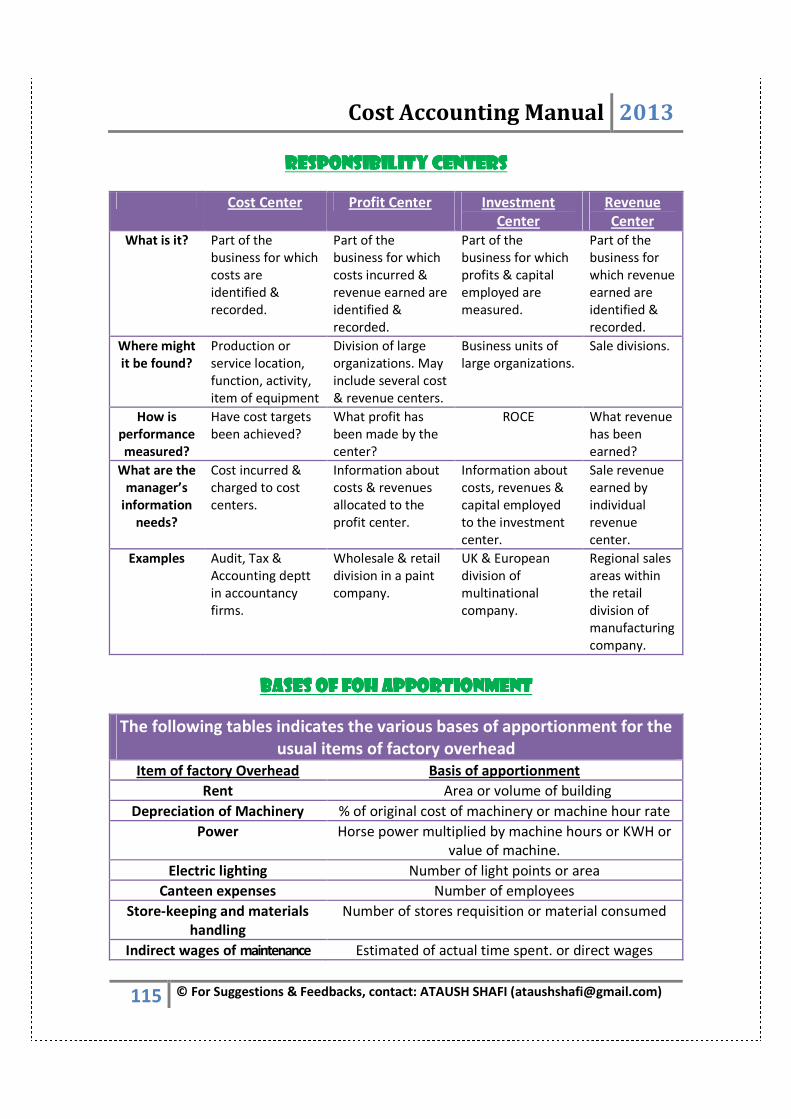
Cost Accounting Manual 2013
115 © For Suggestions & Feedbacks, contact: ATAUSH SHAFI ([email protected])
RESPONSIBILITY CENTERSRESPONSIBILITY CENTERSRESPONSIBILITY CENTERSRESPONSIBILITY CENTERS
Cost Center Profit Center Investment
Center
Revenue
Center
What is it? Part of the
business for which
costs are
identified &
recorded.
Part of the
business for which
costs incurred &
revenue earned are
identified &
recorded.
Part of the
business for which
profits & capital
employed are
measured.
Part of the
business for
which revenue
earned are
identified &
recorded.
Where might
it be found?
Production or
service location,
function, activity,
item of equipment
Division of large
organizations. May
include several cost
& revenue centers.
Business units of
large organizations.
Sale divisions.
How is
performance
measured?
Have cost targets
been achieved?
What profit has
been made by the
center?
ROCE What revenue
has been
earned?
What are the
manager’s
information
needs?
Cost incurred &
charged to cost
centers.
Information about
costs & revenues
allocated to the
profit center.
Information about
costs, revenues &
capital employed
to the investment
center.
Sale revenue
earned by
individual
revenue
center.
Examples
Audit, Tax &
Accounting deptt
in accountancy
firms.
Wholesale & retail
division in a paint
company.
UK & European
division of
multinational
company.
Regional sales
areas within
the retail
division of
manufacturing
company.
BASES OF FOH APPORTIONMENTBASES OF FOH APPORTIONMENTBASES OF FOH APPORTIONMENTBASES OF FOH APPORTIONMENT
The following tables indicates the various bases of apportionment for the
usual items of factory overhead
Item of factory Overhead Basis of apportionment
Rent Area or volume of building
Depreciation of Machinery % of original cost of machinery or machine hour rate
Power Horse power multiplied by machine hours or KWH or
value of machine.
Electric lighting Number of light points or area
Canteen expenses Number of employees
Store-keeping and materials
handling
Number of stores requisition or material consumed
Indirect wages of maintenance Estimated of actual time spent. or direct wages
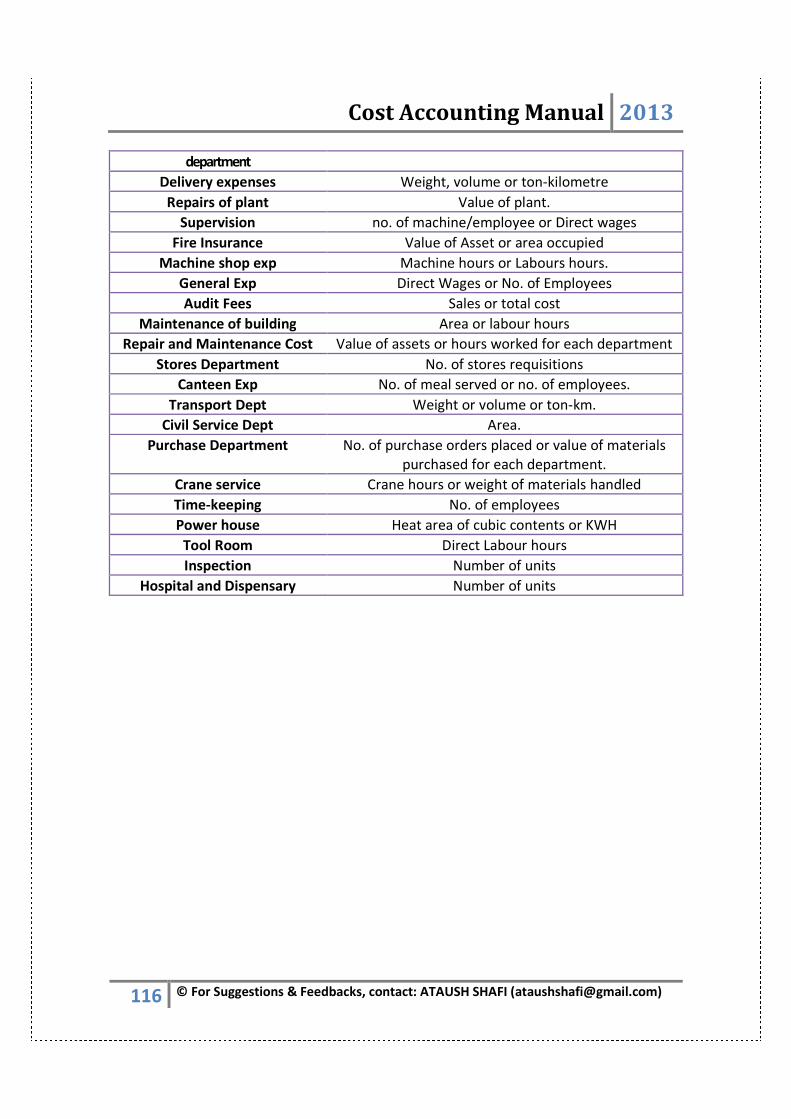
Cost Accounting Manual 2013
116 © For Suggestions & Feedbacks, contact: ATAUSH SHAFI ([email protected])
department
Delivery expenses Weight, volume or ton-kilometre
Repairs of plant Value of plant.
Supervision no. of machine/employee or Direct wages
Fire Insurance Value of Asset or area occupied
Machine shop exp Machine hours or Labours hours.
General Exp Direct Wages or No. of Employees
Audit Fees Sales or total cost
Maintenance of building Area or labour hours
Repair and Maintenance Cost Value of assets or hours worked for each department
Stores Department No. of stores requisitions
Canteen Exp No. of meal served or no. of employees.
Transport Dept Weight or volume or ton-km.
Civil Service Dept Area.
Purchase Department No. of purchase orders placed or value of materials
purchased for each department.
Crane service Crane hours or weight of materials handled
Time-keeping No. of employees
Power house Heat area of cubic contents or KWH
Tool Room Direct Labour hours
Inspection Number of units
Hospital and Dispensary Number of units

Cost Accounting Manual 2013
117 © For Suggestions & Feedbacks, contact: ATAUSH SHAFI ([email protected])
BREAK EVEN ANALYSIS BREAK EVEN ANALYSIS BREAK EVEN ANALYSIS BREAK EVEN ANALYSIS
FORMULAEFORMULAEFORMULAEFORMULAE
Breakeven point Fixed Cost/C/M Ratio (Contribution Margin Ratio)
• C/M Ratio = Contribution / Sales * 100
OR
Fixed Cost
1 – Variable cost / Sales
OR
Fixed Cost
Contribution per unit (S.P. Per Unit – V.C. Per Unit)
IN VALUES
Fixed Cost
C/M Ratio (Contribution Margin Ratio)
• C/M Ratio = Contribution / Sales * 100
• Contribution Margin= Contribution Sale - Profit
Volume.
In opening stock
Units from opening stock + (total fixed cost – total contribution
from opening stock/Current Contribution per unit)
Contribution margin Sale – Variable Expense
Profit computation (Sale * C/M Ratio) – Fixed Cost
New fixed cost Sale - {C/M – (Margin of safety * C/M)}
Old fixed cost (Sale – (100 – Margin of safety) * C/M Ratio
Variable expenses (1 -- C/M Ratio) * Sales
Contribution margin ratio Contribution * 100
Sales
OR
Change in Profit * 100
Change in Sales
OR
Change in Contribution * 100
Change in Sale
OR
Change in Total Cost * 100
Change in Sale
OR
Sale – Variable Expense * 100
Sales
Decision Clue =
Higher the C/M ratio → more will be the profit.
Lower the C/M ratio → lower will be the profit.
Sale projection Fixed Cost + Profit (Loss) Projection
C/M Ratio (Contribution Margin Ratio)
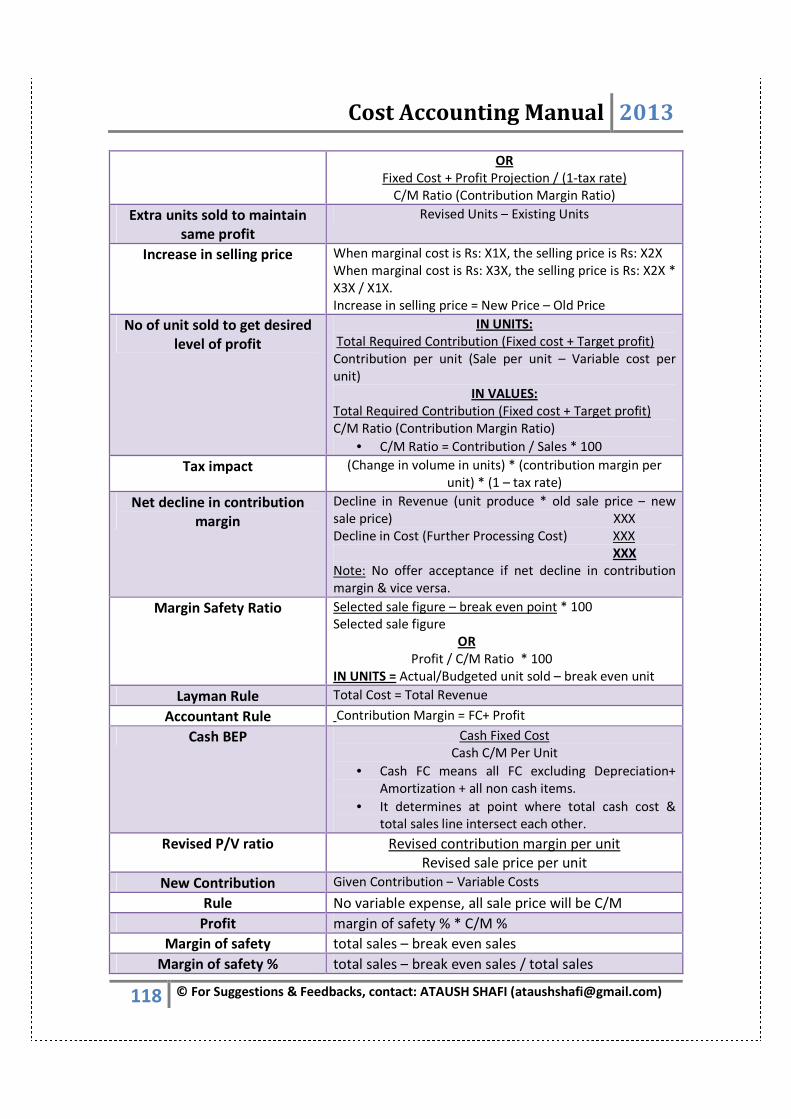
Cost Accounting Manual 2013
118 © For Suggestions & Feedbacks, contact: ATAUSH SHAFI ([email protected])
OR
Fixed Cost + Profit Projection / (1-tax rate)
C/M Ratio (Contribution Margin Ratio)
Extra units sold to maintain
same profit
Revised Units – Existing Units
Increase in selling price When marginal cost is Rs: X1X, the selling price is Rs: X2X
When marginal cost is Rs: X3X, the selling price is Rs: X2X *
X3X / X1X.
Increase in selling price = New Price – Old Price
No of unit sold to get desired
level of profit
IN UNITS:
Total Required Contribution (Fixed cost + Target profit)
Contribution per unit (Sale per unit – Variable cost per
unit)
IN VALUES:
Total Required Contribution (Fixed cost + Target profit)
C/M Ratio (Contribution Margin Ratio)
• C/M Ratio = Contribution / Sales * 100
Tax impact (Change in volume in units) * (contribution margin per
unit) * (1 – tax rate)
Net decline in contribution
margin
Decline in Revenue (unit produce * old sale price – new
sale price) XXX
Decline in Cost (Further Processing Cost) XXX
XXX
Note: No offer acceptance if net decline in contribution
margin & vice versa.
Margin Safety Ratio
Selected sale figure – break even point * 100
Selected sale figure
OR
Profit / C/M Ratio * 100
IN UNITS = Actual/Budgeted unit sold – break even unit
Layman Rule Total Cost = Total Revenue
Accountant Rule Contribution Margin = FC+ Profit
Cash BEP Cash Fixed Cost
Cash C/M Per Unit
• Cash FC means all FC excluding Depreciation+
Amortization + all non cash items.
• It determines at point where total cash cost &
total sales line intersect each other.
Revised P/V ratio Revised contribution margin per unit
Revised sale price per unit
New Contribution Given Contribution – Variable Costs
Rule No variable expense, all sale price will be C/M
Profit margin of safety % * C/M %
Margin of safety total sales – break even sales
Margin of safety % total sales – break even sales / total sales

Cost Accounting Manual 2013
119 © For Suggestions & Feedbacks, contact: ATAUSH SHAFI ([email protected])
Total sales Margin of safety profit
Profit Sales * margin of safety % * C/M %
Required Contribution Fixed Cost + Target Profit – Target Loss – Donation –
Shut down
Margin of Safety Profit
C/M %
OR
Profit
C/M Per Unit
Sale Price Fixed Cost/Unit + Variable Cost Per Unit
At Break Even Level Sale – VC – FC = Profit OR
Sale = VC + FC + Profit
Target Profit Sale = VC + FC + Profit
Cost Break even point It is the production level at which production cost is
same irrespective of the alternative adopted.
Cost B.E.P. = Difference in fixed costs
Difference in variable costs
Tax Impact Before (Divide) = After Tax Income/1-t
After (Multiply) = Before Tax * (1-t)
Sale * C/M ratio = FC + Profit
Break even sale * C/M ratio = FC – Break even sales
Profitability Contribution / key factor
Contribution / key factor Annual production / Install capacity
(Break even sale + M/S ratio) * C/M ratio = Contribution
(Break even sale + C/M ratio) * (M/S ratio * C/M ratio) = FC + Profit
BEP Sales ( % ) + MOS Sales ( % ) = 100 %
Contribution at BEP = Fixed cost
Contribution at MOS = Profit
Contribution on BEP + Contribution on MOS = Total Contribution
Fixed Cost = BEP Sales * PV Ratio
Profit = MOS sales * PV Ratio
Variable cost = per unit cost is constant but change in total amount.
Fixed cost = Change in per unit cost but total cost are constant.
Semi variable Cost = It is Combination of Variable cost and fixed cost.
If sales price constant than variable cost change in same ratio to sales changes.
If sales price is change but sales Qty is same than Variable cost also constant but only
change in P/V Ratio.
Question say find out increase in sales price to req. BEP at ….% Than % increase in Sales
price = (Current BEP – Revised BEP) / Revised BEP
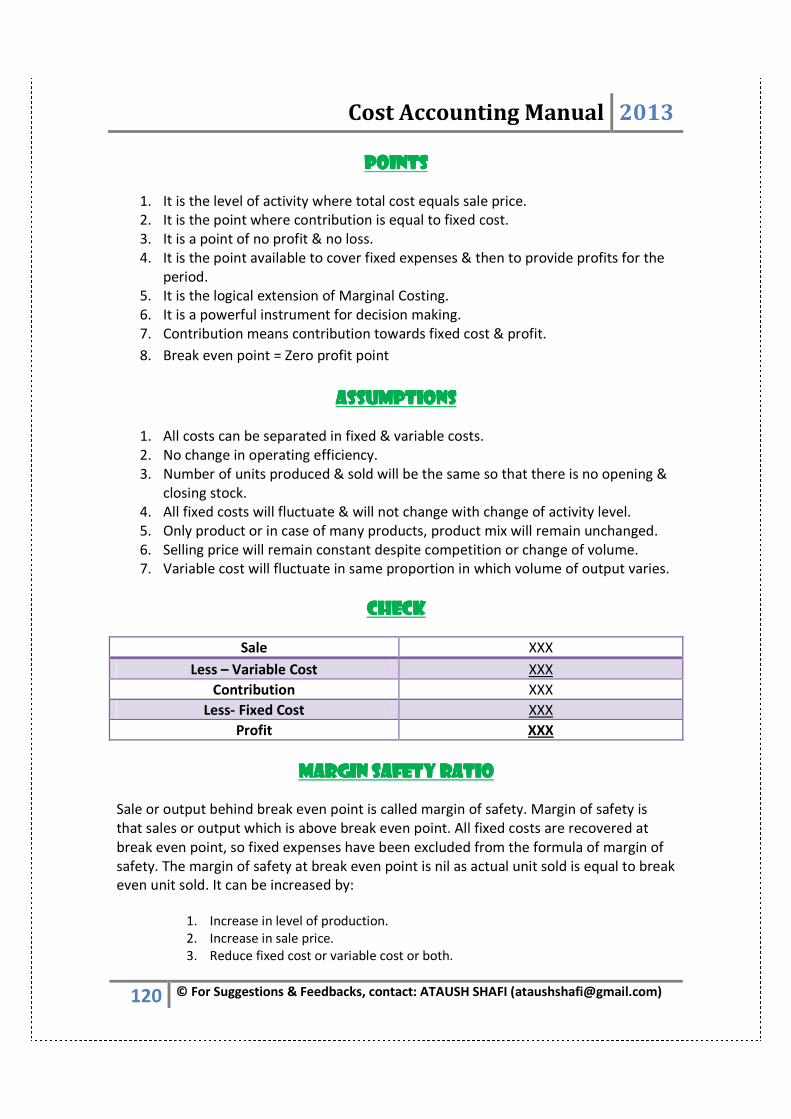
Cost Accounting Manual 2013
120 © For Suggestions & Feedbacks, contact: ATAUSH SHAFI ([email protected])
POINTSPOINTSPOINTSPOINTS
1. It is the level of activity where total cost equals sale price.
2. It is the point where contribution is equal to fixed cost.
3. It is a point of no profit & no loss.
4. It is the point available to cover fixed expenses & then to provide profits for the
period.
5. It is the logical extension of Marginal Costing.
6. It is a powerful instrument for decision making.
7. Contribution means contribution towards fixed cost & profit.
8. Break even point = Zero profit point
ASSUMPTIONSASSUMPTIONSASSUMPTIONSASSUMPTIONS
1. All costs can be separated in fixed & variable costs.
2. No change in operating efficiency.
3. Number of units produced & sold will be the same so that there is no opening &
closing stock.
4. All fixed costs will fluctuate & will not change with change of activity level.
5. Only product or in case of many products, product mix will remain unchanged.
6. Selling price will remain constant despite competition or change of volume.
7. Variable cost will fluctuate in same proportion in which volume of output varies.
CHECKCHECKCHECKCHECK
Sale XXX
Less – Variable Cost XXX
Contribution XXX
Less- Fixed Cost XXX
Profit XXX
MARGIN SAFETY RATIOMARGIN SAFETY RATIOMARGIN SAFETY RATIOMARGIN SAFETY RATIO
Sale or output behind break even point is called margin of safety. Margin of safety is
that sales or output which is above break even point. All fixed costs are recovered at
break even point, so fixed expenses have been excluded from the formula of margin of
safety. The margin of safety at break even point is nil as actual unit sold is equal to break
even unit sold. It can be increased by:
1. Increase in level of production.
2. Increase in sale price.
3. Reduce fixed cost or variable cost or both.
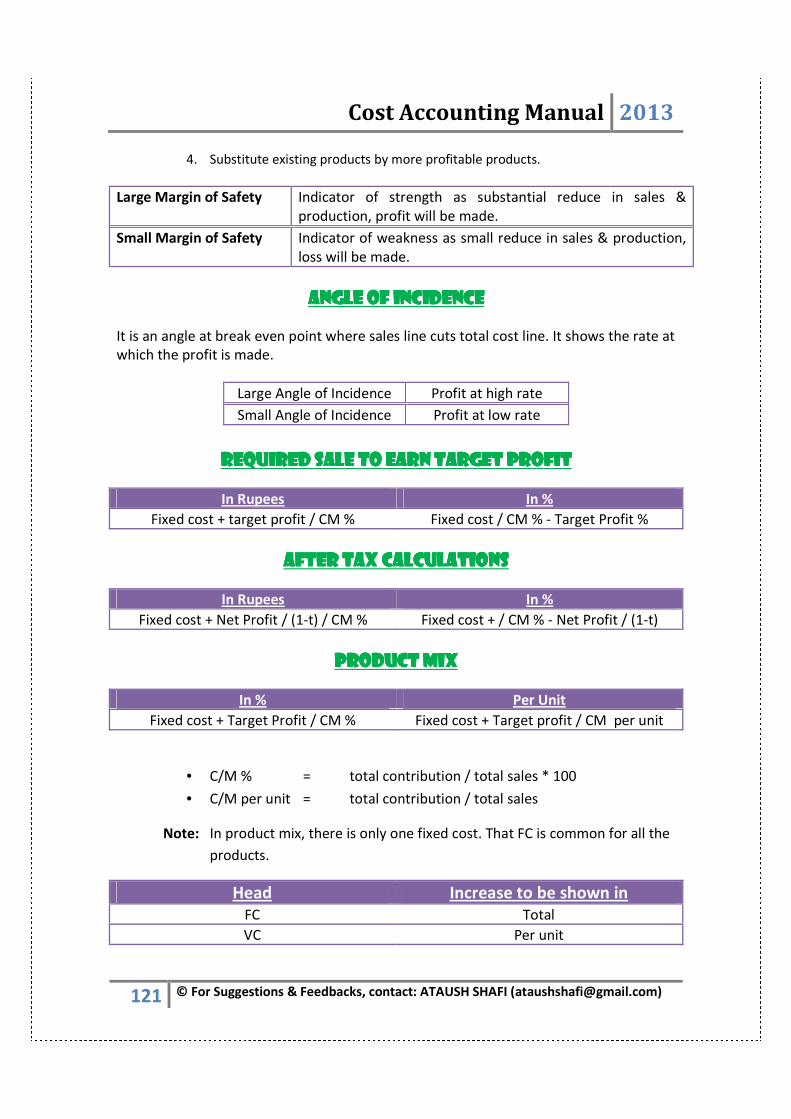
Cost Accounting Manual 2013
121 © For Suggestions & Feedbacks, contact: ATAUSH SHAFI ([email protected])
4. Substitute existing products by more profitable products.
Large Margin of Safety Indicator of strength as substantial reduce in sales &
production, profit will be made.
Small Margin of Safety Indicator of weakness as small reduce in sales & production,
loss will be made.
ANGLE OF INCIDENCEANGLE OF INCIDENCEANGLE OF INCIDENCEANGLE OF INCIDENCE
It is an angle at break even point where sales line cuts total cost line. It shows the rate at
which the profit is made.
Large Angle of Incidence Profit at high rate
Small Angle of Incidence Profit at low rate
REQUIRED SALE TO EARN TARGET PROFITREQUIRED SALE TO EARN TARGET PROFITREQUIRED SALE TO EARN TARGET PROFITREQUIRED SALE TO EARN TARGET PROFIT
In Rupees In %
Fixed cost + target profit / CM % Fixed cost / CM % - Target Profit %
AFTER TAX CALCULATIONSAFTER TAX CALCULATIONSAFTER TAX CALCULATIONSAFTER TAX CALCULATIONS
In Rupees In %
Fixed cost + Net Profit / (1-t) / CM % Fixed cost + / CM % - Net Profit / (1-t)
PRODUCT MIXPRODUCT MIXPRODUCT MIXPRODUCT MIX
In % Per Unit
Fixed cost + Target Profit / CM % Fixed cost + Target profit / CM per unit
• C/M % = total contribution / total sales * 100
• C/M per unit = total contribution / total sales
Note: In product mix, there is only one fixed cost. That FC is common for all the
products.
Head Increase to be shown in
FC Total
VC Per unit

Cost Accounting Manual 2013
122 © For Suggestions & Feedbacks, contact: ATAUSH SHAFI ([email protected])
REQUIRED SALESREQUIRED SALESREQUIRED SALESREQUIRED SALES
Fixed Cost + Target Profit XXX
Less - X & Y Contribution (Demand*Contribution Per Unit) (XXX)
Z’s Contribution XXX
Divided By
Per Unit contribution of Z’s XXX
Required sales XXX
ACCOUNTANT VS ECONOMISTACCOUNTANT VS ECONOMISTACCOUNTANT VS ECONOMISTACCOUNTANT VS ECONOMIST
ACCOUNTANT ECONOMIST One BEP Two BEP
Total Cost is straight line Total Cost is not a straight line
(first reduce & then climb as per law of
diminishing return)
Revenue Line is straight line Revenue Line is not straight line
(less steep to depict the need to give
discount to achieve higher sale volume)
Fixed Cost is straight line -
Ignore economies / diseconomies of scale,
elasticity of demand; discount to secure
increase in volume.
Recognize economies / diseconomies of
scale.
Break even time = sale = FC + VC Break even time = Average revenue =
Average cost
Use is limited to area within relevant
range.
-
Difficult to make chart when step FC
occurs.
-
- To increase sale, price reductions have to
be offered & as output increase, marginal
cost of additional production increases.
- Economist argues that accountant
distinction between FC & VC is unrealistic.
In reality, whether cost is fixed or variable
depends on time frame taken.
- Break even point is intersection of line
representing two functions

Cost Accounting Manual 2013
123 © For Suggestions & Feedbacks, contact: ATAUSH SHAFI ([email protected])
BREAKEVEN CHART STEPSBREAKEVEN CHART STEPSBREAKEVEN CHART STEPSBREAKEVEN CHART STEPS
Step: 1 Select appropriate scales for the axes and draw and label them. Put the
extremes of the axes right at the end of the available space. The furthest point on the
vertical axis will be the monthly sales revenue, that is, 1, 700 units * Rs: 50 = Rs: 85,000
The furthest point on the horizontal axis will be monthly sales volume of 1,700 units.
Make sure that you do not need to read data for volumes higher than 1,700 units before
you set these extremes for your scales.
Step: 2 Draw the fixed cost line and label it. This will be a straight line parallel to
the horizontal axis at the Rs: 20,000 levels. The Rs: 20,000 fixed costs are incurred in
the short term even with zero activity.
Step: 3 Draw the total cost line and label it. The best way to do this is to
calculate the total costs for the maximum sales level, which is 1,700 units in our
example. Mark this point on the graph and join it to the cost incurred at zero activity,
that is, Rs: 20,000
Rs:
Variable costs for 1,700 units (1,700 * Rs: 30) 51,000
Fixed costs 20,000
Total cost for 1,700 units 71,000
Step: 4 Draw the revenue line and label it. Once again the best way is to plot the
extreme points. The revenue at maximum activity in our example is 1,700 * Rs: 50 = Rs:
85,000. This point can be joined to the origin, since at zero activity there will be no sales
revenue.
Step: 5 Mark any required information on the chart and read off solutions as
required.
Check that your chart is accurate by reading off the measures that we have already
calculated the breakeven point, the margin of safety, the profit for sales of 1,700 units.
Step: 6 Check the accuracy of your readings using arithmetic. It is always good
examination practice to check the accuracy of your answers and make adjustments for
any errors in your chart (if you have time!)
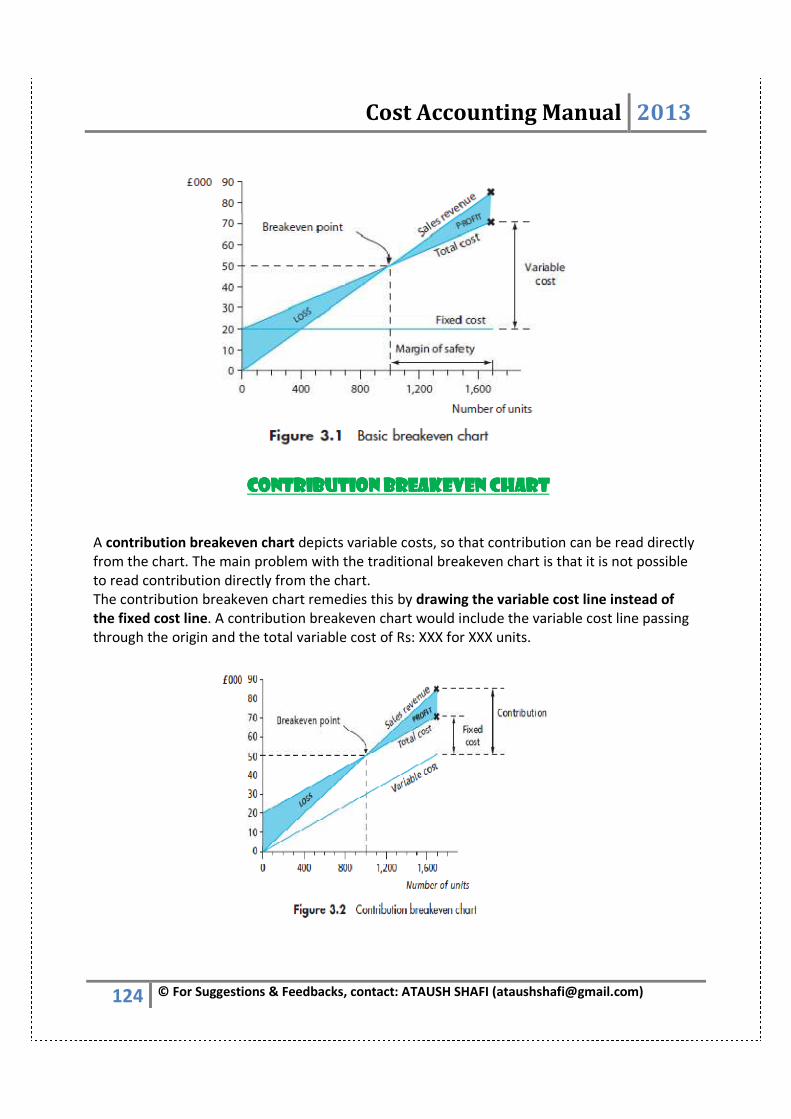
Cost Accounting Manual 2013
124 © For Suggestions & Feedbacks, contact: ATAUSH SHAFI ([email protected])
CONTRIBUTION CONTRIBUTION CONTRIBUTION CONTRIBUTION BREAKEVEN CHARTBREAKEVEN CHARTBREAKEVEN CHARTBREAKEVEN CHART
A contribution breakeven chart depicts variable costs, so that contribution can be read directly
from the chart. The main problem with the traditional breakeven chart is that it is not possible
to read contribution directly from the chart.
The contribution breakeven chart remedies this by drawing the variable cost line instead of
the fixed cost line. A contribution breakeven chart would include the variable cost line passing
through the origin and the total variable cost of Rs: XXX for XXX units.
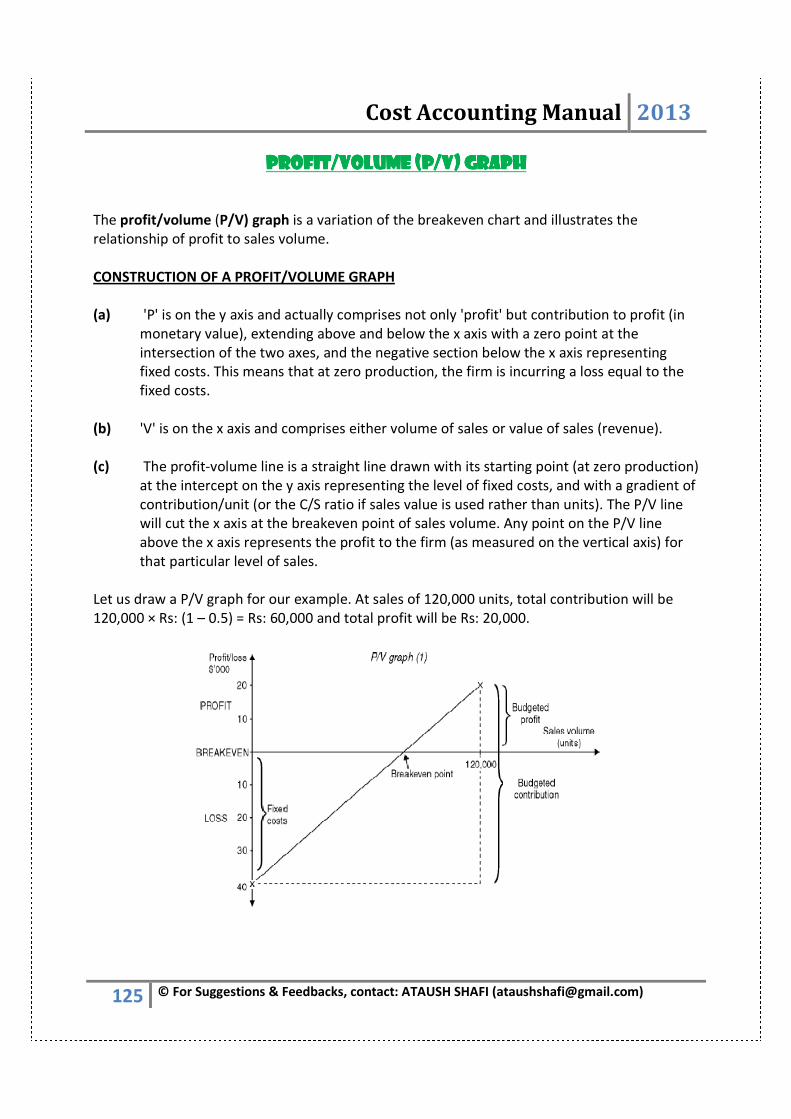
Cost Accounting Manual 2013
125 © For Suggestions & Feedbacks, contact: ATAUSH SHAFI ([email protected])
PROFIT/VOLUME (P/V) GRAPHPROFIT/VOLUME (P/V) GRAPHPROFIT/VOLUME (P/V) GRAPHPROFIT/VOLUME (P/V) GRAPH
The profit/volume (P/V) graph is a variation of the breakeven chart and illustrates the
relationship of profit to sales volume.
CONSTRUCTION OF A PROFIT/VOLUME GRAPH
(a) 'P' is on the y axis and actually comprises not only 'profit' but contribution to profit (in
monetary value), extending above and below the x axis with a zero point at the
intersection of the two axes, and the negative section below the x axis representing
fixed costs. This means that at zero production, the firm is incurring a loss equal to the
fixed costs.
(b) 'V' is on the x axis and comprises either volume of sales or value of sales (revenue).
(c) The profit-volume line is a straight line drawn with its starting point (at zero production)
at the intercept on the y axis representing the level of fixed costs, and with a gradient of
contribution/unit (or the C/S ratio if sales value is used rather than units). The P/V line
will cut the x axis at the breakeven point of sales volume. Any point on the P/V line
above the x axis represents the profit to the firm (as measured on the vertical axis) for
that particular level of sales.
Let us draw a P/V graph for our example. At sales of 120,000 units, total contribution will be
120,000 × Rs: (1 – 0.5) = Rs: 60,000 and total profit will be Rs: 20,000.
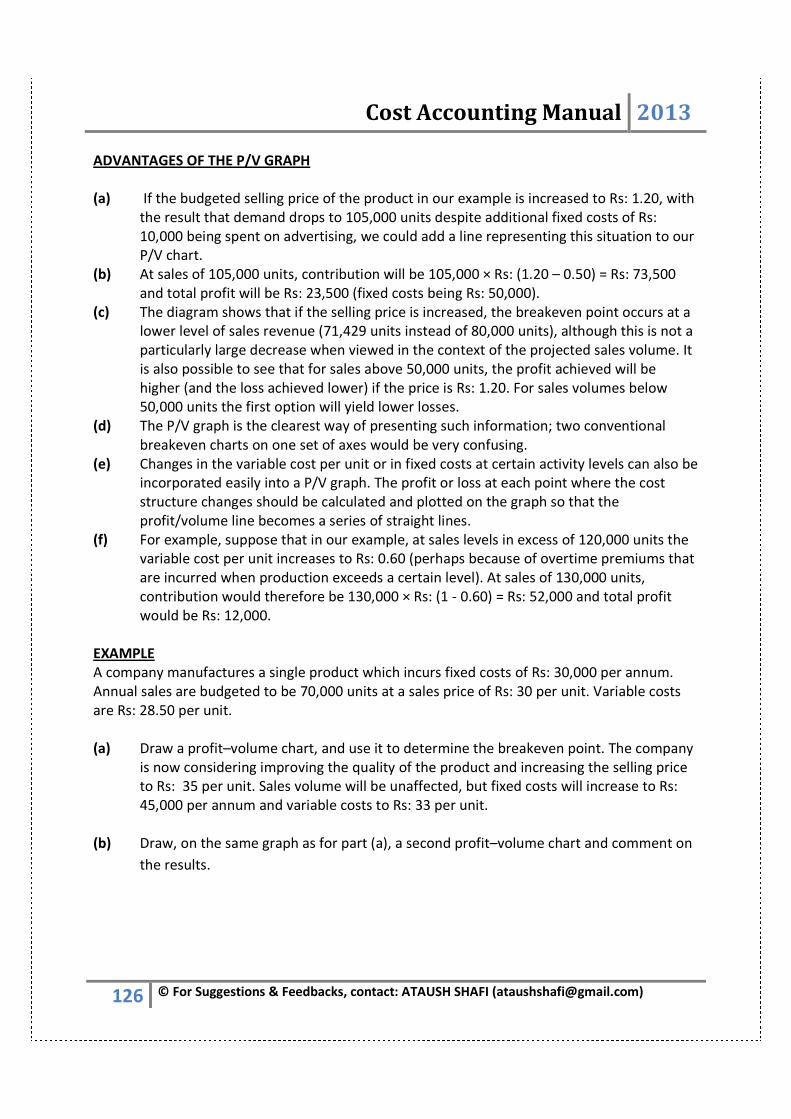
Cost Accounting Manual 2013
126 © For Suggestions & Feedbacks, contact: ATAUSH SHAFI ([email protected])
ADVANTAGES OF THE P/V GRAPH
(a) If the budgeted selling price of the product in our example is increased to Rs: 1.20, with
the result that demand drops to 105,000 units despite additional fixed costs of Rs:
10,000 being spent on advertising, we could add a line representing this situation to our
P/V chart.
(b) At sales of 105,000 units, contribution will be 105,000 × Rs: (1.20 – 0.50) = Rs: 73,500
and total profit will be Rs: 23,500 (fixed costs being Rs: 50,000).
(c) The diagram shows that if the selling price is increased, the breakeven point occurs at a
lower level of sales revenue (71,429 units instead of 80,000 units), although this is not a
particularly large decrease when viewed in the context of the projected sales volume. It
is also possible to see that for sales above 50,000 units, the profit achieved will be
higher (and the loss achieved lower) if the price is Rs: 1.20. For sales volumes below
50,000 units the first option will yield lower losses.
(d) The P/V graph is the clearest way of presenting such information; two conventional
breakeven charts on one set of axes would be very confusing.
(e) Changes in the variable cost per unit or in fixed costs at certain activity levels can also be
incorporated easily into a P/V graph. The profit or loss at each point where the cost
structure changes should be calculated and plotted on the graph so that the
profit/volume line becomes a series of straight lines.
(f) For example, suppose that in our example, at sales levels in excess of 120,000 units the
variable cost per unit increases to Rs: 0.60 (perhaps because of overtime premiums that
are incurred when production exceeds a certain level). At sales of 130,000 units,
contribution would therefore be 130,000 × Rs: (1 - 0.60) = Rs: 52,000 and total profit
would be Rs: 12,000.
EXAMPLE
A company manufactures a single product which incurs fixed costs of Rs: 30,000 per annum.
Annual sales are budgeted to be 70,000 units at a sales price of Rs: 30 per unit. Variable costs
are Rs: 28.50 per unit.
(a) Draw a profit–volume chart, and use it to determine the breakeven point. The company
is now considering improving the quality of the product and increasing the selling price
to Rs: 35 per unit. Sales volume will be unaffected, but fixed costs will increase to Rs:
45,000 per annum and variable costs to Rs: 33 per unit.
(b) Draw, on the same graph as for part (a), a second profit–volume chart and comment on
the results.
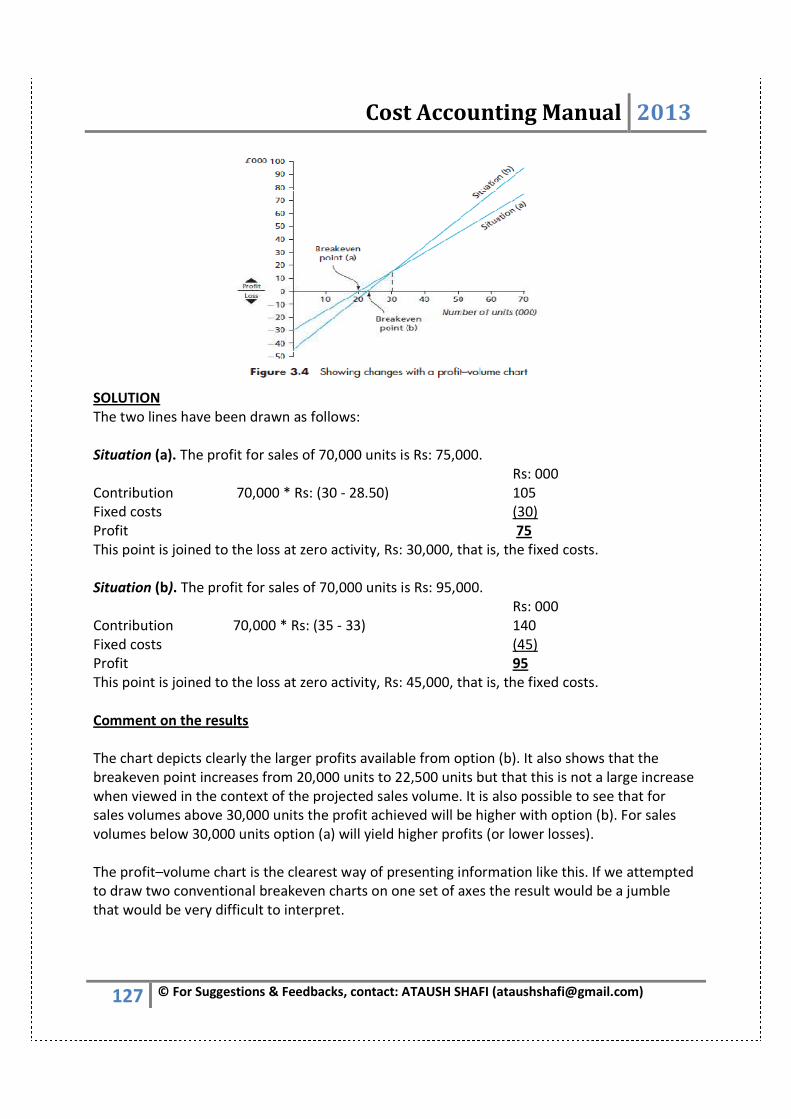
Cost Accounting Manual 2013
127 © For Suggestions & Feedbacks, contact: ATAUSH SHAFI ([email protected])
SOLUTION
The two lines have been drawn as follows:
Situation (a). The profit for sales of 70,000 units is Rs: 75,000.
Rs: 000
Contribution 70,000 * Rs: (30 - 28.50) 105
Fixed costs (30)
Profit 75
This point is joined to the loss at zero activity, Rs: 30,000, that is, the fixed costs.
Situation (b). The profit for sales of 70,000 units is Rs: 95,000.
Rs: 000
Contribution 70,000 * Rs: (35 - 33) 140
Fixed costs (45)
Profit 95
This point is joined to the loss at zero activity, Rs: 45,000, that is, the fixed costs.
Comment on the results
The chart depicts clearly the larger profits available from option (b). It also shows that the
breakeven point increases from 20,000 units to 22,500 units but that this is not a large increase
when viewed in the context of the projected sales volume. It is also possible to see that for
sales volumes above 30,000 units the profit achieved will be higher with option (b). For sales
volumes below 30,000 units option (a) will yield higher profits (or lower losses).
The profit–volume chart is the clearest way of presenting information like this. If we attempted
to draw two conventional breakeven charts on one set of axes the result would be a jumble
that would be very difficult to interpret.

Cost Accounting Manual 2013
128 © For Suggestions & Feedbacks, contact: ATAUSH SHAFI ([email protected])
ABSORPTION/MARGINAL COSTINGABSORPTION/MARGINAL COSTINGABSORPTION/MARGINAL COSTINGABSORPTION/MARGINAL COSTING
Marginal costing Direct Material + Direct Labor + Variable FOH
Absorption costing Direct Material + Direct Labor + Total FOH
Fixed FOH (under absorption) Fixed FOH * Actual capacity/Production
Normal Capacity
Note: If actual capacity is missing, it is assume that normal
capacity is actual capacity.
Finished goods inventory Total COGM * (purchase unit + Opening stock – sale
unit)
Actual capacity/production
Marginal cost The marginal cost of an item is its variable cost.
• Marginal production cost = Direct materials + Direct labour +
Variable production overhead.
• Marginal cost of sale for a product = Direct materials + Direct
labour + Variable production overhead + Other variable
overhead (for example, variable selling and distribution
overhead).
• Marginal cost of sale for a service = Direct materials + Direct
labour + Variable overhead.
It is usually assumed that direct labour costs are variable (marginal)
costs, but in some situations, direct labour costs might be fixed costs,
and so would not be included in marginal cost.
ALTERNATIVE CONCEPTALTERNATIVE CONCEPTALTERNATIVE CONCEPTALTERNATIVE CONCEPTSSSS OF MARGINAL COSTINGOF MARGINAL COSTINGOF MARGINAL COSTINGOF MARGINAL COSTING
To economist, marginal cost is the additional cost incurred by the production of one extra unit.
To accountant, marginal cost is average variable cost which is conventionally presumed to act
in linear fashion i.e. marginal cost per unit is assumed to be constant on the short run.
ASSUMPTIONS IN MARGINAL COSTINGASSUMPTIONS IN MARGINAL COSTINGASSUMPTIONS IN MARGINAL COSTINGASSUMPTIONS IN MARGINAL COSTING
1. Every additional unit of output or sale, or every additional unit of activity, has the same
variable cost as every other unit. In other words, the variable cost per unit is a constant
value.
2. Fixed costs are costs that remain the same in total in each period, regardless of how
many units are produced and sold.
3. Costs are either fixed or variable, or a mixture of fixed and variable costs. Mixed costs
can be separated into a variable cost per unit and a fixed cost per period. Techniques
such as high/low analysis or linear regression analysis should be used to do this.
4. The marginal cost of an item is therefore the extra cost that would be incurred by
making and selling one extra unit of the item.
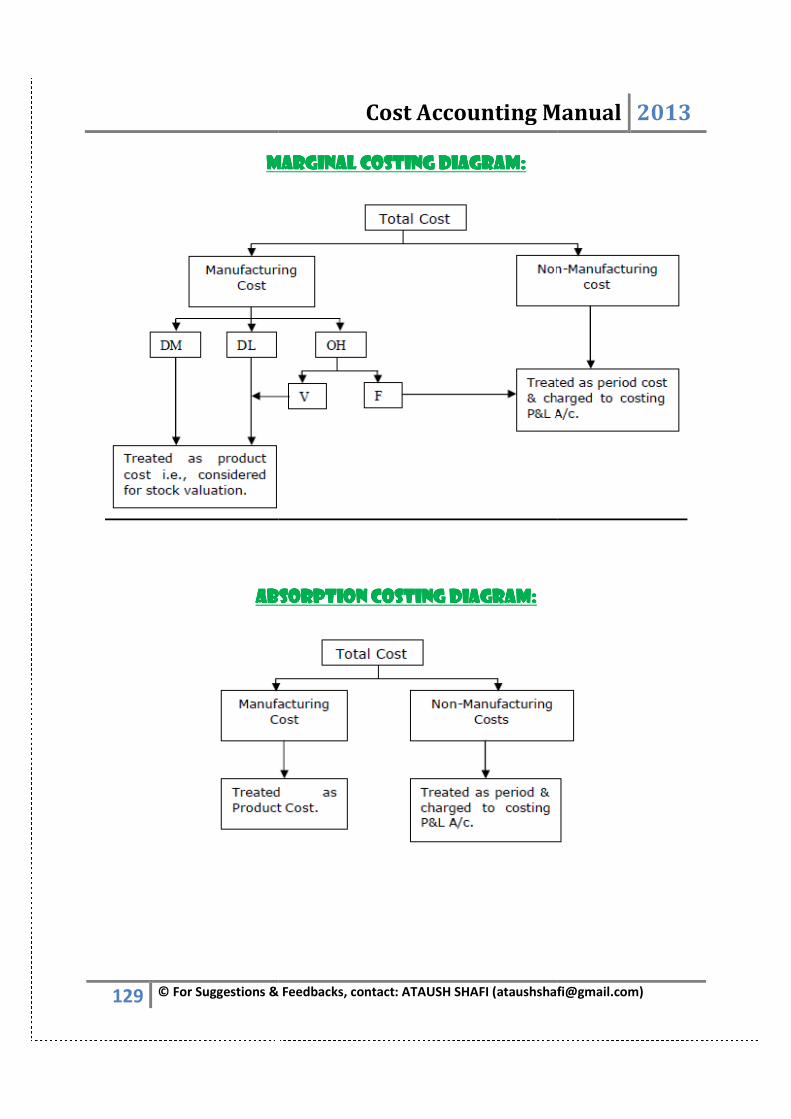
129 © For Suggestions & Feedbacks, contact:
Marginal Costing Diagram:Marginal Costing Diagram:Marginal Costing Diagram:Marginal Costing Diagram:
Absorption Costing Diagram:Absorption Costing Diagram:Absorption Costing Diagram:Absorption Costing Diagram:
Cost Accounting Manual
For Suggestions & Feedbacks, contact: ATAUSH SHAFI ([email protected])
Marginal Costing Diagram:Marginal Costing Diagram:Marginal Costing Diagram:Marginal Costing Diagram:
Absorption Costing Diagram:Absorption Costing Diagram:Absorption Costing Diagram:Absorption Costing Diagram:
Cost Accounting Manual 2013
ATAUSH SHAFI ([email protected])

Cost Accounting Manual 2013
130 © For Suggestions & Feedbacks, contact: ATAUSH SHAFI ([email protected])
ABSORPTION/FULL/TRADITIONAL/CONVENTIONAL COSTINGABSORPTION/FULL/TRADITIONAL/CONVENTIONAL COSTINGABSORPTION/FULL/TRADITIONAL/CONVENTIONAL COSTINGABSORPTION/FULL/TRADITIONAL/CONVENTIONAL COSTING
Sale XXX
Less- Cost of Goods Sold:
Direct Material XXX
Direct Labor XXX
Factory Overhead Applied (Fixed + Variable) XXX
Cost of Good Manufactured XXX
Add – Opening Finished Goods XXX
Less – Closing Finished Goods (XXX)
Cost of Goods Sold XXX
Add – Under Applied XXX
Less –Over Applied (XXX)
Cost of Goods Sold (Adjusted) (XXX)
Gross Profit XXX
Less – Operating Expenses:
Selling overhead (Fixed + Variable) XXX
Administration overhead (Fixed + Variable) XXX (XXX)
Operating Profit/ Net Profit XXX
Notes:
1. To calculate fixed FOH, see formula above.
2. Capacity will be of two types: 1: Budgeted 2: Normal. Use budgeted capacity. If not
given, then use Normal capacity.
3. Opening Finished Goods = Cost of Good Manufactured/Production Units *
Opening Stock Units
4. Closing Finished Goods = Cost of Good Manufactured/Production Units *
Closing Stock Units
5. Opening Stock Units will be given in the question.
6. Closing Stock Units will be calculated as follows: Opening Stock Units + Purchases – Sales
7. Gross Profit = Sales – COGS
8. Under / Over applied as calculated as per FOH method. Both Fixed & Variable Variances
will be considered here.

Cost Accounting Manual 2013
131 © For Suggestions & Feedbacks, contact: ATAUSH SHAFI ([email protected])
MARGINAL/DIRECT/VARIABLE COSTINGMARGINAL/DIRECT/VARIABLE COSTINGMARGINAL/DIRECT/VARIABLE COSTINGMARGINAL/DIRECT/VARIABLE COSTING
Sale XXX
Less- Cost of Goods Sold:
Direct Material XXX
Direct Labor XXX
Factory Overhead Applied (Variable only) XXX
Variable Cost of Good Manufactured XXX
Add – Opening Finished Goods XXX
Less – Closing Finished Goods (XXX)
Cost of Goods Sold XXX
Add – Under Applied XXX
Less –Over Applied (XXX)
Cost of Goods Sold (Adjusted) (XXX)
Gross Contribution XXX
Less – Variable selling & administration overhead (XXX)
Net Contribution XXX
Less – Operating Expenses:
Selling overhead (Fixed) XXX
Factory overhead (Fixed) XXX
Administration overhead (Fixed) XXX (XXX)
Operating Profit/ Net Profit XXX
Notes:
1. Opening Finished Goods = Variable Cost of Good Manufactured/Production
Units * Opening Stock Units
2. Closing Finished Goods = Variable Cost of Good Manufactured/Production
Units * Closing Stock Units
3. Opening Stock Units will be given in the question.
4. Closing Stock Units will be calculated as follows: Opening Stock Units + Purchases – Sales
5. Under / Over applied as calculated as per FOH method. Only Variable Variances will be
considered here.
RECONCILIATIONRECONCILIATIONRECONCILIATIONRECONCILIATION
Net income (Absorption costing) XXX
Less- Difference in closing stock XXX
Add- Difference in opening stock XXX
Net income (Marginal costing) XXX
Difference in profit under two costing system is due to different stock valuation methods use.
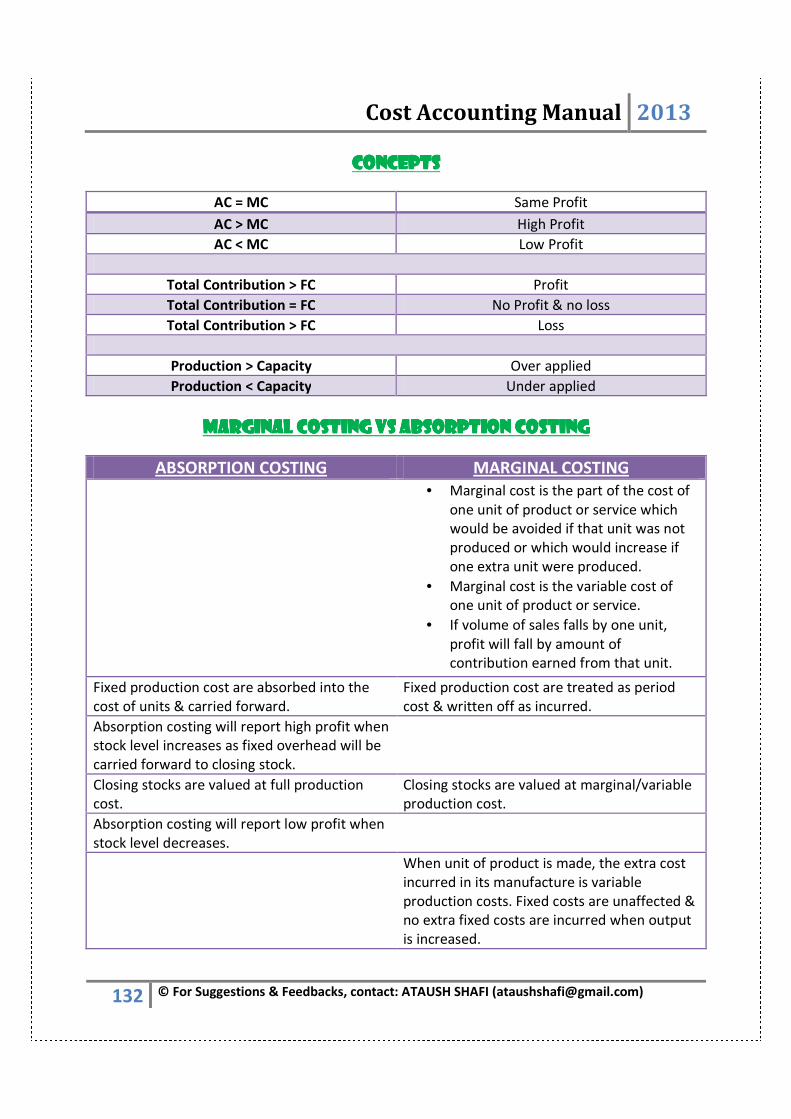
Cost Accounting Manual 2013
132 © For Suggestions & Feedbacks, contact: ATAUSH SHAFI ([email protected])
CONCEPTSCONCEPTSCONCEPTSCONCEPTS
AC = MC Same Profit
AC > MC High Profit
AC < MC Low Profit
Total Contribution > FC Profit
Total Contribution = FC No Profit & no loss
Total Contribution > FC Loss
Production > Capacity Over applied
Production < Capacity Under applied
MARGINAL MARGINAL MARGINAL MARGINAL COSTING VS ABSORPTION COSTINGCOSTING VS ABSORPTION COSTINGCOSTING VS ABSORPTION COSTINGCOSTING VS ABSORPTION COSTING
ABSORPTION COSTING MARGINAL COSTING
• Marginal cost is the part of the cost of
one unit of product or service which
would be avoided if that unit was not
produced or which would increase if
one extra unit were produced.
• Marginal cost is the variable cost of
one unit of product or service.
• If volume of sales falls by one unit,
profit will fall by amount of
contribution earned from that unit.
Fixed production cost are absorbed into the
cost of units & carried forward.
Fixed production cost are treated as period
cost & written off as incurred.
Absorption costing will report high profit when
stock level increases as fixed overhead will be
carried forward to closing stock.
Closing stocks are valued at full production
cost.
Closing stocks are valued at marginal/variable
production cost.
Absorption costing will report low profit when
stock level decreases.
When unit of product is made, the extra cost
incurred in its manufacture is variable
production costs. Fixed costs are unaffected &
no extra fixed costs are incurred when output
is increased.
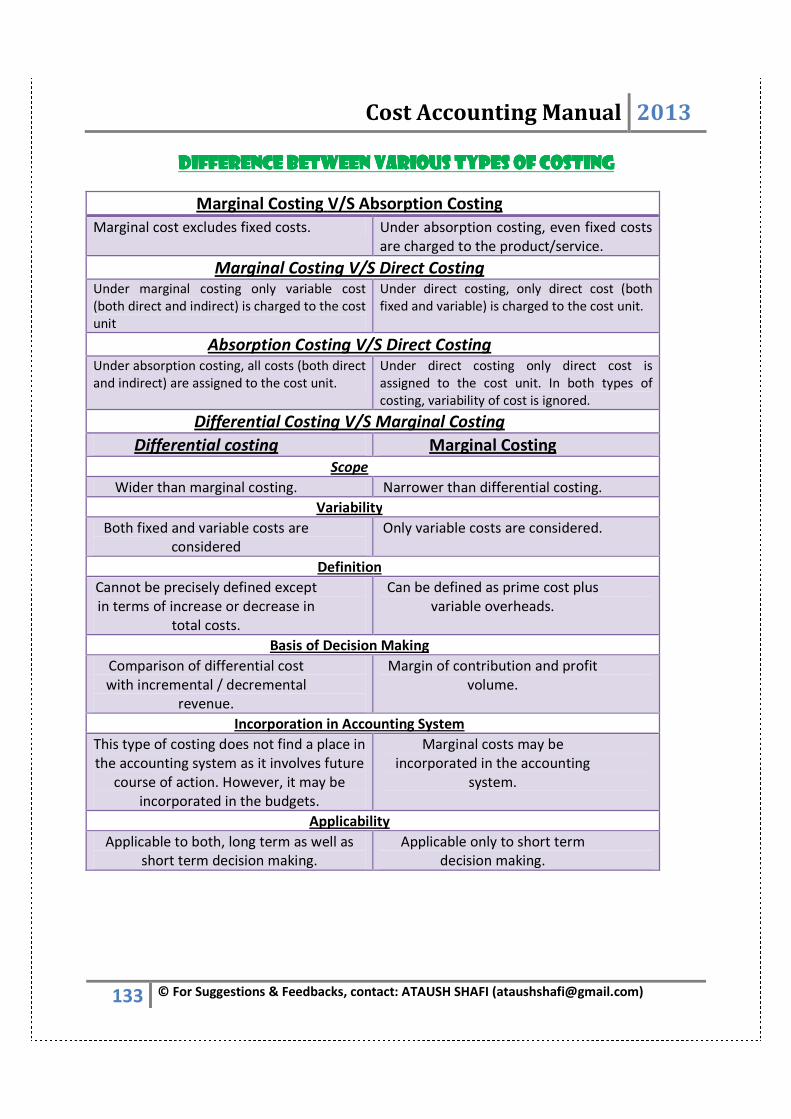
Cost Accounting Manual 2013
133 © For Suggestions & Feedbacks, contact: ATAUSH SHAFI ([email protected])
DIFFERENCE BETWEEN VARIOUS TYPES OF COSTINGDIFFERENCE BETWEEN VARIOUS TYPES OF COSTINGDIFFERENCE BETWEEN VARIOUS TYPES OF COSTINGDIFFERENCE BETWEEN VARIOUS TYPES OF COSTING
Marginal Costing V/S Absorption Costing
Marginal cost excludes fixed costs. Under absorption costing, even fixed costs
are charged to the product/service.
Marginal Costing V/S Direct Costing Under marginal costing only variable cost
(both direct and indirect) is charged to the cost
unit
Under direct costing, only direct cost (both
fixed and variable) is charged to the cost unit.
Absorption Costing V/S Direct Costing Under absorption costing, all costs (both direct
and indirect) are assigned to the cost unit.
Under direct costing only direct cost is
assigned to the cost unit. In both types of
costing, variability of cost is ignored.
Differential Costing V/S Marginal Costing
Differential costing Marginal Costing
Scope
Wider than marginal costing. Narrower than differential costing.
Variability
Both fixed and variable costs are
considered
Only variable costs are considered.
Definition
Cannot be precisely defined except
in terms of increase or decrease in
total costs.
Can be defined as prime cost plus
variable overheads.
Basis of Decision Making
Comparison of differential cost
with incremental / decremental
revenue.
Margin of contribution and profit
volume.
Incorporation in Accounting System
This type of costing does not find a place in
the accounting system as it involves future
course of action. However, it may be
incorporated in the budgets.
Marginal costs may be
incorporated in the accounting
system.
Applicability
Applicable to both, long term as well as
short term decision making.
Applicable only to short term
decision making.
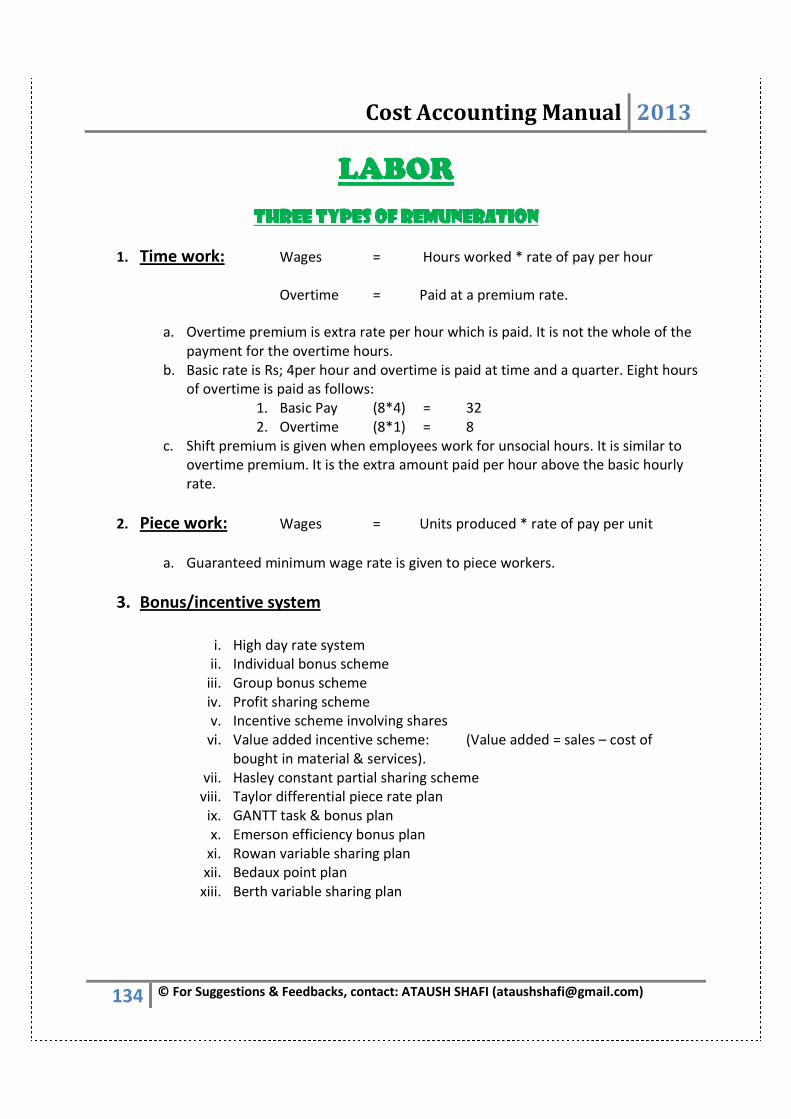
Cost Accounting Manual 2013
134 © For Suggestions & Feedbacks, contact: ATAUSH SHAFI ([email protected])
LABORLABORLABORLABOR
THREE TYPES OF REMUNERATIONTHREE TYPES OF REMUNERATIONTHREE TYPES OF REMUNERATIONTHREE TYPES OF REMUNERATION
1. Time work: Wages = Hours worked * rate of pay per hour
Overtime = Paid at a premium rate.
a. Overtime premium is extra rate per hour which is paid. It is not the whole of the
payment for the overtime hours.
b. Basic rate is Rs; 4per hour and overtime is paid at time and a quarter. Eight hours
of overtime is paid as follows:
1. Basic Pay (8*4) = 32
2. Overtime (8*1) = 8
c. Shift premium is given when employees work for unsocial hours. It is similar to
overtime premium. It is the extra amount paid per hour above the basic hourly
rate.
2. Piece work: Wages = Units produced * rate of pay per unit
a. Guaranteed minimum wage rate is given to piece workers.
3. Bonus/incentive system
i. High day rate system
ii. Individual bonus scheme
iii. Group bonus scheme
iv. Profit sharing scheme
v. Incentive scheme involving shares
vi. Value added incentive scheme: (Value added = sales – cost of
bought in material & services).
vii. Hasley constant partial sharing scheme
viii. Taylor differential piece rate plan
ix. GANTT task & bonus plan
x. Emerson efficiency bonus plan
xi. Rowan variable sharing plan
xii. Bedaux point plan
xiii. Berth variable sharing plan

Cost Accounting Manual 2013
135 © For Suggestions & Feedbacks, contact: ATAUSH SHAFI ([email protected])
FORMULAEFORMULAEFORMULAEFORMULAE
Hasley constant partial sharing scheme Wage rate * 50% * time save
Taylor differential piece rate plan Wage rat e * time save / time allowed * time taken
Unit Production
Time Hour
Unit Labor Cost Labor / Units
Unit Overhead Cost FOH / Units
Conversion Cost Per Unit DL + FOH / Units
PRODUCTIVITY
1 - Output man per hour Total Output / Total Man hours
2 - Labor Hour per unit of production Total Labor Hour/ Total Output
3 - Extent of ineffective/Lost time Man hours Lost / Possible Man Hours * 100
4 - Actual Time compared with
standard time
Actual Time - Standard Time
5 - Other Methods
Sale Value / No of workers
Direct Wages / No of units
Added value of the product / Total wages cost
Premium Costing Methods
Directly charged to production
Treated as overhead element
Charged to income statement as period costs
Effective Per hour Total Weekly Earnings / Total Hours
Labor Turnover Methods
Number of employees leaving
Avg number on payroll
OR
Number of employees leaving + joining
Avg number on payroll
OR
Number of employees replaced
Avg number on payroll
Idle time formula Idle hours / total hours * 100
Halsey-Weir plan
Earnings = Hours worked*rate per hour + 30% of
time saved*rate per hour
Gantt Task and bonus system a) Output below standard = Net payment is of
guaranteed time rate
b) Output at standard = Net payment is 120%of time
rate
c) Output above standard = Net payment is 120% of
piece rate
Emerson Efficiency Plan a) Efficiency below 66-2/3%= No bonus, only
guaranteed time rate

Cost Accounting Manual 2013
136 © For Suggestions & Feedbacks, contact: ATAUSH SHAFI ([email protected])
b) From66-2/3% to 100% = It changes at various
levels, at 100% bonus rate is 20% of the Time wages
c) Above 100% = 120% of time wages+ 1% increase
for every1% increase in efficiency beyond 100%
Bedaux Pont System
Earnings= hours worked* rate per hour + 75%of
hours saved*rate per hour
Taylor’s System
a) Efficiency Less than 100% = Payment is 80% of
piece rate
b) Efficiency of 100% or more = Payment is 120% of
piece rate
Merrick differential piece rate System a) For efficiency up to 83% = payment is ordinary
piece rate
b) For efficiency from 83% to 100% = payment is
110% of ordinary piece rate
c) For efficiency more than 100% = Payment is 120%
of ordinary piece rate
Barth System
Earnings = rate per hour * √standard hour * hours
worked
Rowan variable sharing planRowan variable sharing planRowan variable sharing planRowan variable sharing plan
1. Base wage are generally guaranteed up to task. Above such task, bonuses are paid
according to a variable share of the time saved.
2. Time saved is the function of standard time allowed whereas in other bonus plan, it is
the function of actual time worked.
Worker – 1 Worker – 2
Standard time allowed in
hours
8 8
Actual time taken in hours 4 6
% bonus (Standard time
allowed in hours - Actual
time taken in hours) /
Standard time allowed in
hours
8-4/8*100 = 50% 8-6/8*100 = 25%
Emerson efficiency bonus planEmerson efficiency bonus planEmerson efficiency bonus planEmerson efficiency bonus plan
1. Empirical scale of bonus ratios
2. 66% efficiency = ZERO bonus
3. 87.5% efficiency = agreed % bonus
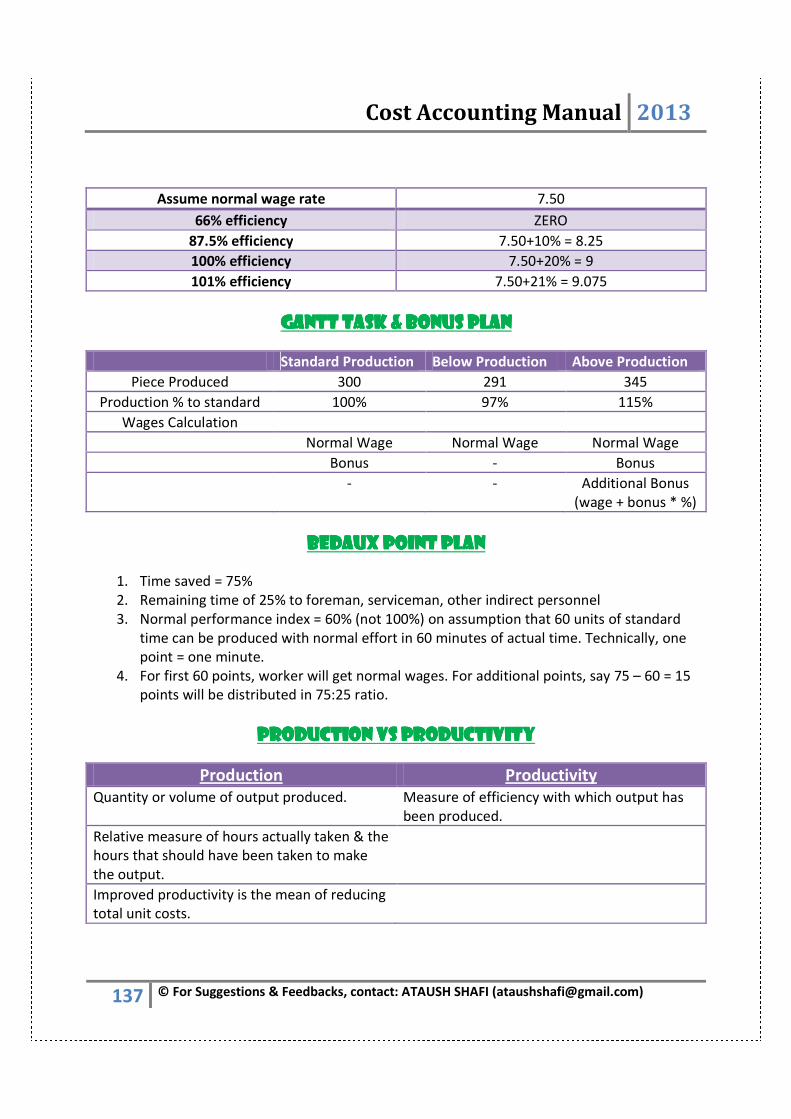
Cost Accounting Manual 2013
137 © For Suggestions & Feedbacks, contact: ATAUSH SHAFI ([email protected])
Assume normal wage rate 7.50
66% efficiency ZERO
87.5% efficiency 7.50+10% = 8.25
100% efficiency 7.50+20% = 9
101% efficiency 7.50+21% = 9.075
GANTT task & bonus planGANTT task & bonus planGANTT task & bonus planGANTT task & bonus plan
Standard Production Below Production Above Production
Piece Produced 300 291 345
Production % to standard 100% 97% 115%
Wages Calculation
Normal Wage Normal Wage Normal Wage
Bonus - Bonus
- - Additional Bonus
(wage + bonus * %)
Bedaux point planBedaux point planBedaux point planBedaux point plan
1. Time saved = 75%
2. Remaining time of 25% to foreman, serviceman, other indirect personnel
3. Normal performance index = 60% (not 100%) on assumption that 60 units of standard
time can be produced with normal effort in 60 minutes of actual time. Technically, one
point = one minute.
4. For first 60 points, worker will get normal wages. For additional points, say 75 – 60 = 15
points will be distributed in 75:25 ratio.
PRODUCTION VS PRODUCTIVITYPRODUCTION VS PRODUCTIVITYPRODUCTION VS PRODUCTIVITYPRODUCTION VS PRODUCTIVITY
Production Productivity
Quantity or volume of output produced. Measure of efficiency with which output has
been produced.
Relative measure of hours actually taken & the
hours that should have been taken to make
the output.
Improved productivity is the mean of reducing
total unit costs.
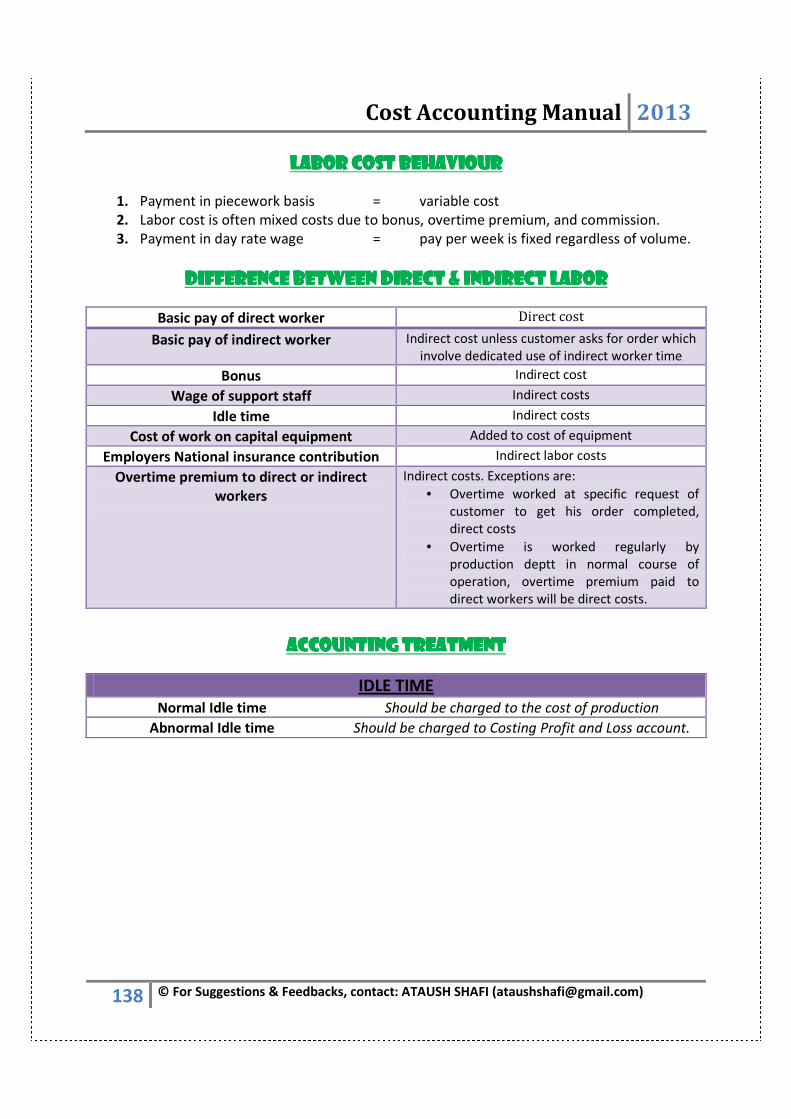
Cost Accounting Manual 2013
138 © For Suggestions & Feedbacks, contact: ATAUSH SHAFI ([email protected])
LABOR COST BEHAVIOURLABOR COST BEHAVIOURLABOR COST BEHAVIOURLABOR COST BEHAVIOUR
1. Payment in piecework basis = variable cost
2. Labor cost is often mixed costs due to bonus, overtime premium, and commission.
3. Payment in day rate wage = pay per week is fixed regardless of volume.
DIFFERENCE BETWEEN DIFFERENCE BETWEEN DIFFERENCE BETWEEN DIFFERENCE BETWEEN DIRECT & INDIRECT LABORDIRECT & INDIRECT LABORDIRECT & INDIRECT LABORDIRECT & INDIRECT LABOR
Basic pay of direct worker Direct cost
Basic pay of indirect worker Indirect cost unless customer asks for order which
involve dedicated use of indirect worker time
Bonus Indirect cost
Wage of support staff Indirect costs
Idle time Indirect costs
Cost of work on capital equipment Added to cost of equipment
Employers National insurance contribution Indirect labor costs
Overtime premium to direct or indirect
workers
Indirect costs. Exceptions are:
• Overtime worked at specific request of
customer to get his order completed,
direct costs
• Overtime is worked regularly by
production deptt in normal course of
operation, overtime premium paid to
direct workers will be direct costs.
ACCOUNTING TREATMENTACCOUNTING TREATMENTACCOUNTING TREATMENTACCOUNTING TREATMENT
IDLE TIME
Normal Idle time Should be charged to the cost of production
Abnormal Idle time Should be charged to Costing Profit and Loss account.
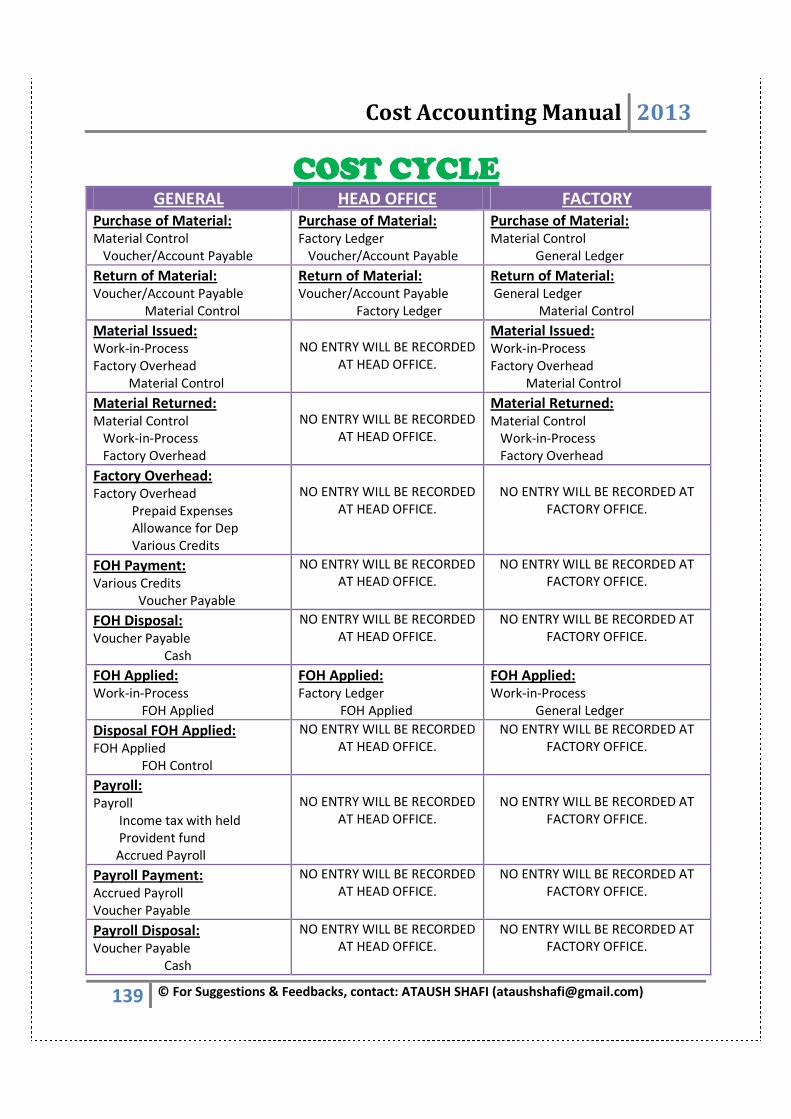
Cost Accounting Manual 2013
139 © For Suggestions & Feedbacks, contact: ATAUSH SHAFI ([email protected])
COST CYCLECOST CYCLECOST CYCLECOST CYCLE GENERAL HEAD OFFICE FACTORY
Purchase of Material: Material Control
Voucher/Account Payable
Purchase of Material: Factory Ledger
Voucher/Account Payable
Purchase of Material: Material Control
General Ledger
Return of Material: Voucher/Account Payable
Material Control
Return of Material: Voucher/Account Payable
Factory Ledger
Return of Material: General Ledger
Material Control
Material Issued: Work-in-Process
Factory Overhead
Material Control
NO ENTRY WILL BE RECORDED
AT HEAD OFFICE.
Material Issued: Work-in-Process
Factory Overhead
Material Control
Material Returned: Material Control
Work-in-Process
Factory Overhead
NO ENTRY WILL BE RECORDED
AT HEAD OFFICE.
Material Returned: Material Control
Work-in-Process
Factory Overhead
Factory Overhead: Factory Overhead
Prepaid Expenses
Allowance for Dep
Various Credits
NO ENTRY WILL BE RECORDED
AT HEAD OFFICE.
NO ENTRY WILL BE RECORDED AT
FACTORY OFFICE.
FOH Payment: Various Credits
Voucher Payable
NO ENTRY WILL BE RECORDED
AT HEAD OFFICE.
NO ENTRY WILL BE RECORDED AT
FACTORY OFFICE.
FOH Disposal: Voucher Payable
Cash
NO ENTRY WILL BE RECORDED
AT HEAD OFFICE.
NO ENTRY WILL BE RECORDED AT
FACTORY OFFICE.
FOH Applied: Work-in-Process
FOH Applied
FOH Applied: Factory Ledger
FOH Applied
FOH Applied: Work-in-Process
General Ledger
Disposal FOH Applied: FOH Applied
FOH Control
NO ENTRY WILL BE RECORDED
AT HEAD OFFICE.
NO ENTRY WILL BE RECORDED AT
FACTORY OFFICE.
Payroll: Payroll
Income tax with held
Provident fund
Accrued Payroll
NO ENTRY WILL BE RECORDED
AT HEAD OFFICE.
NO ENTRY WILL BE RECORDED AT
FACTORY OFFICE.
Payroll Payment: Accrued Payroll
Voucher Payable
NO ENTRY WILL BE RECORDED
AT HEAD OFFICE.
NO ENTRY WILL BE RECORDED AT
FACTORY OFFICE.
Payroll Disposal: Voucher Payable
Cash
NO ENTRY WILL BE RECORDED
AT HEAD OFFICE.
NO ENTRY WILL BE RECORDED AT
FACTORY OFFICE.
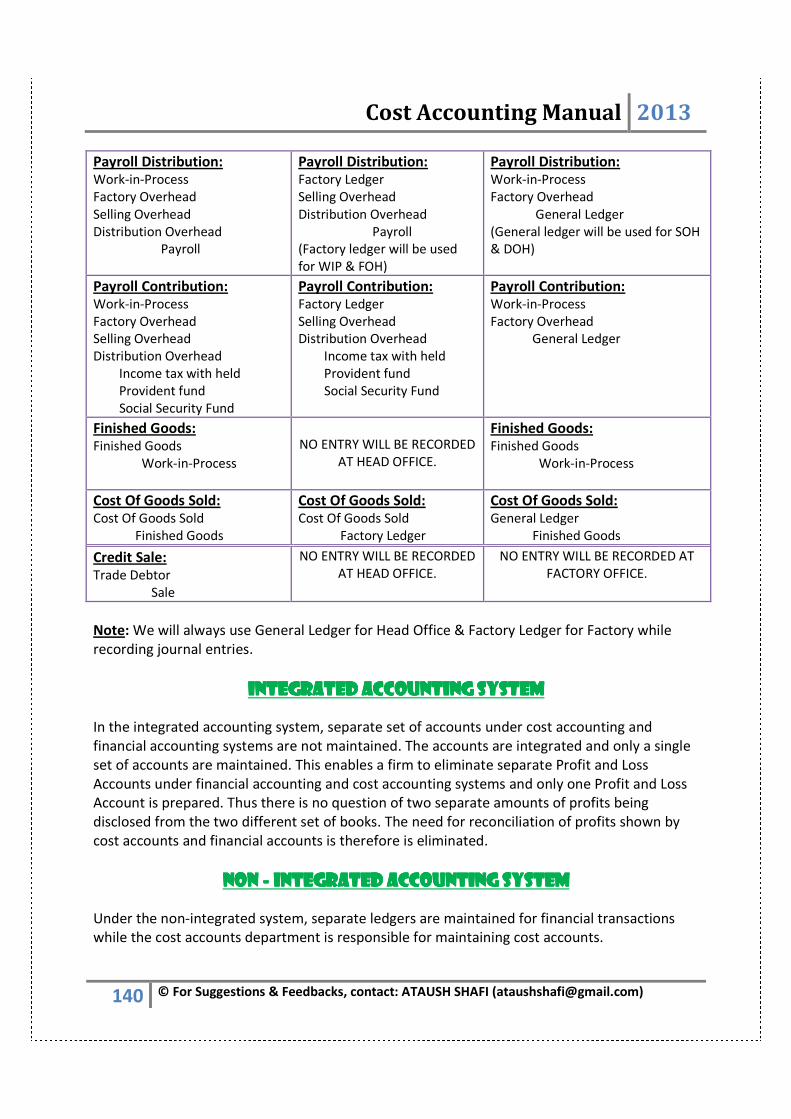
Cost Accounting Manual 2013
140 © For Suggestions & Feedbacks, contact: ATAUSH SHAFI ([email protected])
Payroll Distribution: Work-in-Process
Factory Overhead
Selling Overhead
Distribution Overhead
Payroll
Payroll Distribution: Factory Ledger
Selling Overhead
Distribution Overhead
Payroll
(Factory ledger will be used
for WIP & FOH)
Payroll Distribution: Work-in-Process
Factory Overhead
General Ledger
(General ledger will be used for SOH
& DOH)
Payroll Contribution: Work-in-Process
Factory Overhead
Selling Overhead
Distribution Overhead
Income tax with held
Provident fund
Social Security Fund
Payroll Contribution: Factory Ledger
Selling Overhead
Distribution Overhead
Income tax with held
Provident fund
Social Security Fund
Payroll Contribution: Work-in-Process
Factory Overhead
General Ledger
Finished Goods: Finished Goods
Work-in-Process
NO ENTRY WILL BE RECORDED
AT HEAD OFFICE.
Finished Goods: Finished Goods
Work-in-Process
Cost Of Goods Sold: Cost Of Goods Sold
Finished Goods
Cost Of Goods Sold: Cost Of Goods Sold
Factory Ledger
Cost Of Goods Sold: General Ledger
Finished Goods
Credit Sale: Trade Debtor
Sale
NO ENTRY WILL BE RECORDED
AT HEAD OFFICE.
NO ENTRY WILL BE RECORDED AT
FACTORY OFFICE.
Note: We will always use General Ledger for Head Office & Factory Ledger for Factory while
recording journal entries.
INTEGRATED ACCOUNTING SYSTEMINTEGRATED ACCOUNTING SYSTEMINTEGRATED ACCOUNTING SYSTEMINTEGRATED ACCOUNTING SYSTEM
In the integrated accounting system, separate set of accounts under cost accounting and
financial accounting systems are not maintained. The accounts are integrated and only a single
set of accounts are maintained. This enables a firm to eliminate separate Profit and Loss
Accounts under financial accounting and cost accounting systems and only one Profit and Loss
Account is prepared. Thus there is no question of two separate amounts of profits being
disclosed from the two different set of books. The need for reconciliation of profits shown by
cost accounts and financial accounts is therefore is eliminated.
NON NON NON NON ---- INTEGRATED ACCOUNTING SYSTEMINTEGRATED ACCOUNTING SYSTEMINTEGRATED ACCOUNTING SYSTEMINTEGRATED ACCOUNTING SYSTEM
Under the non-integrated system, separate ledgers are maintained for financial transactions
while the cost accounts department is responsible for maintaining cost accounts.
Cost Accounting Manual 2013
141 © For Suggestions & Feedbacks, contact: ATAUSH SHAFI ([email protected])
ACCOUACCOUACCOUACCOUNTS IN THE COST LEDGERNTS IN THE COST LEDGERNTS IN THE COST LEDGERNTS IN THE COST LEDGER
• The costs of materials, labour and expenses
• Overhead costs
• The costs of production
• Sales and the cost of sales
• Profit or loss.
• Under-absorbed or over-absorbed production overhead
THE INVENTORY ACCOUNTSTHE INVENTORY ACCOUNTSTHE INVENTORY ACCOUNTSTHE INVENTORY ACCOUNTS
Raw materials: The raw materials inventory account, or stores account, is used to record
the cost of materials purchased, and the cost of materials issued from the stores department to
other departments. The balance on the raw materials inventory account shows the cost of the
raw materials currently held as inventory.
Work-in-progress (WIP): WIP account records the costs of direct materials, direct labour
and direct expenses (if any), and absorbed production overhead costs. It also records the cost
of finished production. (Finished production is either transferred to a finished goods store or
sold directly to the customer.) The balance on the WIP inventory account shows the cost of
production still in progress and not yet completed. This inventory of unfinished production is
called ‘work–in-progress’.
Finished goods: It records the production cost of completed units transferred from
production into the finished goods store, and the production cost of goods that are then
transferred from the store and sold to customers. The balance on the finished goods inventory
account shows the production cost of finished output held in store.
RECORDING COSTS INCURREDRECORDING COSTS INCURREDRECORDING COSTS INCURREDRECORDING COSTS INCURRED
• The raw materials account records the cost of materials purchased.
• The wages and salaries cost account records the cost of labour. (Sometimes, you might
come across a direct labour cost account, which records the wages and salary costs of
direct labour only.)
• Overhead cost accounts record the overhead costs incurred.
• The work-in-progress account records the production costs of items produced.
• It records the cost of direct materials, direct labour and production overheads absorbed.
These costs are transferred to work in progress from the raw materials account, wages
and salaries cost account and production overheads account.
• The finished goods account records the production cost of completed production that is
transferred from work in progress to the store of finished goods inventory.
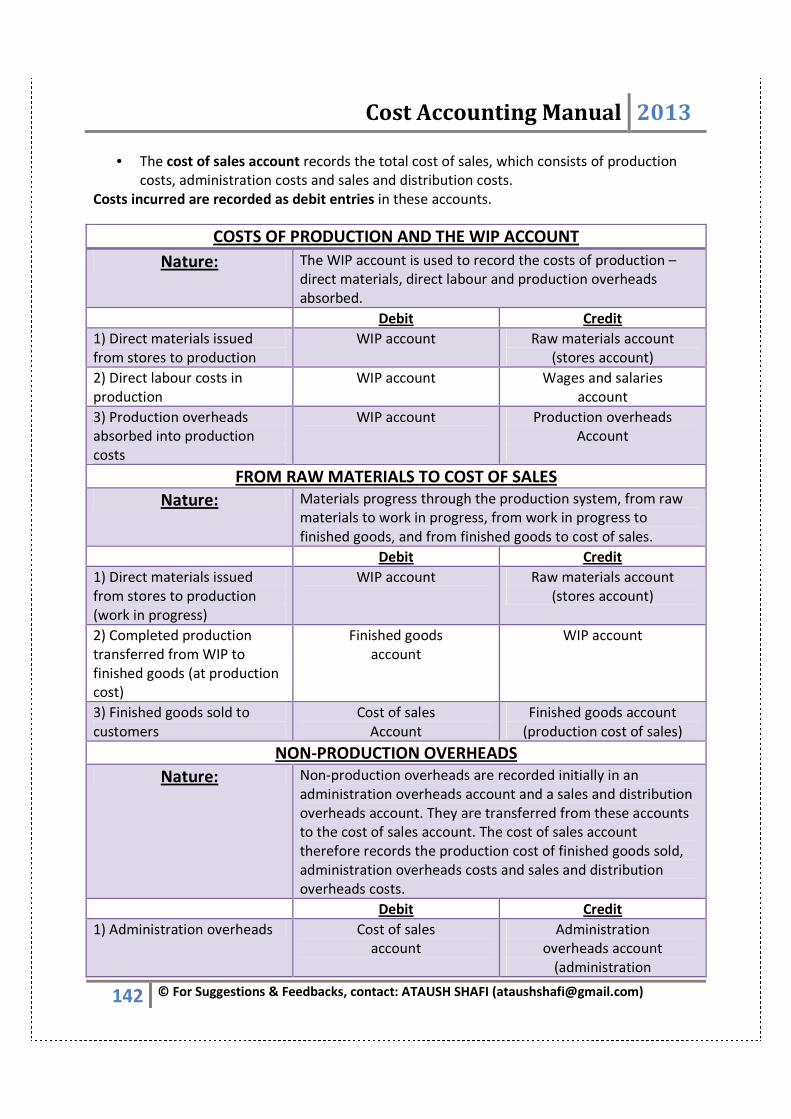
Cost Accounting Manual 2013
142 © For Suggestions & Feedbacks, contact: ATAUSH SHAFI ([email protected])
• The cost of sales account records the total cost of sales, which consists of production
costs, administration costs and sales and distribution costs.
Costs incurred are recorded as debit entries in these accounts.
COSTS OF PRODUCTION AND THE WIP ACCOUNT
Nature: The WIP account is used to record the costs of production –
direct materials, direct labour and production overheads
absorbed.
Debit Credit
1) Direct materials issued
from stores to production
WIP account Raw materials account
(stores account)
2) Direct labour costs in
production
WIP account Wages and salaries
account
3) Production overheads
absorbed into production
costs
WIP account Production overheads
Account
FROM RAW MATERIALS TO COST OF SALES
Nature: Materials progress through the production system, from raw
materials to work in progress, from work in progress to
finished goods, and from finished goods to cost of sales.
Debit Credit
1) Direct materials issued
from stores to production
(work in progress)
WIP account Raw materials account
(stores account)
2) Completed production
transferred from WIP to
finished goods (at production
cost)
Finished goods
account
WIP account
3) Finished goods sold to
customers
Cost of sales
Account
Finished goods account
(production cost of sales)
NON-PRODUCTION OVERHEADS
Nature: Non-production overheads are recorded initially in an
administration overheads account and a sales and distribution
overheads account. They are transferred from these accounts
to the cost of sales account. The cost of sales account
therefore records the production cost of finished goods sold,
administration overheads costs and sales and distribution
overheads costs.
Debit Credit
1) Administration overheads Cost of sales
account
Administration
overheads account
(administration
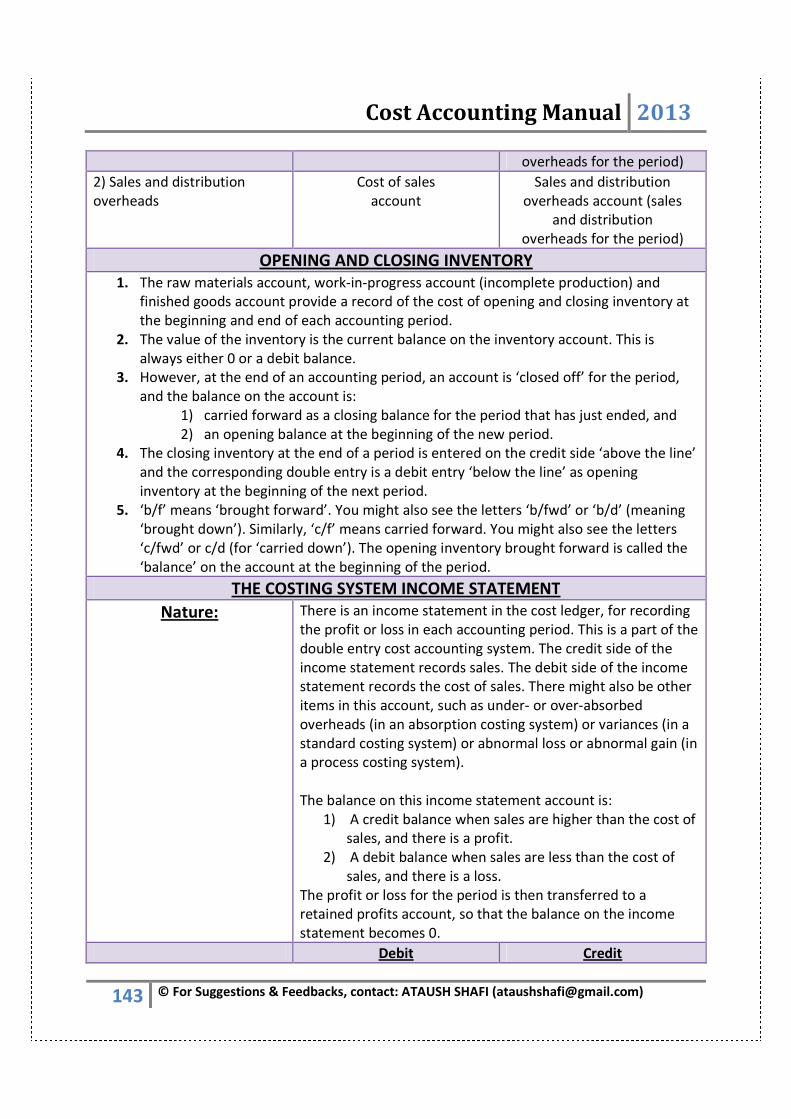
Cost Accounting Manual 2013
143 © For Suggestions & Feedbacks, contact: ATAUSH SHAFI ([email protected])
overheads for the period)
2) Sales and distribution
overheads
Cost of sales
account
Sales and distribution
overheads account (sales
and distribution
overheads for the period)
OPENING AND CLOSING INVENTORY
1. The raw materials account, work-in-progress account (incomplete production) and
finished goods account provide a record of the cost of opening and closing inventory at
the beginning and end of each accounting period.
2. The value of the inventory is the current balance on the inventory account. This is
always either 0 or a debit balance.
3. However, at the end of an accounting period, an account is ‘closed off’ for the period,
and the balance on the account is:
1) carried forward as a closing balance for the period that has just ended, and
2) an opening balance at the beginning of the new period.
4. The closing inventory at the end of a period is entered on the credit side ‘above the line’
and the corresponding double entry is a debit entry ‘below the line’ as opening
inventory at the beginning of the next period.
5. ‘b/f’ means ‘brought forward’. You might also see the letters ‘b/fwd’ or ‘b/d’ (meaning
‘brought down’). Similarly, ‘c/f’ means carried forward. You might also see the letters
‘c/fwd’ or c/d (for ‘carried down’). The opening inventory brought forward is called the
‘balance’ on the account at the beginning of the period.
THE COSTING SYSTEM INCOME STATEMENT
Nature: There is an income statement in the cost ledger, for recording
the profit or loss in each accounting period. This is a part of the
double entry cost accounting system. The credit side of the
income statement records sales. The debit side of the income
statement records the cost of sales. There might also be other
items in this account, such as under- or over-absorbed
overheads (in an absorption costing system) or variances (in a
standard costing system) or abnormal loss or abnormal gain (in
a process costing system).
The balance on this income statement account is:
1) A credit balance when sales are higher than the cost of
sales, and there is a profit.
2) A debit balance when sales are less than the cost of
sales, and there is a loss.
The profit or loss for the period is then transferred to a
retained profits account, so that the balance on the income
statement becomes 0.
Debit Credit
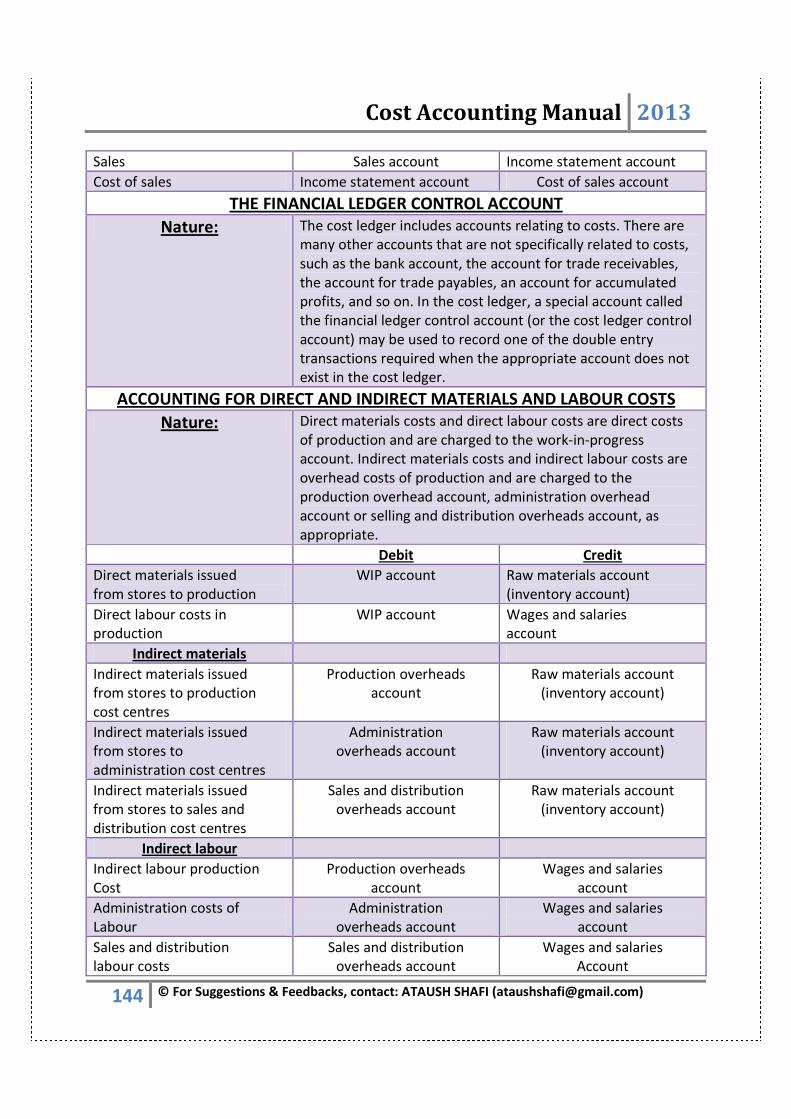
Cost Accounting Manual 2013
144 © For Suggestions & Feedbacks, contact: ATAUSH SHAFI ([email protected])
Sales Sales account Income statement account
Cost of sales Income statement account Cost of sales account
THE FINANCIAL LEDGER CONTROL ACCOUNT
Nature: The cost ledger includes accounts relating to costs. There are
many other accounts that are not specifically related to costs,
such as the bank account, the account for trade receivables,
the account for trade payables, an account for accumulated
profits, and so on. In the cost ledger, a special account called
the financial ledger control account (or the cost ledger control
account) may be used to record one of the double entry
transactions required when the appropriate account does not
exist in the cost ledger.
ACCOUNTING FOR DIRECT AND INDIRECT MATERIALS AND LABOUR COSTS
Nature: Direct materials costs and direct labour costs are direct costs
of production and are charged to the work-in-progress
account. Indirect materials costs and indirect labour costs are
overhead costs of production and are charged to the
production overhead account, administration overhead
account or selling and distribution overheads account, as
appropriate.
Debit Credit
Direct materials issued
from stores to production
WIP account Raw materials account
(inventory account)
Direct labour costs in
production
WIP account Wages and salaries
account
Indirect materials
Indirect materials issued
from stores to production
cost centres
Production overheads
account
Raw materials account
(inventory account)
Indirect materials issued
from stores to
administration cost centres
Administration
overheads account
Raw materials account
(inventory account)
Indirect materials issued
from stores to sales and
distribution cost centres
Sales and distribution
overheads account
Raw materials account
(inventory account)
Indirect labour
Indirect labour production
Cost
Production overheads
account
Wages and salaries
account
Administration costs of
Labour
Administration
overheads account
Wages and salaries
account
Sales and distribution
labour costs
Sales and distribution
overheads account
Wages and salaries
Account
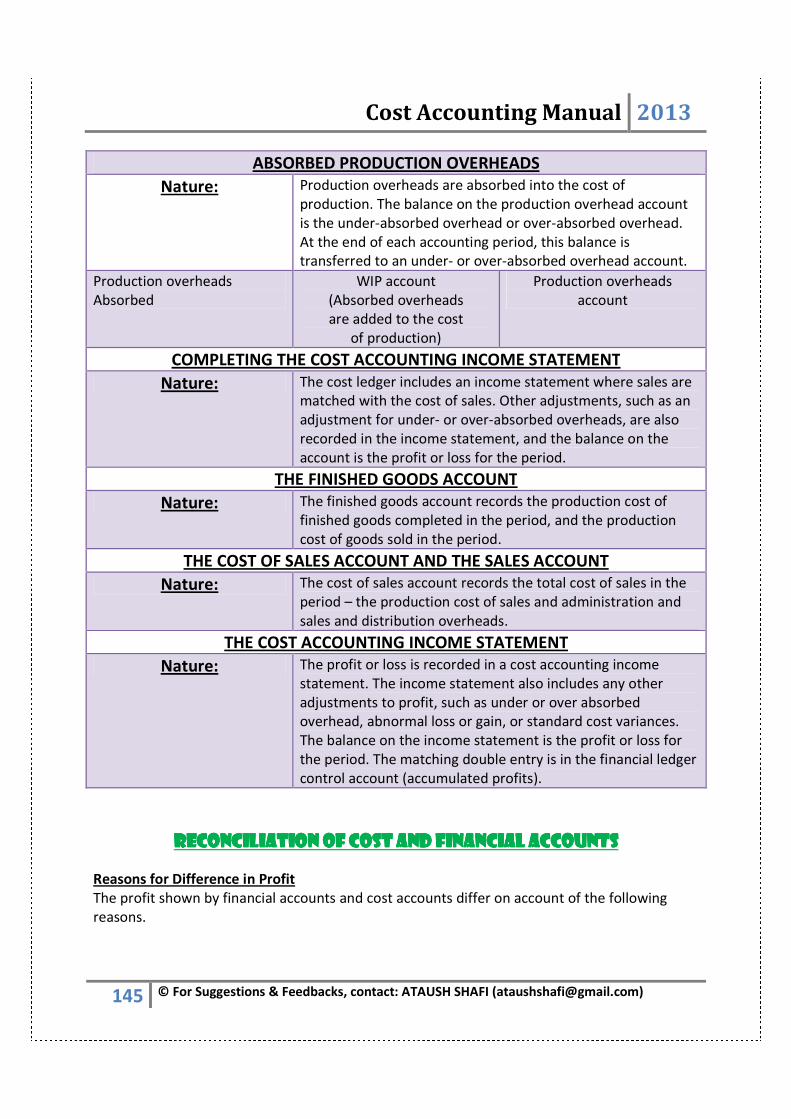
Cost Accounting Manual 2013
145 © For Suggestions & Feedbacks, contact: ATAUSH SHAFI ([email protected])
ABSORBED PRODUCTION OVERHEADS
Nature: Production overheads are absorbed into the cost of
production. The balance on the production overhead account
is the under-absorbed overhead or over-absorbed overhead.
At the end of each accounting period, this balance is
transferred to an under- or over-absorbed overhead account.
Production overheads
Absorbed
WIP account
(Absorbed overheads
are added to the cost
of production)
Production overheads
account
COMPLETING THE COST ACCOUNTING INCOME STATEMENT
Nature: The cost ledger includes an income statement where sales are
matched with the cost of sales. Other adjustments, such as an
adjustment for under- or over-absorbed overheads, are also
recorded in the income statement, and the balance on the
account is the profit or loss for the period.
THE FINISHED GOODS ACCOUNT
Nature: The finished goods account records the production cost of
finished goods completed in the period, and the production
cost of goods sold in the period.
THE COST OF SALES ACCOUNT AND THE SALES ACCOUNT
Nature: The cost of sales account records the total cost of sales in the
period – the production cost of sales and administration and
sales and distribution overheads.
THE COST ACCOUNTING INCOME STATEMENT
Nature: The profit or loss is recorded in a cost accounting income
statement. The income statement also includes any other
adjustments to profit, such as under or over absorbed
overhead, abnormal loss or gain, or standard cost variances.
The balance on the income statement is the profit or loss for
the period. The matching double entry is in the financial ledger
control account (accumulated profits).
RECONCILIATION OF COST AND FINANCIAL ACCOUNTSRECONCILIATION OF COST AND FINANCIAL ACCOUNTSRECONCILIATION OF COST AND FINANCIAL ACCOUNTSRECONCILIATION OF COST AND FINANCIAL ACCOUNTS
Reasons for Difference in Profit
The profit shown by financial accounts and cost accounts differ on account of the following
reasons.

Cost Accounting Manual 2013
146 © For Suggestions & Feedbacks, contact: ATAUSH SHAFI ([email protected])
I] Items of Financial Nature not recorded in Cost Accounts: The following items are not
recorded in cost accounts as they are of purely financial nature and consequently the profits
differ as these items are recorded in the financial accounts.
• Interest received on bank deposits.
• Dividend, interest received on investments.
• Rent received
• Losses on sale of assets
• Bad debts written off, recovered
• Transfer fees received
• Interest on proprietor’s capital
• Fines and penalties payable
• Compensation payable.
II] Items Charged to Profit and Loss Account but not Recorded in Cost Accounts: The following
items are found in the cost accounts but not recorded in the financial accounts.
• Corporate taxes
• Appropriations out of profits, such as transfer of profits to reserves
• Certain payments like dividend
• Additional provisions of depreciation
• Certain amounts written off such as goodwill, patents, preliminary
expenses, underwriting commission etc.
III] Items Peculiar in Cost Accounts: The items described below are peculiar in cost accounts
while their treatment in financial accounts is different. Hence there is a difference between the
profits shown by both the systems
Overheads: In cost accounts, overheads are finally absorbed in the products by computing the
predetermined rate of absorption. In such cases, there may be under/over absorption of
overheads.
This means that the overheads actually incurred will not tally with the overheads charged to the
product. In financial accounts overheads are always taken at actual basis irrespective of
under/over absorption of the same. In such cases the profits shown by both the systems will
differ. However, if the under/over absorbed overheads are charged to the costing profit and
loss account, the profits shown by financial accounts and cost accounts will not differ.
Valuation of Closing Stock and Work-in-Progress: The principle of valuation of closing stock
in financial statements is cost price or market price whichever is less. However, in cost
accounts, valuation of closing stock may be made on the basis of marginal costing where only
the variable costs are taken into consideration while valuing the closing stock. Thus the closing
stock valuation may differ. Work-in-Progress in cost accounts is often valued on the basis of
prime cost and sometimes variable manufacturing overheads are added in the same. On the
other hand, in financial accounting, work-in-progress may be valued after taking into
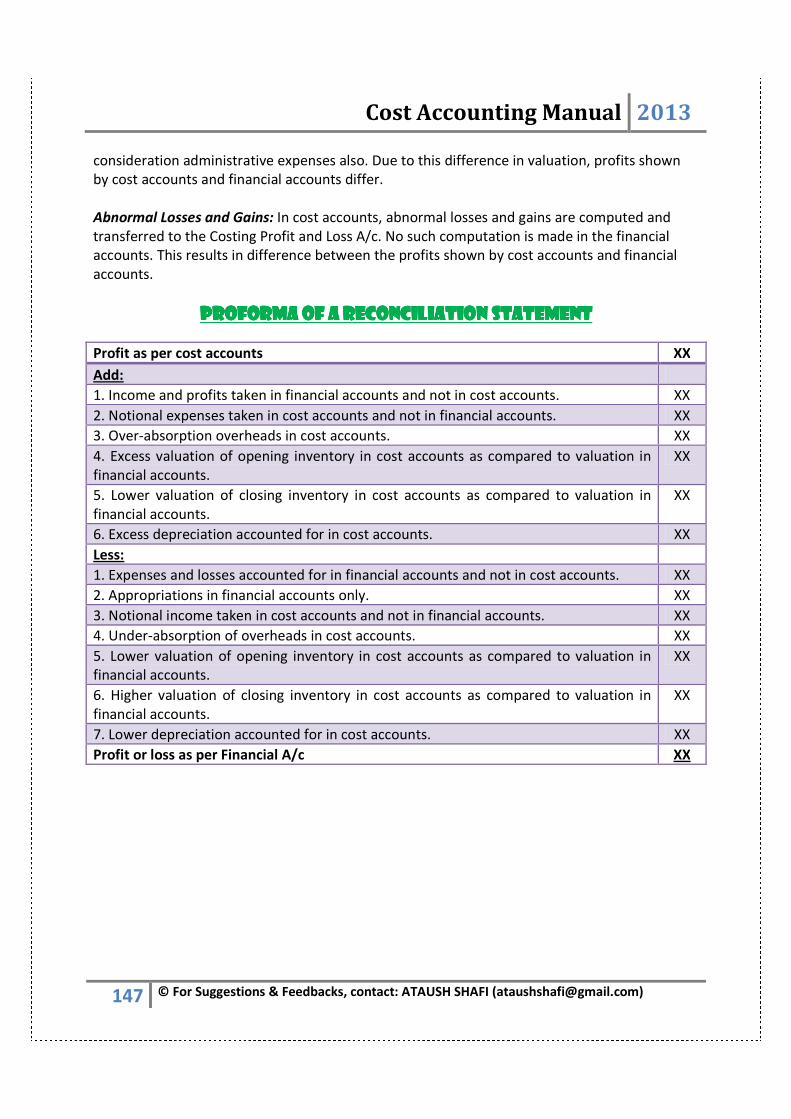
Cost Accounting Manual 2013
147 © For Suggestions & Feedbacks, contact: ATAUSH SHAFI ([email protected])
consideration administrative expenses also. Due to this difference in valuation, profits shown
by cost accounts and financial accounts differ.
Abnormal Losses and Gains: In cost accounts, abnormal losses and gains are computed and
transferred to the Costing Profit and Loss A/c. No such computation is made in the financial
accounts. This results in difference between the profits shown by cost accounts and financial
accounts.
PROFORMA OF A RECONCILIATION STATEMENTPROFORMA OF A RECONCILIATION STATEMENTPROFORMA OF A RECONCILIATION STATEMENTPROFORMA OF A RECONCILIATION STATEMENT
Profit as per cost accounts XX
Add:
1. Income and profits taken in financial accounts and not in cost accounts. XX
2. Notional expenses taken in cost accounts and not in financial accounts. XX
3. Over-absorption overheads in cost accounts. XX
4. Excess valuation of opening inventory in cost accounts as compared to valuation in
financial accounts.
XX
5. Lower valuation of closing inventory in cost accounts as compared to valuation in
financial accounts.
XX
6. Excess depreciation accounted for in cost accounts. XX
Less:
1. Expenses and losses accounted for in financial accounts and not in cost accounts. XX
2. Appropriations in financial accounts only. XX
3. Notional income taken in cost accounts and not in financial accounts. XX
4. Under-absorption of overheads in cost accounts. XX
5. Lower valuation of opening inventory in cost accounts as compared to valuation in
financial accounts.
XX
6. Higher valuation of closing inventory in cost accounts as compared to valuation in
financial accounts.
XX
7. Lower depreciation accounted for in cost accounts. XX
Profit or loss as per Financial A/c XX
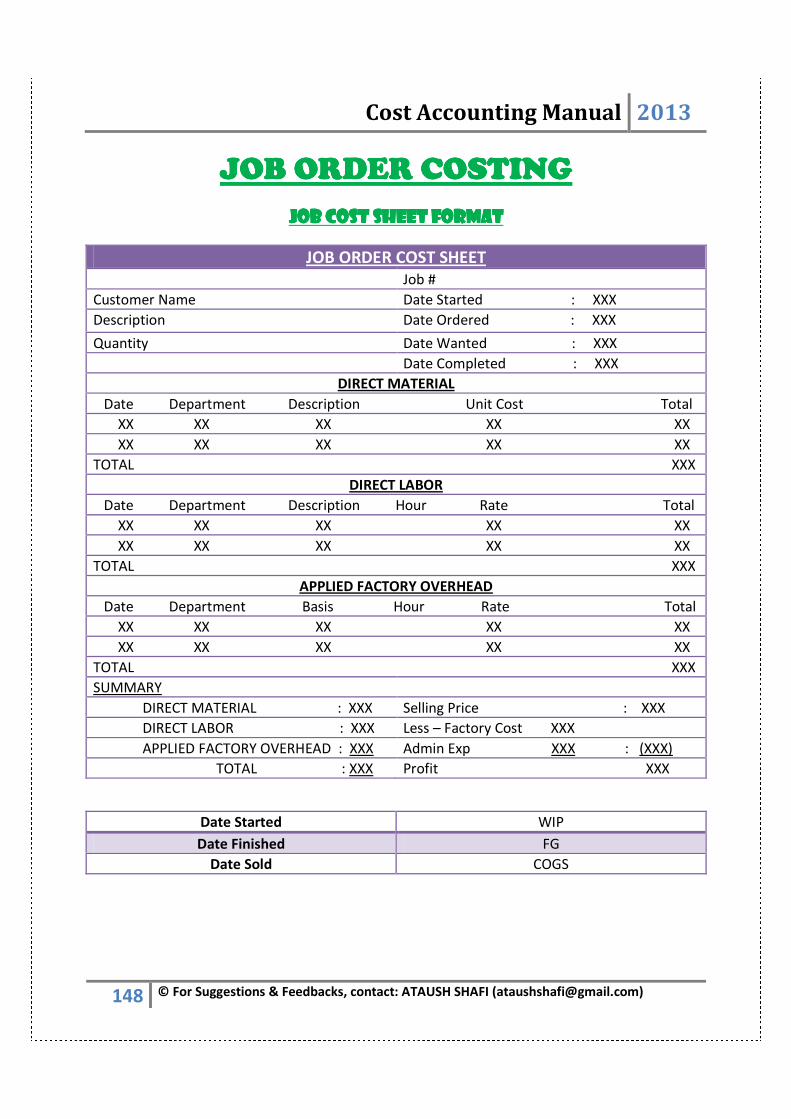
Cost Accounting Manual 2013
148 © For Suggestions & Feedbacks, contact: ATAUSH SHAFI ([email protected])
JOB ORDER COSTINGJOB ORDER COSTINGJOB ORDER COSTINGJOB ORDER COSTING
JOB COST SHEET FORMATJOB COST SHEET FORMATJOB COST SHEET FORMATJOB COST SHEET FORMAT
JOB ORDER COST SHEET
Job #
Customer Name Date Started : XXX
Description Date Ordered : XXX
Quantity Date Wanted : XXX
Date Completed : XXX
DIRECT MATERIAL
Date Department Description Unit Cost Total
XX XX XX XX XX
XX XX XX XX XX
TOTAL XXX
DIRECT LABOR
Date Department Description Hour Rate Total
XX XX XX XX XX
XX XX XX XX XX
TOTAL XXX
APPLIED FACTORY OVERHEAD
Date Department Basis Hour Rate Total
XX XX XX XX XX
XX XX XX XX XX
TOTAL XXX
SUMMARY
DIRECT MATERIAL : XXX Selling Price : XXX
DIRECT LABOR : XXX Less – Factory Cost XXX
APPLIED FACTORY OVERHEAD : XXX Admin Exp XXX : (XXX)
TOTAL : XXX Profit XXX
Date Started WIP
Date Finished FG
Date Sold COGS

Cost Accounting Manual 2013
149 © For Suggestions & Feedbacks, contact: ATAUSH SHAFI ([email protected])
BID PRICE / MINIMUM SALE PRICEBID PRICE / MINIMUM SALE PRICEBID PRICE / MINIMUM SALE PRICEBID PRICE / MINIMUM SALE PRICE
Direct Material XXX
Direct Labor XXX
Factory Overhead XXX
Admin Exp XXX
Selling Exp XXX
Other Exp XXX
Total Cost XXX
Allowance for contingency XXX
Bid Price/ Minimum Sale Price XXX
OVERTIME CASESOVERTIME CASESOVERTIME CASESOVERTIME CASES
BASIC Job Cost Job Cost Job Cost
OVERTIME
PREMIUM
FOH FOH Other Job Cost
RECTIFICATION WORK RECTIFICATION WORK RECTIFICATION WORK RECTIFICATION WORK
Normal Activity Charge to FOH
Not Normal Activity Charge to JOB
CASE # 01
NORMAL
OVERTIME
CASE # 02
OVERTIME DONE AT CLIENT
SPECIAL REQUEST FOR
EARLY JOB COMPLETION
CASE # 03
OVERTIME DONE AT CLIENT
SPECIAL REQUEST FOR
EARLY COMPLETION OF
ANOTHER JOB
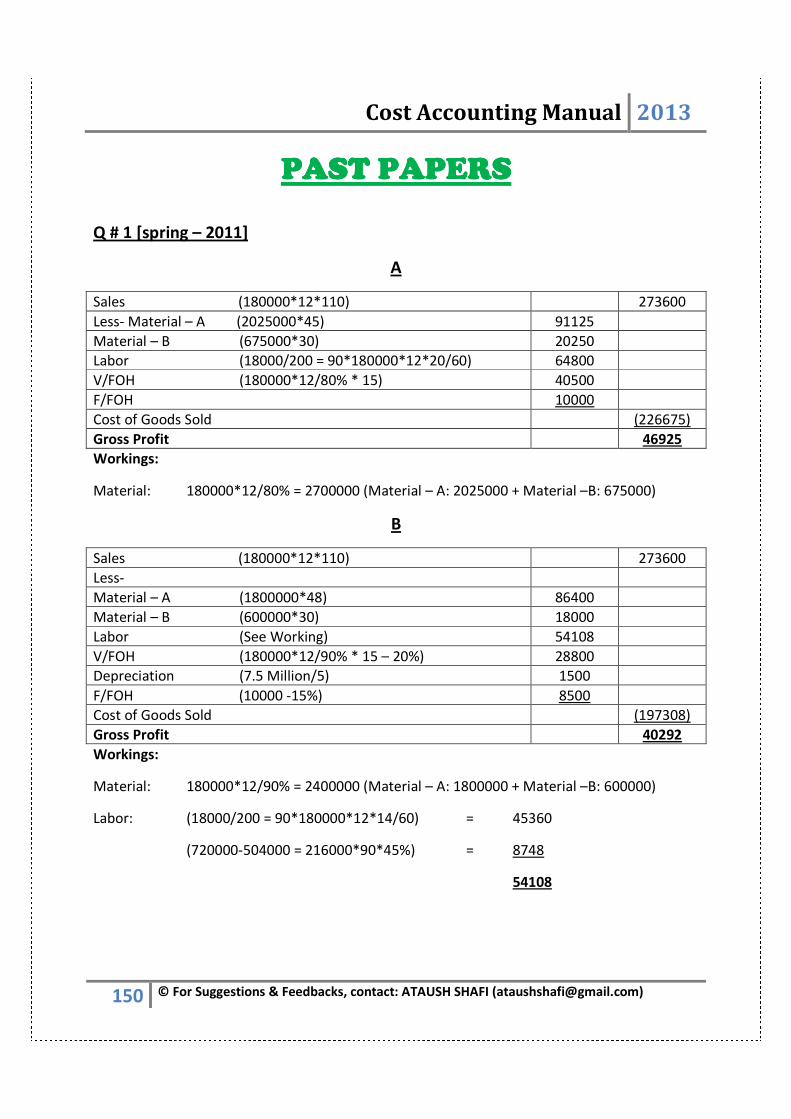
Cost Accounting Manual 2013
150 © For Suggestions & Feedbacks, contact: ATAUSH SHAFI ([email protected])
PAST PAPERSPAST PAPERSPAST PAPERSPAST PAPERS
Q # 1 [spring – 2011]
A
Sales (180000*12*110) 273600
Less- Material – A (2025000*45) 91125
Material – B (675000*30) 20250
Labor (18000/200 = 90*180000*12*20/60) 64800
V/FOH (180000*12/80% * 15) 40500
F/FOH 10000
Cost of Goods Sold (226675)
Gross Profit 46925
Workings:
Material: 180000*12/80% = 2700000 (Material – A: 2025000 + Material –B: 675000)
B
Sales (180000*12*110) 273600
Less-
Material – A (1800000*48) 86400
Material – B (600000*30) 18000
Labor (See Working) 54108
V/FOH (180000*12/90% * 15 – 20%) 28800
Depreciation (7.5 Million/5) 1500
F/FOH (10000 -15%) 8500
Cost of Goods Sold (197308)
Gross Profit 40292
Workings:
Material: 180000*12/90% = 2400000 (Material – A: 1800000 + Material –B: 600000)
Labor: (18000/200 = 90*180000*12*14/60) = 45360
(720000-504000 = 216000*90*45%) = 8748
54108

Cost Accounting Manual 2013
151 © For Suggestions & Feedbacks, contact: ATAUSH SHAFI ([email protected])
Q # 5 [spring – 2011]
PART - A
Sales Quantity = Fixed Cost + Target Profit = 61000+65660 /208 = 608.942 units
C/M Per Unit
Target profit: Profit of Q: 1 = 62540
Shortfall of Q: 2 = 3120 (62540-59420)
65660
C/M Per Unit Revise Sale Price (860-15) = 845
VC = (637)
C/M = 208
Note = 464400/540000 = 860
FOH Selling
580000 84660 26500
540000 80580 25500
40000 4080 1000
VC ( Per Unit) 102 25
FC 25500 12000
VC Per Unit: Material (183.6/540) = 340
Labor (91.8/540) = 170
FOH = 102
Selling = 25
637
Total FC FOH = 25500
Selling = 12000
Admin = 23500
61000
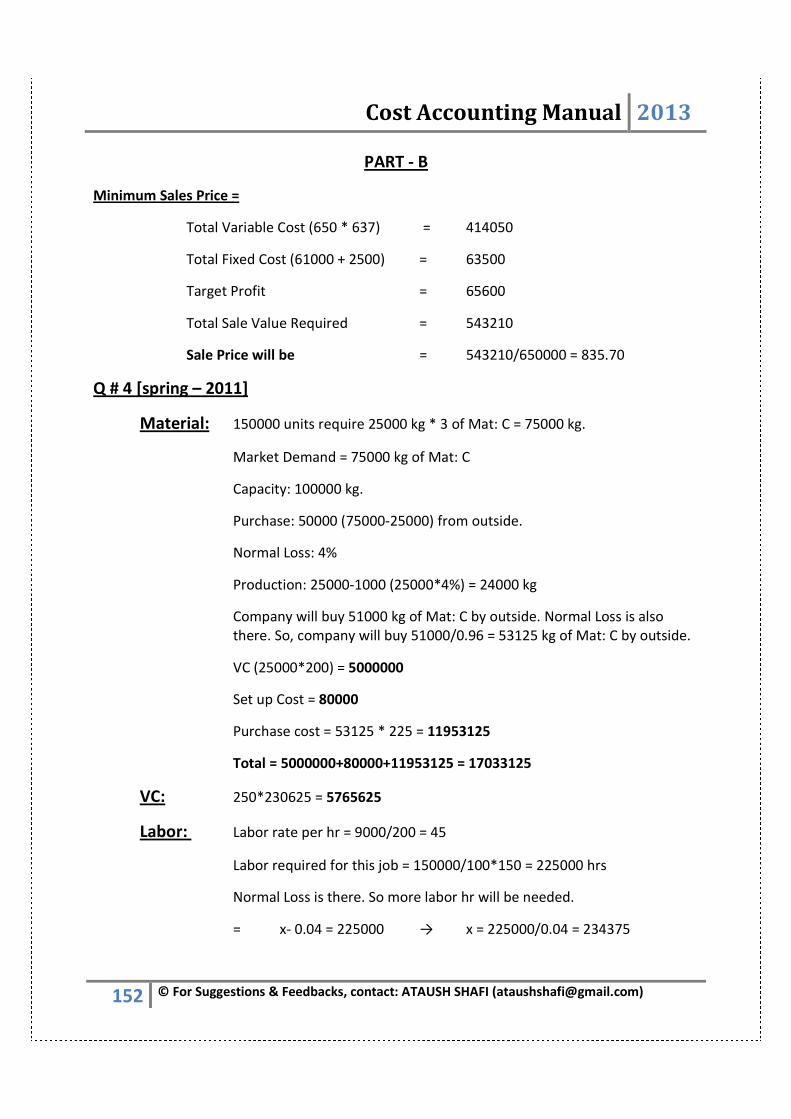
Cost Accounting Manual 2013
152 © For Suggestions & Feedbacks, contact: ATAUSH SHAFI ([email protected])
PART - B
Minimum Sales Price =
Total Variable Cost (650 * 637) = 414050
Total Fixed Cost (61000 + 2500) = 63500
Target Profit = 65600
Total Sale Value Required = 543210
Sale Price will be = 543210/650000 = 835.70
Q # 4 [spring – 2011]
Material: 150000 units require 25000 kg * 3 of Mat: C = 75000 kg.
Market Demand = 75000 kg of Mat: C
Capacity: 100000 kg.
Purchase: 50000 (75000-25000) from outside.
Normal Loss: 4%
Production: 25000-1000 (25000*4%) = 24000 kg
Company will buy 51000 kg of Mat: C by outside. Normal Loss is also
there. So, company will buy 51000/0.96 = 53125 kg of Mat: C by outside.
VC (25000*200) = 5000000
Set up Cost = 80000
Purchase cost = 53125 * 225 = 11953125
Total = 5000000+80000+11953125 = 17033125
VC: 250*230625 = 5765625
Labor: Labor rate per hr = 9000/200 = 45
Labor required for this job = 150000/100*150 = 225000 hrs
Normal Loss is there. So more labor hr will be needed.
= x- 0.04 = 225000 → x = 225000/0.04 = 234375
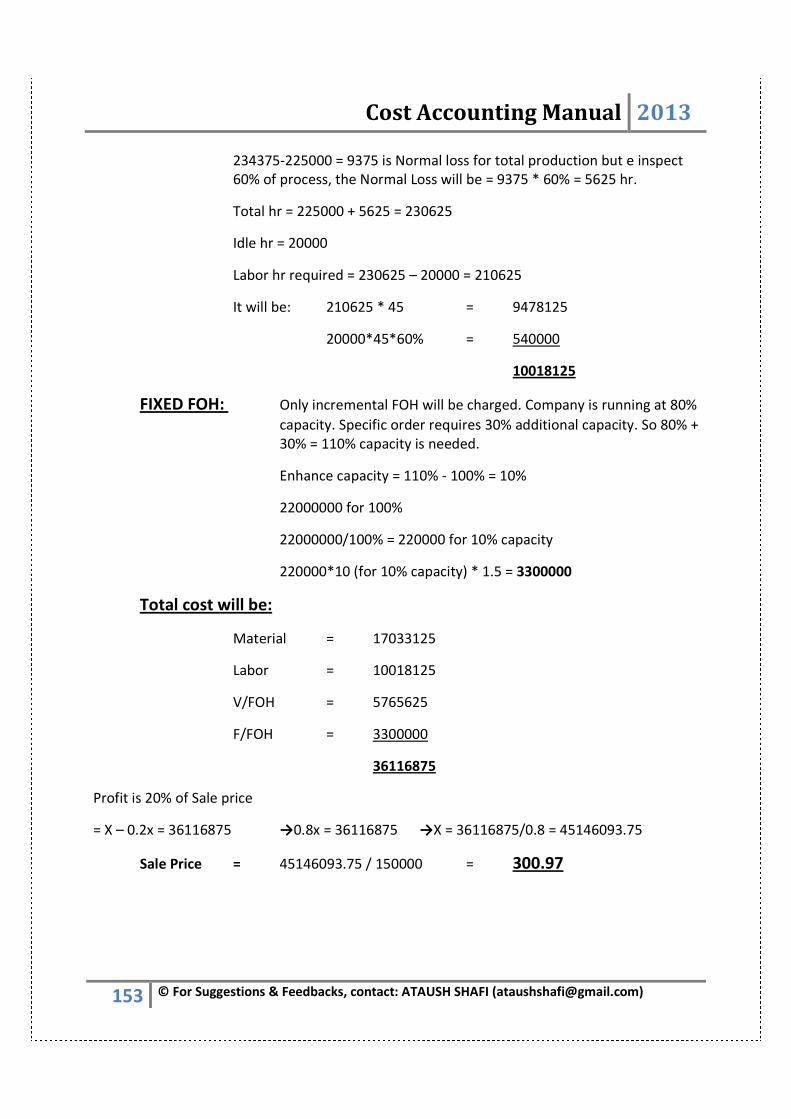
Cost Accounting Manual 2013
153 © For Suggestions & Feedbacks, contact: ATAUSH SHAFI ([email protected])
234375-225000 = 9375 is Normal loss for total production but e inspect
60% of process, the Normal Loss will be = 9375 * 60% = 5625 hr.
Total hr = 225000 + 5625 = 230625
Idle hr = 20000
Labor hr required = 230625 – 20000 = 210625
It will be: 210625 * 45 = 9478125
20000*45*60% = 540000
10018125
FIXED FOH: Only incremental FOH will be charged. Company is running at 80%
capacity. Specific order requires 30% additional capacity. So 80% +
30% = 110% capacity is needed.
Enhance capacity = 110% - 100% = 10%
22000000 for 100%
22000000/100% = 220000 for 10% capacity
220000*10 (for 10% capacity) * 1.5 = 3300000
Total cost will be:
Material = 17033125
Labor = 10018125
V/FOH = 5765625
F/FOH = 3300000
36116875
Profit is 20% of Sale price
= X – 0.2x = 36116875 →0.8x = 36116875 →X = 36116875/0.8 = 45146093.75
Sale Price = 45146093.75 / 150000 = 300.97
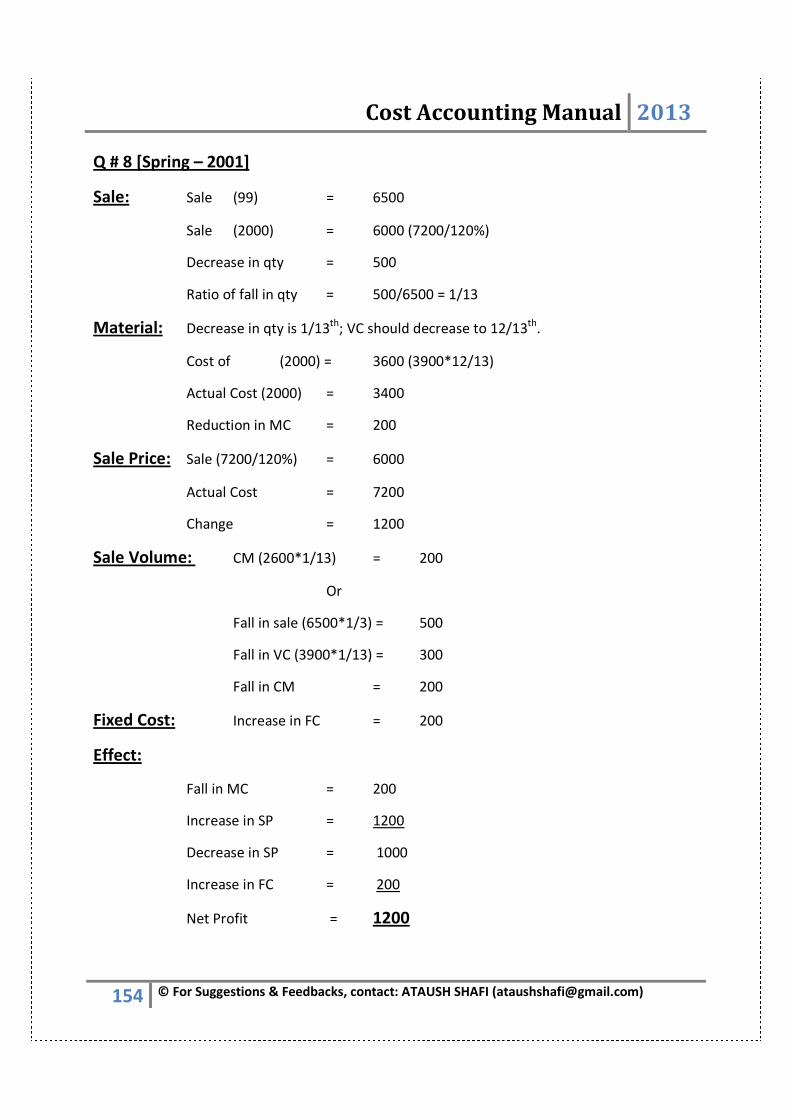
Cost Accounting Manual 2013
154 © For Suggestions & Feedbacks, contact: ATAUSH SHAFI ([email protected])
Q # 8 [Spring – 2001]
Sale: Sale (99) = 6500
Sale (2000) = 6000 (7200/120%)
Decrease in qty = 500
Ratio of fall in qty = 500/6500 = 1/13
Material: Decrease in qty is 1/13th
; VC should decrease to 12/13th
.
Cost of (2000) = 3600 (3900*12/13)
Actual Cost (2000) = 3400
Reduction in MC = 200
Sale Price: Sale (7200/120%) = 6000
Actual Cost = 7200
Change = 1200
Sale Volume: CM (2600*1/13) = 200
Or
Fall in sale (6500*1/3) = 500
Fall in VC (3900*1/13) = 300
Fall in CM = 200
Fixed Cost: Increase in FC = 200
Effect:
Fall in MC = 200
Increase in SP = 1200
Decrease in SP = 1000
Increase in FC = 200
Net Profit = 1200

Cost Accounting Manual 2013
155 © For Suggestions & Feedbacks, contact: ATAUSH SHAFI ([email protected])
Illustration of above:
Year: 1
Actual Qty = 10000 unit
Consumption of DM = 3 kg
DM consume = 30000 kg (10000*3)
AR = 4
AC = Rs: 120000 (10000*3*4)
Year: 2
Actual Qty = 10% increase (10000+10% = 11000)
Consumption of DM per unit = 5% increase (3+5% = 3.15)
AR = 15% increase (4+15% = 4.6)
AC = Rs: 159930 (11000*3.15*4.6)
120000-159930 = 39390 (A)
Check:
Price : 20790 (A) (159390 * 15/115) OR 34650 (4.6-4)
VOL : 12000 (A) (120000 * 10%)
Qty : 6600 (A) (Balancing figure) OR 4 (34650-33000) =6600(A)
Price + Vol + Qty = 20790 (A) + 12000 (A) + 6600 (A) = 39390 (A)
Efficiency Var : SR (AQ – SQA) = 4(34650-33000) = 6600(A)
�� Base year ��Consumption �� Standard per kg ::::/�ٹ /�ٹ /�ٹ /�ٹ �� ����
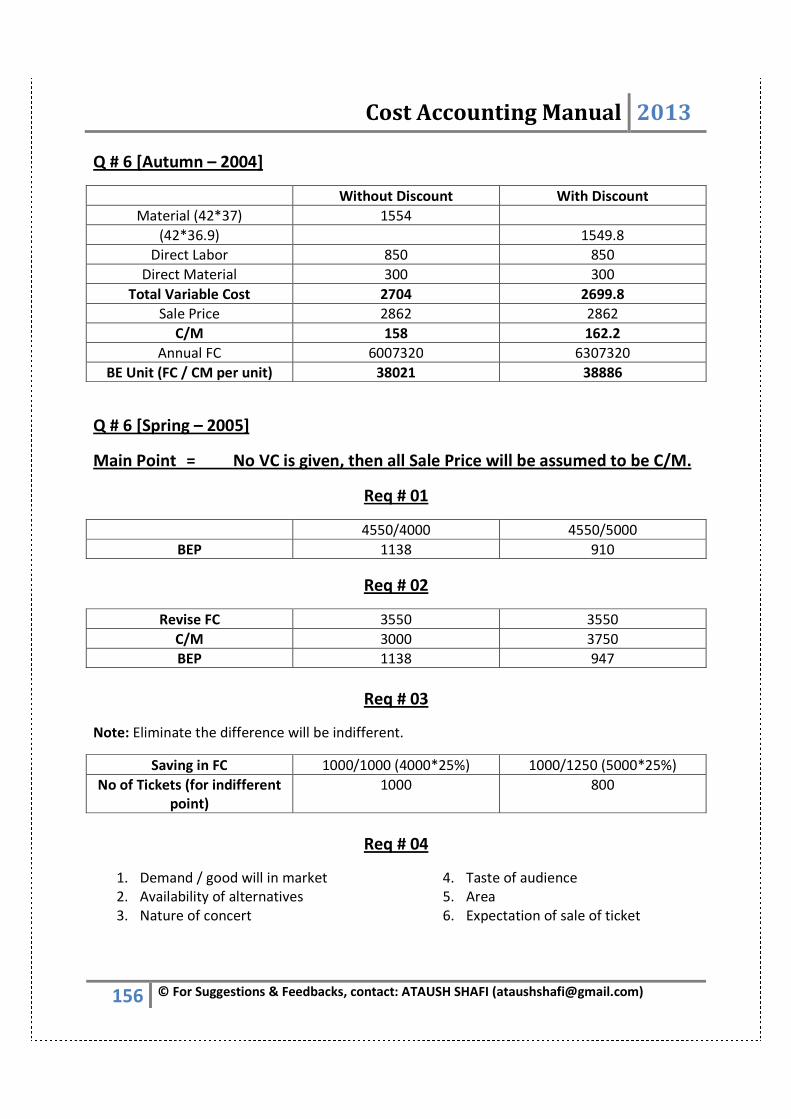
Cost Accounting Manual 2013
156 © For Suggestions & Feedbacks, contact: ATAUSH SHAFI ([email protected])
Q # 6 [Autumn – 2004]
Without Discount With Discount
Material (42*37) 1554
(42*36.9) 1549.8
Direct Labor 850 850
Direct Material 300 300
Total Variable Cost 2704 2699.8
Sale Price 2862 2862
C/M 158 162.2
Annual FC 6007320 6307320
BE Unit (FC / CM per unit) 38021 38886
Q # 6 [Spring – 2005]
Main Point = No VC is given, then all Sale Price will be assumed to be C/M.
Req # 01
4550/4000 4550/5000
BEP 1138 910
Req # 02
Revise FC 3550 3550
C/M 3000 3750
BEP 1138 947
Req # 03
Note: Eliminate the difference will be indifferent.
Saving in FC 1000/1000 (4000*25%) 1000/1250 (5000*25%)
No of Tickets (for indifferent
point)
1000 800
Req # 04
1. Demand / good will in market
2. Availability of alternatives
3. Nature of concert
4. Taste of audience
5. Area
6. Expectation of sale of ticket
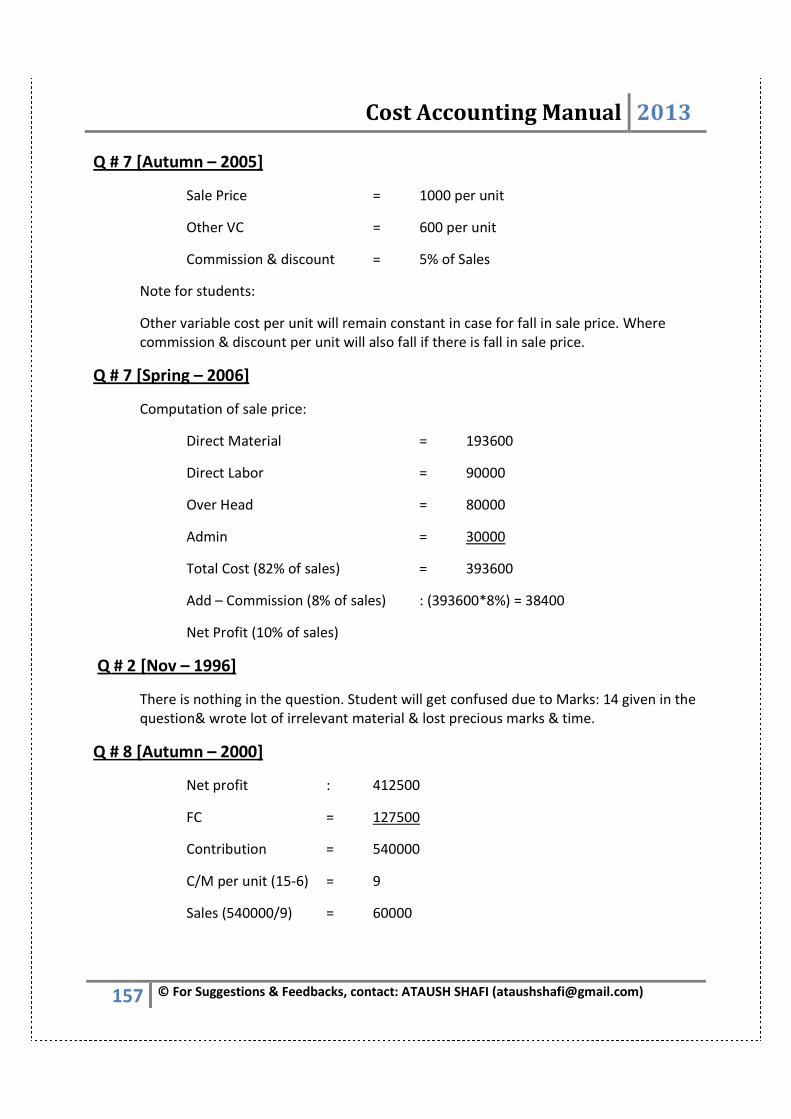
Cost Accounting Manual 2013
157 © For Suggestions & Feedbacks, contact: ATAUSH SHAFI ([email protected])
Q # 7 [Autumn – 2005]
Sale Price = 1000 per unit
Other VC = 600 per unit
Commission & discount = 5% of Sales
Note for students:
Other variable cost per unit will remain constant in case for fall in sale price. Where
commission & discount per unit will also fall if there is fall in sale price.
Q # 7 [Spring – 2006]
Computation of sale price:
Direct Material = 193600
Direct Labor = 90000
Over Head = 80000
Admin = 30000
Total Cost (82% of sales) = 393600
Add – Commission (8% of sales) : (393600*8%) = 38400
Net Profit (10% of sales)
Q # 2 [Nov – 1996]
There is nothing in the question. Student will get confused due to Marks: 14 given in the
question& wrote lot of irrelevant material & lost precious marks & time.
Q # 8 [Autumn – 2000]
Net profit : 412500
FC = 127500
Contribution = 540000
C/M per unit (15-6) = 9
Sales (540000/9) = 60000
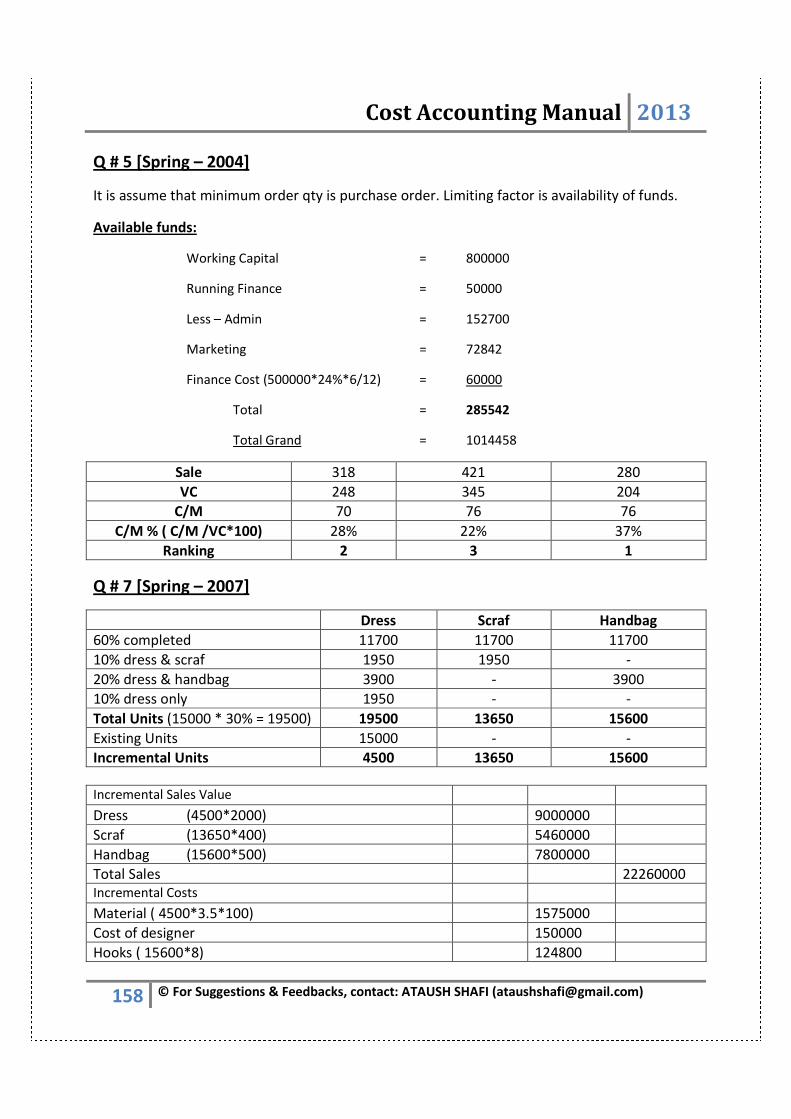
Cost Accounting Manual 2013
158 © For Suggestions & Feedbacks, contact: ATAUSH SHAFI ([email protected])
Q # 5 [Spring – 2004]
It is assume that minimum order qty is purchase order. Limiting factor is availability of funds.
Available funds:
Working Capital = 800000
Running Finance = 50000
Less – Admin = 152700
Marketing = 72842
Finance Cost (500000*24%*6/12) = 60000
Total = 285542
Total Grand = 1014458
Sale 318 421 280
VC 248 345 204
C/M 70 76 76
C/M % ( C/M /VC*100) 28% 22% 37%
Ranking 2 3 1
Q # 7 [Spring – 2007]
Dress Scraf Handbag
60% completed 11700 11700 11700
10% dress & scraf 1950 1950 -
20% dress & handbag 3900 - 3900
10% dress only 1950 - -
Total Units (15000 * 30% = 19500) 19500 13650 15600
Existing Units 15000 - -
Incremental Units 4500 13650 15600
Incremental Sales Value
Dress (4500*2000) 9000000
Scraf (13650*400) 5460000
Handbag (15600*500) 7800000
Total Sales 22260000
Incremental Costs
Material ( 4500*3.5*100) 1575000
Cost of designer 150000
Hooks ( 15600*8) 124800
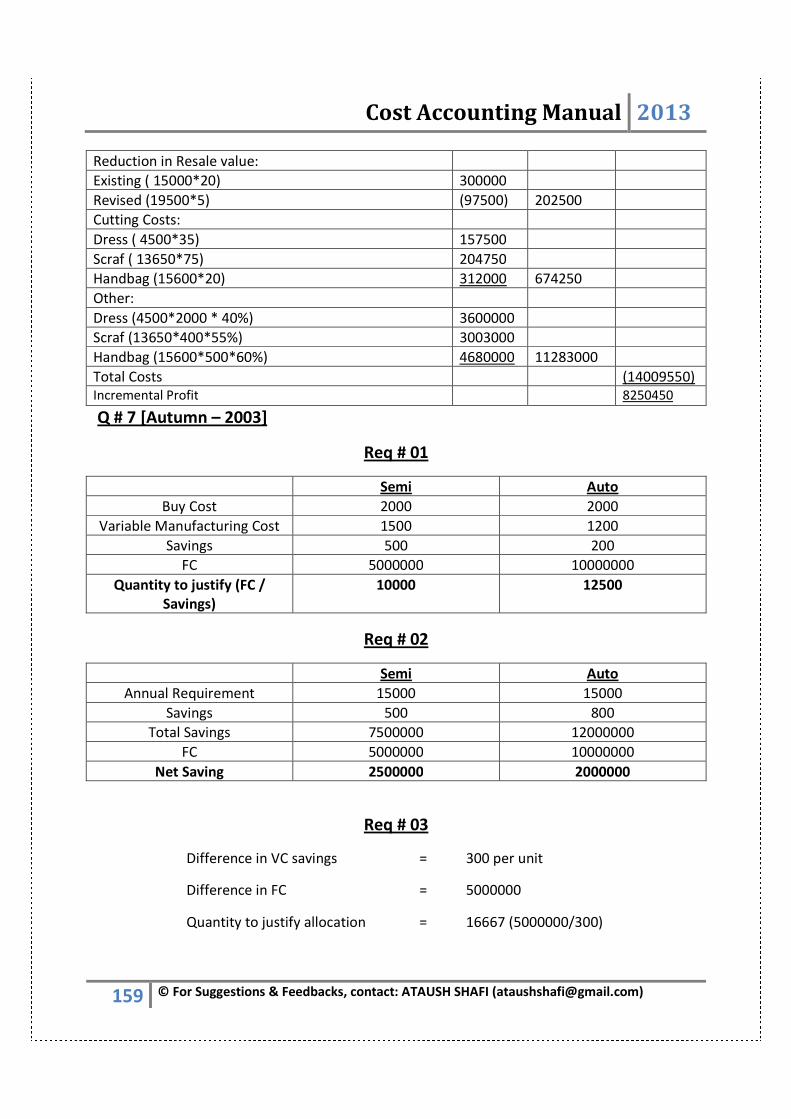
Cost Accounting Manual 2013
159 © For Suggestions & Feedbacks, contact: ATAUSH SHAFI ([email protected])
Reduction in Resale value:
Existing ( 15000*20) 300000
Revised (19500*5) (97500) 202500
Cutting Costs:
Dress ( 4500*35) 157500
Scraf ( 13650*75) 204750
Handbag (15600*20) 312000 674250
Other:
Dress (4500*2000 * 40%) 3600000
Scraf (13650*400*55%) 3003000
Handbag (15600*500*60%) 4680000 11283000
Total Costs (14009550)
Incremental Profit 8250450
Q # 7 [Autumn – 2003]
Req # 01
Semi Auto
Buy Cost 2000 2000
Variable Manufacturing Cost 1500 1200
Savings 500 200
FC 5000000 10000000
Quantity to justify (FC /
Savings)
10000 12500
Req # 02
Semi Auto
Annual Requirement 15000 15000
Savings 500 800
Total Savings 7500000 12000000
FC 5000000 10000000
Net Saving 2500000 2000000
Req # 03
Difference in VC savings = 300 per unit
Difference in FC = 5000000
Quantity to justify allocation = 16667 (5000000/300)
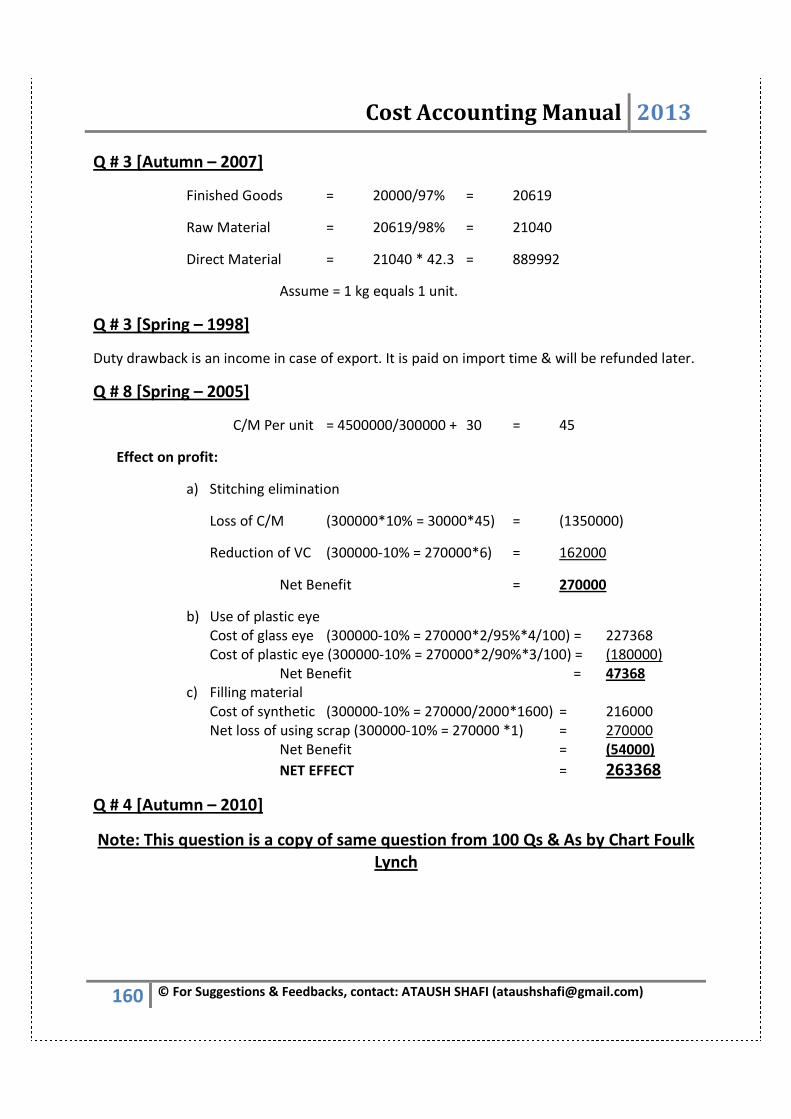
Cost Accounting Manual 2013
160 © For Suggestions & Feedbacks, contact: ATAUSH SHAFI ([email protected])
Q # 3 [Autumn – 2007]
Finished Goods = 20000/97% = 20619
Raw Material = 20619/98% = 21040
Direct Material = 21040 * 42.3 = 889992
Assume = 1 kg equals 1 unit.
Q # 3 [Spring – 1998]
Duty drawback is an income in case of export. It is paid on import time & will be refunded later.
Q # 8 [Spring – 2005]
C/M Per unit = 4500000/300000 + 30 = 45
Effect on profit:
a) Stitching elimination
Loss of C/M (300000*10% = 30000*45) = (1350000)
Reduction of VC (300000-10% = 270000*6) = 162000
Net Benefit = 270000
b) Use of plastic eye
Cost of glass eye (300000-10% = 270000*2/95%*4/100) = 227368
Cost of plastic eye (300000-10% = 270000*2/90%*3/100) = (180000)
Net Benefit = 47368
c) Filling material
Cost of synthetic (300000-10% = 270000/2000*1600) = 216000
Net loss of using scrap (300000-10% = 270000 *1) = 270000
Net Benefit = (54000)
NET EFFECT = 263368
Q # 4 [Autumn – 2010]
Note: This question is a copy of same question from 100 Qs & As by Chart Foulk
Lynch
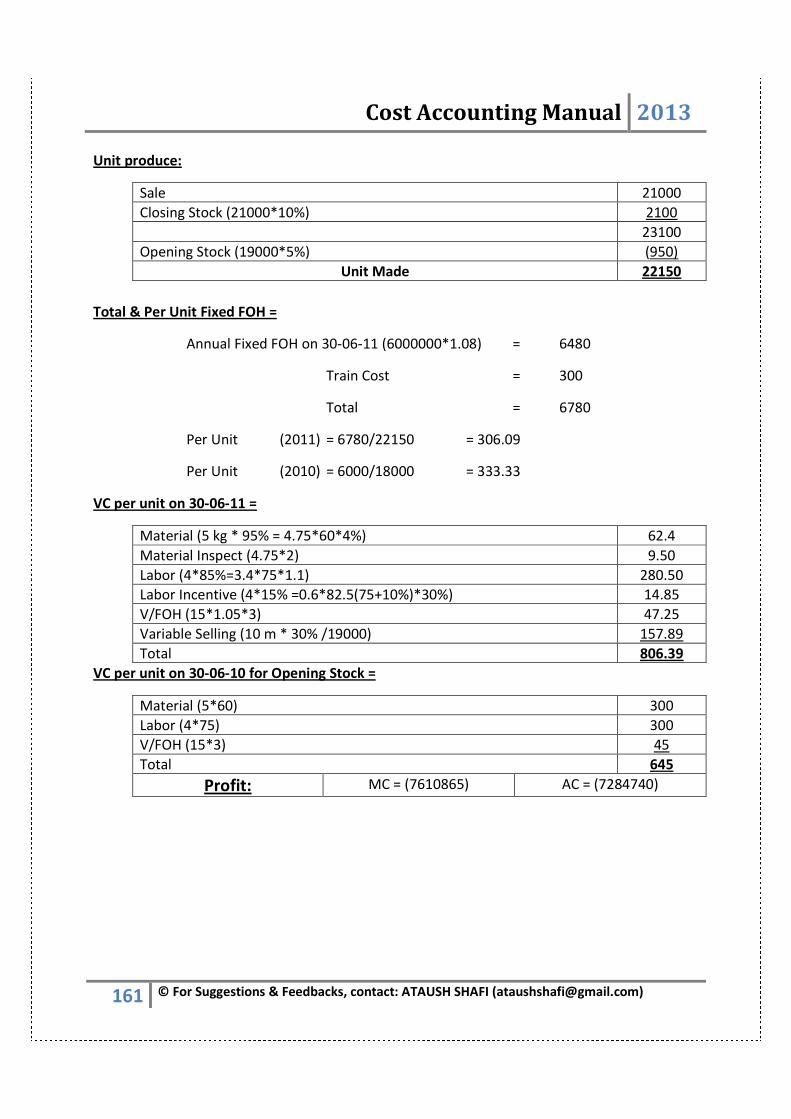
Cost Accounting Manual 2013
161 © For Suggestions & Feedbacks, contact: ATAUSH SHAFI ([email protected])
Unit produce:
Sale 21000
Closing Stock (21000*10%) 2100
23100
Opening Stock (19000*5%) (950)
Unit Made 22150
Total & Per Unit Fixed FOH =
Annual Fixed FOH on 30-06-11 (6000000*1.08) = 6480
Train Cost = 300
Total = 6780
Per Unit (2011) = 6780/22150 = 306.09
Per Unit (2010) = 6000/18000 = 333.33
VC per unit on 30-06-11 =
Material (5 kg * 95% = 4.75*60*4%) 62.4
Material Inspect (4.75*2) 9.50
Labor (4*85%=3.4*75*1.1) 280.50
Labor Incentive (4*15% =0.6*82.5(75+10%)*30%) 14.85
V/FOH (15*1.05*3) 47.25
Variable Selling (10 m * 30% /19000) 157.89
Total 806.39
VC per unit on 30-06-10 for Opening Stock =
Material (5*60) 300
Labor (4*75) 300
V/FOH (15*3) 45
Total 645
Profit: MC = (7610865) AC = (7284740)
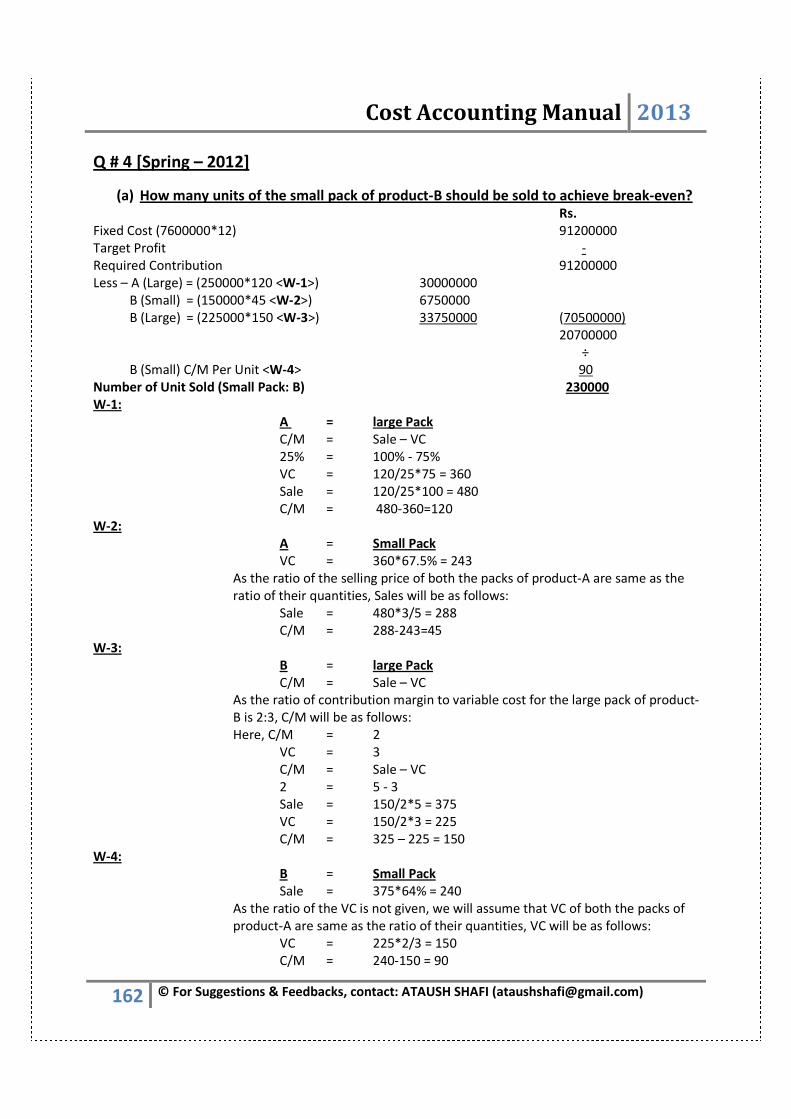
Cost Accounting Manual 2013
162 © For Suggestions & Feedbacks, contact: ATAUSH SHAFI ([email protected])
Q # 4 [Spring – 2012]
(a) How many units of the small pack of product-B should be sold to achieve break-even? Rs.
Fixed Cost (7600000*12) 91200000
Target Profit -
Required Contribution 91200000
Less – A (Large) = (250000*120 <W-1>) 30000000
B (Small) = (150000*45 <W-2>) 6750000
B (Large) = (225000*150 <W-3>) 33750000 (70500000)
20700000
÷
B (Small) C/M Per Unit <W-4> 90
Number of Unit Sold (Small Pack: B) 230000
W-1:
A = large Pack
C/M = Sale – VC
25% = 100% - 75%
VC = 120/25*75 = 360
Sale = 120/25*100 = 480
C/M = 480-360=120
W-2:
A = Small Pack
VC = 360*67.5% = 243
As the ratio of the selling price of both the packs of product-A are same as the
ratio of their quantities, Sales will be as follows:
Sale = 480*3/5 = 288
C/M = 288-243=45
W-3:
B = large Pack
C/M = Sale – VC
As the ratio of contribution margin to variable cost for the large pack of product-
B is 2:3, C/M will be as follows:
Here, C/M = 2
VC = 3
C/M = Sale – VC
2 = 5 - 3
Sale = 150/2*5 = 375
VC = 150/2*3 = 225
C/M = 325 – 225 = 150
W-4:
B = Small Pack
Sale = 375*64% = 240
As the ratio of the VC is not given, we will assume that VC of both the packs of
product-A are same as the ratio of their quantities, VC will be as follows:
VC = 225*2/3 = 150
C/M = 240-150 = 90

Cost Accounting Manual 2013
163 © For Suggestions & Feedbacks, contact: ATAUSH SHAFI ([email protected])
(b) How many units of the small pack of product-B should be sold to earn a net income of
Rs. 10,530,000? Applicable tax rate for the company is 25%.
Rs.
Fixed Cost (7600000*12) 91200000
Target Profit (10530000/1 – 0.25) 14040000
Required Contribution 105240000
Less – A (Large) = (250000*120 <W-1>) 30000000
B (Small) = (150000*45 <W-2>) 6750000
B (Large) = (225000*150 <W-3>) 33750000 (70500000)
34740000
÷
B (Small) C/M Per Unit <W-4> 90
Number of Unit Sold (Small Pack: B) 386000
(c) Based on the results of (b) above prepares a product wise and consolidated income
statement for the period ending 31 December 2012.
PRODUCT WISE INCOME STATEMENT
Products Sale Per
Unit
VC Per Unit Sale Volume Sales VC C/M
A – Large Pack 480 360 250000 120000000 90000000 30000000
A – Small Pack 288 243 150000 43200000 36450000 6750000
B – large Pack 375 225 225000 84375000 50625000 33750000
B – Small Pack 240 150 386000 92640000 57900000 34740000
CONSOLIDATED INCOME STATEMENT
Rs.
Sales 340215000
Less - VC (234975000)
C/M 105240000
Less - FC (91200000)
Budgeted Profit Before Tax 14040000
Less - Tax (3510000)
Budgeted Profit After Tax 10530000
Q # 8 [Autumn – 2012]
1. Manager annual salary amounting Rs: 2500/- is irrelevant as it is past cost.
2. Fixed Overhead @ Rs: 25/- per DLH is irrelevant for decision making.
3. Motor adjustment will be as follows:

Cost Accounting Manual 2013
164 © For Suggestions & Feedbacks, contact: ATAUSH SHAFI ([email protected])
Required : 120 ft
Available : (300 ft)
Balance : 180 ft
4. Where there is required balance less than the available balance & material is of regular
use, we will always work out relevant cost as follows:
Required units * current replacement price
120*68 = Rs: 8160
Required : 130 ft (80 ft + 50 ft)
Available : (60 ft)
Balance : 70 ft
5. Where minimum quantity is given, this is the required units & remaining units is of no
use to entity hence being irrelevant. Relevant cost will be calculated as: 60*10 = Rs:
600/-.
6. Whenever we bought any material from outside market, then full purchase cost will be
relevant. Therefore, relevant cost is: Rs: 2400 (30*80).
7. Labor Case:
• 100 hours are idle hours (spare capacity) & idle hours are always irrelevant for
decision making.
• There are two alternatives given in labor case which means that there is
opportunity cost. In opportunity cost, lower of two alternatives will always be
selected.
• Alternative # 01: Overtime is Rs: 3450/- (23 * 150)
• Alternative # 02: Temporary workers cost is Rs: 3150/- (21*150) + Rs: 100 (20*5)
= Rs: 3250/-.
• Lower of Rs: 3450/- or Rs: 3250/- will be selected. Hence Rs: 3250/- will be
selected for Direct Labor cost.
8. Monthly rent of Rs: 5000/- relates to last year & hence irrelevant.
9. Spare capacity of 110 hours is irrelevant for decision making.
10. Guarantee rate of Rs: 20/- is irrelevant.
Q # 3 [Autumn – 2012]
Assume that:
X = % of Direct Labor (FOH)
Y = % of Direct Material (AOH)

Cost Accounting Manual 2013
165 © For Suggestions & Feedbacks, contact: ATAUSH SHAFI ([email protected])
We know that total cost is calculated as follows:
Direct Material + Direct Labor + Direct Expenses + Factory Overhead
Applying the above formula on data given in the question:
Petal Leaf
Direct Material 20000 (250*80) 16000 (125*128)
Direct Labor 18000 (720*25) 24000 (960*25)
Factory Overhead 18000 X 24000 X
Admin Overhead 20000 Y 16000 Y
Total Cost 52000 (Calculated as below) 56000 (Calculated as below)
We know the formula of Profit i.e. Profit = Sale – Cost. Apply this formula on data
given in the question:
25% ON COST=
Profit = Sale – Cost
25% = 125% - 100%
= 65000/125*100 = 52000.
30% ON SALES PRICE=
Profit = Sale – Cost
30% = 100% - 70%
= 80000/100*70 = 56000.
38000 + 18000 X + 20000 Y = 52000 - - - - - Equ: 1
40000 + 24000 X + 24000 Y = 56000 -------- Equ: 2
Multiply equation # 2 with 0.75, we will get:
30000 + 18000 X + 12000 Y = 42000
So, we get this equation:
38000 + 18000 X + 20000 Y = 52000
30000 + 18000 X + 12000 Y = 42000
8000 + 0 X + 8000 Y = 10000
8000 Y = 10000-8000
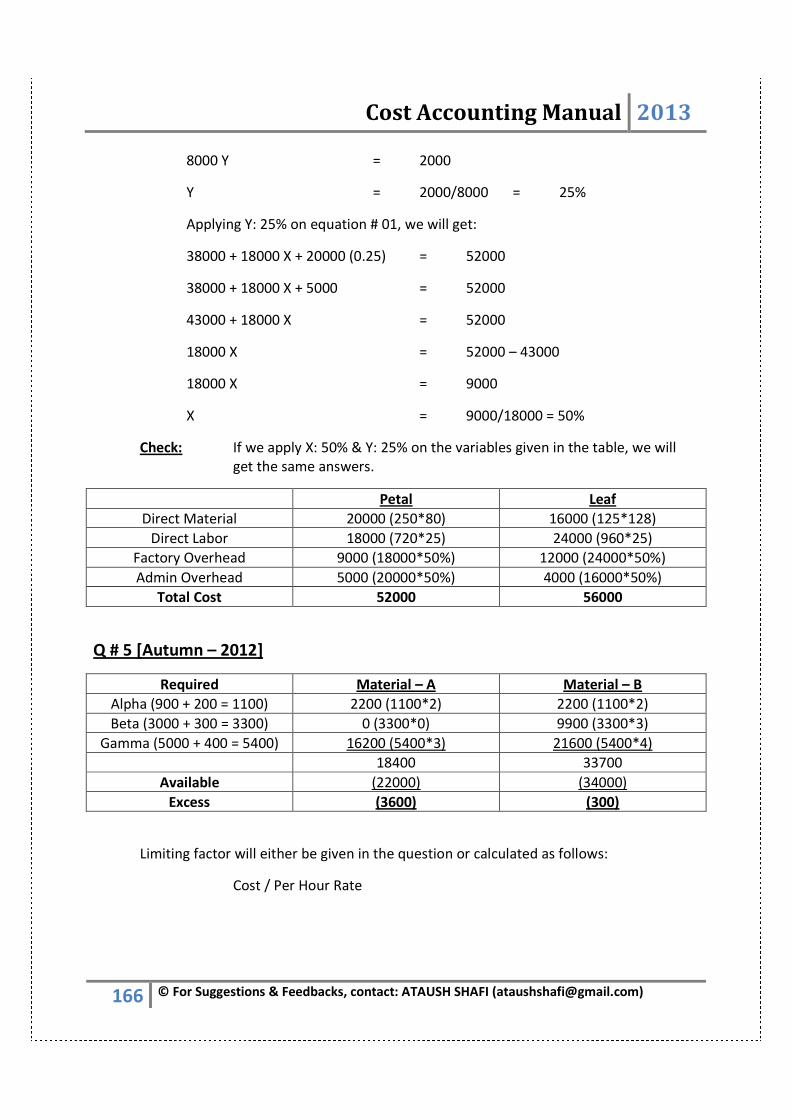
Cost Accounting Manual 2013
166 © For Suggestions & Feedbacks, contact: ATAUSH SHAFI ([email protected])
8000 Y = 2000
Y = 2000/8000 = 25%
Applying Y: 25% on equation # 01, we will get:
38000 + 18000 X + 20000 (0.25) = 52000
38000 + 18000 X + 5000 = 52000
43000 + 18000 X = 52000
18000 X = 52000 – 43000
18000 X = 9000
X = 9000/18000 = 50%
Check: If we apply X: 50% & Y: 25% on the variables given in the table, we will
get the same answers.
Petal Leaf
Direct Material 20000 (250*80) 16000 (125*128)
Direct Labor 18000 (720*25) 24000 (960*25)
Factory Overhead 9000 (18000*50%) 12000 (24000*50%)
Admin Overhead 5000 (20000*50%) 4000 (16000*50%)
Total Cost 52000 56000
Q # 5 [Autumn – 2012]
Required Material – A Material – B
Alpha (900 + 200 = 1100) 2200 (1100*2) 2200 (1100*2)
Beta (3000 + 300 = 3300) 0 (3300*0) 9900 (3300*3)
Gamma (5000 + 400 = 5400) 16200 (5400*3) 21600 (5400*4)
18400 33700
Available (22000) (34000)
Excess (3600) (300)
Limiting factor will either be given in the question or calculated as follows:
Cost / Per Hour Rate
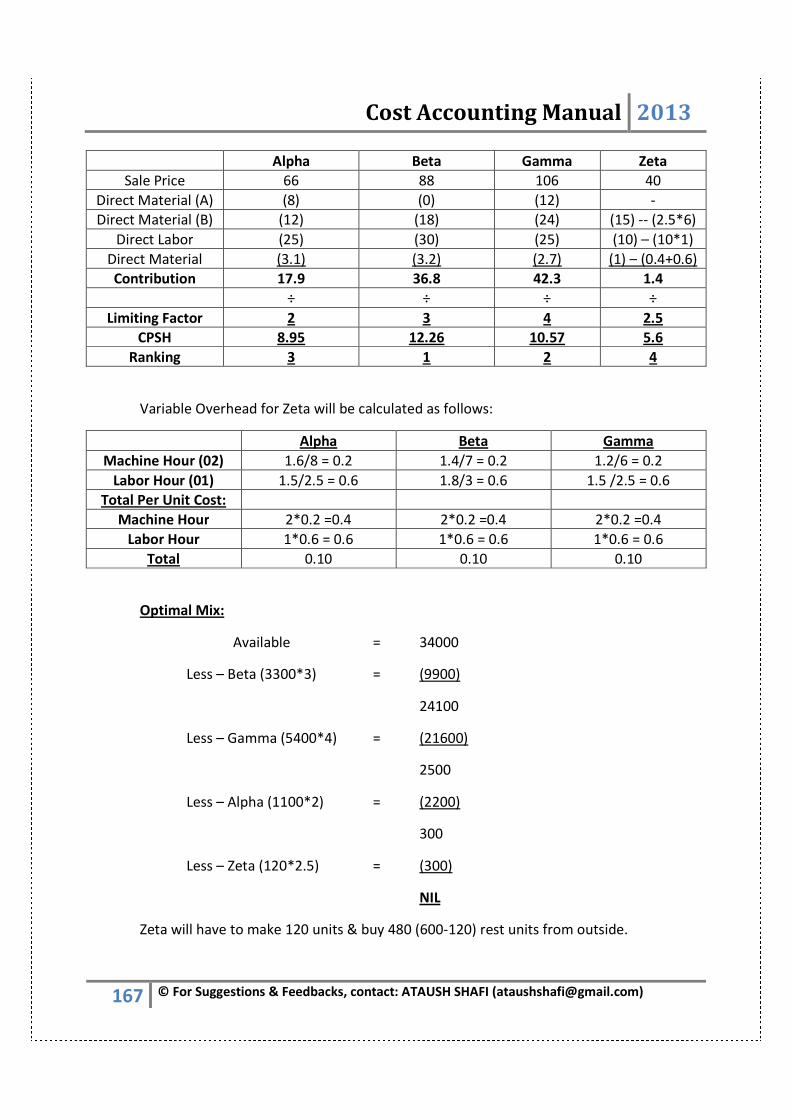
Cost Accounting Manual 2013
167 © For Suggestions & Feedbacks, contact: ATAUSH SHAFI ([email protected])
Alpha Beta Gamma Zeta
Sale Price 66 88 106 40
Direct Material (A) (8) (0) (12) -
Direct Material (B) (12) (18) (24) (15) -- (2.5*6)
Direct Labor (25) (30) (25) (10) – (10*1)
Direct Material (3.1) (3.2) (2.7) (1) – (0.4+0.6)
Contribution 17.9 36.8 42.3 1.4
÷ ÷ ÷ ÷
Limiting Factor 2 3 4 2.5
CPSH 8.95 12.26 10.57 5.6
Ranking 3 1 2 4
Variable Overhead for Zeta will be calculated as follows:
Alpha Beta Gamma
Machine Hour (02) 1.6/8 = 0.2 1.4/7 = 0.2 1.2/6 = 0.2
Labor Hour (01) 1.5/2.5 = 0.6 1.8/3 = 0.6 1.5 /2.5 = 0.6
Total Per Unit Cost:
Machine Hour 2*0.2 =0.4 2*0.2 =0.4 2*0.2 =0.4
Labor Hour 1*0.6 = 0.6 1*0.6 = 0.6 1*0.6 = 0.6
Total 0.10 0.10 0.10
Optimal Mix:
Available = 34000
Less – Beta (3300*3) = (9900)
24100
Less – Gamma (5400*4) = (21600)
2500
Less – Alpha (1100*2) = (2200)
300
Less – Zeta (120*2.5) = (300)
NIL
Zeta will have to make 120 units & buy 480 (600-120) rest units from outside.

Cost Accounting Manual 2013
168 © For Suggestions & Feedbacks, contact: ATAUSH SHAFI ([email protected])
Q # 7 [Autumn – 2012]
5 Months 7 Months
Capacity 87500
(300000*5/12*70%)
161000
(300000*7/12*92%)
Sale Price (87500*34) 2975000 ?
Direct Material (87500*12) & (161000*12) (1050000) (1932000)
Direct Labor (Higher of Rs: 8/- OR Rs: 150000
per month)
(750000)
(1288000)
Variable Overhead (87500*6) & (161000*6) (262500) (472500)
Semi Variable (262500) (472500)
Fixed Overhead (750000*5/12) &
(750000*7/12)
(312500) (437500)
Profit 75000
Cost for 7 months 5096000
Semi-variable cost will be calculated as follows:
At 55% Capacity 37500 (450000/12)
At 70% Capacity 52500 (4500000+180000
= 630000/12)
262500 (52500*5)
At 92% Capacity 67500 (630000+180000
= 810000/12)
472500 (67500*7)
We know that required sale price is calculated as: Required contribution/Unit Produced
Total profit for the year = 5 Months Profit + 7 months Profit
936000 = 75000 + 7 months Profit
7 months Profit = 936000-75000 = 861000
Putting the data in the formula:
Required Contribution = Fixed Cost + Target Profit
Unit Produced
= 861000 + 5096000
161000
= Rs: 37 Per Unit
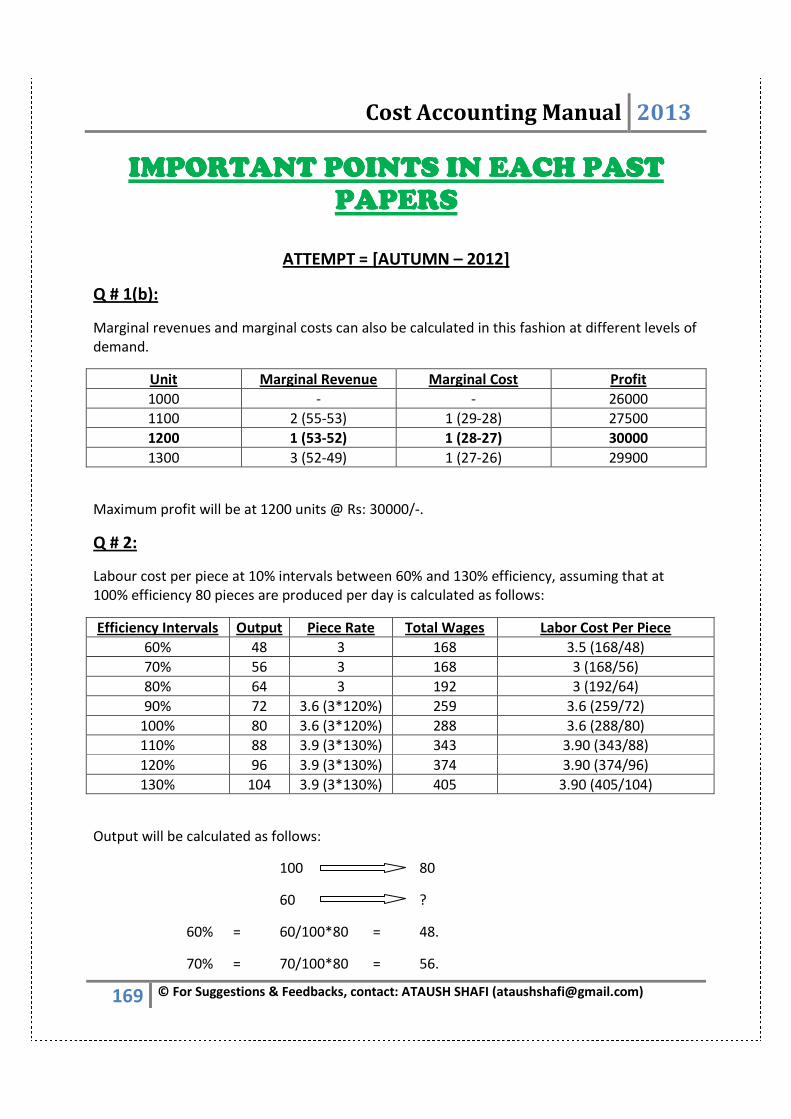
Cost Accounting Manual 2013
169 © For Suggestions & Feedbacks, contact: ATAUSH SHAFI ([email protected])
IMPORTANT POINTS IN EACH PAST IMPORTANT POINTS IN EACH PAST IMPORTANT POINTS IN EACH PAST IMPORTANT POINTS IN EACH PAST
PAPERSPAPERSPAPERSPAPERS
ATTEMPT = [AUTUMN – 2012]
Q # 1(b):
Marginal revenues and marginal costs can also be calculated in this fashion at different levels of
demand.
Unit Marginal Revenue Marginal Cost Profit
1000 - - 26000
1100 2 (55-53) 1 (29-28) 27500
1200 1 (53-52) 1 (28-27) 30000
1300 3 (52-49) 1 (27-26) 29900
Maximum profit will be at 1200 units @ Rs: 30000/-.
Q # 2:
Labour cost per piece at 10% intervals between 60% and 130% efficiency, assuming that at
100% efficiency 80 pieces are produced per day is calculated as follows:
Efficiency Intervals Output Piece Rate Total Wages Labor Cost Per Piece
60% 48 3 168 3.5 (168/48)
70% 56 3 168 3 (168/56)
80% 64 3 192 3 (192/64)
90% 72 3.6 (3*120%) 259 3.6 (259/72)
100% 80 3.6 (3*120%) 288 3.6 (288/80)
110% 88 3.9 (3*130%) 343 3.90 (343/88)
120% 96 3.9 (3*130%) 374 3.90 (374/96)
130% 104 3.9 (3*130%) 405 3.90 (405/104)
Output will be calculated as follows:
100 80
60 ?
60% = 60/100*80 = 48.
70% = 70/100*80 = 56.

Cost Accounting Manual 2013
170 © For Suggestions & Feedbacks, contact: ATAUSH SHAFI ([email protected])
80% = 80/100*80 = 64.
90% = 90/100*80 = 72.
100% = 100/100*80 = 80.
110% = 110/100*80 = 88.
120% = 120/100*80 = 96.
130% = 130/100*80 = 104.
Q # 6:
Tested units’ means final product ready for sold. There should be department for testing
& the cost would be associated to testing the units. We can refer to this as Unit
Transferred.
ATTEMPT = [AUTUMN – 2011]
Q # 3:
1. Production cost budget = DM + DL +V/FOH + F/FOH
2. Direct Labor will be calculated as follows:
75000/4 = 18750 + 10% = 20625/0.96 * 3 = 64453.
Q # 4:
EPR will be calculated as follows = WIP % * Completion %
50% * 40% 20%
20% * 30% 6%
30% * 24.5% 7.35%
33.35%
Q # 6:
1. When variable cost will not be given, then all variable cost is cost of good sold.
2. Average stock level = Min + Max / 2
ATTEMPT = [AUTUMN – 2010]
Q # 1:
1. Direct labor hr will be used to allocate FOH.
2. Cost per unit = FOH cost / unit produced
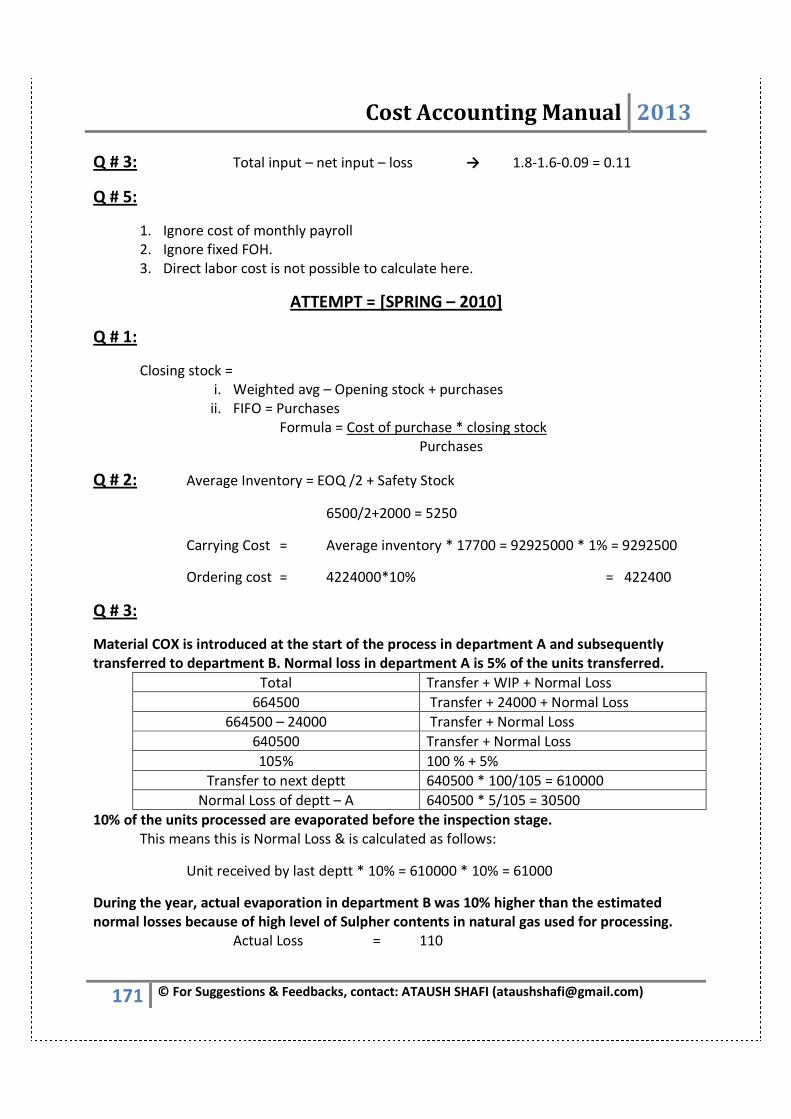
Cost Accounting Manual 2013
171 © For Suggestions & Feedbacks, contact: ATAUSH SHAFI ([email protected])
Q # 3: Total input – net input – loss → 1.8-1.6-0.09 = 0.11
Q # 5:
1. Ignore cost of monthly payroll
2. Ignore fixed FOH.
3. Direct labor cost is not possible to calculate here.
ATTEMPT = [SPRING – 2010]
Q # 1:
Closing stock =
i. Weighted avg – Opening stock + purchases ii. FIFO = Purchases
Formula = Cost of purchase * closing stock Purchases
Q # 2: Average Inventory = EOQ /2 + Safety Stock
6500/2+2000 = 5250
Carrying Cost = Average inventory * 17700 = 92925000 * 1% = 9292500
Ordering cost = 4224000*10% = 422400
Q # 3:
Material COX is introduced at the start of the process in department A and subsequently
transferred to department B. Normal loss in department A is 5% of the units transferred.
Total Transfer + WIP + Normal Loss
664500 Transfer + 24000 + Normal Loss
664500 – 24000 Transfer + Normal Loss
640500 Transfer + Normal Loss
105% 100 % + 5%
Transfer to next deptt 640500 * 100/105 = 610000
Normal Loss of deptt – A 640500 * 5/105 = 30500
10% of the units processed are evaporated before the inspection stage.
This means this is Normal Loss & is calculated as follows:
Unit received by last deptt * 10% = 610000 * 10% = 61000
During the year, actual evaporation in department B was 10% higher than the estimated
normal losses because of high level of Sulpher contents in natural gas used for processing.
Actual Loss = 110

Cost Accounting Manual 2013
172 © For Suggestions & Feedbacks, contact: ATAUSH SHAFI ([email protected])
Normal Loss = 100
Abnormal Loss = 10
Abnormal Loss Amount = 61000*10/100 = 6100
Q # 4:
1. Standard qty + Closing FG – Opening FG = Purchases
2. Purchases are calculated as follows:
Standard Qty (unit made * per hr) XXX
Add – Adverse Material Usage Variance (Variance /30) XXX
Less – Favorable Material Usage Variance (Variance /30) XXX
Add – Closing FG (Standard Qty * days given /365) XXX
Less – Opening FG (Standard Qty * days given /365) XXX
ATTEMPT = [AUTUMN – 2009]
Q # 2:
1. Always record actual FOH in FOH distribution sheet.
2. Actual FOH will be found at FOH distribution sheet.
Q # 3:
1. Total contribution % = Total contribution / total sales * 100
2. BEP = FC / Total contribution %
Q # 4:
1. Purchase Cost = Demand * unit price
2. Transport Cost = Quantity / Capacity * No of order = XXX * one trip cost given
3. Hired Cost = Highest EOQ * third party rate (add in second unit)

Cost Accounting Manual 2013
173 © For Suggestions & Feedbacks, contact: ATAUSH SHAFI ([email protected])
EXAM RUBRICEXAM RUBRICEXAM RUBRICEXAM RUBRIC
DECISION MAKING DECISION MAKING DECISION MAKING DECISION MAKING
EXAM RUBRIC: Purchase new equipment which would cost Rs. 240 million and have a useful
life of six years with no salvage value. The company uses straight-line method of depreciation.
ACCOUNTING TREATMENT: A notion that depreciation on new machine being a fixed cost will
be ignored is partially correct. But at the same time it is relevant cost as it could, be avoided if
the other equipment were purchased from external supplier.
EXAM RUBRIC: Fixed overhead: 1) Depreciation = 60 2) General overheads = 30
ACCOUNTING TREATMENT: Ignore fixed overhead of all types unless a direction is given in the
question. Another option was to include these but in that case one should give a note
explaining their assumption.
EXAM RUBRIC: Skilled labour can work on other contracts which are presently operated by
semiskilled labour who have been hired on temporary basis at a cost of Rs. 325,000 per month.
The company will need to give them a notice of 30 days before terminating their services.
ACCOUNTING TREATMENT: Skilled labour required for this contract could have been used to
replace the semi-skilled workers who were working on other contracts and had been hired on
temporary basis. The amount payable to such semi-skilled workers was Rs. 3.9 million
(325,000x12). Consequently, many students took Rs. 3.9 million as the opportunity cost. In
doing so, they ignored the information that even if the semi-skilled labour were laid off, 30 days
salary would have to be paid to them and consequently the company will only be saving Rs.
3,575,000. On the other hand, many students erroneously took the opportunity cost as Rs.
4,225,000 i.e. equal to 13 months salaries of the unskilled labour.
EXAM RUBRIC:
1. DM rate: 42.3
2. Unit: 20000
3. Reject rate: 2%
ACCOUNTING TREATMENT:
1. DM cost will be calculated as follows = 20000*42.3*100/98
2. FG rejection rate will be calculated as follows = Cost /100-% * %
EXAM RUBRIC: Purchase cost plus additional charges
ACCOUNTING TREATMENT: Cost * 100/100+%

Cost Accounting Manual 2013
174 © For Suggestions & Feedbacks, contact: ATAUSH SHAFI ([email protected])
EXAM RUBRIC: Which component to be purchased from supplier
ACCOUNTING TREATMENT: Lowest cost will be ranked higher than highest cost.
EXAM RUBRIC:
SALES X Y Z
Refined 6 5.50 7
Unrefined 2.50 2.75 4
ACCOUNTING TREATMENT: When two revenue figures are given in the question, we will
incremental revenue.
SALES X Y Z
Refined 6 5.50 7
Unrefined 2.50 2.75 4
Incremental Revenue 3.5 2.75 3
EXAM RUBRIC:
Pentagon Hexagon Octagon
Sales price per unit (Rs.) 2300 1550 2000
Material cost per Kg. (Rs.) 250 250 250
Labour time per unit (Minutes) 20 30 45
Machine time per unit (Hours) 4 2.5 3
Net weight per unit of finished product (Kg.) 6 4 5
Yield (%) 90 95 92
Estimated demand (Units) 10000 20000 9000
Each worker is paid monthly wages of Rs. 15,000 and works a total of 200 hours per month. BL’s total
overheads are estimated at 20% of the material cost. Fixed overheads are estimated at Rs. 5 million per
month and are allocated to each product on the basis of machine hours. 100,000 machine hours are
estimated to be available in February 2012.
ACCOUNTING TREATMENT:
Material + Labor + Variable FOH will be calculated as follows:
Pentagon Hexagon Octagon
Material Cost (Material cost per kg * Net
Weight / Yield)
250*6/0.90 =
1666.67
250*4/0.95 =
1052.63
250*5/0.92 =
1358.70
Labour Cost 15000/200 = 75
* 20/60 = 25
15000/200 = 75
*30/60 = 37.5
15000/200 =
75*45/60 =
56.25
Variable FOH (see box below for calculation) 133.33 85.33 121.74

Cost Accounting Manual 2013
175 © For Suggestions & Feedbacks, contact: ATAUSH SHAFI ([email protected])
Variable FOH calculation:
Total Overhead = Fixed FOH + Variable FOH
20% of Material = Fixed FOH + Variable FOH
FOR PENTAGON: 1666.67*20% → 333.33 =333.33 – 200 (5000000/100000*4) = 133.33
FOR HEXAGON: 1052.63*20% → 210.53 =210.53 – 125 (5000000/100000*2.5) = 85.53
FOR OCTAGON: 1666.67*20% → 271.74 =271.74 – 150 (5000000/100000*3) = 121.74
BREAK EVEN POINTBREAK EVEN POINTBREAK EVEN POINTBREAK EVEN POINT
NOTE:
1. Whenever sales increases. All variable cost will increase unless specified.
2. No Variable cost, all sales price will be contribution margin.
EXAM RUBRIC: Compute the break-even point in units if the company offers a discount of 10%
on purchase of 20 bottles or more, assuming that 20% of the sales will be to buyers who will
avail the discount.
ACCOUNTING TREATMENT: Correct discount calculation will be:
10% discount on 20% of Rs: 16 → 16*20% = 3.2 *10% = 0.32 paisa per bottle.
EXAM RUBRIC:
2006 2007
Production 175000 225000
Total Costs 11900000 16518600
Rate of inflation in 2007: 15%
Required: Variable cost & fixed costs in real terms.
ACCOUNTING TREATMENT: Real Rate for current year = current year cost /1+ inflation rate
= 16518600/1.15 = 14364000.
Production Total Costs
2007 225000 14364000
2006 175000 11900000
Difference 50000 2464000
Variable cost per unit = 2464000/50000 = 49.28
Fixed cost = 14364000 – (225000*49.28) = 14364000 – 11088000 = 3276000

Cost Accounting Manual 2013
176 © For Suggestions & Feedbacks, contact: ATAUSH SHAFI ([email protected])
EXAM RUBRIC: When per unit cost of sales & variable cost is not given in breakeven mix case.
ACCOUNTING TREATMENT:
BEP = FIXED COSTS
C/M * individual ratio
EXAM RUBRIC: What price per unit to be quoted for the next year if it is desired to earn 10%
profit on sales assuming that the variable cost will increase by 10%, fixed cost by 10% &
production by 10%.
Variable cost = 4400 → Unit = 1100 → FC= 1595000
ACCOUNTING TREATMENT:
When sales increase, variable expense increases by same ratio.
Sale = variable cost + fixed cost + profit
No of unit * sale price per unit = No of unit * variable cost per unit + fixed cost + No of
unit * sale price per unit * 10%
1100*S = 1100*4400 + 1595000+ (1100*S) * 10%
1100 S = 4840000 + 1595000 + 110S
1100 S – 110 S = 6435000
S = 6435000 / 990
S = 6500 units
ENTRIESENTRIESENTRIESENTRIES
EXAM RUBRIC: The valuation is carried out by the Finance Department using stores
memorandum record.
ACCOUNTING TREATMENT: It exhibits that only quantity is recorded in the stores ledger.
LABORLABORLABORLABOR
EXAM RUBRIC: bonus hours
ACCOUNTING TREATMENT: bonus hours will be compared with direct hours worked.
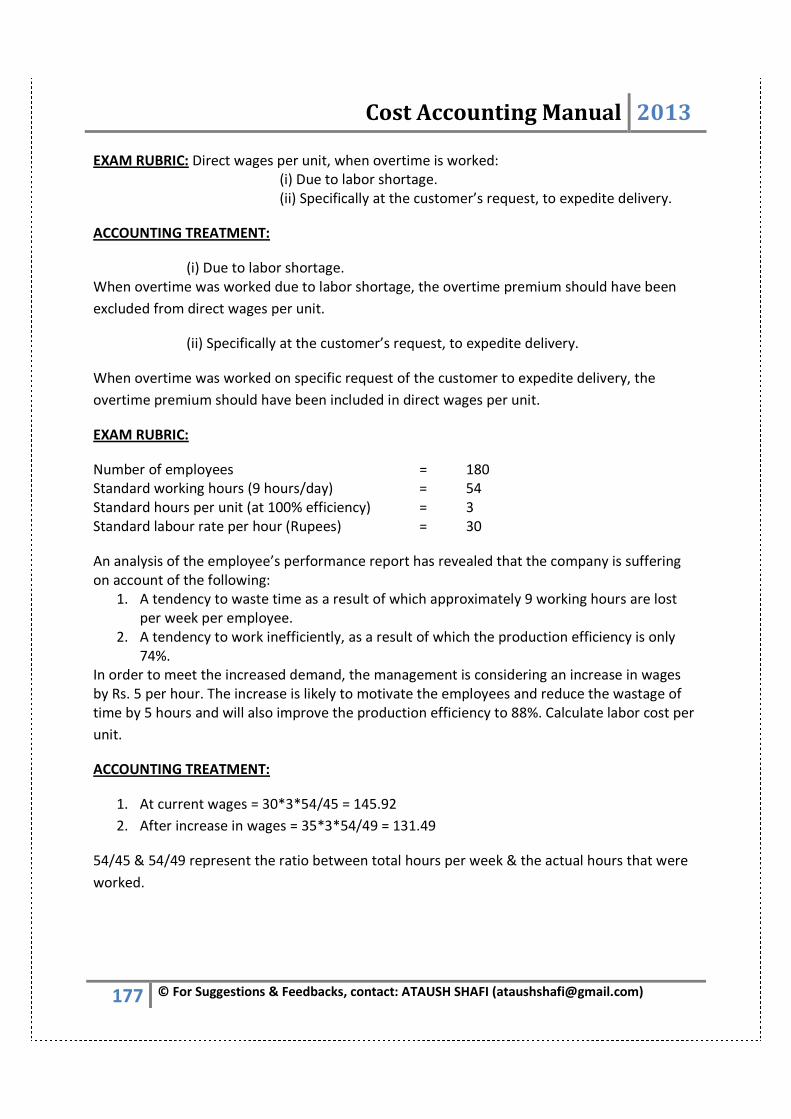
Cost Accounting Manual 2013
177 © For Suggestions & Feedbacks, contact: ATAUSH SHAFI ([email protected])
EXAM RUBRIC: Direct wages per unit, when overtime is worked:
(i) Due to labor shortage.
(ii) Specifically at the customer’s request, to expedite delivery.
ACCOUNTING TREATMENT:
(i) Due to labor shortage.
When overtime was worked due to labor shortage, the overtime premium should have been
excluded from direct wages per unit.
(ii) Specifically at the customer’s request, to expedite delivery.
When overtime was worked on specific request of the customer to expedite delivery, the
overtime premium should have been included in direct wages per unit.
EXAM RUBRIC:
Number of employees = 180
Standard working hours (9 hours/day) = 54
Standard hours per unit (at 100% efficiency) = 3
Standard labour rate per hour (Rupees) = 30
An analysis of the employee’s performance report has revealed that the company is suffering
on account of the following:
1. A tendency to waste time as a result of which approximately 9 working hours are lost
per week per employee.
2. A tendency to work inefficiently, as a result of which the production efficiency is only
74%.
In order to meet the increased demand, the management is considering an increase in wages
by Rs. 5 per hour. The increase is likely to motivate the employees and reduce the wastage of
time by 5 hours and will also improve the production efficiency to 88%. Calculate labor cost per
unit.
ACCOUNTING TREATMENT:
1. At current wages = 30*3*54/45 = 145.92
2. After increase in wages = 35*3*54/49 = 131.49
54/45 & 54/49 represent the ratio between total hours per week & the actual hours that were
worked.
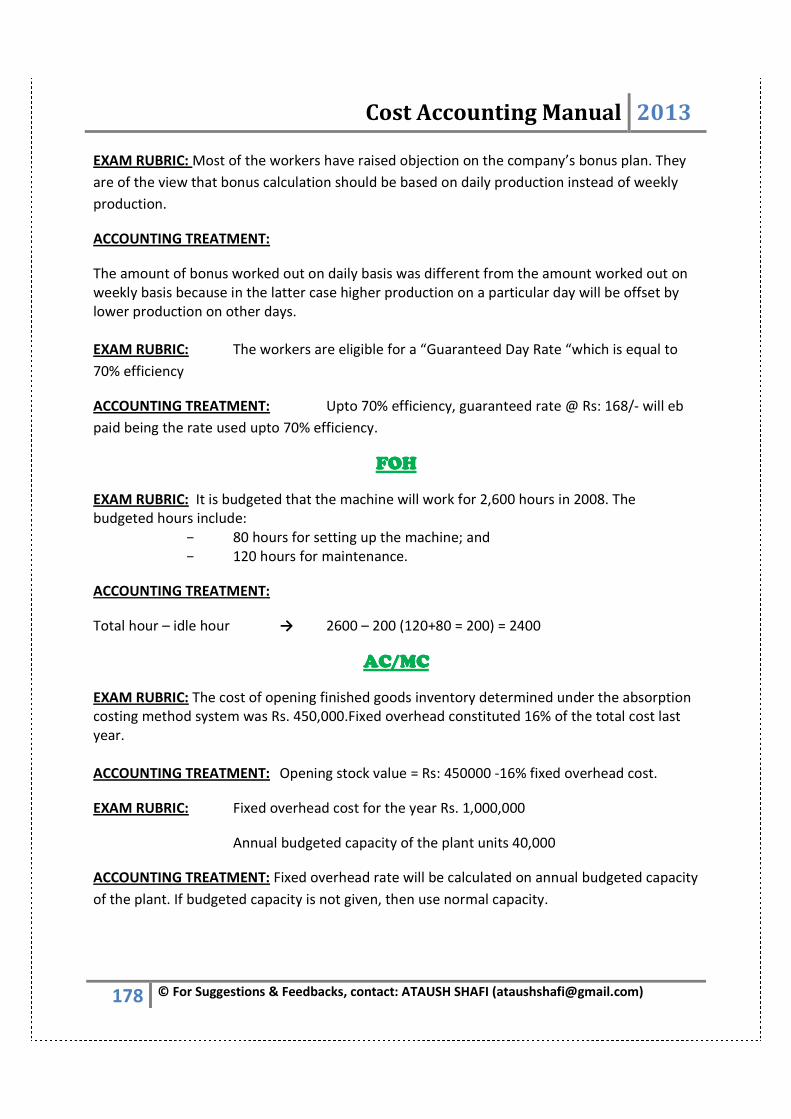
Cost Accounting Manual 2013
178 © For Suggestions & Feedbacks, contact: ATAUSH SHAFI ([email protected])
EXAM RUBRIC: Most of the workers have raised objection on the company’s bonus plan. They
are of the view that bonus calculation should be based on daily production instead of weekly
production.
ACCOUNTING TREATMENT:
The amount of bonus worked out on daily basis was different from the amount worked out on
weekly basis because in the latter case higher production on a particular day will be offset by
lower production on other days.
EXAM RUBRIC: The workers are eligible for a “Guaranteed Day Rate “which is equal to
70% efficiency
ACCOUNTING TREATMENT: Upto 70% efficiency, guaranteed rate @ Rs: 168/- will eb
paid being the rate used upto 70% efficiency.
FOHFOHFOHFOH
EXAM RUBRIC: It is budgeted that the machine will work for 2,600 hours in 2008. The
budgeted hours include:
− 80 hours for setting up the machine; and
− 120 hours for maintenance.
ACCOUNTING TREATMENT:
Total hour – idle hour → 2600 – 200 (120+80 = 200) = 2400
AC/AC/AC/AC/MCMCMCMC
EXAM RUBRIC: The cost of opening finished goods inventory determined under the absorption
costing method system was Rs. 450,000.Fixed overhead constituted 16% of the total cost last
year.
ACCOUNTING TREATMENT: Opening stock value = Rs: 450000 -16% fixed overhead cost.
EXAM RUBRIC: Fixed overhead cost for the year Rs. 1,000,000
Annual budgeted capacity of the plant units 40,000
ACCOUNTING TREATMENT: Fixed overhead rate will be calculated on annual budgeted capacity
of the plant. If budgeted capacity is not given, then use normal capacity.

Cost Accounting Manual 2013
179 © For Suggestions & Feedbacks, contact: ATAUSH SHAFI ([email protected])
EXAM RUBRIC:
Direct materials per unit = 0.8 kg at Rs. 60 per kg
Labour per unit = 27 minutes at Rs. 80 per hour
Variable production overheads = Rs. 40 per labour hour
Fixed production overheads, at a normal output level of 105,000 units per month, are estimated at Rs.
2,100,000.
ACCOUNTING TREATMENT:
Material + Labor + Variable FOH will be calculated as follows:
Direct materials per unit = (120000*0.8*60) = 5760000
Labour per unit = (120000*27/60*80) = 4320000
Variable production overheads = (120000*27/60*40) = 2160000
Fixed production overheads = (2100000*120000/105000) = 2400000
• Where minutes are given, it will always be divided by 60.
• Production Cost (DM + DL + FOH) will be multiplied by production units & selling cost (selling
FOH) by sale units unless stated otherwise & writes this assumption in the paper as note.
MATERIALMATERIALMATERIALMATERIAL
EXAM RUBRIC: Godown rent of Rs. 10,000 per month
ACCOUNTING TREATMENT: This will not be included in carrying cost calculation.
EXAM RUBRIC: What would be the safety stock and re-order point if the company is willing to
take:
1. a 20% risk of being out of stock?
2. a 10% risk of being out of stock?
ACCOUNTING TREATMENT: If the company is ready to take 20% risk of being out of stock
meant that it needed to keep sufficient safety stock to ensure that it would only be out of stock
if the lead time reached 13 days or in other words it would need to reorder when 12 days stock
was left. i.e. the re- order point should be 12 days.
The average usage per day was 450 units (162000/360)
Since the usual lead time was 11 days, safety stock should be equal to 12-11=1 day’s stock i.e.
450 units & re-ordering point was 450*12 = 5400 units

Cost Accounting Manual 2013
180 © For Suggestions & Feedbacks, contact: ATAUSH SHAFI ([email protected])
EXAM RUBRIC:
Ordered Quantity Unit price Rs.
Upto 999 units 160.00
1000 to 1999 units 158.40
2000 or more units 156.80
ACCOUNTING TREATMENT:
1. Take lower class boundaries i.e 999, 1000 & 2000 as annual demand for calculating EOQ.
2. Quantity discount will be calculated as follows:
i. Purchase Cost = unit made * cost per unit * (100% - % given)
ii. Ordering Cost = Annual demand * ordering cost / EOQ
iii. Carrying Cost = EOQ * Carrying Cost/2 * (100% - % given)
EXAM RUBRIC: When next order be placed?
ACCOUNTING TREATMENT:
1 - Frequency = 365/ No of order
2 – Days Supply left = Unit in inventory /EOQ * Frequency
3 – Supply left – lead time
EXAM RUBRIC: Holding cost per year
ACCOUNTING TREATMENT: (EOQ /2 * safety stock) * Carrying cost
EXAM RUBRIC: ABC CHART
Material Code Yearly Usage Unit Cost Total Cost
TX01 10000 0.50 5000
TX02 7100 0.65 4615
TX03 2000 2.50 5000
TX04 5250 2.00 10500
TX05 6000 1.75 10500
TX06 2750 0.80 2200
TX07 1500 1.00 1500
TX08 5500 1.85 10175
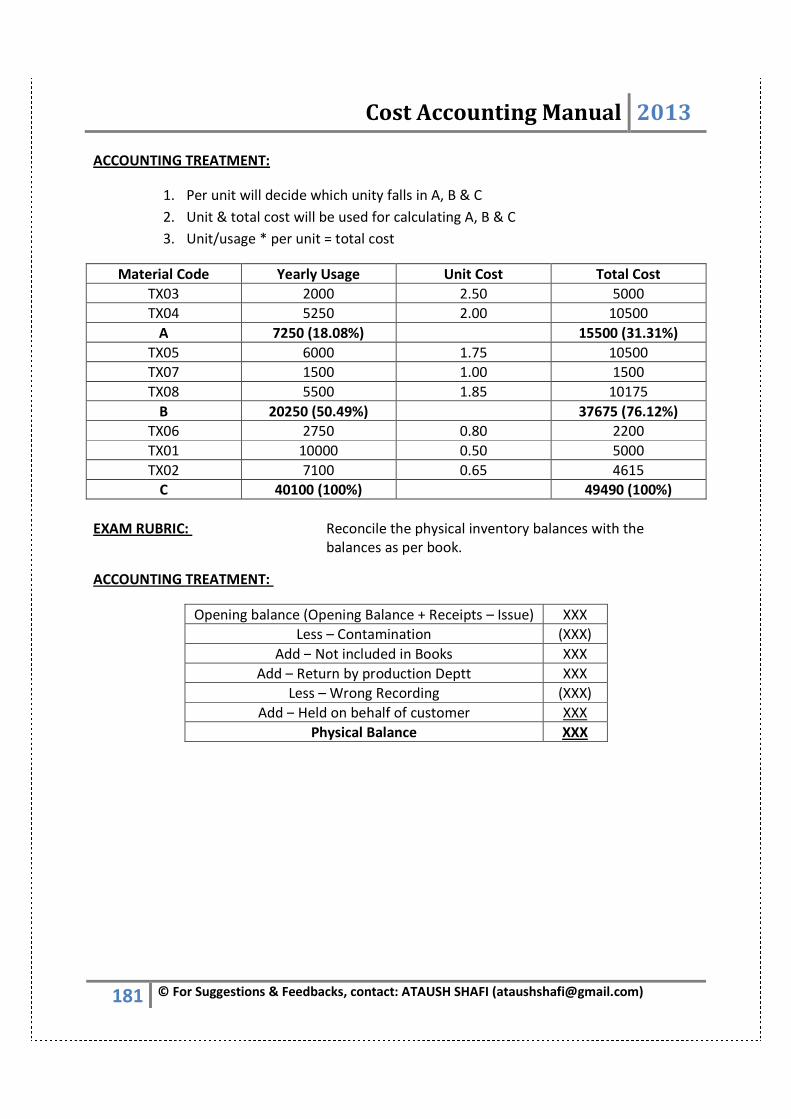
Cost Accounting Manual 2013
181 © For Suggestions & Feedbacks, contact: ATAUSH SHAFI ([email protected])
ACCOUNTING TREATMENT:
1. Per unit will decide which unity falls in A, B & C
2. Unit & total cost will be used for calculating A, B & C
3. Unit/usage * per unit = total cost
Material Code Yearly Usage Unit Cost Total Cost
TX03 2000 2.50 5000
TX04 5250 2.00 10500
A 7250 (18.08%) 15500 (31.31%)
TX05 6000 1.75 10500
TX07 1500 1.00 1500
TX08 5500 1.85 10175
B 20250 (50.49%) 37675 (76.12%)
TX06 2750 0.80 2200
TX01 10000 0.50 5000
TX02 7100 0.65 4615
C 40100 (100%) 49490 (100%)
EXAM RUBRIC: Reconcile the physical inventory balances with the
balances as per book.
ACCOUNTING TREATMENT:
Opening balance (Opening Balance + Receipts – Issue) XXX
Less – Contamination (XXX)
Add – Not included in Books XXX
Add – Return by production Deptt XXX
Less – Wrong Recording (XXX)
Add – Held on behalf of customer XXX
Physical Balance XXX

Cost Accounting Manual 2013
182 © For Suggestions & Feedbacks, contact: ATAUSH SHAFI ([email protected])
BUDGETBUDGETBUDGETBUDGET
EXAM RUBRIC:
Sales Rs. ‘000
Actual:
January 2012 85000
February 2012 95000
Forecast:
March 2012 55000
April 2012 60000
May 2012 65000
June 2012 75000
60% of the debtors are collected in the first month subsequent to sale whereas the remaining debtors
are collected in the second month following sales.
ACCOUNTING TREATMENT:
Terms meanings:
Term Meaning
Now Current Period
First Month Next Month
2nd Month Subsequent Next Month
Sales will be calculated as follows:
March April May
January (85000*80%*40%) 27200 - -
February (95000*80%*60%) 45600 - -
February (95000*80%*40%) - 30400 -
March (55000*80%*60%) - 26400 -
March (55000*80%*40%) - - 17600
April (60000*80%*60%) - - 28800
Cash Sales 11000 12000 13000
Total Sales 83800 68800 59400
Credit Sales rule is as follows:
January February + March
February March + April
March April + May
April May + June

Cost Accounting Manual 2013
183 © For Suggestions & Feedbacks, contact: ATAUSH SHAFI ([email protected])
EXAM RUBRIC: ZL earns a gross profit of 25% of sales and uniformly maintains stocks at
80% of the projected sale of the following month.
ACCOUNTING TREATMENT:
GP = Sale – CGS
25% = 100% - 75%
GP = 55000/100*25 = 13750
February = CGS = 95000/100 *75 = 71250
March = CGS = 55000/100 *75 = 41250
April = CGS = 60000/100 *75 = 45000
May = CGS = 65000/100 *75 = 48750
Opening Stock (80% of CGS) + Purchase – Closing Stock = CGS
February = 57000 + P – 33000 = 71250
March = 33000 + P – 36000 = 41250
April = 36000 + P – 39000 = 45000
May = 39000 + P – 45000 = 48750
Rule:
• Opening Stock = current year CGS
• Closing Stock = Next / Projected year CGS
Purchases will be calculated as follows:
February = 47250
March = 44250
April = 48000
May = 54750