cosmetic surgery national data bank statistics · the authoritative source for current u.s....
TRANSCRIPT
The Authoritative Source for Current U.S. Statistics on Cosmetic Surgery
2017 Cosmetic Surgery National Data Bank
STATISTICS
The American Society for Aesthetic Plastic Surgery

Please credit the American Society for Aesthetic Plastic Surgery when citing statistical data. Contact: ASAPS Communications • 562.799.2356 • [email protected] • www.surgery.org • fax: 562.799.1098
Table of Contents
Resources for the Media .............................................................................. 1Introduction to The Aesthetic Society® ......................................................... 2Introduction to ASAPS Cosmetic Surgery National Data Bank ....................... 32017 Statistics Quick Facts .......................................................................... 4Top 5 Procedures: Surgical & Nonsurgical .................................................... 6National Totals (Surgical) .............................................................................. 7National Totals (Nonsurgical) ......................................................................... 8Surgical Procedures: 5-Year Comparison ...................................................... 9Percent Change: 2012–2017 (Surgical) ....................................................... 10Percent Change: 2012–2017 (Nonsurgical) ................................................. 11Top Procedures by Gender .........................................................................12Gender Distribution (Surgical) .....................................................................13Gender Distribution (Nonsurgical) ...............................................................14Age Distribution (Surgical) ............................................................................15Age Distribution (Nonsurgical) ......................................................................16Age Distribution (for Procedures) ................................................................. 17Trends ........................................................................................................18National Average Fees (Surgical) ..................................................................19National Average Fees (Nonsurgical) ............................................................20Economic, Regional and Ethnic Information .................................................21Procedure Quick Facts ...............................................................................22ASAPS Quick Facts ....................................................................................24
1Please credit the American Society for Aesthetic Plastic Surgery when citing statistical data. Contact: ASAPS Communications • 562.799.2356 • [email protected] • www.surgery.org • fax: 562.799.1098
ASAPS Spokesperson Network
Thought and opinion leaders in all types of cosmetic procedures, surgical and nonsurgical, are available for interviews and information
Spokespersons are available nationwide in urban and rural settings ASAPS leadership is available for information and interviews in all major cosmetic surgery markets All Aesthetic Society® spokespersons are working clinicians in direct patient care
The Media Center at http://www.surgery.org/media
Downloadable statistics and infographics Procedural facts Complete library of press releases ranging from 1998 to the present indexed by subject and date Press kit Registration for ASAPS Scientifi c Meetings (for invited and credentialed media) Before and after patient photos
Resources for the Media
Contact The Aesthetic Society® Communications Offi ce at 562.799.2356 or e-mail [email protected] for prompt assistance.
2Please credit the American Society for Aesthetic Plastic Surgery when citing statistical data. Contact: ASAPS Communications • 562.799.2356 • [email protected] • www.surgery.org • fax: 562.799.1098
The American Society for Aesthetic Plastic Surgery (ASAPS) was founded in 1967 when cosmetic surgery was only beginning to be recognized as the important subspecialty it is today.
Founded on a mission of education, we are now widely recognized as the leader in aesthetic surgery research, education, and procedural advances.
United States Active membership to The Aesthetic Society® is restricted to American Board of Plastic Surgery certifi ed physicians who meet a minimum number of surgical procedures performed and commit to a signifi cant number of continuing medical education hours. New members must be sponsored by a current Society member.
About The Aesthetic Society
3Please credit the American Society for Aesthetic Plastic Surgery when citing statistical data. Contact: ASAPS Communications • 562.799.2356 • [email protected] • www.surgery.org • fax: 562.799.1098
ASAPS, working with an independent research fi rm, compiled the national data for procedures performed 2012-2017. A paper-based questionnaire was mailed to 6,500 board-certifi ed plastic surgeons. An online version of the questionnaire was also available. A total of 291 board-certifi ed plastic surgeons returned questionnaires, of which 26 were retired or otherwise inactive during 2017. While surveys were distributed to all domestic, board-certifi ed plastic surgeons, the results may refl ect activities of surgeons who primarily conduct aesthetic surgical procedures.
Final fi gures have been projected to refl ect nationwide statistics. Confi dence intervals change by procedure, depending on the grouping’s sample size and the response variance, though the overall survey portion of this research has a standard error of +/- 5.90% at a 95% level of confi dence.
The Survey on Cosmetic Procedures Performed in 2017 was compiled, tabulated and analyzed by Industry Insights Inc. (www.industryinsights.com), an independent research fi rm based in Columbus, OH.
About the ASAPS Cosmetic Surgery National Data Bank
Source: American Society for Aesthetic Plastic Surgery
4Please credit the American Society for Aesthetic Plastic Surgery when citing statistical data. Contact: ASAPS Communications • 562.799.2356 • [email protected] • www.surgery.org • fax: 562.799.1098
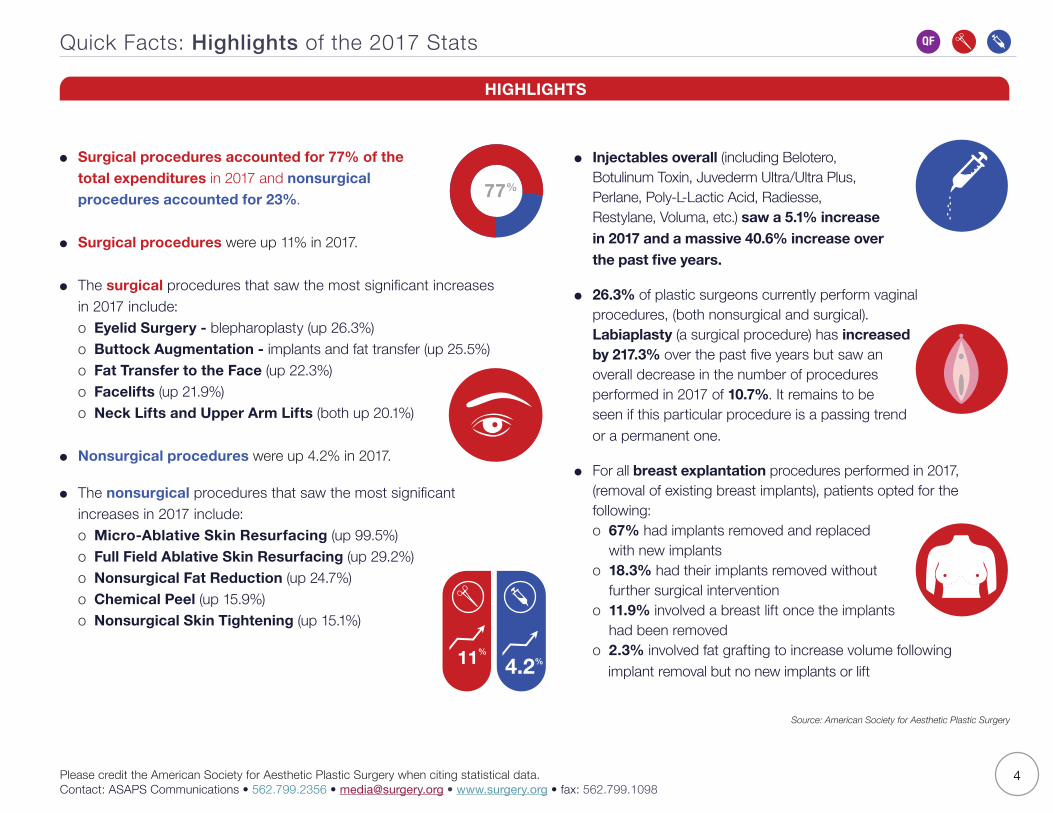
Quick Facts: Highlights of the 2017 Stats
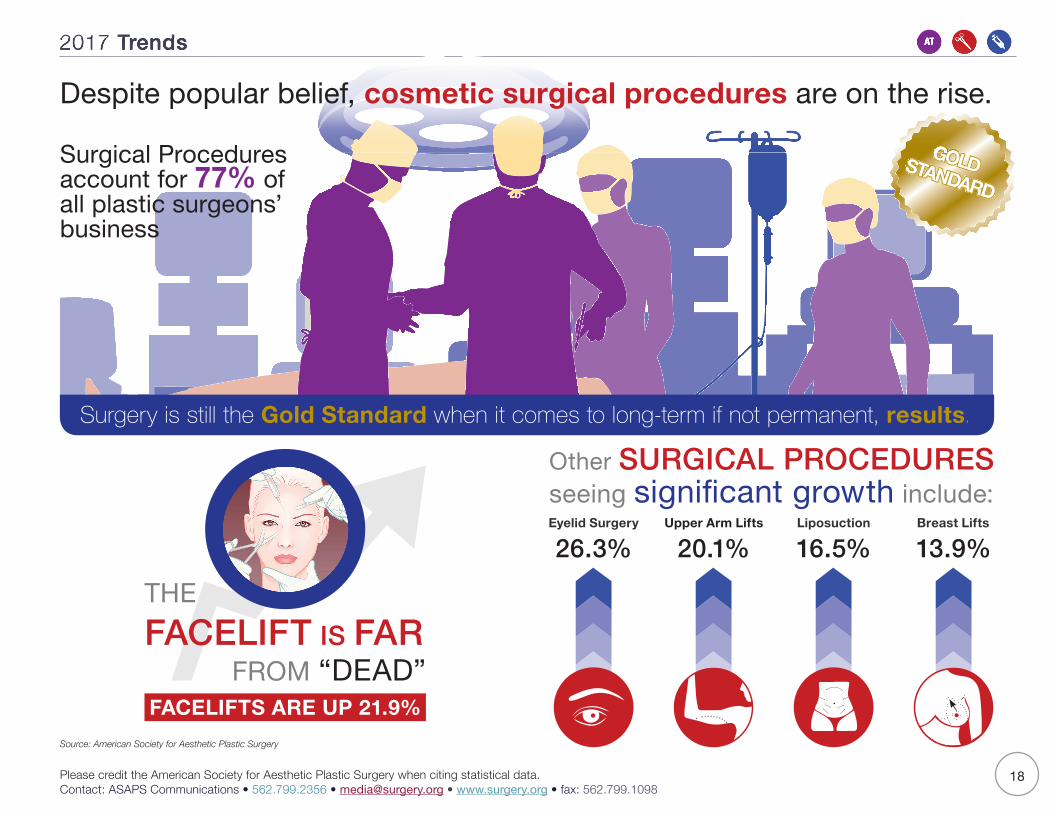
Surgical procedures accounted for 77% of the total expenditures in 2017 and nonsurgical procedures accounted for 23%.
Surgical procedures were up 11% in 2017.
The surgical procedures that saw the most signifi cant increases in 2017 include:o Eyelid Surgery - blepharoplasty (up 26.3%)o Buttock Augmentation - implants and fat transfer (up 25.5%)o Fat Transfer to the Face (up 22.3%)o Facelifts (up 21.9%)o Neck Lifts and Upper Arm Lifts (both up 20.1%)
Nonsurgical procedures were up 4.2% in 2017.
The nonsurgical procedures that saw the most signifi cant increases in 2017 include:o Micro-Ablative Skin Resurfacing (up 99.5%)o Full Field Ablative Skin Resurfacing (up 29.2%)o Nonsurgical Fat Reduction (up 24.7%)o Chemical Peel (up 15.9%)o Nonsurgical Skin Tightening (up 15.1%)
Injectables overall (including Belotero, Botulinum Toxin, Juvederm Ultra/Ultra Plus, Perlane, Poly-L-Lactic Acid, Radiesse, Restylane, Voluma, etc.) saw a 5.1% increase in 2017 and a massive 40.6% increase over the past fi ve years.
26.3% of plastic surgeons currently perform vaginal procedures, (both nonsurgical and surgical). Labiaplasty (a surgical procedure) has increased by 217.3% over the past fi ve years but saw an overall decrease in the number of procedures performed in 2017 of 10.7%. It remains to be seen if this particular procedure is a passing trend or a permanent one.
For all breast explantation procedures performed in 2017, (removal of existing breast implants), patients opted for the following:o 67% had implants removed and replaced with new implantso 18.3% had their implants removed without further surgical interventiono 11.9% involved a breast lift once the implants had been removedo 2.3% involved fat grafting to increase volume following implant removal but no new implants or lift
HIGHLIGHTS
77%
11%
4.2%

TOP 5
TOP 5 GENDER AGE
Age 35-50
38.6%
Source: American Society for Aesthetic Plastic Surgery
18 and underAge
Age 19-34
Age 35-50
Age 51-64
Age 65+
Ear Surgery
Breast Augmentation
Liposuction
Liposuction
Eyelid Surgery (Blepharoplasty)
5Please credit the American Society for Aesthetic Plastic Surgery when citing statistical data. Contact: ASAPS Communications • 562.799.2356 • [email protected] • www.surgery.org • fax: 562.799.1098
The top fi ve surgical procedures in 2017 were:
• Breast Augmentation (333,392 procedures) • Liposuction (304,850 procedures) • Eyelid Surgery (145,390 procedures) • Breast Lift (142,710 procedures) • Tummy Tuck (140,834 procedures)
The top fi ve nonsurgical procedures in 2017 were:
• Botulinum Toxin (1,548,236 procedures) • Hyaluronic Acid (722,394 procedures) • Nonsurgical Fat Reduction (180,833 procedures) • Hair Removal (178,488 procedures) • Chemical Peel (118,523 procedures)
Quick Facts: Highlights of the 2017 Stats
The top fi ve surgical procedures for women in 2017 were:
• Breast Augmentation (333,392 procedures) • Liposuction (273,829 procedures) • Breast Lift (142,710 procedures)• Tummy Tuck (132,258 procedures)• Eyelid Surgery (Blepharoplasty) (123,079 procedures)
The top fi ve surgical procedures for men in 2017 were:
• Liposuction (31,021 procedures)• Eyelid Surgery (Blepharoplasty) (22,311 procedures)• Breast Reduction (treatment of Gynecomastia) (20,167 procedures)• Tummy Tuck (8,576 procedures)• Facelift (8,174 procedures)
TOP
5
As in 2016, patients aged 35 – 50 had the largest percentage of surgical procedures performed, (38.6% of the total number for all age brackets)
The most common surgical proceduresper age group in 2017 were as follows:

5 5
Breast Augmentation Botulinum Toxin(including Botox, Dysport and Xeomin)
TOP
5 Surgical Procedures in 2017
Top 5 Procedures: Surgical & Nonsurgical
333,392 1,548,2361 1
Liposuction
304,850 722,3942 2
Nonsurgical Fat Reduction (incl. CoolSculpting, Vaser Shape, Liposonix)
180,8333
Hair Removal
178,4884
Tummy Tuck Chemical Peel
140,834 118,523
Hyaluronic Acid (Including Juvederm Ultra, Ultra Plus, Voluma, Perlane, Restylane, Belotero)
TOP
5 Nonsurgical Procedures in 2017
Breast Lift
142,7104
Eyelid Surgery
145,390 3
Source: American Society for Aesthetic Plastic Surgery
6Please credit the American Society for Aesthetic Plastic Surgery when citing statistical data. Contact: ASAPS Communications • 562.799.2356 • [email protected] • www.surgery.org • fax: 562.799.1098

2017 National Totals for Cosmetic Procedures - Surgical
Source: American Society for Aesthetic Plastic Surgery
* 13% of these procedures used saline implants and 87% used silicone implants.** Breast reduction may be covered by insurance, depending on terms of the policy and individual patient factors.*** 6% of buttock augmentations included implants and 94% were fat transfers.
Hair transplantation, Polymethylmethacrylate, and Treatment of leg veins were excluded from the results, due to an insuffi cient sample of responding physicians who perform those procedures.
Number of Procedures
2017 Rank within Category (Surgical)
2016 Rank within Category
2012 Rank within Category
Surgical ProcedureBreast Augmentation* 333,392 A 1 1 1
Breast Implant Removal (breast implant explantation) 45,024 9 9 x
Breast Lift 142,710 D 4 4 5
Breast Reduction (women)** 71,422 7 7 7
Brow Lift 22,713 13 12 11
Buttock Augmentation (implants and fat transfer) 23,115 12 15 x
Buttock Lift 4,690 22 22 22
Chin Augmentation 5,963 21 20 19
Ear Surgery 10,519 18 18 16
Eyelid Surgery 145,390 C 3 5 4
Facelift 82,410 6 6 6
Fat Transfer: Breast 21,708 14 11 x
Fat Transfer: Face 54,739 8 8 x
Labiaplasty (excluding vaginal rejuvenation) 10,787 17 17 21
Liposuction 304,850 B 2 2 2
Lower Body Lift 6,499 20 21 20
Male Breast Reduction (for the treatment of Gynecomastia) 20,167 15 14 12
Neck Lift 28,542 11 13 x
Nose Surgery 38,659 10 10 10
Thigh Lift 7,839 19 19 17
Tummy Tuck 140,834 E 5 3 3
Upper Arm Lift 18,157 16 16 15
Upper Body Lift 2,546 23 23 x
Totals - Surgical Procedures 1,542,675
The following list includes surgical cosmetic procedures. The top 5 surgical procedures are indicated in bold superscript letters in the column headed Number of Procedures. Number of
Procedures
7Please credit the American Society for Aesthetic Plastic Surgery when citing statistical data. Contact: ASAPS Communications • 562.799.2356 • [email protected] • www.surgery.org • fax: 562.799.1098

Number of Procedures
2017 Rank within Category (Nonsurgical)
Nonsurgical ProcedureInjectables:
Botulinum Toxin (including Botox, Dysport, Xeomin) 1,548,236 1 1
Calcium Hydroxylapatite (Radiesse) 42,143 10
Hyaluronic Acid (incl. Juvederm Ultra, Ultra Plus, Voluma, Perlane, Restylane, Belotero) 722,394 2 2
Poly-L-Latic Acid (Sculptra) 31,557 12
Totals - Injectables 2,344,330
Skin Rejuvenation:
Chemical Peel 118,523 5 5
Dermabrasion (not including microdermabrasion) 5,427 16
Full Field Ablative (laser skin resurfacing) 31,892 11
Micro-Ablative Resurfacing (fractional resurfacing) 59,764 9
Microdermabrasion 106,999 7
Nonsurgical Skin Tightening (including Ulthera, Thermage, Pelleve) 64,923 8
Photorejuvenation (IPL) 113,230 6
Totals - Skin Rejuvenation 500,758
Other:
Cellulite Treatment 9,581 14
Hair Removal (laser or pulsed light) 178,488 4 4
Nonsurgical Fat Reduction (including CoolSculpting, Vaser Shape, Liposonix) 180,833 3 3
Sclerotherapy 9,380 15
Tattoo Removal 15,745 13
Totals - Other Nonsurgical Procedures 394,027
Totals - Nonsurgical Procedures 3,239,115
2017 National Totals for Cosmetic Procedures - Nonsurgical
Hair transplantation, Polymethylmethacrylate, and Treatment of leg veins were excluded from the results, due to an insuffi cient sample of responding physicians who perform those procedures.
Nonsurgical Procedure
The following list includes nonsurgical cosmetic procedures. The top 5 nonsurgical procedures are indicated by bold superscript numbers in the column headed Number of Procedures. Number of Procedures
Source: American Society for Aesthetic Plastic Surgery
8Please credit the American Society for Aesthetic Plastic Surgery when citing statistical data. Contact: ASAPS Communications • 562.799.2356 • [email protected] • www.surgery.org • fax: 562.799.1098

Surgical Procedures: 5-Year Comparison, 2012—2017
176,863
Breast Augmentation
320,132
333,392
Eyelid Surgery
108,896
145,390
Breast Lift
0 100,000 200,000 300,000 400,000
192,965
304,850
Liposuction
2012 2017
Tummy Tuck
110,171
Source: American Society for Aesthetic Plastic Surgery
90,625
140,834
142,710
9Please credit the American Society for Aesthetic Plastic Surgery when citing statistical data. Contact: ASAPS Communications • 562.799.2356 • [email protected] • www.surgery.org • fax: 562.799.1098
*Breast reduction may be covered by insurance, depending on terms of the policy and individual patient factors.n/a = Not available (was not collected in that year’s survey)Hair transplantation, Polymethylmethacrylate, and Treatment of leg veins were excluded from the results, due to an insuffi cient sample of responding physicians who perform those procedures.Percent change totals are based on procedures for which data were collected in both years.
Source: American Society for Aesthetic Plastic Surgery
2017 2016Percent Change 2017 vs 2016
Percent Change 2017 vs 2012
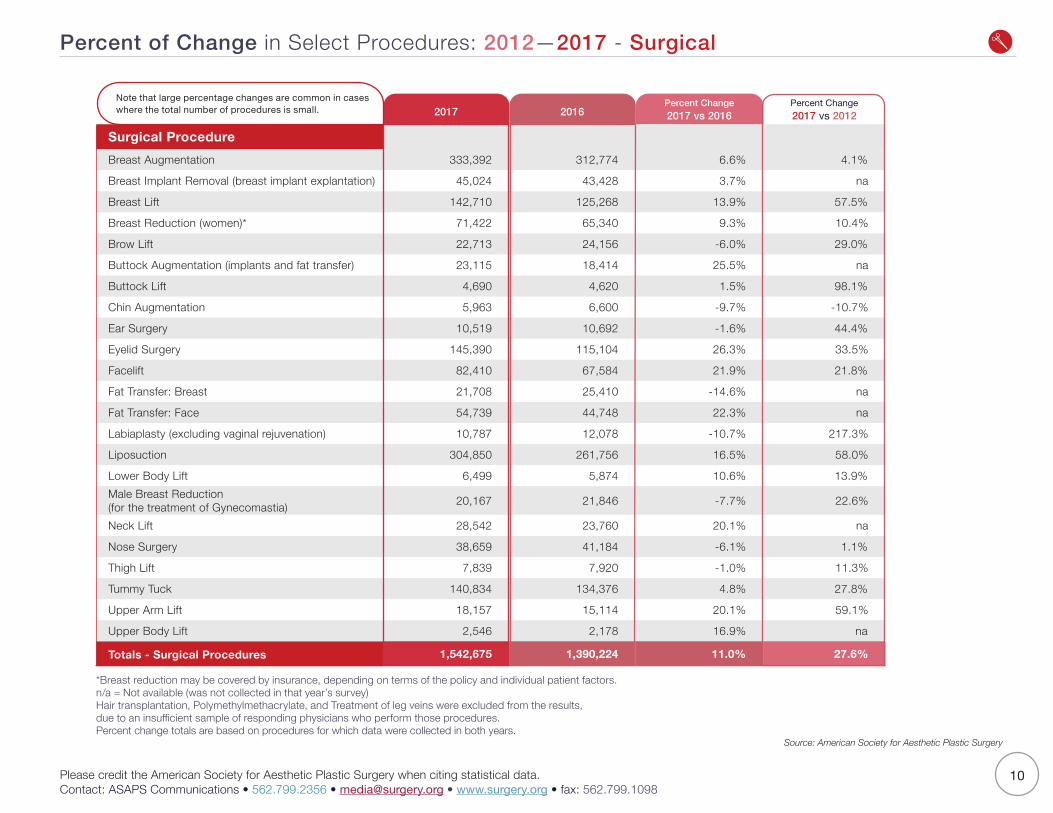
Surgical ProcedureBreast Augmentation 333,392 312,774 6.6% 4.1%
Breast Implant Removal (breast implant explantation) 45,024 43,428 3.7% na
Breast Lift 142,710 125,268 13.9% 57.5%
Breast Reduction (women)* 71,422 65,340 9.3% 10.4%
Brow Lift 22,713 24,156 -6.0% 29.0%
Buttock Augmentation (implants and fat transfer) 23,115 18,414 25.5% na
Buttock Lift 4,690 4,620 1.5% 98.1%
Chin Augmentation 5,963 6,600 -9.7% -10.7%
Ear Surgery 10,519 10,692 -1.6% 44.4%
Eyelid Surgery 145,390 115,104 26.3% 33.5%
Facelift 82,410 67,584 21.9% 21.8%
Fat Transfer: Breast 21,708 25,410 -14.6% na
Fat Transfer: Face 54,739 44,748 22.3% na
Labiaplasty (excluding vaginal rejuvenation) 10,787 12,078 -10.7% 217.3%
Liposuction 304,850 261,756 16.5% 58.0%
Lower Body Lift 6,499 5,874 10.6% 13.9%Male Breast Reduction (for the treatment of Gynecomastia) 20,167 21,846 -7.7% 22.6%
Neck Lift 28,542 23,760 20.1% na
Nose Surgery 38,659 41,184 -6.1% 1.1%
Thigh Lift 7,839 7,920 -1.0% 11.3%
Tummy Tuck 140,834 134,376 4.8% 27.8%
Upper Arm Lift 18,157 15,114 20.1% 59.1%
Upper Body Lift 2,546 2,178 16.9% na
Totals - Surgical Procedures 1,542,675 1,390,224 11.0% 27.6%
10Please credit the American Society for Aesthetic Plastic Surgery when citing statistical data. Contact: ASAPS Communications • 562.799.2356 • [email protected] • www.surgery.org • fax: 562.799.1098
Percent of Change in Select Procedures: 2012—2017 - Surgical
Note that large percentage changes are common in cases where the total number of procedures is small.

*Breast reduction may be covered by insurance, depending on terms of the policy and individual patient factors.n/a = Not available (was not collected in that year’s survey)Hair transplantation, Polymethylmethacrylate, and Treatment of leg veins were excluded from the results, due to an insuffi cient sample of responding physicians who perform those procedures.Percent change totals are based on procedures for which data were collected in both years. Source: American Society for Aesthetic Plastic Surgery
Note that large percentage changes are common in cases where the total number of procedures is small.
11Please credit the American Society for Aesthetic Plastic Surgery when citing statistical data. Contact: ASAPS Communications • 562.799.2356 • [email protected] • www.surgery.org • fax: 562.799.1098
2017 2016 2012Percent Change 2017 vs 2016
Percent Change 2017 vs 2012
2017 TotalsWith Phys Ext.
Nonsurgical Procedure
Injectables:
Botulinum Toxin (including Botox, Dysport, Xeomin) 1,548,236 1,438,998 1,190,995 7.6% 30.0% 2,680,804 Calcium Hydroxylapatite (Radiesse) 42,143 57,288 56,512 -26.4% -25.4% 66,397
Hyaluronic Acid (incl. Juvederm Ultra, Ultra Plus, Voluma, Perlane, Restylane, Belotero)” 722,394 701,712 390,422 2.9% 85.0% 1,313,066
Poly-L-Latic Acid (Sculptra) 31,557 31,812 29,925 -0.8% 5.5% 48,441
Totals - Injectables 2,344,330 2,229,810 1,667,854 5.1% 40.6% 4,108,708
Skin Rejuvenation:
Chemical Peel 118,523 102,234 94,024 15.9% 26.1% 457,409 Dermabrasion (not including microdermabrasion) 5,427 7,524 5,342 -27.9% 1.6% 38,994 Full Field Ablative (laser skin resurfacing) 31,892 24,684 14,750 29.2% 116.2% 64,387 Micro-Ablative Resurfacing (fractional resurfacing) 59,764 29,964 11,472 99.5% 420.9% 149,276 Microdermabrasion 106,999 178,398 141,856 -40.0% -24.6% 280,797
Nonsurgical Skin Tightening (incl. Ulthera, Thermage, Pelleve) 64,923 56,430 39,394 15.1% 64.8% 164,686
Photorejuvenation (IPL) 113,230 130,350 84,312 -13.1% 34.3% 349,606
Totals - Skin Rejuvenation 500,758 529,584 391,151 -5.4% 28.0% 1,505,155
Other:
Cellulite treatment 9,581 11,814 na -18.9% na 9,581
Hair Removal (laser or pulsed light) 178,488 155,430 190,173 14.8% -6.1% 449,235
Nonsurgical Fat Reduction (incl. CoolSculpting, Vaser Shape, Liposonix) 180,833 145,068 56,997 24.7% 217.3% 180,833
Sclerotherapy 9,380 8,184 16,875 14.6% -44.4% 9,380
Tattoo Removal 15,745 27,258 24,523 -42.2% -35.8% 15,745
Totals - Other Nonsurgical Procedures 394,027 347,754 288,568 13.3% 33.2% 664,774
Totals - Nonsurgical Procedures 3,239,115 3,107,148 2,347,573 4.2% 37.6% 6,278,637
Percent of Change in Select Procedures: 2012 - 2017 - Nonsurgical
2,680,804 66,397
1,313,066
48,441
4,108,708
457,409 38,994 64,387
149,276 280,797
164,686
349,606
1,505,155
9,581 449,235
180,833
9,380 15,745
664,774
6,278,637
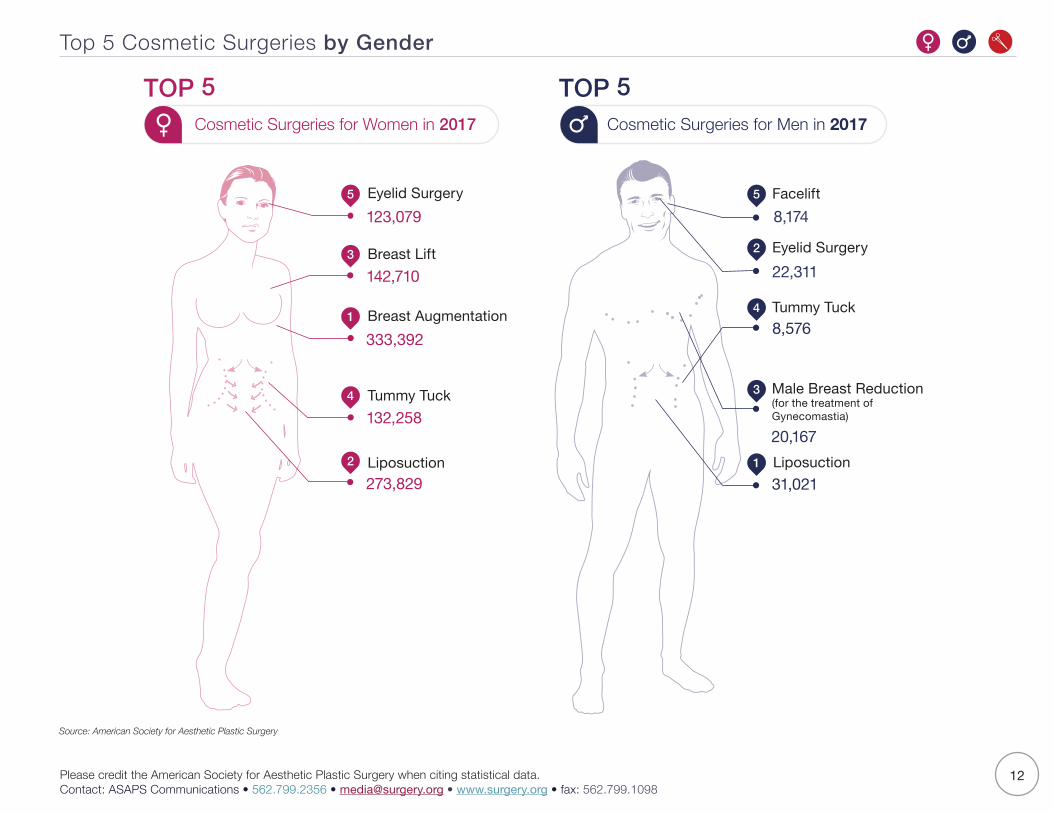
Top 5 Cosmetic Surgeries by Gender
TOP 5 TOP 5 Cosmetic Surgeries for Women in 2017 Cosmetic Surgeries for Men in 2017
Liposuction31,021
20,1671
4
3
2
8,576
22,311
Tummy Tuck
Eyelid Surgery
5
8,174Facelift
Male Breast Reduction (for the treatment of Gynecomastia)
Source: American Society for Aesthetic Plastic Surgery
4
1
2
Breast Augmentation
Eyelid Surgery
Breast Lift
Liposuction
Tummy Tuck
5
3
333,392
123,079
142,710
273,829
132,258
12Please credit the American Society for Aesthetic Plastic Surgery when citing statistical data. Contact: ASAPS Communications • 562.799.2356 • [email protected] • www.surgery.org • fax: 562.799.1098
Source: American Society for Aesthetic Plastic Surgery
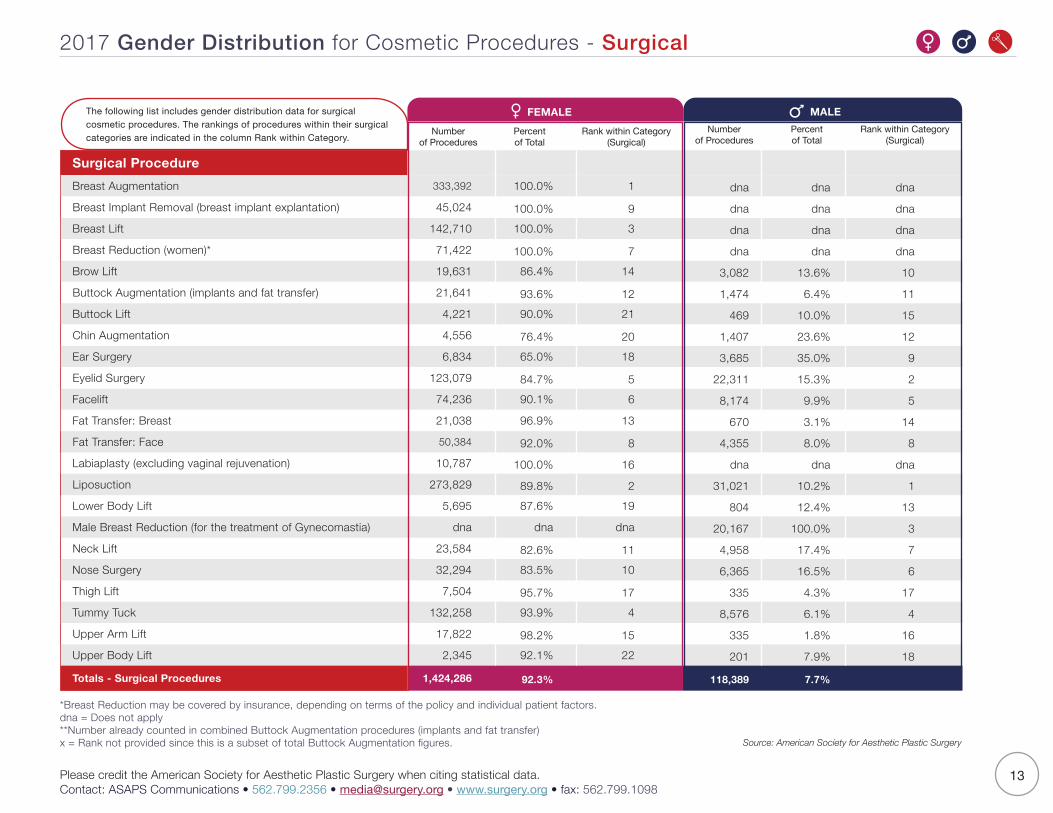
*Breast Reduction may be covered by insurance, depending on terms of the policy and individual patient factors.dna = Does not apply **Number already counted in combined Buttock Augmentation procedures (implants and fat transfer)x = Rank not provided since this is a subset of total Buttock Augmentation fi gures.
2017 Gender Distribution for Cosmetic Procedures - Surgical
Number of Procedures
Percent of Total
Rank within Category (Surgical)
Number of Procedures
Percent of Total
Rank within Category (Surgical)
Surgical ProcedureBreast Augmentation 333,392 100.0% 1 dna dna dnaBreast Implant Removal (breast implant explantation) 45,024 100.0% 9 dna dna dnaBreast Lift 142,710 100.0% 3 dna dna dnaBreast Reduction (women)* 71,422 100.0% 7 dna dna dnaBrow Lift 19,631 86.4% 14 3,082 13.6% 10Buttock Augmentation (implants and fat transfer) 21,641 93.6% 12 1,474 6.4% 11Buttock Lift 4,221 90.0% 21 469 10.0% 15Chin Augmentation 4,556 76.4% 20 1,407 23.6% 12Ear Surgery 6,834 65.0% 18 3,685 35.0% 9Eyelid Surgery 123,079 84.7% 5 22,311 15.3% 2Facelift 74,236 90.1% 6 8,174 9.9% 5Fat Transfer: Breast 21,038 96.9% 13 670 3.1% 14Fat Transfer: Face 50,384 92.0% 8 4,355 8.0% 8Labiaplasty (excluding vaginal rejuvenation) 10,787 100.0% 16 dna dna dnaLiposuction 273,829 89.8% 2 31,021 10.2% 1Lower Body Lift 5,695 87.6% 19 804 12.4% 13Male Breast Reduction (for the treatment of Gynecomastia) dna dna dna 20,167 100.0% 3Neck Lift 23,584 82.6% 11 4,958 17.4% 7Nose Surgery 32,294 83.5% 10 6,365 16.5% 6Thigh Lift 7,504 95.7% 17 335 4.3% 17Tummy Tuck 132,258 93.9% 4 8,576 6.1% 4Upper Arm Lift 17,822 98.2% 15 335 1.8% 16Upper Body Lift 2,345 92.1% 22 201 7.9% 18
Totals - Surgical Procedures 1,424,286 92.3% 118,389 7.7%
FEMALE MALE
13Please credit the American Society for Aesthetic Plastic Surgery when citing statistical data. Contact: ASAPS Communications • 562.799.2356 • [email protected] • www.surgery.org • fax: 562.799.1098
The following list includes gender distribution data for surgical cosmetic procedures. The rankings of procedures within their surgical categories are indicated in the column Rank within Category.

2017 Gender Distribution for Cosmetic Procedures - Nonsurgical
Number of Procedures
Percent of Total
Rank within Category (Nonsurgical)
Number of Procedures
Percent of Total
Rank within Category (Nonsurgical)
Nonsurgical ProcedureInjectables:
Botulinum Toxin (including Botox, Dysport, Xeomin) 1,387,838 89.6% 1 160,398 10.4% 1
Calcium Hydroxylapatite (Radiesse) 38,123 90.5% 10 4,020 9.5% 9Hyaluronic Acid (incl. Juvederm Ultra, Ultra Plus, Voluma, Perlane, Restylane, Belotero) 675,829 93.6% 2 46,565 6.4% 2
Poly-L-Latic Acid (Sculptra) 27,604 87.5% 12 3,953 12.5% 11
Totals - Injectables 2,129,394 90.8% 214,936 9.2%
Skin Rejuvenation:
Chemical Peel 112,024 94.5% 5 6,499 5.5% 6
Dermabrasion (not including microdermabrasion) 5,159 95.1% 16 268 4.9% 15
Full Field Ablative (laser skin resurfacing) 27,872 87.4% 11 4,020 12.6% 10
Micro-Ablative Resurfacing (fractional resurfacing) 55,409 92.7% 9 4,355 7.3% 8
Microdermabrasion 103,381 96.6% 7 3,618 3.4% 13
Nonsurgical Skin Tightening (incl. Ulthera, Thermage, Pelleve) 61,238 94.3% 8 3,685 5.7% 12
Photorejuvenation (IPL) 104,118 92.0% 6 9,112 8.0% 5
Totals - Skin Rejuvenation 469,201 93.7% 31,557 6.3%
Other:
Cellulite Treatment 8,040 83.9% 15 1,541 16.1% 14
Hair Removal (laser or pulsed light) 159,862 89.6% 3 18,626 10.4% 4
Nonsurgical Fat Reduction (incl. CoolSculpting, Vaser Shape, Liposonix)
157,383 87.0% 4 23,450 13.0% 3
Sclerotherapy 9,246 98.6% 14 134 1.4% 16
Tattoo Removal 9,514 60.4% 13 6,231 39.6% 7
Totals - Other Nonsurgical Procedures 344,045 87.3% 49,982 12.7%
Totals - Nonsurgical Procedures 2,942,640 90.8% 296,475 9.2%
Hair transplantation, Polymethylmethacrylate, and Treatment of leg veins were excluded from the results, due to an insuffi cient sample of responding physicians who perform those procedures.
FEMALE MALE
Source: American Society for Aesthetic Plastic Surgery
14Please credit the American Society for Aesthetic Plastic Surgery when citing statistical data. Contact: ASAPS Communications • 562.799.2356 • [email protected] • www.surgery.org • fax: 562.799.1098
The following list includes gender distribution data for nonsurgical cosmetic procedures. The rankings of procedures within their nonsurgical categories are indicated in the column Rank within Category.

18 and Under 19-34 35-50 51-64 65+
Number of
Procedures
Percent of Procedural
Total
Number of
Procedures
Percent of Procedural
Total
Number of
Procedures
Percent of Procedural
Total
Number of
Procedures
Percent of Procedural
Total
Number of
Procedures
Percent of Procedural
Total
Surgical ProcedureBreast Augmentation 2,948 0.9% 156,043 A 46.8% 127,300 B 38.2% 40,736 12.2% 6,365 1.9%Breast Implant Removal (breast implant explantation) 67 0.1% 4,087 9.1% 19,631 43.6% 16,951 37.6% 4,288 9.5%Breast Lift 469 0.3% 24,589 17.2% 74,973 52.5% 34,237 24.0% 8,442 5.9%Breast Reduction (women)* 1,675 2.3% 19,832 27.8% 28,073 39.3% 17,152 24.0% 4,690 6.6%Brow Lift 0 0.0% 134 0.6% 5,092 22.4% 12,395 54.6% 5,092 22.4%Buttock Augmentation (implants and fat transfer) 0 0.0% 8,710 37.7% 10,184 44.1% 3,551 15.4% 670 2.9%Buttock Lift 0 0.0% 536 11.4% 2,948 62.9% 1,072 22.9% 134 2.9%Chin Augmentation 201 3.4% 2,412 40.4% 1,809 30.3% 1,139 19.1% 402 6.7%Ear Surgery 3,350 A 31.8% 4,020 38.2% 1,943 18.5% 670 6.4% 536 5.1%Eyelid Surgery 67 0.0% 3,283 2.3% 36,515 25.1% 68,675 B 47.2% 36,850 A 25.3%Facelift 0 0.0% 134 0.2% 8,308 10.1% 46,364 C 56.3% 27,604 B 33.5%Fat Transfer: Breast 134 0.6% 4,690 21.6% 9,380 43.2% 5,963 27.5% 1,541 7.1%Fat Transfer: Face 67 0.1% 3,819 7.0% 13,534 24.7% 26,331 48.1% 10,988 20.1%Labiaplasty (excluding vaginal rejuvenation) 469 4.3% 5,963 55.3% 3,685 34.2% 603 5.6% 67 0.6%Liposuction 3,149 B 1.0% 75,174 B 24.7% 140,231 A 46.0% 72,829 A 23.9% 13,467 C 4.4%Lower Body Lift 0 0.0% 938 14.4% 3,417 52.6% 1,742 26.8% 402 6.2%
Male Breast Reduction (for the treatment of Gynecomastia) 1,675 8.3% 9,782 48.5% 6,566 32.6% 1,809 9.0% 335 1.7%
Neck Lift 0 0.0% 201 0.7% 3,551 12.4% 15,075 52.8% 9,715 34.0%Nose Surgery 3,015 C 7.8% 19,430 50.3% 11,256 29.1% 4,087 10.6% 871 2.3%Thigh Lift 0 0.0% 871 11.1% 4,020 51.3% 2,613 33.3% 335 4.3%Tummy Tuck 134 0.1% 27,604 C 19.6% 75,911 C 53.9% 31,557 22.4% 5,628 4.0%Upper Arm Lift 0 0.0% 1,876 10.3% 6,164 33.9% 8,040 44.3% 2,077 11.4%Upper Body Lift 0 0.0% 402 15.8% 1,340 52.6% 670 26.3% 134 5.3%
Totals - Surgical Procedures 17,420 1.1% 374,530 24.3% 595,831 38.6% 414,261 26.9% 140,633 9.1%
2017 Age Distribution for Cosmetic Procedures - Surgical
AD
Source: American Society for Aesthetic Plastic Surgery
15Please credit the American Society for Aesthetic Plastic Surgery when citing statistical data. Contact: ASAPS Communications • 562.799.2356 • [email protected] • www.surgery.org • fax: 562.799.1098
* Breast reduction may be covered by insurance, depending on terms of the policy and individual patient factors.Hair transplantation, Upper body lift, Polymethylmethacrylate, Cellulite treatment, and Treatment of leg veins were excluded from the results, due to an insuffi cient sample of responding physicians who perform those procedures.
The top 3 surgical procedures in each age category are indicated in bold and with bold superscript letters.

2017 Age Distribution for Cosmetic Procedures - Nonsurgical
18 and Under 19-34 35-50 51-64 65+
Number of
Procedures
Percent of Procedural
Total
Number of
Procedures
Percent of Procedural
Total
Number of
Procedures
Percent of Procedural
Total
Number of
Procedures
Percent of Procedural
Total
Number of
Procedures
Percent of Procedural
Total
Nonsurgical Procedure
Injectables:
Botulinum Toxin (including Botox, Dysport, Xeomin) 3,484 2 0.2% 216,209 1 14.0% 640,051 1 41.3% 512,081 1 33.1% 176,411 1 11.4%
Calcium Hydroxylapatite (Radiesse) 0 0.0% 2,479 5.9% 15,276 36.2% 19,095 45.3% 5,293 12.6%Hyaluronic Acid (incl. Juvederm Ultra, Ultra Plus, Voluma, Perlane, Restylane, Belotero) 3,350 3 0.5% 104,453 2 14.5% 266,526 2 36.9% 242,138 2 33.5% 105,927 2 14.7%
Poly-L-Latic Acid (Sculptra) 0 0.0% 2,345 7.4% 8,375 26.5% 14,539 46.1% 6,298 20.0%
Totals - Injectables 6,834 0.3% 325,486 13.9% 930,228 39.7% 787,853 33.6% 293,929 12.5%
Skin Rejuvenation:
Chemical Peel 2,144 1.8% 14,472 12.2% 42,411 35.8% 39,932 33.7% 19,564 3 16.5%
Dermabrasion (not including microdermabrasion) 0 0.0% 402 7.4% 603 11.1% 2,546 46.9% 1,876 34.6%
Full Field Ablative (laser skin resurfacing) 402 1.3% 1,943 6.1% 8,107 25.4% 13,266 41.6% 8,174 25.6%
Micro-Ablative Resurfacing (fractional resurfacing) 268 0.4% 6,298 10.5% 18,760 31.4% 23,517 39.3% 10,921 18.3%
Microdermabrasion 2,010 1.9% 15,142 14.2% 35,309 33.0% 37,989 35.5% 16,549 15.5%Nonsurgical Skin Tightening (incl. Ulthera, Thermage, Pelleve) 0 0.0% 4,489 6.9% 21,306 32.8% 25,795 39.7% 13,333 20.5%
Photorejuvenation (IPL) 3,216 2.8% 14,271 12.6% 38,994 34.4% 37,520 33.1% 19,229 17.0%
Totals - Skin Rejuvenation 8,040 1.6% 57,017 11.4% 165,490 33.0% 180,565 36.1% 89,646 17.9%
Other:
Cellulite Treatment 0 0.0% 1,608 16.8% 3,551 37.1% 3,015 31.5% 1,407 14.7%
Hair Removal (laser or pulsed light) 5,159 1 2.9% 70,685 3 39.6% 71,824 40.2% 26,666 14.9% 4,154 2.3%
Nonsurgical Fat Reduction (incl. CoolSculpting, Vaser Shape, Liposonix) 1,742 1.0% 32,294 17.9% 79,060 3 43.7% 49,513 3 27.4% 18,224 10.1%
Sclerotherapy 0 0.0% 134 1.4% 3,953 42.1% 3,551 37.9% 1,742 18.6%
Tattoo Removal 603 3.8% 8,107 51.5% 4,422 28.1% 2,077 13.2% 536 3.4%
Totals - Other Nonsurgical Procedures 7,504 1.9% 112,828 28.6% 162,810 41.3% 84,822 21.5% 26,063 6.6%
Totals - Nonsurgical Procedures 22,378 0.7% 495,331 15.3% 1,258,528 38.9% 1,053,240 32.5% 409,638 12.6%
AD
Source: American Society for Aesthetic Plastic Surgery
16Please credit the American Society for Aesthetic Plastic Surgery when citing statistical data. Contact: ASAPS Communications • 562.799.2356 • [email protected] • www.surgery.org • fax: 562.799.1098
The top 3 nonsurgical procedures in each age category are indicated in bold and with bold superscript numbers.
* Breast reduction may be covered by insurance, depending on terms of the policy and individual patient factors.Hair transplantation, Polymethylmethacrylate, and Treatment of leg veins were excluded from the results, due to an insuffi cient sample of responding physicians who perform those procedures.

Total population (rounded) = 100%
Percent of Total Surgical Proceduresby Age
Percent of Total Nonsurgical Procedures by Age
Percent of Total Surgical and Nonsurgical Procedures by Age
65+
51-64
0.7% 0.8%
15.3% 18.2%
38.9% 38.8%
26.9% 32.5% 30.7%
9.1% 12.6% 11.5%
18 and under 1.1%Age
19-34 24.3%Age
35-50 38.6%Age
Age
Age
AD
Source: American Society for Aesthetic Plastic Surgery
17Please credit the American Society for Aesthetic Plastic Surgery when citing statistical data. Contact: ASAPS Communications • 562.799.2356 • [email protected] • www.surgery.org • fax: 562.799.1098
2017 Age Distribution for Cosmetic Procedures
2017 Trends AT
Source: American Society for Aesthetic Plastic Surgery
Other SURGICAL PROCEDURES
GOLD STANDARD
13.9%26.3% 16.5%20.1%Breast LiftsLiposuctionUpper Arm LiftsEyelid Surgery
seeing signifi cant growth include:
Surgery is still the Gold Standard when it comes to long-term if not permanent, results.
2017 Trends AT
GOLDGOLD
Despite popular belief, cosmetic surgical procedures are on the rise.
THE FACELIFT IS FAR
FROM “DEAD”FACELIFTS ARE UP 21.9%
Surgical Procedures account for 77% of all plastic surgeons’ business
18Please credit the American Society for Aesthetic Plastic Surgery when citing statistical data. Contact: ASAPS Communications • 562.799.2356 • [email protected] • www.surgery.org • fax: 562.799.1098

$7,737
$7,562
Hair transplantation, Polymethylmethacrylate, and Treatment of leg veins were excluded from the results, due to an insuffi cient sample of responding physicians who perform those procedures.
*Breast reduction may be covered by insurance, depending on terms of the policy and individual patient factors.
2017 National Average for Physician/Surgeon Fees Per Procedure - Surgical
Breast Augmentation - Saline Implants
Breast Augmentation - Silicone Gel Implants
Breast Implant Removal (Breast Implant Explantation)
Breast Lift
Breast Reduction (Women)*
Brow Lift
Buttock Augmentation (Implants only)
Buttock Lift
Chin Augmentation
Ear Surgery
Eyelid Surgery
Facelift
Fat Transfer: Breast
Fat Transfer: Buttock
Fat Transfer: Face
Labiaplasty
Liposuction
Lower Body Lift
Male Breast Reduction (for the treatment of Gynecomastia)
Neck Lift
Nose Surgery
Thigh Lift
Tummy Tuck
Upper Arm Lift
Upper Body Lift
Totals - Surgical Procedures
$148,989,419
$67,740,248
$6,623,692
$75,934,402
$698,616,826
$29,337,080
$32,058,020
$38,454,606
$418,499,352
$3,048
$999,676,314
$470,979,274
$856,707,305
$74,758,477
$50,280,748
$623,186,892
$79,381,496
$13,601,216
$6,566,122,231
Surgical ProcedureTotal ExpendituresNational Average
$123,602,586$2,745
$126,419,721$2,310
$16,153,171$2,709
$198,928,003
$1,168,099,577$4,014
$88,661,550$4,084
$23,827,217$5,080
$135,605,040
$3,291
$3,239
$3,513
$4,895
$5,860
$4,708
$3,121
$2,720
$3,279
$3,765
$4,372
$1,000 millions$100 m $200 m $500 m$10 m0 $5,000 $8,000
$4,906
$5,146
$4,751
$6,083
Source: American Society for Aesthetic Plastic Surgery
$5,342
19Please credit the American Society for Aesthetic Plastic Surgery when citing statistical data. Contact: ASAPS Communications • 562.799.2356 • [email protected] • www.surgery.org • fax: 562.799.1098
$

Nonsurgical Procedure National Average Total ExpendituresInjectables:
Botulinum Toxin (including Botox, Dysport, Xeomin) $420 $650,398,461
Calcium Hydroxylapatite (Radiesse) $697 $29,389,685
Hyaluronic Acid (incl. Juvederm Ultra, Ultra Plus, Voluma, Perlane, Restylane, Belotero) $651 $470,545,780
Poly-L-Latic Acid (Sculptra) $875 $27,627,522
Totals - Injectables $1,177,961,449
Skin Rejuvenation:
Chemical Peel $545 $64,567,775
Dermabrasion (not including microdermabrasion) $1,558 $8,453,475
Full Field Ablative (laser skin resurfacing) $2,560 $81,656,596
Micro-Ablative Resurfacing (fractional resurfacing) $1,236 $73,886,831
Microdermabrasion $149 $15,893,631
Nonsurgical Skin Tightening (incl. Ulthera, Thermage, Pelleve) $1,707 $110,805,383
Photorejuvenation (IPL) $342 $38,669,177
Totals - Skin Rejuvenation $393,932,868
Other:
Cellulite Treatment $2,418 $23,171,074
Hair Removal (laser or pulsed light) $457 $81,547,597
Nonsurgical Fat Reduction (incl. CoolSculpting, Vaser Shape, Liposonix) $1,664 $300,893,454
Sclerotherapy $369 $3,465,629
Tattoo Removal $401 $6,318,941
Totals - Other Nonsurgical Procedures $415,396,694
Totals - Nonsurgical Procedures $1,987,291,011
2017 National Average for Physician/Surgeon Fees Per Procedure - Nonsurgical
• Figures for procedures include but are not limited to those performed by ASAPS members. ASAPS members are plastic surgeons certifi ed by the American Board of Plastic Surgery who specialize in cosmetic surgery of the face and the entire body. Figures are for physician/surgeon fees only and do not include fees for the surgical facility, anesthesia, medical tests, prescriptions, surgical garments, or other miscellaneous costs related to surgery. Figures for procedures often performed on more than one site in the same session refl ect typical fees for one site.
• Component fi gures may not add exactly to totals and percentages may not equal 100% due to rounding. • Hair transplantation, Polymethylmethacrylate, and Treatment of leg veins were excluded from the results,
due to an insuffi cient sample of responding physicians who perform those procedures Source: American Society for Aesthetic Plastic Surgery
20Please credit the American Society for Aesthetic Plastic Surgery when citing statistical data. Contact: ASAPS Communications • 562.799.2356 • [email protected] • www.surgery.org • fax: 562.799.1098
$
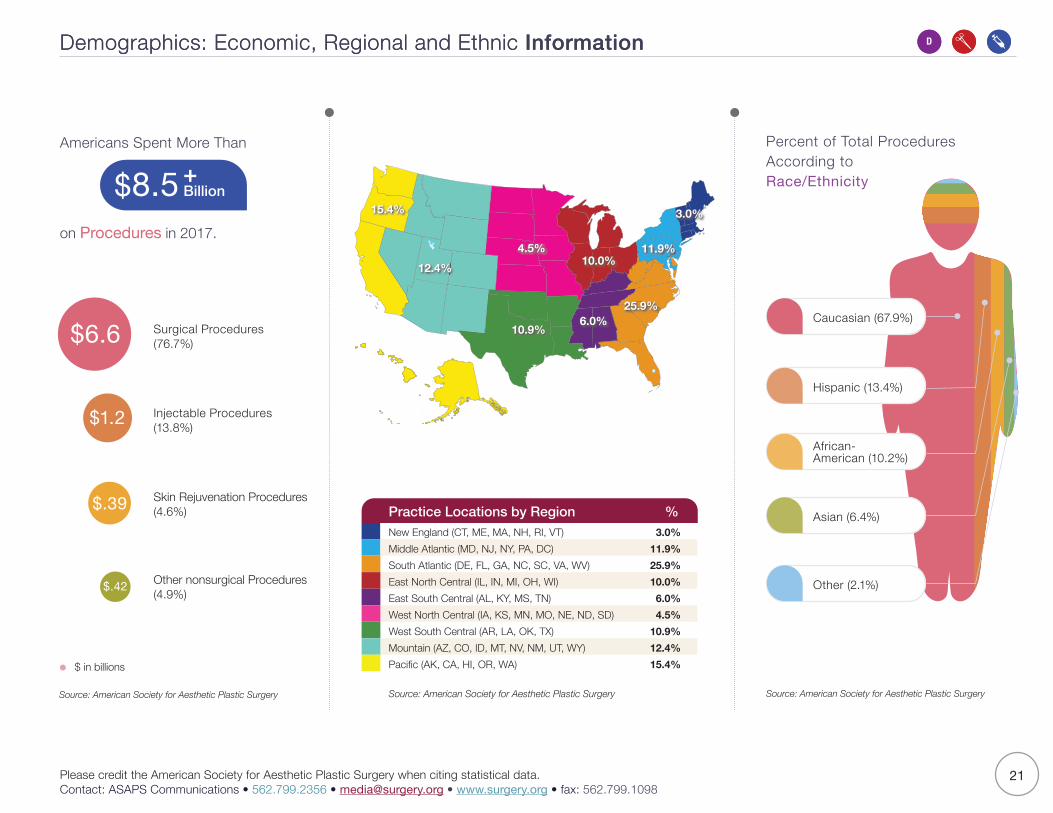
Demographics: Economic, Regional and Ethnic Information D
Source: American Society for Aesthetic Plastic Surgery
CT, ME, MA, NH, RI, VT
MD, NJ, NY, PA, DC
DE, FL, GA, NC, SC, VA, WV
IL, IN, MI, OH, WI
AL, KY, MS, TN
IA, KS, MN, MO, NE, ND, SD
AR, LA, OK, TX
AZ, CO, ID, MT, NV, NM, UT, WY
AK, CA, HI, OR, WA
OTHER
12.4%
15.4%
10.9%6.0%
25.9%
11.9%
3.0%
10.0%4.5%
Demographics: Economic, Regional and Ethnic Information
Percent of Total Procedures According to Race/Ethnicity
$ in billions
New England (CT, ME, MA, NH, RI, VT) 3.0%Middle Atlantic (MD, NJ, NY, PA, DC) 11.9%South Atlantic (DE, FL, GA, NC, SC, VA, WV) 25.9%East North Central (IL, IN, MI, OH, WI) 10.0%East South Central (AL, KY, MS, TN) 6.0%West North Central (IA, KS, MN, MO, NE, ND, SD) 4.5%West South Central (AR, LA, OK, TX) 10.9%Mountain (AZ, CO, ID, MT, NV, NM, UT, WY) 12.4%Pacifi c (AK, CA, HI, OR, WA) 15.4%
Source: American Society for Aesthetic Plastic Surgery
Practice Locations by Region %
Source: American Society for Aesthetic Plastic Surgery
Caucasian (67.9%)
Hispanic (13.4%)
African-American (10.2%)
Asian (6.4%)
Other (2.1%)
D
Americans Spent More Than
8
on Procedures in 2017.
Surgical Procedures (76.7%)$6.6
Injectable Procedures (13.8%)$1.2
Skin Rejuvenation Procedures (4.6%)$.39
Other nonsurgical Procedures(4.9%)$.42
$8.5 Billion
21Please credit the American Society for Aesthetic Plastic Surgery when citing statistical data. Contact: ASAPS Communications • 562.799.2356 • [email protected] • www.surgery.org • fax: 562.799.1098
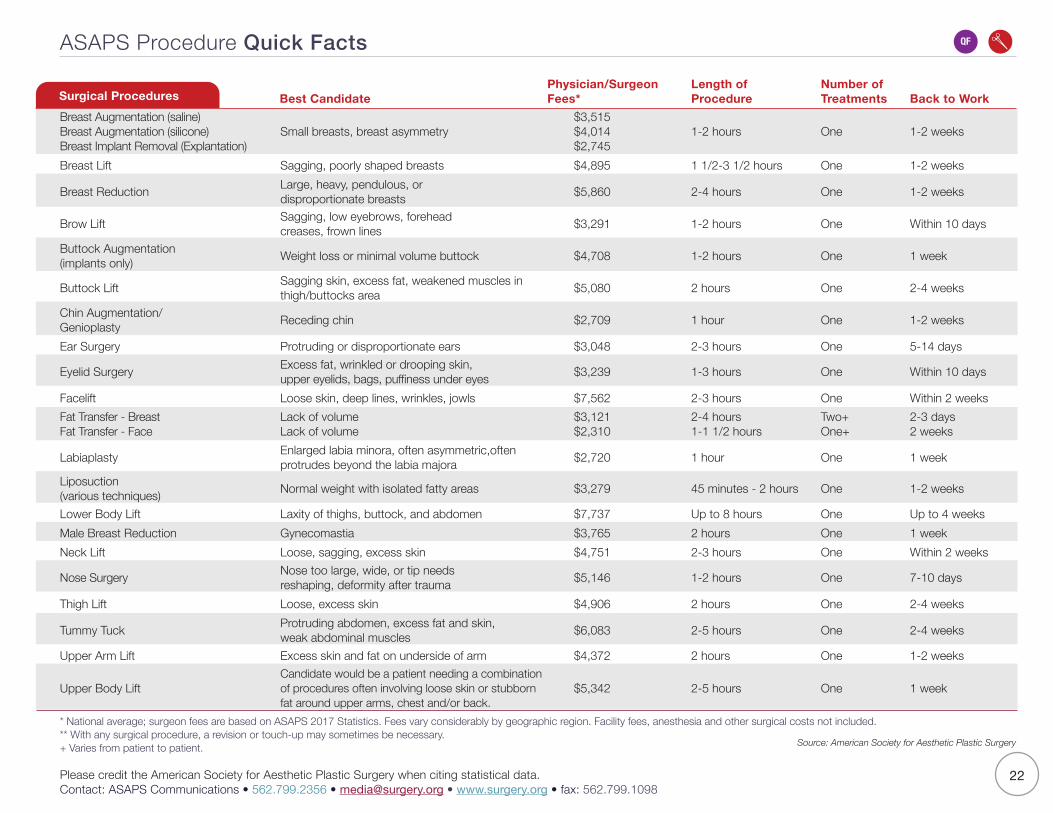
Surgical Procedures Best CandidatePhysician/Surgeon Fees*
Length ofProcedure
Number ofTreatments Back to Work
Breast Augmentation (saline)Breast Augmentation (silicone)Breast Implant Removal (Explantation)
Small breasts, breast asymmetry$3,515$4,014$2,745
1-2 hours One 1-2 weeks
Breast Lift Sagging, poorly shaped breasts $4,895 1 1/2-3 1/2 hours One 1-2 weeks
Breast Reduction Large, heavy, pendulous, or disproportionate breasts $5,860 2-4 hours One 1-2 weeks
Brow Lift Sagging, low eyebrows, forehead creases, frown lines $3,291 1-2 hours One Within 10 days
Buttock Augmentation(implants only) Weight loss or minimal volume buttock $4,708 1-2 hours One 1 week
Buttock Lift Sagging skin, excess fat, weakened muscles in thigh/buttocks area $5,080 2 hours One 2-4 weeks
Chin Augmentation/Genioplasty Receding chin $2,709 1 hour One 1-2 weeks
Ear Surgery Protruding or disproportionate ears $3,048 2-3 hours One 5-14 days
Eyelid Surgery Excess fat, wrinkled or drooping skin, upper eyelids, bags, puffi ness under eyes $3,239 1-3 hours One Within 10 days
Facelift Loose skin, deep lines, wrinkles, jowls $7,562 2-3 hours One Within 2 weeksFat Transfer - BreastFat Transfer - Face
Lack of volumeLack of volume
$3,121$2,310
2-4 hours1-1 1/2 hours
Two+One+
2-3 days2 weeks
Labiaplasty Enlarged labia minora, often asymmetric,often protrudes beyond the labia majora $2,720 1 hour One 1 week
Liposuction (various techniques) Normal weight with isolated fatty areas $3,279 45 minutes - 2 hours One 1-2 weeks
Lower Body Lift Laxity of thighs, buttock, and abdomen $7,737 Up to 8 hours One Up to 4 weeksMale Breast Reduction Gynecomastia $3,765 2 hours One 1 weekNeck Lift Loose, sagging, excess skin $4,751 2-3 hours One Within 2 weeks
Nose Surgery Nose too large, wide, or tip needs reshaping, deformity after trauma $5,146 1-2 hours One 7-10 days
Thigh Lift Loose, excess skin $4,906 2 hours One 2-4 weeks
Tummy Tuck Protruding abdomen, excess fat and skin, weak abdominal muscles $6,083 2-5 hours One 2-4 weeks
Upper Arm Lift Excess skin and fat on underside of arm $4,372 2 hours One 1-2 weeks
Upper Body Lift Candidate would be a patient needing a combination of procedures often involving loose skin or stubborn fat around upper arms, chest and/or back.
$5,342 2-5 hours One 1 week
ASAPS Procedure Quick Facts
* National average; surgeon fees are based on ASAPS 2017 Statistics. Fees vary considerably by geographic region. Facility fees, anesthesia and other surgical costs not included.** With any surgical procedure, a revision or touch-up may sometimes be necessary.+ Varies from patient to patient.
QF
Source: American Society for Aesthetic Plastic Surgery
22Please credit the American Society for Aesthetic Plastic Surgery when citing statistical data. Contact: ASAPS Communications • 562.799.2356 • [email protected] • www.surgery.org • fax: 562.799.1098

Nonsurgical Procedures Best CandidatePhysician/Surgeon Fees*
Length ofProcedure
Number ofTreatments Back to Work
Botulinum Toxin (Botox, Dysport, Xeomin) Frown lines, crow’s feet $420 30 minutes
Repeat treatments 4-6 months (onset ofactions in 1-5 days)
No downtime
Calcium Hydroxylapatite (Radiesse)
Nasolabial folds, frown lines, crow’s feet, lips $697 Less than 1 hour Repeat treatments
2 years or longer No downtime
Chemical Peel (ranges from light to deep)
Sun-damaged, unevenly pigmented skin $545 1/2 hour - 3 hours
Depends on type of peelOne or multiple Depends on type of peel
Depends on type of peel
Dermabrasion Acne, wrinkles around mouth, sun-damaged skin $1,558 A few minutes -
1 1/2 hours Multiple sessions 7-10 days
Full Field Ablative(laser skin resurfacing)
Fair, non-oily skin, sun-damaged facial skin, wrinkles around mouth and eyes, acne scars
$2,560 Variable, up to 1 1/2 hours One or multiple depending on laser and skin condition
Variable, up to 14 days
Hyaluronic Acid (including Juvederm Ultra, Ultra Plus, Voluma, Perlane, Restylane, Belotero)
Nasolabial folds, forehead wrinkles, smile lines, and lips $651 Less than 1 hour Repeat treatments
4 months – 1 year No downtime
Laser Hair Removal Unwanted hair on face or body $457 1-2 hours Depends on area Multiple sessions No downtime
Micro-Ablative Resurfacing(fractional resurfacing)
Actinic changes, lines, acne scars,pigment, superfi cial lines $1,236 30 minutes - 1 hour 1-6 depending 1-10 days
depending
Microdermabrasion Fine lines, crow’s feet, age spots, acne scars $149 30 minutes - 1 hour Multiple sessions
2-3 week intervals No downtime
Nonsurgical Fat Reduction (including CoolSculpting, Vaser Shape, Liposonix)
Diet-resistant fat, mild lipodystrophy $1,664 1-3 hours 1-6 No downtime,minimal soreness
Nonsurgical Skin Tightening (including Ulthera, Thermage, Pelleve)
Early skin laxity with good skin tone and elasticity $1,707 1-2 hours 1-6 Minimal downtime
Photorejuvenation (IPL) Pigment, superfi cial lines $342 10-30 minutes 3-5 No downtime
Poly-L-Latic Acid (Sculptra) Cheeks, temple, jawline, volume loss, fat in face $875 Less than 1 hour 2-4 Minimal downtime
Sclerotherapy Spider veins $369 30 minutes - 1 hour 3-4 Treatments Injections No downtime
Tattoo Laser Treatment Unwanted tattoo $401 10 minutes - 1 hour Multiple sessions No downtime
ASAPS Procedure Quick Facts continued
* National average; surgeon fees are based on ASAPS 2017 Statistics. Fees vary considerably by geographic region. Facility fees, anesthesia and other surgical costs not included.** With any surgical procedure, a revision or touch-up may sometimes be necessary.
QF
Source: American Society for Aesthetic Plastic Surgery
23Please credit the American Society for Aesthetic Plastic Surgery when citing statistical data. Contact: ASAPS Communications • 562.799.2356 • [email protected] • www.surgery.org • fax: 562.799.1098
QF
24Please credit the American Society for Aesthetic Plastic Surgery when citing statistical data. Contact: ASAPS Communications • 562.799.2356 • [email protected] • www.surgery.org • fax: 562.799.1098
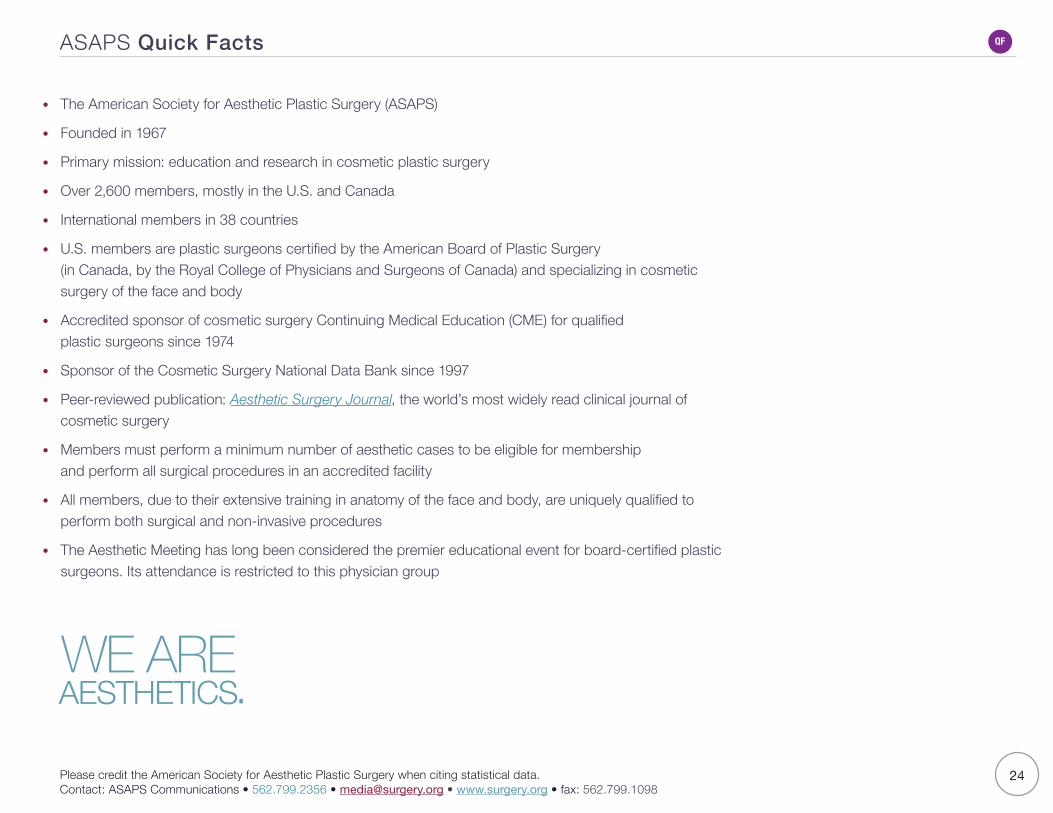
ASAPS Quick Facts
• The American Society for Aesthetic Plastic Surgery (ASAPS)
• Founded in 1967
• Primary mission: education and research in cosmetic plastic surgery
• Over 2,600 members, mostly in the U.S. and Canada
• International members in 38 countries
• U.S. members are plastic surgeons certifi ed by the American Board of Plastic Surgery (in Canada, by the Royal College of Physicians and Surgeons of Canada) and specializing in cosmetic surgery of the face and body
• Accredited sponsor of cosmetic surgery Continuing Medical Education (CME) for qualifi ed plastic surgeons since 1974
• Sponsor of the Cosmetic Surgery National Data Bank since 1997
• Peer-reviewed publication: Aesthetic Surgery Journal, the world’s most widely read clinical journal of cosmetic surgery
• Members must perform a minimum number of aesthetic cases to be eligible for membership and perform all surgical procedures in an accredited facility
• All members, due to their extensive training in anatomy of the face and body, are uniquely qualifi ed to perform both surgical and non-invasive procedures
• The Aesthetic Meeting has long been considered the premier educational event for board-certifi ed plastic surgeons. Its attendance is restricted to this physician group

For Consumers:www.smartbeautyguide.com (Procedural info, physician Q&As, blogs, surgeon locator and more)
For Physicians and Media: www.surgery.org (For annual statistics, press releases and news) www.aestheticsurgeryjournal.com (The clinical journal of the American Society for Aesthetic Plastic Surgery)
Social: Follow ASAPS on Twitter: www.twitter.com/ASAPS Become a fan of ASAPS on Facebook: www.facebook.com/AestheticSociety Check us out on Instagram: www.instagram.com/theaestheticsocietyasaps/ Join Smart Beauty Guide: www.smartbeautyguide.com Locate a plastic surgeon in your area: www.smartbeautyguide.com/select-surgeon
The Aesthetic Society has a number of websites devoted to consumers, (to help them make informed decisions), physicians and media.
The American Society for Aesthetic Plastic Surgery
ASAPS Communications Office36 West 44th Street, Suite 1205New York, NY 10036
Phone: 562.799.2356 Fax: 562.799.1098