cosa survey rainforest alliance certified farms
TRANSCRIPT
Cote d’Ivoire Cocoa:
COSA Survey of
Rainforest Alliance Certified Farms
June 11, 2012
Title: Cote d’Ivoire Cocoa: A COSA Survey of Rainforest Alliance Certified Farms Field Researchers:
The 2011-12 Cote d’Ivoire national team was composed of: Frances Hammond d’Almeida Kouao; Akeko Saturnine Anselme; Konan Amoine Sandrine; Sery Bi Ya Fabrice; Gueye Monhessea Eric; Rodrigue Oria Patrick; and Ebrotie Eric. Melanie Bayo provided key coordination.
The 2009 Cote d’Ivoire national team was composed of: Melanie Bayo; Assiri Jean; Kouassi Tchabeou Arsene; Kouassi Yao Marc; and Kra N’Guessan.
Trainers: Jaclyn Daitchman and Mica Bennett (2011).Udo Hoeggel and Normand Roy (2009). Authors: Mica Bennett, Gian Nicola Francesconi, Daniele Giovannucci, and Jaclyn Daitchman Chief Analyst: Angelo Zago, Professor, Department of Economics, University of Verona, Verona, Italy Coordinators: Will Crosse, Rainforest Alliance; Mica Bennett, COSA Data collection periods:
November 2009
December 2011 – February 2012 Measure and Conversions:
The Cote d’Ivoire XOF is the official currency.
During the 2011 field data collection period the exchange rate with the US Dollar varied between 477 and 507. The report uses the average rate for the period of 491 XOF to a dollar.
During the 2009 field data collection period the exchange rate with the US Dollar varied between 426 and 446. The report uses the average rate for the period of 433 XOF to a dollar.
The term “target” is used to denote the targeted entities that were assessed (treatment group) while “control” is used for those entities not targeted by the intervention and selected for comparison purposes and to help address the counterfactual questions.
Acknowledgements: We wish to acknowledge the Rainforest Alliance Evaluation and Research team for being open to an independent agency undertaking this work to assess the effects of RA’s certification efforts. Our COSA team deeply appreciates their understanding of the challenges and the necessary efforts required to get scientifically sound data in a credible manner when operating in difficult field conditions. This report is submitted to Rainforest Alliance and is not for public dissemination without prior approval.
Table of Contents
1. Executive summary .............................................................................................................. 1 2. Project Purpose - Taking Stock ........................................................................................... 2 3. Background .......................................................................................................................... 3
Cocoa production in Cote d’Ivoire ........................................................................................... 3 4. Methods ................................................................................................................................ 4
Project management, organization and process ...................................................................... 4 Sampling and analysis ............................................................................................................ 4
5. Key Findings in Côte D’Ivoire .............................................................................................. 7 Interpreting the statistics ......................................................................................................... 7 Results ................................................................................................................................... 7
Performance in 2011 .................................................................................................... 7 Economic sustainability .......................................................................................... 7 Social sustainability...............................................................................................12 Environmental sustainability ..................................................................................14 Overall sustainability .............................................................................................17
Certification effects over time: significant results compared for 2009 and 2011 ............18 6. Conclusions and next steps .............................................................................................. 19 Annex 1 – Outline of propensity score matching analysis for this report ............................................. 21 Annex 2 – Propensity score estimation .............................................................................................. 23 Annex 3 – Treatment effects for indicators discussed in the report ..................................................... 26 Annex 4 – Indicators significant in 2011 and not discussed in the report ............................................ 33 Annex 5 – Indicators with no significant differences between target and control groups in 2011 ......... 39 Annex 6 – Selected economic indicators ........................................................................................... 41 Annex 7 – Significant Indicator descriptions ....................................................................................... 42
1
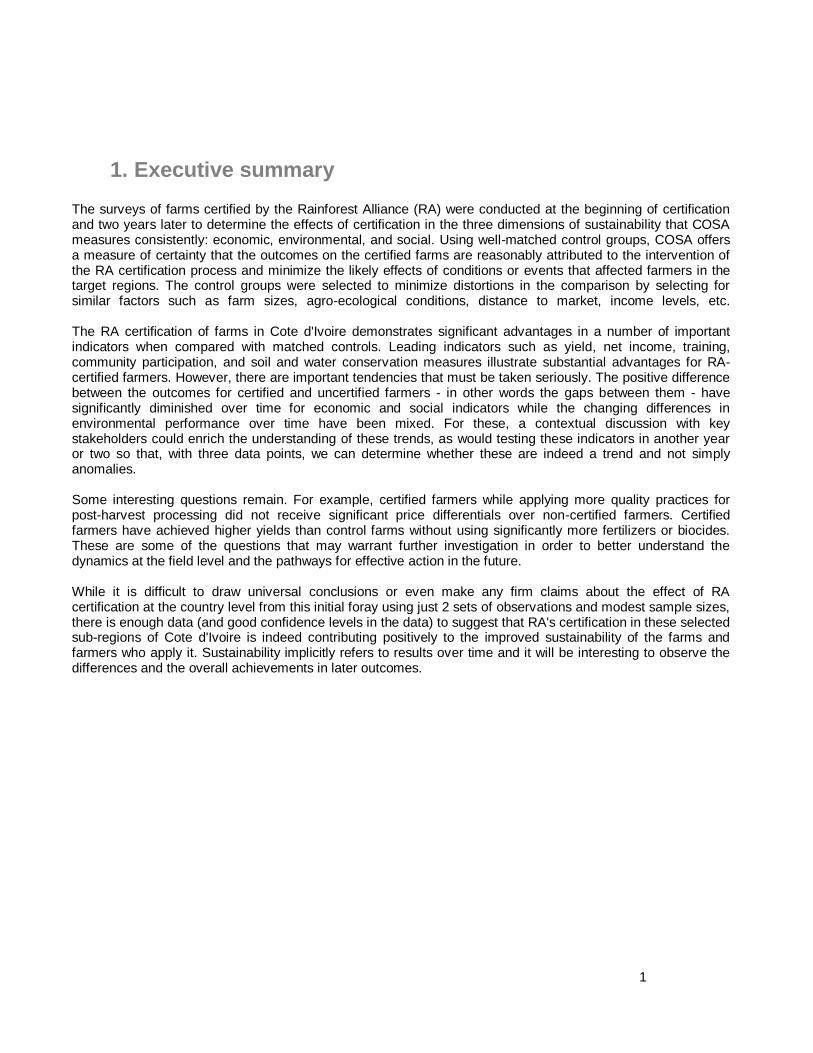
1. Executive summary
The surveys of farms certified by the Rainforest Alliance (RA) were conducted at the beginning of certification and two years later to determine the effects of certification in the three dimensions of sustainability that COSA measures consistently: economic, environmental, and social. Using well-matched control groups, COSA offers a measure of certainty that the outcomes on the certified farms are reasonably attributed to the intervention of the RA certification process and minimize the likely effects of conditions or events that affected farmers in the target regions. The control groups were selected to minimize distortions in the comparison by selecting for similar factors such as farm sizes, agro-ecological conditions, distance to market, income levels, etc. The RA certification of farms in Cote d'Ivoire demonstrates significant advantages in a number of important indicators when compared with matched controls. Leading indicators such as yield, net income, training, community participation, and soil and water conservation measures illustrate substantial advantages for RA-certified farmers. However, there are important tendencies that must be taken seriously. The positive difference between the outcomes for certified and uncertified farmers - in other words the gaps between them - have significantly diminished over time for economic and social indicators while the changing differences in environmental performance over time have been mixed. For these, a contextual discussion with key stakeholders could enrich the understanding of these trends, as would testing these indicators in another year or two so that, with three data points, we can determine whether these are indeed a trend and not simply anomalies. Some interesting questions remain. For example, certified farmers while applying more quality practices for post-harvest processing did not receive significant price differentials over non-certified farmers. Certified farmers have achieved higher yields than control farms without using significantly more fertilizers or biocides. These are some of the questions that may warrant further investigation in order to better understand the dynamics at the field level and the pathways for effective action in the future. While it is difficult to draw universal conclusions or even make any firm claims about the effect of RA certification at the country level from this initial foray using just 2 sets of observations and modest sample sizes, there is enough data (and good confidence levels in the data) to suggest that RA's certification in these selected sub-regions of Cote d'Ivoire is indeed contributing positively to the improved sustainability of the farms and farmers who apply it. Sustainability implicitly refers to results over time and it will be interesting to observe the differences and the overall achievements in later outcomes.
2
2. Project Purpose - Taking Stock
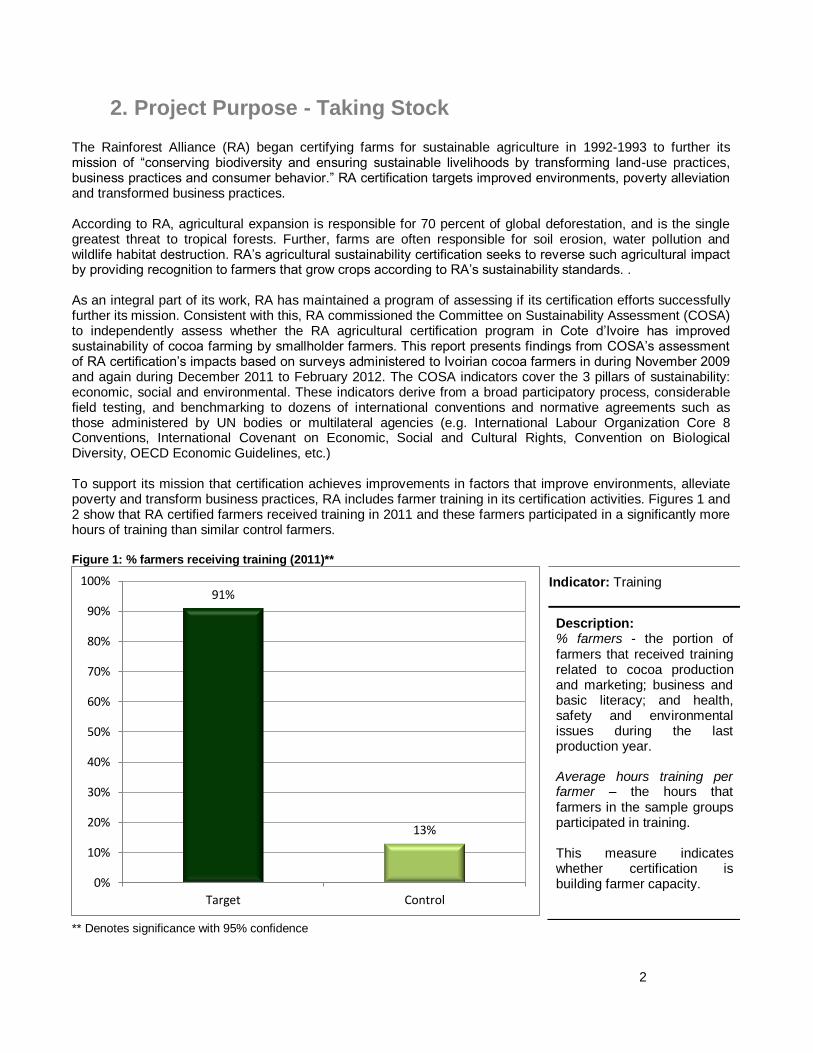
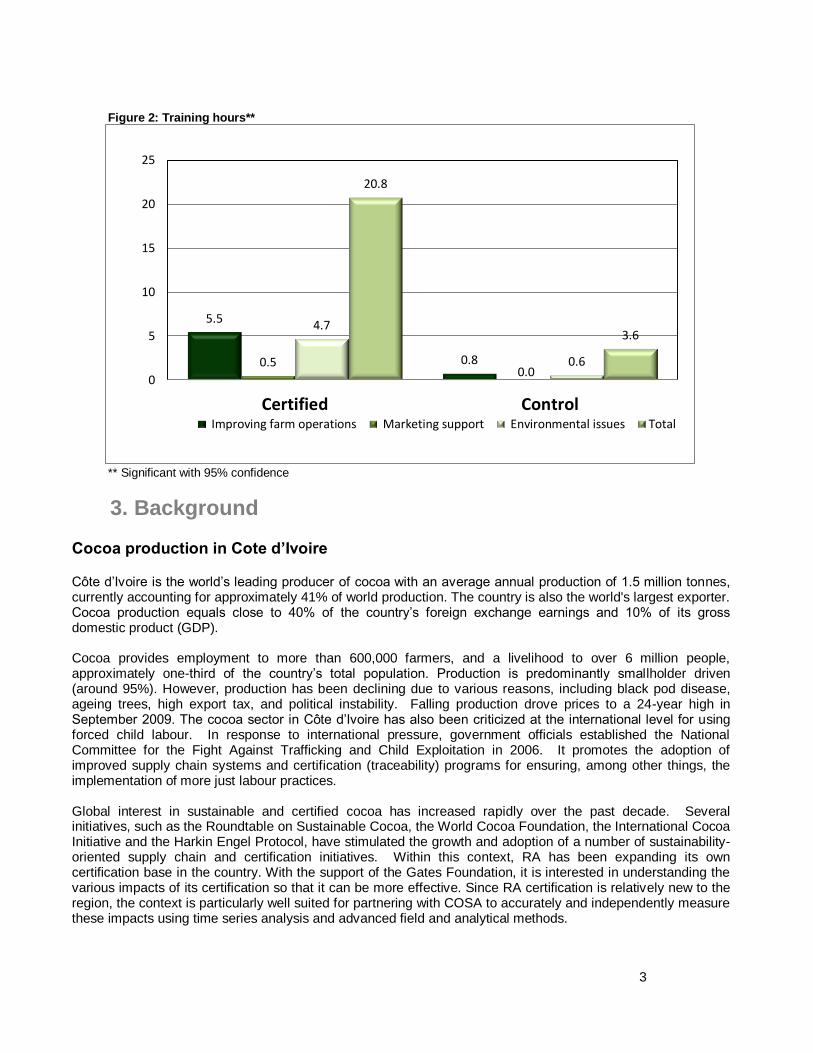
The Rainforest Alliance (RA) began certifying farms for sustainable agriculture in 1992-1993 to further its mission of “conserving biodiversity and ensuring sustainable livelihoods by transforming land-use practices, business practices and consumer behavior.” RA certification targets improved environments, poverty alleviation and transformed business practices. According to RA, agricultural expansion is responsible for 70 percent of global deforestation, and is the single greatest threat to tropical forests. Further, farms are often responsible for soil erosion, water pollution and wildlife habitat destruction. RA’s agricultural sustainability certification seeks to reverse such agricultural impact by providing recognition to farmers that grow crops according to RA’s sustainability standards. . As an integral part of its work, RA has maintained a program of assessing if its certification efforts successfully further its mission. Consistent with this, RA commissioned the Committee on Sustainability Assessment (COSA) to independently assess whether the RA agricultural certification program in Cote d’Ivoire has improved sustainability of cocoa farming by smallholder farmers. This report presents findings from COSA’s assessment of RA certification’s impacts based on surveys administered to Ivoirian cocoa farmers in during November 2009 and again during December 2011 to February 2012. The COSA indicators cover the 3 pillars of sustainability: economic, social and environmental. These indicators derive from a broad participatory process, considerable field testing, and benchmarking to dozens of international conventions and normative agreements such as those administered by UN bodies or multilateral agencies (e.g. International Labour Organization Core 8 Conventions, International Covenant on Economic, Social and Cultural Rights, Convention on Biological Diversity, OECD Economic Guidelines, etc.) To support its mission that certification achieves improvements in factors that improve environments, alleviate poverty and transform business practices, RA includes farmer training in its certification activities. Figures 1 and 2 show that RA certified farmers received training in 2011 and these farmers participated in a significantly more hours of training than similar control farmers. Figure 1: % farmers receiving training (2011)**
** Denotes significance with 95% confidence
91%
13%
0%
10%
20%
30%
40%
50%
60%
70%
80%
90%
100%
Target Control
Indicator: Training
Description: % farmers - the portion of farmers that received training related to cocoa production and marketing; business and basic literacy; and health, safety and environmental issues during the last production year. Average hours training per farmer – the hours that farmers in the sample groups participated in training. This measure indicates whether certification is building farmer capacity.
3
Figure 2: Training hours**
** Significant with 95% confidence
3. Background
Cocoa production in Cote d’Ivoire
Côte d’Ivoire is the world’s leading producer of cocoa with an average annual production of 1.5 million tonnes, currently accounting for approximately 41% of world production. The country is also the world's largest exporter. Cocoa production equals close to 40% of the country’s foreign exchange earnings and 10% of its gross domestic product (GDP). Cocoa provides employment to more than 600,000 farmers, and a livelihood to over 6 million people, approximately one-third of the country’s total population. Production is predominantly smallholder driven (around 95%). However, production has been declining due to various reasons, including black pod disease, ageing trees, high export tax, and political instability. Falling production drove prices to a 24-year high in September 2009. The cocoa sector in Côte d’Ivoire has also been criticized at the international level for using forced child labour. In response to international pressure, government officials established the National Committee for the Fight Against Trafficking and Child Exploitation in 2006. It promotes the adoption of improved supply chain systems and certification (traceability) programs for ensuring, among other things, the implementation of more just labour practices. Global interest in sustainable and certified cocoa has increased rapidly over the past decade. Several initiatives, such as the Roundtable on Sustainable Cocoa, the World Cocoa Foundation, the International Cocoa Initiative and the Harkin Engel Protocol, have stimulated the growth and adoption of a number of sustainability-oriented supply chain and certification initiatives. Within this context, RA has been expanding its own certification base in the country. With the support of the Gates Foundation, it is interested in understanding the various impacts of its certification so that it can be more effective. Since RA certification is relatively new to the region, the context is particularly well suited for partnering with COSA to accurately and independently measure these impacts using time series analysis and advanced field and analytical methods.
5.5
0.8 0.5
4.7
0.6
20.8
3.6
0
5
10
15
20
25
Certified Control Improving farm operations Marketing support Environmental issues Total
0.0
4
4. Methods
Project management, organization and process
Based on RA’s objective to assess the impact of its certification project in Cote d’Ivoire over time, COSA developed the project, and then engaged Ivoirian national Country Coordinators
1 to gather expert sector
knowledge for sample selection and select, organize and oversee surveyors to administer COSA’s data collection instruments to selected farmers and groups. The surveyors also entered the data into COSA’s global database using a web-based, automated data entry tool. COSA international staff monitored the data as it was entered and provided data quality assurance coaching to surveyors. COSA international staff performed first stage data cleaning, identifying missing data and implausible data and then working with surveyors to acquire or improve data. COSA also engaged a consultant to analyze the data for reaching conclusions about the impact of RA certification on the population of Ivoirian farmers.
Sampling and analysis
COSA designs its samples and analyzes data to estimate to the degree possible the effects of specific agricultural interventions – certification was targeted in this assessment – on farm-level results. For sampling, COSA selects groups of farms participating in the intervention that are as representative as possible of the overall target population of farms. COSA then works with the national partners to identify control groups that will serve as good counterfactuals. Counterfactuals need to be as similar as possible to target groups in agro-ecological and socio-demographic factors so that any differences in performance between the groups are more likely to stem from the intervention than from other influences. Even with target and control farms selected from co-operatives that matched on the factors cited above, other factors potentially remain that could bias measures of impact. COSA used propensity score matching (PSM) techniques to further control for differences other than RA certification which would affect farm performance. In PSM, analysts use Probit regression to develop a realistic model that predicts the farms’ propensity to participate in the intervention. The model then produces a score for each farm in both the target and control groups. Target and control farms with similar scores will be similar except for certification status. Therefore, any differences in performance between the matched farms could be attributed to certification. This method, in combination with the other steps, is intended to correct for much of the selection bias that might exist for the certified farms. For example, critics of certification sometimes maintain that certification programs target better-performing farmers to begin with, or that better-performing farmers may seek out certification, so these would have performed better than other farmers even without certification. Annexes 1 and 2 explain PSM, its conceptual foundations and its use in this project in more detail. RA Cote d’Ivoire sample and surveys
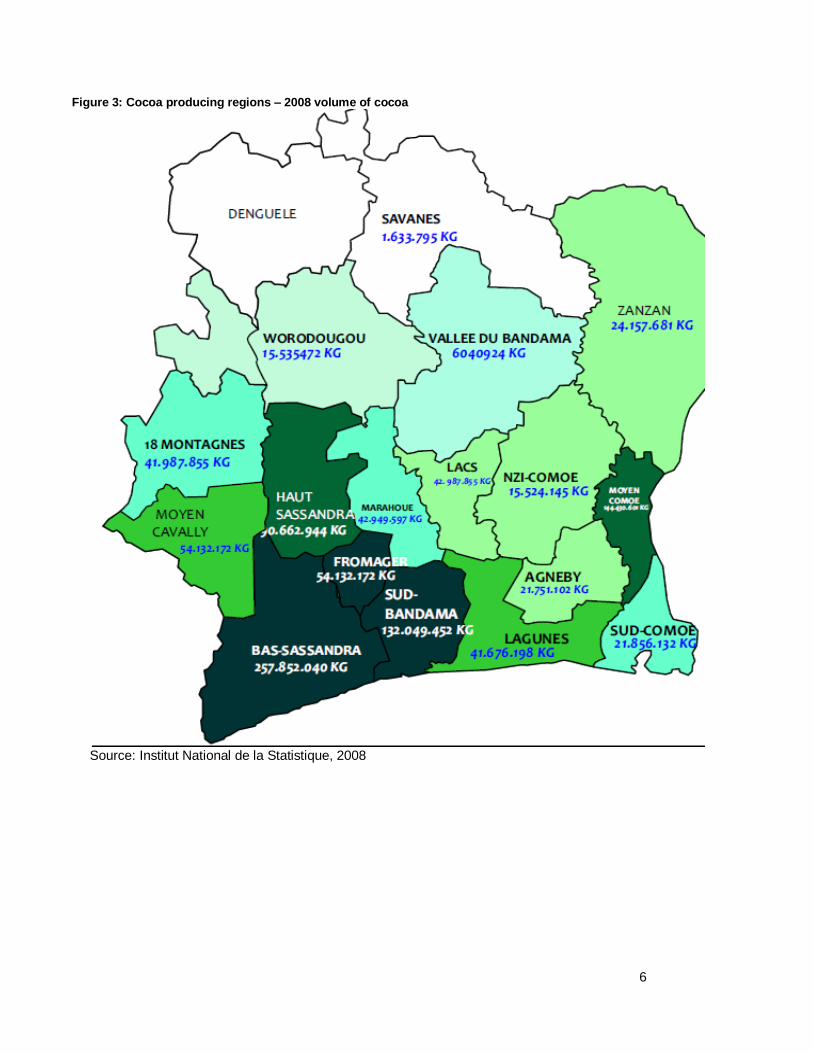
The initial sample design and selection of target cooperatives occurred in 2009. Table 1 lists the selected cooperatives. The Country Coordinator then also identified control cooperatives considered to be appropriate matches for the target groups. Representative villages were then chosen and farmers were randomly selected from these villages. The 2009 sample groups contained 95 certified treatment farms and 105 control farms for a total of 200. As Figure 3 shows, the 2009 cooperatives were located in Haut Sassandra and Bas Sassandra, two of the three regions with the greatest cocoa production in terms of both area and volume in western Cote d’Ivoire. 1 Country Coordinator changed in 2011 because the 2009 institution (ANADER) and some of the executing agents were no
longer available. This escalated the costs of preparation, training and management as independent surveyors with university backgrounds in data analysis administered the field surveys.
5
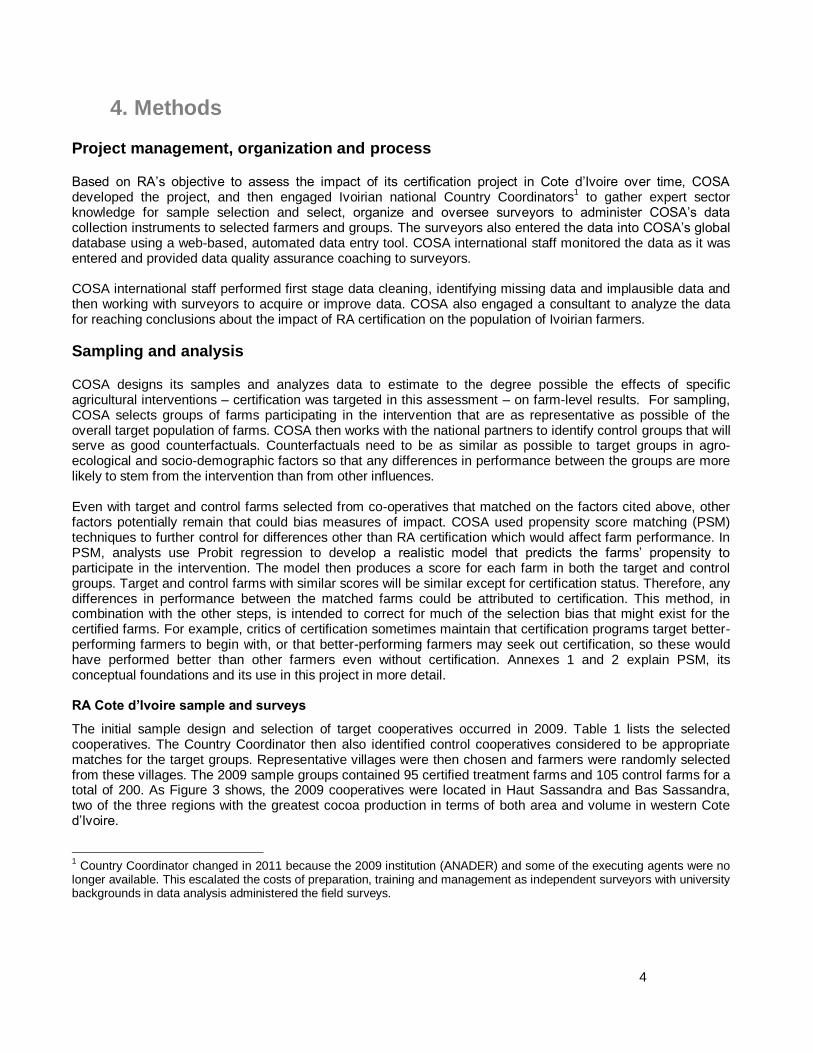
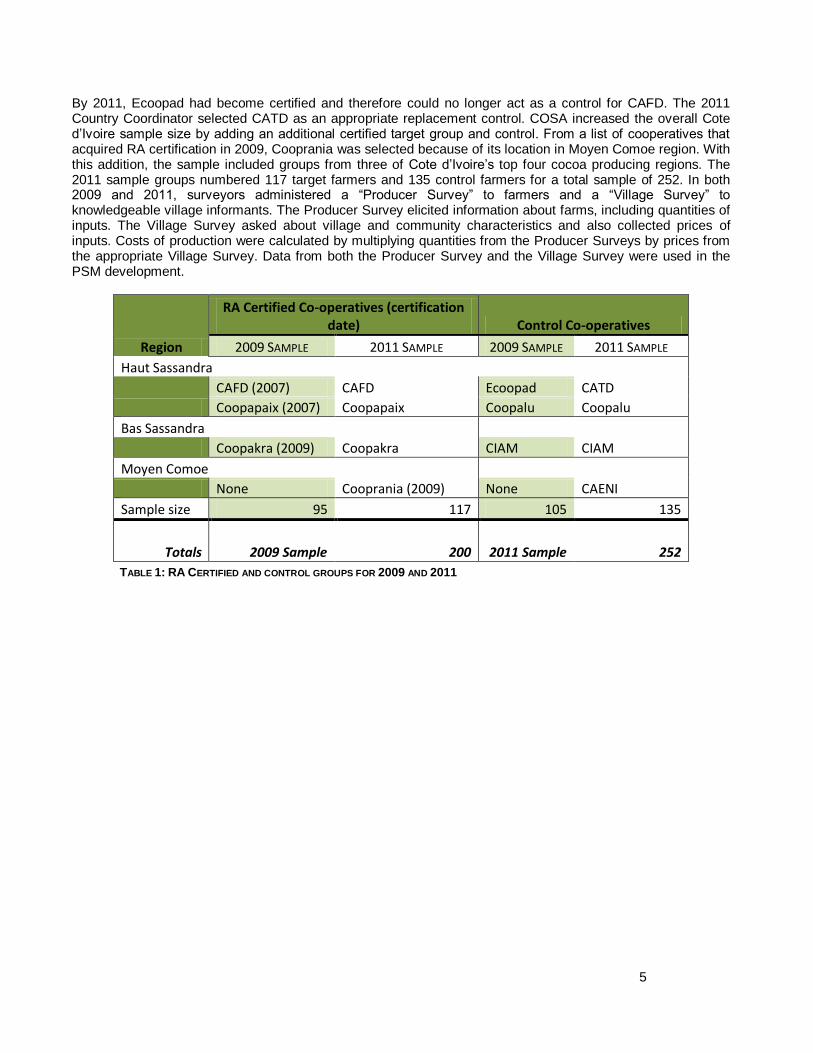
By 2011, Ecoopad had become certified and therefore could no longer act as a control for CAFD. The 2011 Country Coordinator selected CATD as an appropriate replacement control. COSA increased the overall Cote d’Ivoire sample size by adding an additional certified target group and control. From a list of cooperatives that acquired RA certification in 2009, Cooprania was selected because of its location in Moyen Comoe region. With this addition, the sample included groups from three of Cote d’Ivoire’s top four cocoa producing regions. The 2011 sample groups numbered 117 target farmers and 135 control farmers for a total sample of 252. In both 2009 and 2011, surveyors administered a “Producer Survey” to farmers and a “Village Survey” to knowledgeable village informants. The Producer Survey elicited information about farms, including quantities of inputs. The Village Survey asked about village and community characteristics and also collected prices of inputs. Costs of production were calculated by multiplying quantities from the Producer Surveys by prices from the appropriate Village Survey. Data from both the Producer Survey and the Village Survey were used in the PSM development.
Region
RA Certified Co-operatives (certification date) Control Co-operatives
2009 SAMPLE 2011 SAMPLE 2009 SAMPLE 2011 SAMPLE
Haut Sassandra
CAFD (2007) CAFD Ecoopad CATD
Coopapaix (2007) Coopapaix Coopalu Coopalu
Bas Sassandra
Coopakra (2009) Coopakra CIAM CIAM
Moyen Comoe
None Cooprania (2009) None CAENI
Sample size 95 117 105 135
Totals 2009 Sample 200 2011 Sample
252
TABLE 1: RA CERTIFIED AND CONTROL GROUPS FOR 2009 AND 2011
6
Figure 3: Cocoa producing regions – 2008 volume of cocoa
Source: Institut National de la Statistique, 2008
7
5. Key Findings in Côte D’Ivoire
Interpreting the statistics
The main results of COSA’s work are reported below in 2 parts. First, we display results where, according to PSM analysis, the performance by certified farms differed significantly in 2011 from control farms on key economic, social and environmental indicators. Second, we examine the effect of certification over time by comparing indicators with significant differences between certified and control performance in 2009, the degree of difference in 2009, and the degree of difference on the same indicators in 2011. These results are presented in graphs for easy reading with minimal interpretation.
The analyses tend to emphasize results from data collected in 2011. The 2011 dataset is 20% larger and provides the more reliable estimates.
2 In addition, the certification process was not yet fully completed in 2009,
while in 2011 it was completed and therefore the latest survey is more likely to capture the broader impacts of certification — particularly in the social and environmental dimensions that can take time to manifest. The strongest results are those that persisted in significance from 2009 through to 2011. These results highlight longer term patterns of certification. The 2011 results can nonetheless be informative and useful for decision-making. This can be confirmed during a follow-up discussion with key stakeholders that can improve understanding of the data within its contextual reality.
For the significant indicators, we present means for both the target and the control groups. The mean values for the target group are the actual values measured for this group. We started from these actual target group values to arrive at the means for the control group. To do this, we calculated the differences between target and control groups for farms that are truly similar according to propensity score matching, which yielded the “average treatment effects on the treated (ATTs)”. Finally, we subtracted the ATTs from the target group mean values to infer the mean values for the control group. With this procedure, the results reflect differences only between farms that are truly similar, giving the best estimate of the effects of certification.
Annexes 1 and 2 report further analytical and statistical details with regard to the results presented in Figures 4 to 17.
Results
Performance in 2011
The following graphs show the sustainability indicators which display significant differences between certified and control groups in 2011. By this time, more than one year had passed since certification for all farms and more than 3 years had passed for the CAFD and Coopapaix farmers. See Annex 4 for tables on other significant indicators not illustrated here and see Annex 5 for indicators not exhibiting significant differences between target and control groups.
Economic sustainability
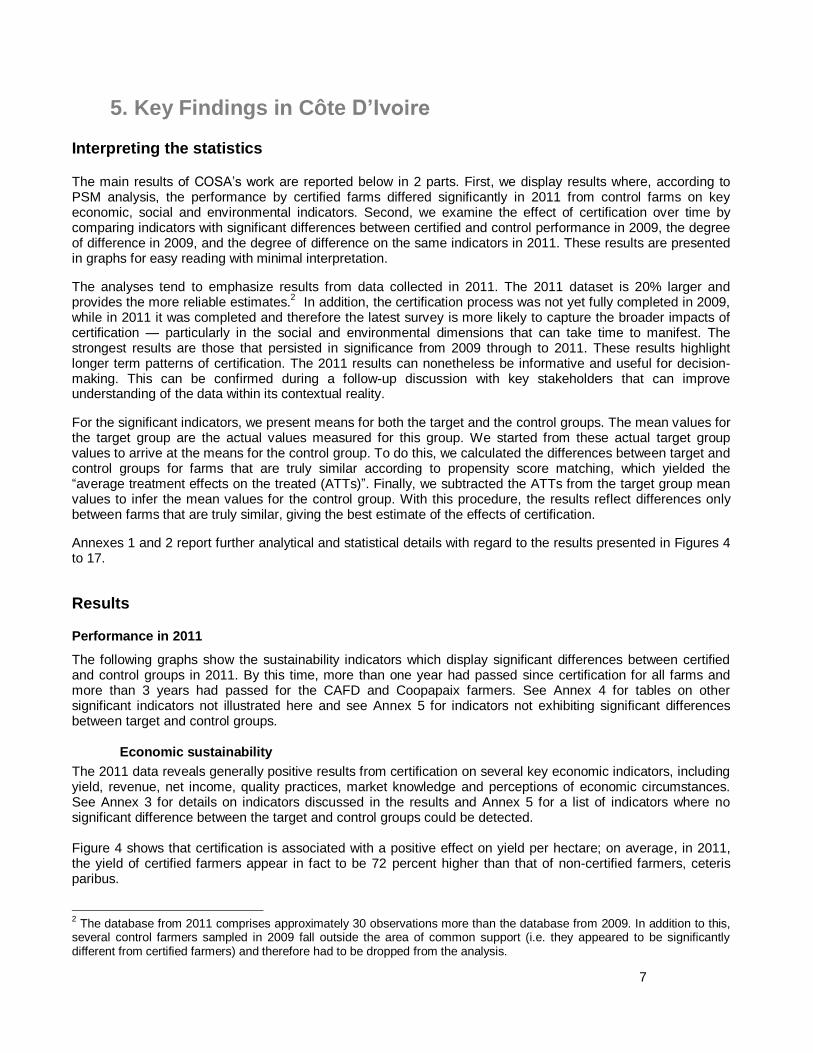
The 2011 data reveals generally positive results from certification on several key economic indicators, including yield, revenue, net income, quality practices, market knowledge and perceptions of economic circumstances. See Annex 3 for details on indicators discussed in the results and Annex 5 for a list of indicators where no significant difference between the target and control groups could be detected. Figure 4 shows that certification is associated with a positive effect on yield per hectare; on average, in 2011, the yield of certified farmers appear in fact to be 72 percent higher than that of non-certified farmers, ceteris paribus. 2 The database from 2011 comprises approximately 30 observations more than the database from 2009. In addition to this,
several control farmers sampled in 2009 fall outside the area of common support (i.e. they appeared to be significantly different from certified farmers) and therefore had to be dropped from the analysis.
8
Figure 4: Yield (kg/ha) 2011**
** Denotes significance with 95% confidence
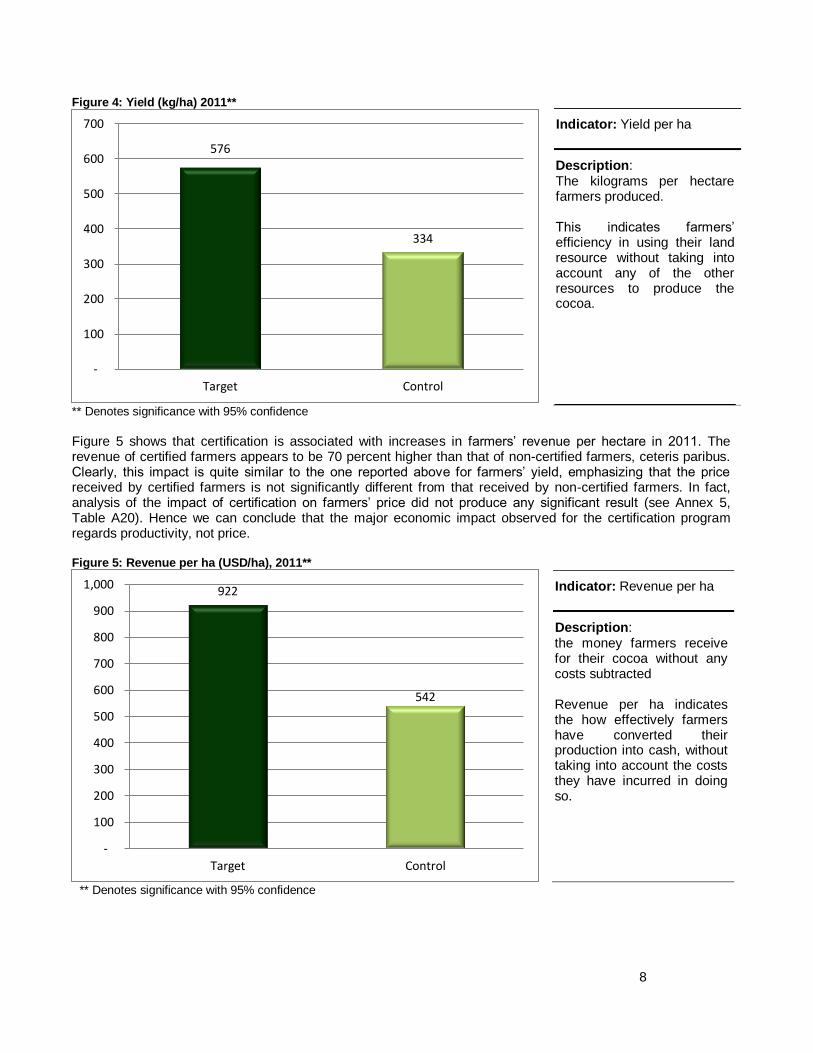
Figure 5 shows that certification is associated with increases in farmers’ revenue per hectare in 2011. The revenue of certified farmers appears to be 70 percent higher than that of non-certified farmers, ceteris paribus. Clearly, this impact is quite similar to the one reported above for farmers’ yield, emphasizing that the price received by certified farmers is not significantly different from that received by non-certified farmers. In fact, analysis of the impact of certification on farmers’ price did not produce any significant result (see Annex 5, Table A20). Hence we can conclude that the major economic impact observed for the certification program regards productivity, not price. Figure 5: Revenue per ha (USD/ha), 2011**
** Denotes significance with 95% confidence
576
334
-
100
200
300
400
500
600
700
Target Control
922
542
-
100
200
300
400
500
600
700
800
900
1,000
Target Control
Indicator: Revenue per ha
Description: the money farmers receive for their cocoa without any costs subtracted Revenue per ha indicates the how effectively farmers have converted their production into cash, without taking into account the costs they have incurred in doing so.
Indicator: Yield per ha
Description: The kilograms per hectare farmers produced. This indicates farmers’ efficiency in using their land resource without taking into account any of the other resources to produce the cocoa.
9
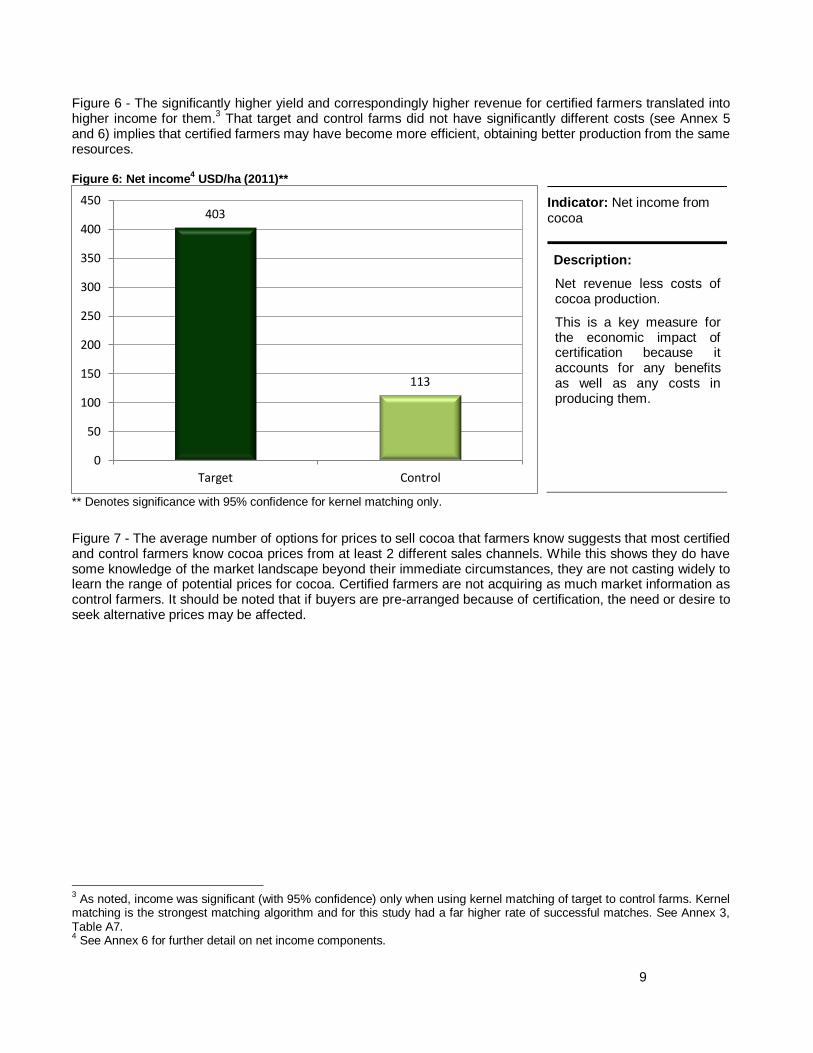
Figure 6 - The significantly higher yield and correspondingly higher revenue for certified farmers translated into higher income for them.
3 That target and control farms did not have significantly different costs (see Annex 5
and 6) implies that certified farmers may have become more efficient, obtaining better production from the same resources. Figure 6: Net income
4 USD/ha (2011)**
** Denotes significance with 95% confidence for kernel matching only.
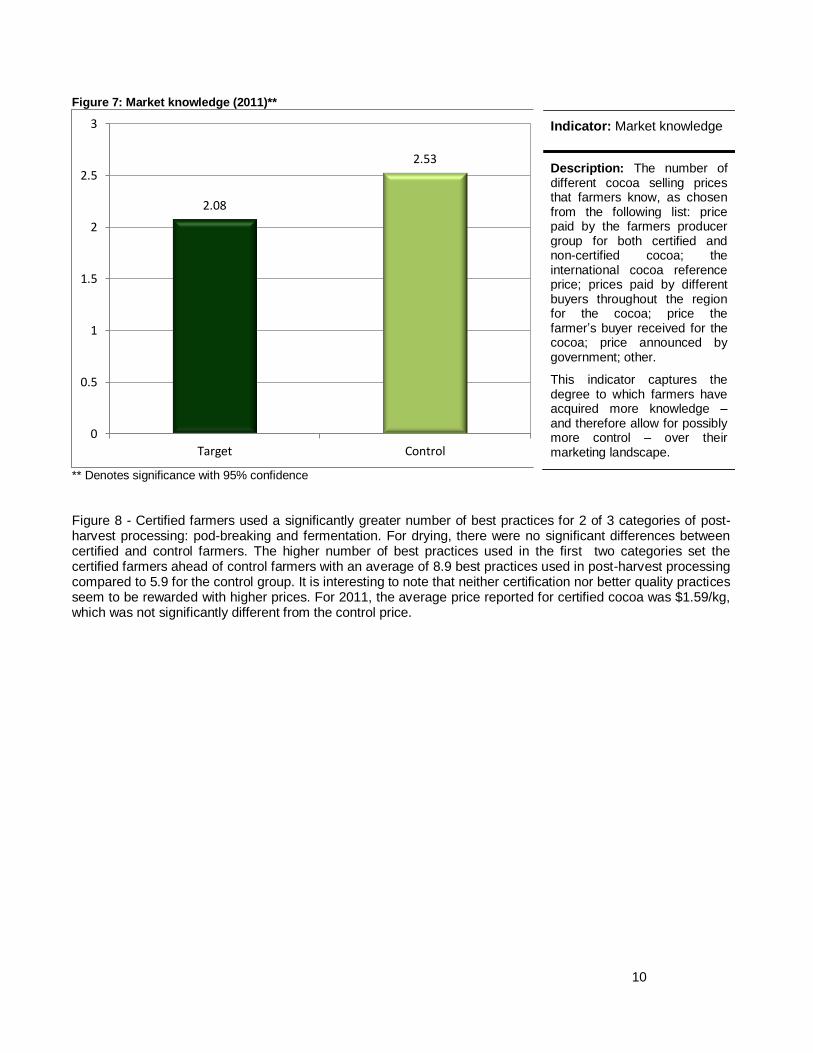
Figure 7 - The average number of options for prices to sell cocoa that farmers know suggests that most certified and control farmers know cocoa prices from at least 2 different sales channels. While this shows they do have some knowledge of the market landscape beyond their immediate circumstances, they are not casting widely to learn the range of potential prices for cocoa. Certified farmers are not acquiring as much market information as control farmers. It should be noted that if buyers are pre-arranged because of certification, the need or desire to seek alternative prices may be affected.
3 As noted, income was significant (with 95% confidence) only when using kernel matching of target to control farms. Kernel
matching is the strongest matching algorithm and for this study had a far higher rate of successful matches. See Annex 3, Table A7. 4 See Annex 6 for further detail on net income components.
403
113
0
50
100
150
200
250
300
350
400
450
Target Control
Indicator: Net income from cocoa
Description:
Net revenue less costs of cocoa production.
This is a key measure for the economic impact of certification because it accounts for any benefits as well as any costs in producing them.
10
Figure 7: Market knowledge (2011)**
** Denotes significance with 95% confidence
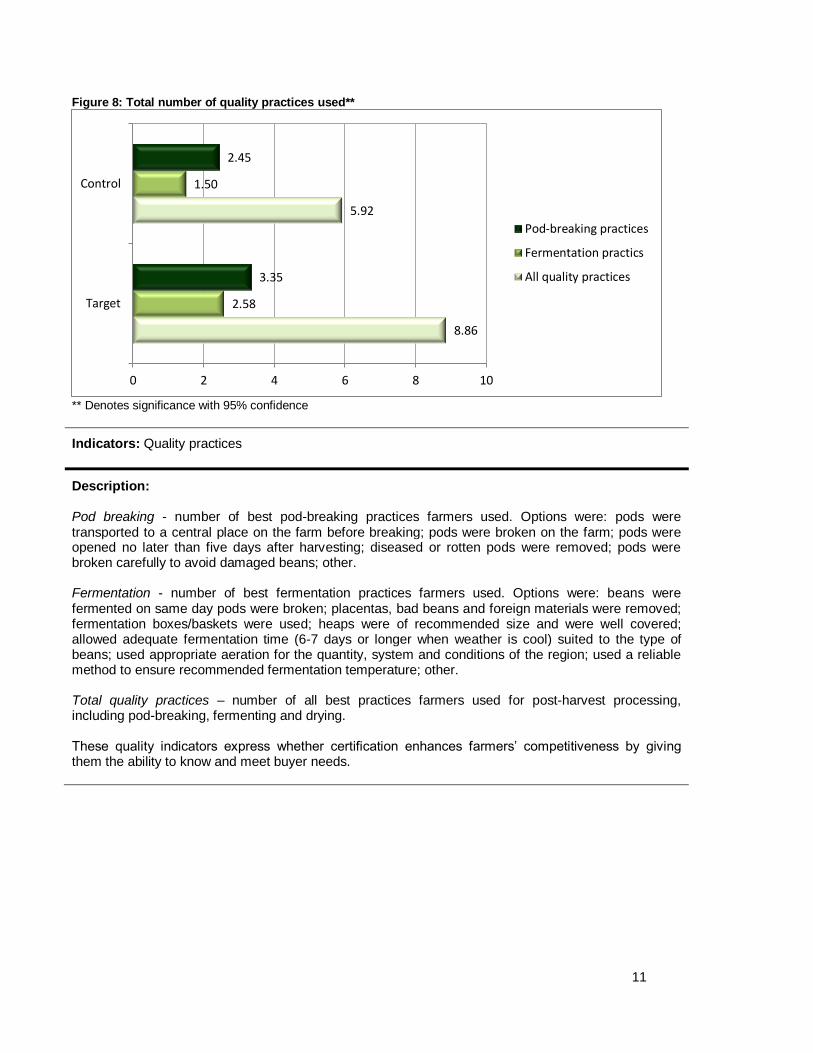
Figure 8 - Certified farmers used a significantly greater number of best practices for 2 of 3 categories of post-harvest processing: pod-breaking and fermentation. For drying, there were no significant differences between certified and control farmers. The higher number of best practices used in the first two categories set the certified farmers ahead of control farmers with an average of 8.9 best practices used in post-harvest processing compared to 5.9 for the control group. It is interesting to note that neither certification nor better quality practices seem to be rewarded with higher prices. For 2011, the average price reported for certified cocoa was $1.59/kg, which was not significantly different from the control price.
2.08
2.53
0
0.5
1
1.5
2
2.5
3
Target Control
Indicator: Market knowledge
Description: The number of different cocoa selling prices that farmers know, as chosen from the following list: price paid by the farmers producer group for both certified and non-certified cocoa; the international cocoa reference price; prices paid by different buyers throughout the region for the cocoa; price the farmer’s buyer received for the cocoa; price announced by government; other.
This indicator captures the degree to which farmers have acquired more knowledge – and therefore allow for possibly more control – over their marketing landscape.
11
Figure 8: Total number of quality practices used**
** Denotes significance with 95% confidence
Indicators: Quality practices
Description: Pod breaking - number of best pod-breaking practices farmers used. Options were: pods were transported to a central place on the farm before breaking; pods were broken on the farm; pods were opened no later than five days after harvesting; diseased or rotten pods were removed; pods were broken carefully to avoid damaged beans; other. Fermentation - number of best fermentation practices farmers used. Options were: beans were fermented on same day pods were broken; placentas, bad beans and foreign materials were removed; fermentation boxes/baskets were used; heaps were of recommended size and were well covered; allowed adequate fermentation time (6-7 days or longer when weather is cool) suited to the type of beans; used appropriate aeration for the quantity, system and conditions of the region; used a reliable method to ensure recommended fermentation temperature; other. Total quality practices – number of all best practices farmers used for post-harvest processing, including pod-breaking, fermenting and drying. These quality indicators express whether certification enhances farmers’ competitiveness by giving them the ability to know and meet buyer needs.
8.86
5.92
2.58
1.50
3.35
2.45
0 2 4 6 8 10
Target
Control
Pod-breaking practices
Fermentation practics
All quality practices
12
Figure 9: Perception economic circumstances**
** Denotes significance with 95% confidence
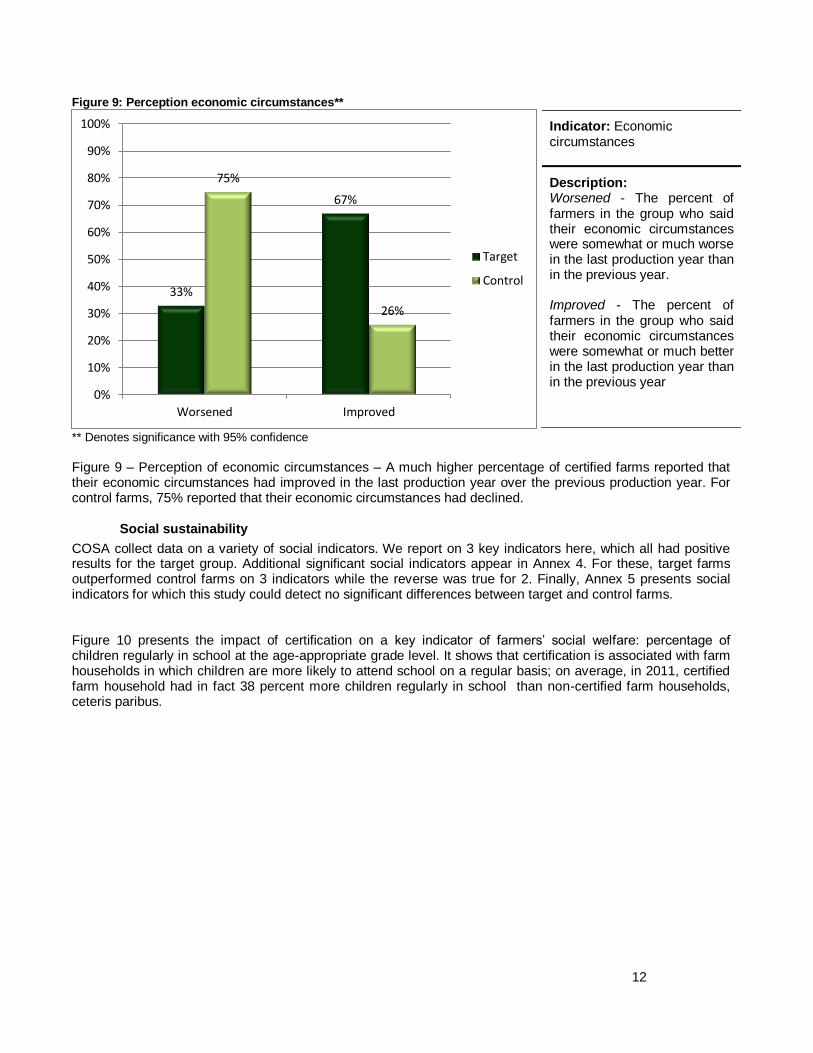
Figure 9 – Perception of economic circumstances – A much higher percentage of certified farms reported that their economic circumstances had improved in the last production year over the previous production year. For control farms, 75% reported that their economic circumstances had declined.
Social sustainability
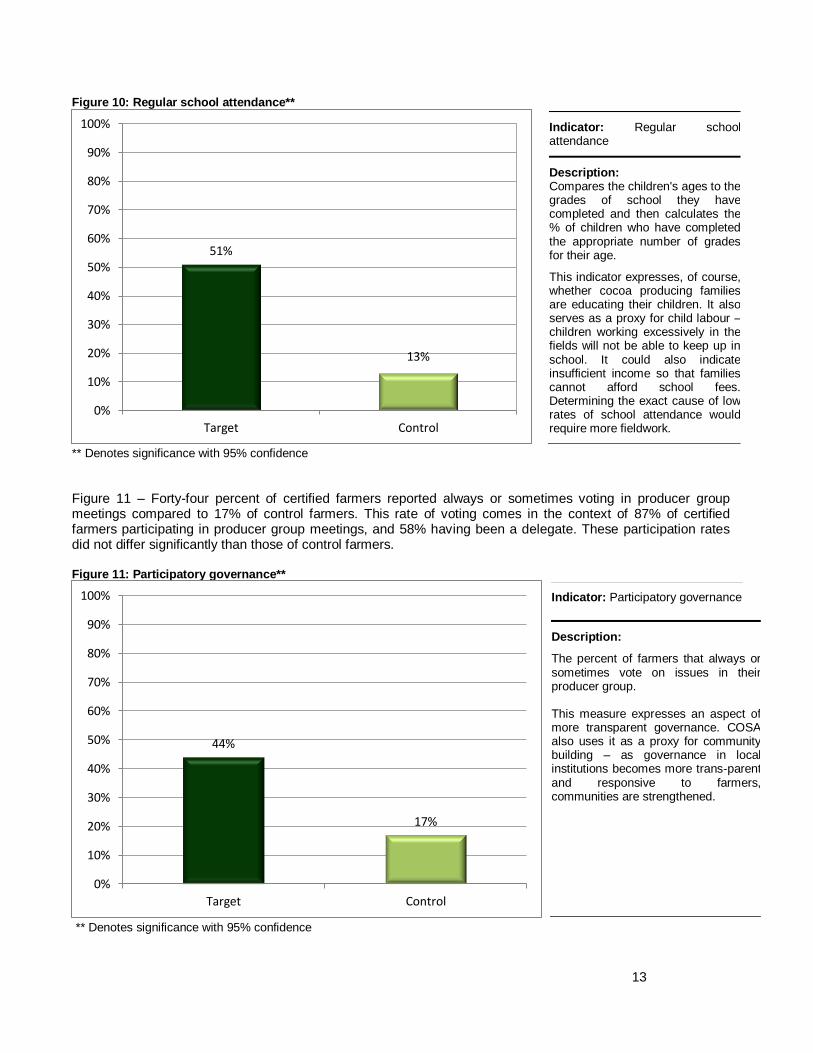
COSA collect data on a variety of social indicators. We report on 3 key indicators here, which all had positive results for the target group. Additional significant social indicators appear in Annex 4. For these, target farms outperformed control farms on 3 indicators while the reverse was true for 2. Finally, Annex 5 presents social indicators for which this study could detect no significant differences between target and control farms. Figure 10 presents the impact of certification on a key indicator of farmers’ social welfare: percentage of children regularly in school at the age-appropriate grade level. It shows that certification is associated with farm households in which children are more likely to attend school on a regular basis; on average, in 2011, certified farm household had in fact 38 percent more children regularly in school than non-certified farm households, ceteris paribus.
33%
67%
75%
26%
0%
10%
20%
30%
40%
50%
60%
70%
80%
90%
100%
Worsened Improved
Target
Control
Indicator: Economic circumstances
Description: Worsened - The percent of farmers in the group who said their economic circumstances were somewhat or much worse in the last production year than in the previous year. Improved - The percent of farmers in the group who said their economic circumstances were somewhat or much better in the last production year than in the previous year
13
Figure 10: Regular school attendance**
** Denotes significance with 95% confidence
Figure 11 – Forty-four percent of certified farmers reported always or sometimes voting in producer group meetings compared to 17% of control farmers. This rate of voting comes in the context of 87% of certified farmers participating in producer group meetings, and 58% having been a delegate. These participation rates did not differ significantly than those of control farmers. Figure 11: Participatory governance**
** Denotes significance with 95% confidence
51%
13%
0%
10%
20%
30%
40%
50%
60%
70%
80%
90%
100%
Target Control
44%
17%
0%
10%
20%
30%
40%
50%
60%
70%
80%
90%
100%
Target Control
Indicator: Regular school attendance
Description: Compares the children's ages to the grades of school they have completed and then calculates the % of children who have completed the appropriate number of grades for their age.
This indicator expresses, of course, whether cocoa producing families are educating their children. It also serves as a proxy for child labour – children working excessively in the fields will not be able to keep up in school. It could also indicate insufficient income so that families cannot afford school fees. Determining the exact cause of low rates of school attendance would require more fieldwork.
Indicator: Participatory governance
Description:
The percent of farmers that always or sometimes vote on issues in their producer group. This measure expresses an aspect of more transparent governance. COSA also uses it as a proxy for community building – as governance in local institutions becomes more trans-parent and responsive to farmers, communities are strengthened.
14
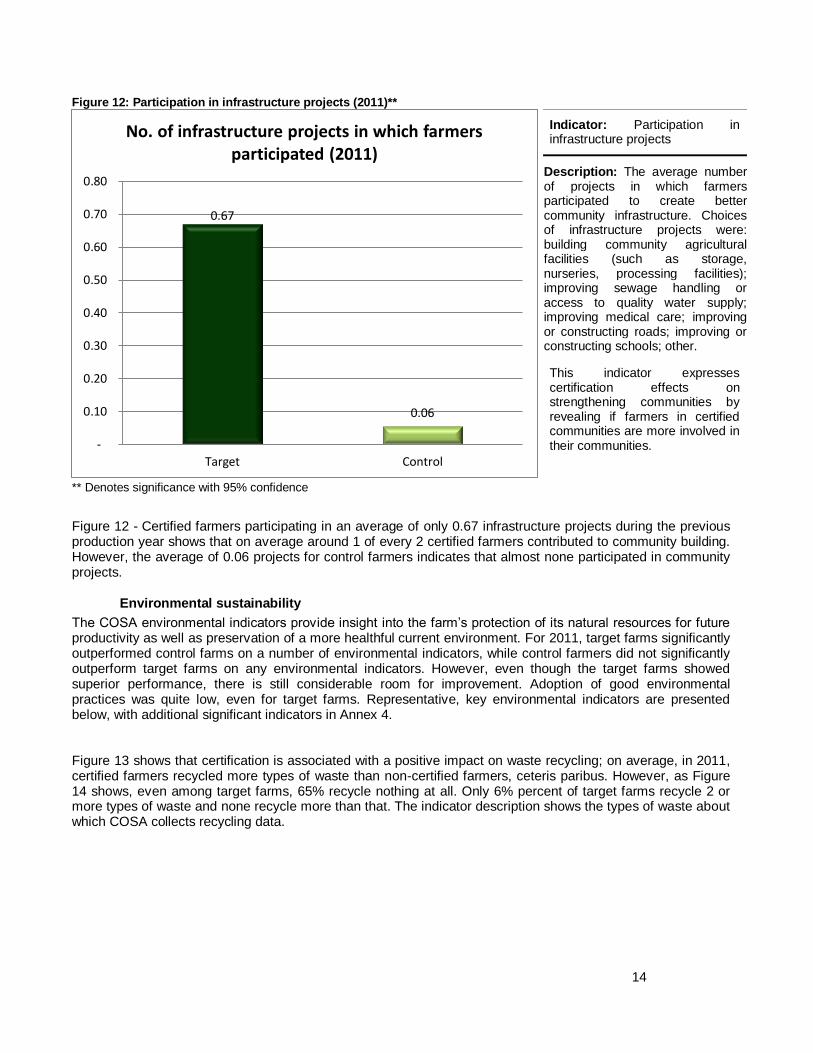
Figure 12: Participation in infrastructure projects (2011)**
** Denotes significance with 95% confidence
Figure 12 - Certified farmers participating in an average of only 0.67 infrastructure projects during the previous production year shows that on average around 1 of every 2 certified farmers contributed to community building. However, the average of 0.06 projects for control farmers indicates that almost none participated in community projects.
Environmental sustainability
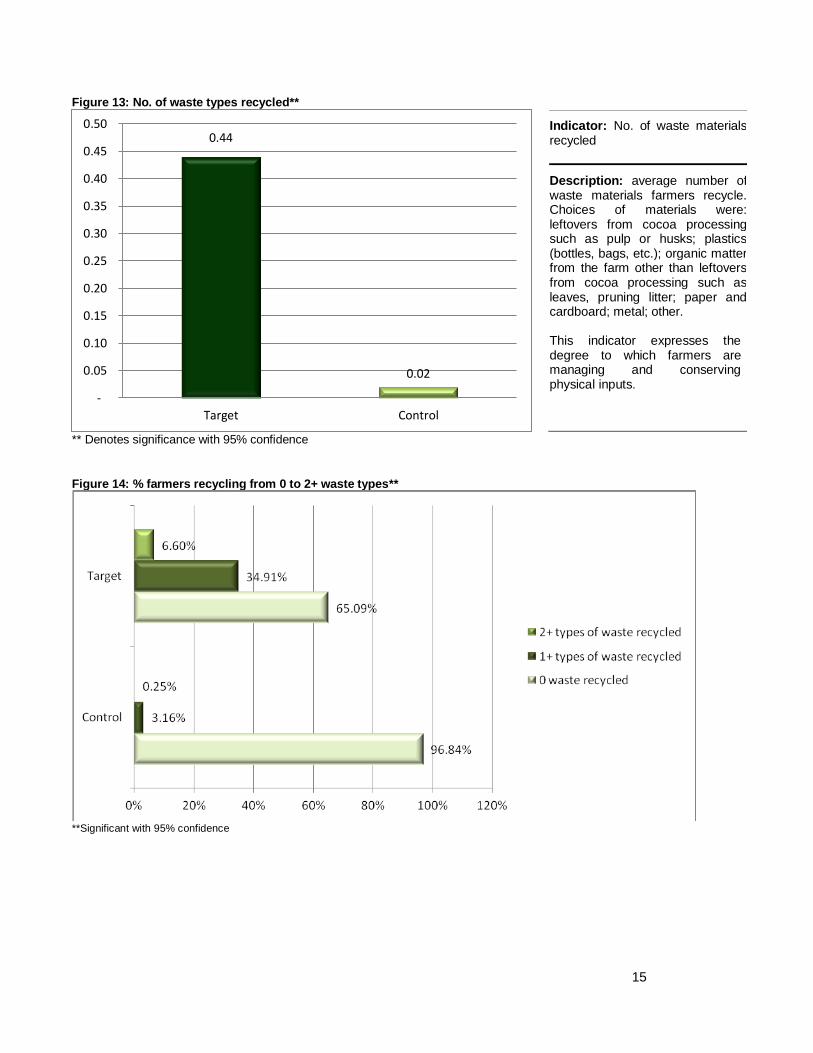
The COSA environmental indicators provide insight into the farm’s protection of its natural resources for future productivity as well as preservation of a more healthful current environment. For 2011, target farms significantly outperformed control farms on a number of environmental indicators, while control farmers did not significantly outperform target farms on any environmental indicators. However, even though the target farms showed superior performance, there is still considerable room for improvement. Adoption of good environmental practices was quite low, even for target farms. Representative, key environmental indicators are presented below, with additional significant indicators in Annex 4. Figure 13 shows that certification is associated with a positive impact on waste recycling; on average, in 2011, certified farmers recycled more types of waste than non-certified farmers, ceteris paribus. However, as Figure 14 shows, even among target farms, 65% recycle nothing at all. Only 6% percent of target farms recycle 2 or more types of waste and none recycle more than that. The indicator description shows the types of waste about which COSA collects recycling data.
0.67
0.06
-
0.10
0.20
0.30
0.40
0.50
0.60
0.70
0.80
Target Control
No. of infrastructure projects in which farmers participated (2011)
Indicator: Participation in infrastructure projects
Description: The average number of projects in which farmers participated to create better community infrastructure. Choices of infrastructure projects were: building community agricultural facilities (such as storage, nurseries, processing facilities); improving sewage handling or access to quality water supply; improving medical care; improving or constructing roads; improving or constructing schools; other.
This indicator expresses certification effects on strengthening communities by revealing if farmers in certified communities are more involved in their communities.
15
Figure 13: No. of waste types recycled**
** Denotes significance with 95% confidence
Figure 14: % farmers recycling from 0 to 2+ waste types**
**Significant with 95% confidence
0.44
0.02
-
0.05
0.10
0.15
0.20
0.25
0.30
0.35
0.40
0.45
0.50
Target Control
Indicator: No. of waste materials recycled
Description: average number of waste materials farmers recycle. Choices of materials were: leftovers from cocoa processing such as pulp or husks; plastics (bottles, bags, etc.); organic matter from the farm other than leftovers from cocoa processing such as leaves, pruning litter; paper and cardboard; metal; other. This indicator expresses the degree to which farmers are managing and conserving physical inputs.
16
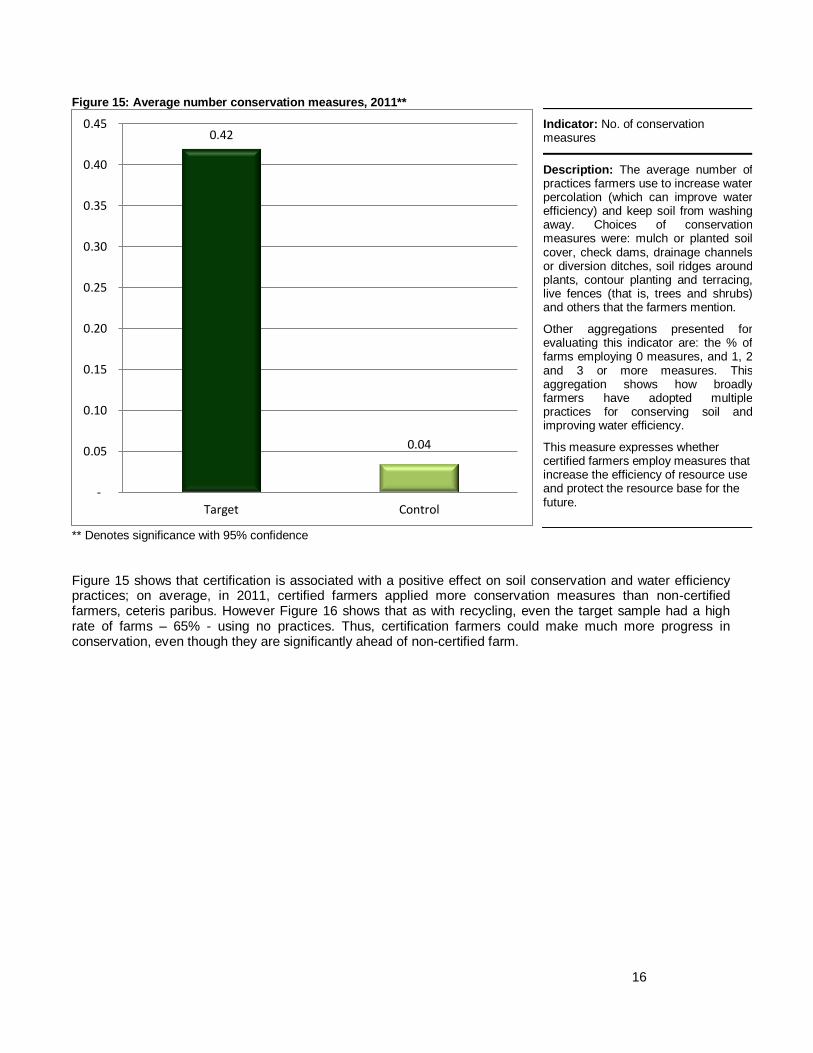
Figure 15: Average number conservation measures, 2011**
** Denotes significance with 95% confidence
Figure 15 shows that certification is associated with a positive effect on soil conservation and water efficiency practices; on average, in 2011, certified farmers applied more conservation measures than non-certified farmers, ceteris paribus. However Figure 16 shows that as with recycling, even the target sample had a high rate of farms – 65% - using no practices. Thus, certification farmers could make much more progress in conservation, even though they are significantly ahead of non-certified farm.
0.42
0.04
-
0.05
0.10
0.15
0.20
0.25
0.30
0.35
0.40
0.45
Target Control
Indicator: No. of conservation measures
Description: The average number of practices farmers use to increase water percolation (which can improve water efficiency) and keep soil from washing away. Choices of conservation measures were: mulch or planted soil cover, check dams, drainage channels or diversion ditches, soil ridges around plants, contour planting and terracing, live fences (that is, trees and shrubs) and others that the farmers mention.
Other aggregations presented for evaluating this indicator are: the % of farms employing 0 measures, and 1, 2 and 3 or more measures. This aggregation shows how broadly farmers have adopted multiple practices for conserving soil and improving water efficiency.
This measure expresses whether certified farmers employ measures that increase the efficiency of resource use and protect the resource base for the future.
17
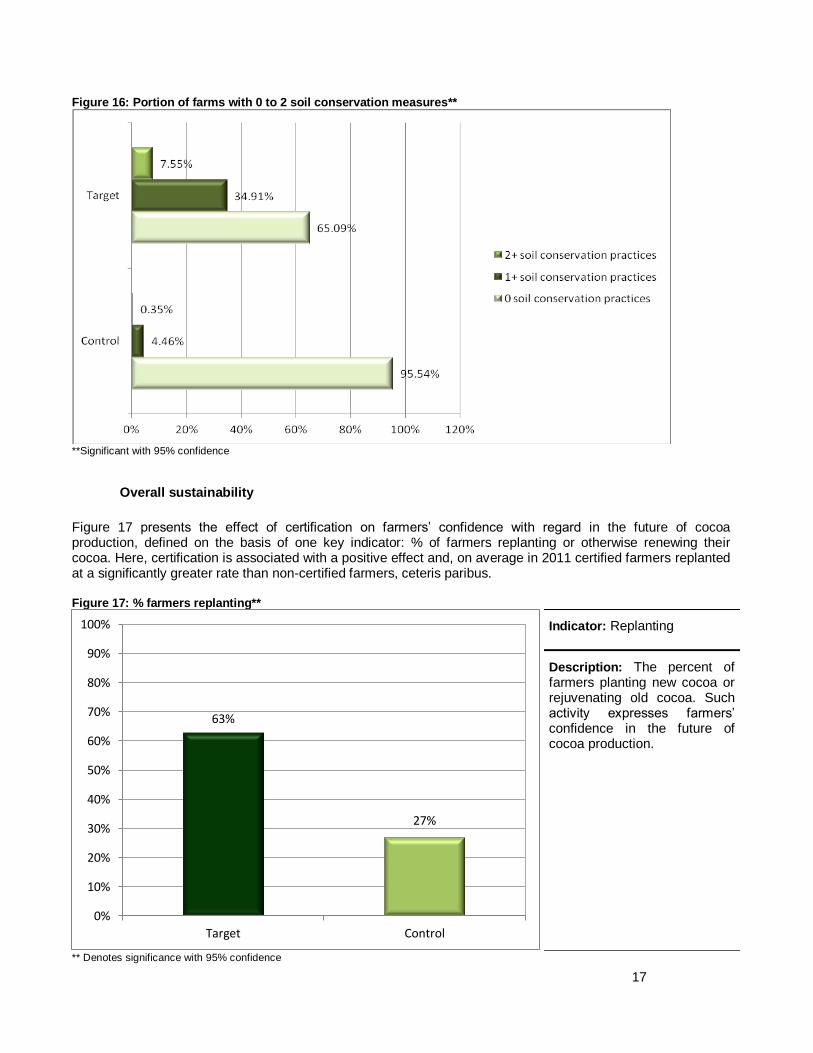
Figure 16: Portion of farms with 0 to 2 soil conservation measures**
**Significant with 95% confidence
Overall sustainability
Figure 17 presents the effect of certification on farmers’ confidence with regard in the future of cocoa production, defined on the basis of one key indicator: % of farmers replanting or otherwise renewing their cocoa. Here, certification is associated with a positive effect and, on average in 2011 certified farmers replanted at a significantly greater rate than non-certified farmers, ceteris paribus. Figure 17: % farmers replanting**
** Denotes significance with 95% confidence
63%
27%
0%
10%
20%
30%
40%
50%
60%
70%
80%
90%
100%
Target Control
Indicator: Replanting
Description: The percent of farmers planting new cocoa or rejuvenating old cocoa. Such activity expresses farmers’ confidence in the future of cocoa production.
18
Certification effects over time: significant results compared for 2009 and 2011
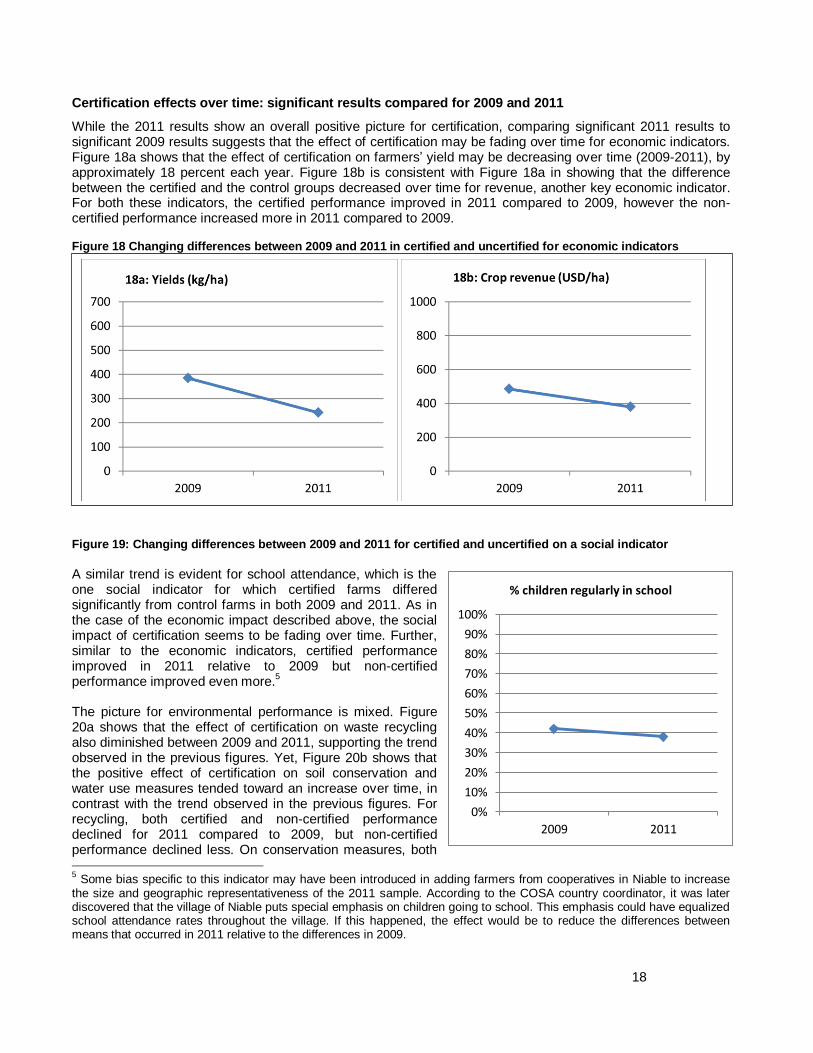
While the 2011 results show an overall positive picture for certification, comparing significant 2011 results to significant 2009 results suggests that the effect of certification may be fading over time for economic indicators. Figure 18a shows that the effect of certification on farmers’ yield may be decreasing over time (2009-2011), by approximately 18 percent each year. Figure 18b is consistent with Figure 18a in showing that the difference between the certified and the control groups decreased over time for revenue, another key economic indicator. For both these indicators, the certified performance improved in 2011 compared to 2009, however the non-certified performance increased more in 2011 compared to 2009. Figure 18 Changing differences between 2009 and 2011 in certified and uncertified for economic indicators
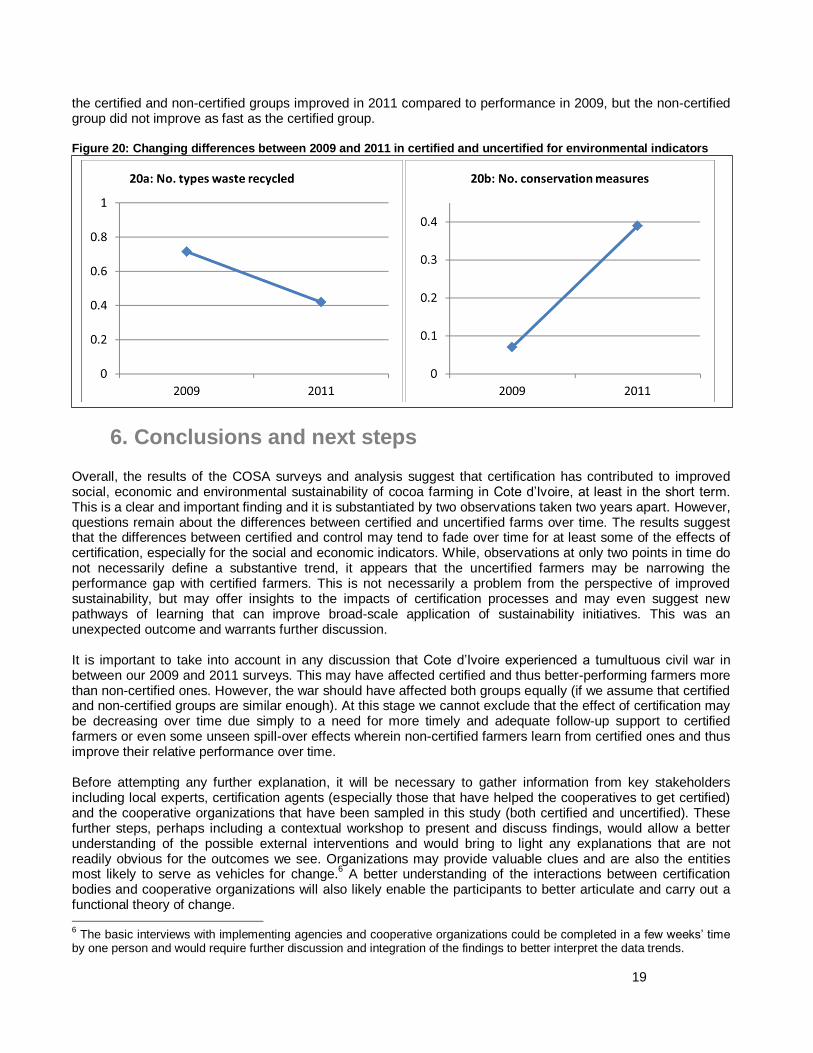
Figure 19: Changing differences between 2009 and 2011 for certified and uncertified on a social indicator
A similar trend is evident for school attendance, which is the one social indicator for which certified farms differed significantly from control farms in both 2009 and 2011. As in the case of the economic impact described above, the social impact of certification seems to be fading over time. Further, similar to the economic indicators, certified performance improved in 2011 relative to 2009 but non-certified performance improved even more.
5
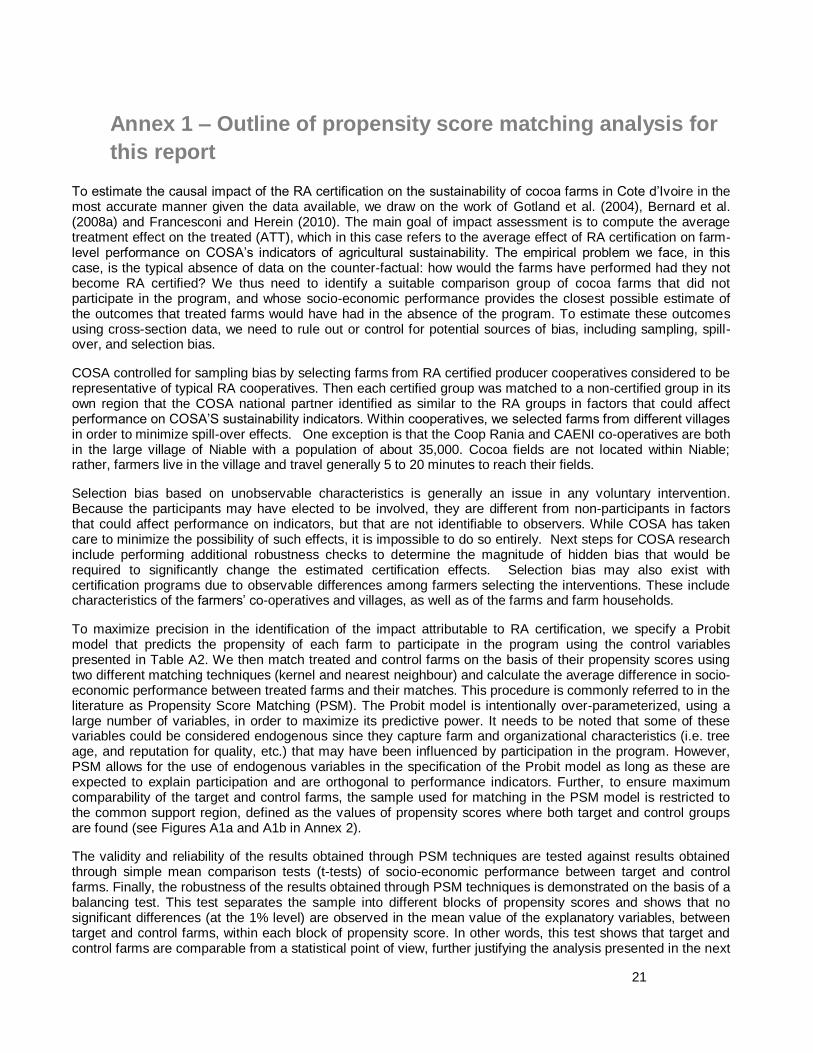
The picture for environmental performance is mixed. Figure 20a shows that the effect of certification on waste recycling also diminished between 2009 and 2011, supporting the trend observed in the previous figures. Yet, Figure 20b shows that the positive effect of certification on soil conservation and water use measures tended toward an increase over time, in contrast with the trend observed in the previous figures. For recycling, both certified and non-certified performance declined for 2011 compared to 2009, but non-certified performance declined less. On conservation measures, both 5 Some bias specific to this indicator may have been introduced in adding farmers from cooperatives in Niable to increase
the size and geographic representativeness of the 2011 sample. According to the COSA country coordinator, it was later discovered that the village of Niable puts special emphasis on children going to school. This emphasis could have equalized school attendance rates throughout the village. If this happened, the effect would be to reduce the differences between means that occurred in 2011 relative to the differences in 2009.
0%
10%
20%
30%
40%
50%
60%
70%
80%
90%
100%
2009 2011
% children regularly in school
19
the certified and non-certified groups improved in 2011 compared to performance in 2009, but the non-certified group did not improve as fast as the certified group. Figure 20: Changing differences between 2009 and 2011 in certified and uncertified for environmental indicators
6. Conclusions and next steps
Overall, the results of the COSA surveys and analysis suggest that certification has contributed to improved social, economic and environmental sustainability of cocoa farming in Cote d’Ivoire, at least in the short term. This is a clear and important finding and it is substantiated by two observations taken two years apart. However, questions remain about the differences between certified and uncertified farms over time. The results suggest that the differences between certified and control may tend to fade over time for at least some of the effects of certification, especially for the social and economic indicators. While, observations at only two points in time do not necessarily define a substantive trend, it appears that the uncertified farmers may be narrowing the performance gap with certified farmers. This is not necessarily a problem from the perspective of improved sustainability, but may offer insights to the impacts of certification processes and may even suggest new pathways of learning that can improve broad-scale application of sustainability initiatives. This was an unexpected outcome and warrants further discussion. It is important to take into account in any discussion that Cote d’Ivoire experienced a tumultuous civil war in between our 2009 and 2011 surveys. This may have affected certified and thus better-performing farmers more than non-certified ones. However, the war should have affected both groups equally (if we assume that certified and non-certified groups are similar enough). At this stage we cannot exclude that the effect of certification may be decreasing over time due simply to a need for more timely and adequate follow-up support to certified farmers or even some unseen spill-over effects wherein non-certified farmers learn from certified ones and thus improve their relative performance over time. Before attempting any further explanation, it will be necessary to gather information from key stakeholders including local experts, certification agents (especially those that have helped the cooperatives to get certified) and the cooperative organizations that have been sampled in this study (both certified and uncertified). These further steps, perhaps including a contextual workshop to present and discuss findings, would allow a better understanding of the possible external interventions and would bring to light any explanations that are not readily obvious for the outcomes we see. Organizations may provide valuable clues and are also the entities most likely to serve as vehicles for change.
6 A better understanding of the interactions between certification
bodies and cooperative organizations will also likely enable the participants to better articulate and carry out a functional theory of change. 6 The basic interviews with implementing agencies and cooperative organizations could be completed in a few weeks’ time
by one person and would require further discussion and integration of the findings to better interpret the data trends.

20
Thank you for the opportunity to learn together with you.
The COSA team
21
Annex 1 – Outline of propensity score matching analysis for
this report
To estimate the causal impact of the RA certification on the sustainability of cocoa farms in Cote d’Ivoire in the most accurate manner given the data available, we draw on the work of Gotland et al. (2004), Bernard et al. (2008a) and Francesconi and Herein (2010). The main goal of impact assessment is to compute the average treatment effect on the treated (ATT), which in this case refers to the average effect of RA certification on farm-level performance on COSA’s indicators of agricultural sustainability. The empirical problem we face, in this case, is the typical absence of data on the counter-factual: how would the farms have performed had they not become RA certified? We thus need to identify a suitable comparison group of cocoa farms that did not participate in the program, and whose socio-economic performance provides the closest possible estimate of the outcomes that treated farms would have had in the absence of the program. To estimate these outcomes using cross-section data, we need to rule out or control for potential sources of bias, including sampling, spill-over, and selection bias.
COSA controlled for sampling bias by selecting farms from RA certified producer cooperatives considered to be representative of typical RA cooperatives. Then each certified group was matched to a non-certified group in its own region that the COSA national partner identified as similar to the RA groups in factors that could affect performance on COSA’S sustainability indicators. Within cooperatives, we selected farms from different villages in order to minimize spill-over effects. One exception is that the Coop Rania and CAENI co-operatives are both in the large village of Niable with a population of about 35,000. Cocoa fields are not located within Niable; rather, farmers live in the village and travel generally 5 to 20 minutes to reach their fields.
Selection bias based on unobservable characteristics is generally an issue in any voluntary intervention. Because the participants may have elected to be involved, they are different from non-participants in factors that could affect performance on indicators, but that are not identifiable to observers. While COSA has taken care to minimize the possibility of such effects, it is impossible to do so entirely. Next steps for COSA research include performing additional robustness checks to determine the magnitude of hidden bias that would be required to significantly change the estimated certification effects. Selection bias may also exist with certification programs due to observable differences among farmers selecting the interventions. These include characteristics of the farmers’ co-operatives and villages, as well as of the farms and farm households.
To maximize precision in the identification of the impact attributable to RA certification, we specify a Probit model that predicts the propensity of each farm to participate in the program using the control variables presented in Table A2. We then match treated and control farms on the basis of their propensity scores using two different matching techniques (kernel and nearest neighbour) and calculate the average difference in socio-economic performance between treated farms and their matches. This procedure is commonly referred to in the literature as Propensity Score Matching (PSM). The Probit model is intentionally over-parameterized, using a large number of variables, in order to maximize its predictive power. It needs to be noted that some of these variables could be considered endogenous since they capture farm and organizational characteristics (i.e. tree age, and reputation for quality, etc.) that may have been influenced by participation in the program. However, PSM allows for the use of endogenous variables in the specification of the Probit model as long as these are expected to explain participation and are orthogonal to performance indicators. Further, to ensure maximum comparability of the target and control farms, the sample used for matching in the PSM model is restricted to the common support region, defined as the values of propensity scores where both target and control groups are found (see Figures A1a and A1b in Annex 2).
The validity and reliability of the results obtained through PSM techniques are tested against results obtained through simple mean comparison tests (t-tests) of socio-economic performance between target and control farms. Finally, the robustness of the results obtained through PSM techniques is demonstrated on the basis of a balancing test. This test separates the sample into different blocks of propensity scores and shows that no significant differences (at the 1% level) are observed in the mean value of the explanatory variables, between target and control farms, within each block of propensity score. In other words, this test shows that target and control farms are comparable from a statistical point of view, further justifying the analysis presented in the next
22
section. Further analysis will aim at looking how the impact of RA certification varies across different typologies of cooperative organizations. By doing so, we will be able to derive important implications for RA to better target cooperative organizations in such a way to maximize the impact of their certification scheme on sustainability. By doing so we will also be able to help RA better monitor its impact as cooperatives evolve over time.
References
Bernard, T., A. S. Taffesse, and E. Z. Gabre-Madhin. 2008a. “Impact of Cooperatives on Smallholders’ Commercialization Behavior: Evidence from Ethiopia.” Agricultural Economics 39: 1–15.
Francesconi, G. N., and N. Heerink. 2010. “Ethiopian Agricultural Cooperatives in an Era of Global Commodity Exchange: Does Organizational Form Matter?” Journal of African Economies Vol. 20 n.1 pp. 153–177.
Godtland, E.M., E. Sadoulet, A. de Janvry, R. Murgai and O. Ortiz, 2004. “The impact of Farmer-Field-Schools on Knowledge and Productivity: A study of Potato Farmers in the Peruvian Andes”. Economic Development and Cultural Change, 53: 63-92.
Ravallion, M. (2001) ‘The Mystery of Vanishing Benefits: An Introduction to Impact Evaluation’, World Bank Economic Review, 15 (1): 115–40.
Becker, S. O., and A. Ichino. 2002. “Estimation of average treatment effects based on propensity scores”. Stata Journal 2: 358{377.
23
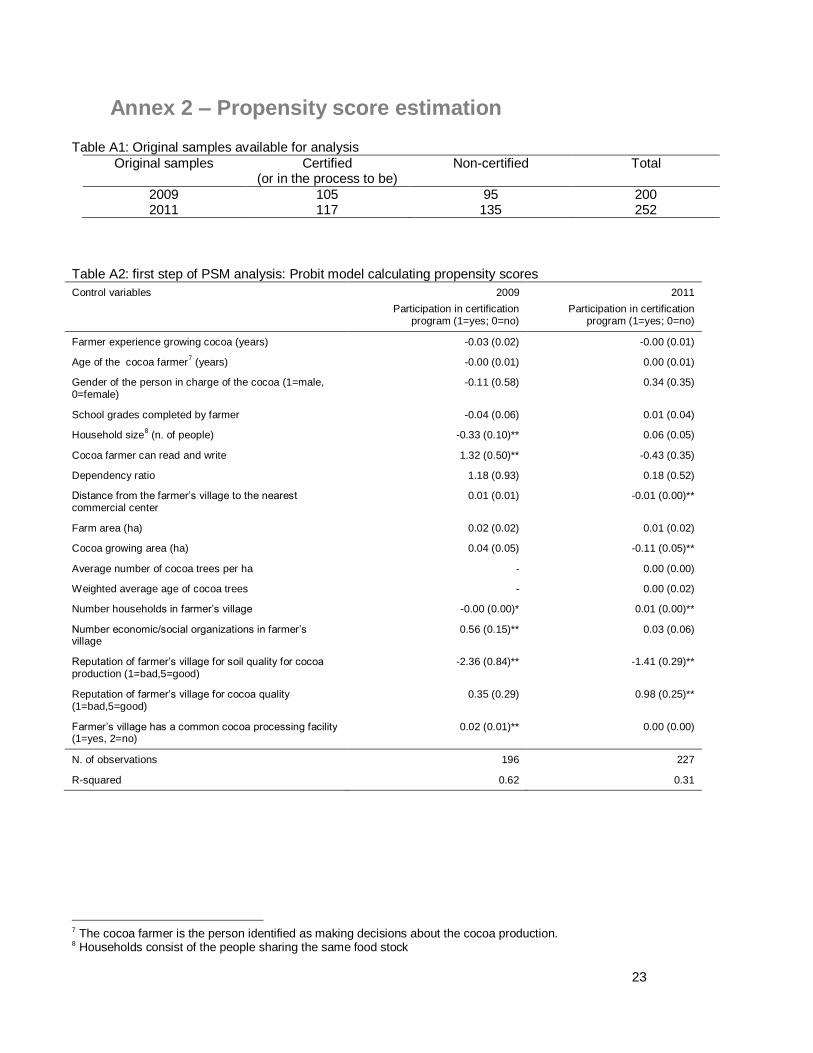
Annex 2 – Propensity score estimation
Table A1: Original samples available for analysis
Original samples Certified (or in the process to be)
Non-certified Total
2009 105 95 200 2011 117 135 252
Table A2: first step of PSM analysis: Probit model calculating propensity scores
Control variables 2009
Participation in certification program (1=yes; 0=no)
2011
Participation in certification program (1=yes; 0=no)
Farmer experience growing cocoa (years) -0.03 (0.02) -0.00 (0.01)
Age of the cocoa farmer7 (years) -0.00 (0.01) 0.00 (0.01)
Gender of the person in charge of the cocoa (1=male, 0=female)
-0.11 (0.58) 0.34 (0.35)
School grades completed by farmer -0.04 (0.06) 0.01 (0.04)
Household size8 (n. of people) -0.33 (0.10)** 0.06 (0.05)
Cocoa farmer can read and write 1.32 (0.50)** -0.43 (0.35)
Dependency ratio 1.18 (0.93) 0.18 (0.52)
Distance from the farmer’s village to the nearest commercial center
0.01 (0.01) -0.01 (0.00)**
Farm area (ha) 0.02 (0.02) 0.01 (0.02)
Cocoa growing area (ha) 0.04 (0.05) -0.11 (0.05)**
Average number of cocoa trees per ha - 0.00 (0.00)
Weighted average age of cocoa trees - 0.00 (0.02)
Number households in farmer’s village -0.00 (0.00)* 0.01 (0.00)**
Number economic/social organizations in farmer’s village
0.56 (0.15)** 0.03 (0.06)
Reputation of farmer’s village for soil quality for cocoa production (1=bad,5=good)
-2.36 (0.84)** -1.41 (0.29)**
Reputation of farmer’s village for cocoa quality (1=bad,5=good)
0.35 (0.29) 0.98 (0.25)**
Farmer’s village has a common cocoa processing facility (1=yes, 2=no)
0.02 (0.01)** 0.00 (0.00)
N. of observations 196 227
R-squared 0.62 0.31
7 The cocoa farmer is the person identified as making decisions about the cocoa production. 8 Households consist of the people sharing the same food stock
24
Table A3: samples used for matching, given that the balancing property is satisfied and the common support option has been imposed.
Original samples Certified (or in the process to be)
Non-certified Total
2009 101 35a
136 2011 106 110 216
a it should be noted that the number of non-certified farmers from 2009 decreased substantially after the imposition of the common support
option. This suggests that many of the non-certified farmers sampled in 2009 were significantly different from their certified counterparts (and for this reason they were discarded from the analysis). This problem may be imputable to a sampling strategy for which results subsequently have suggested was unable to ensure the similarity of control farms to treatment farms in all respects except certification.
However, the lack of similarity was not apparent from information available beforehand.
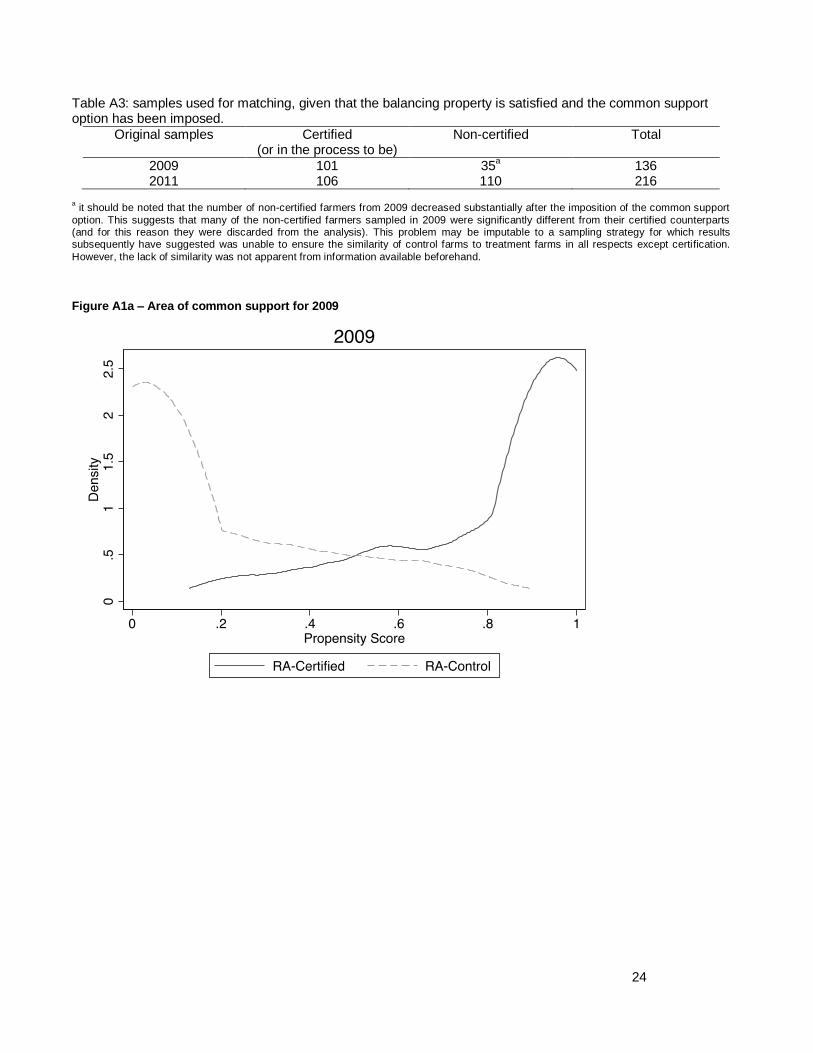
Figure A1a – Area of common support for 2009
25
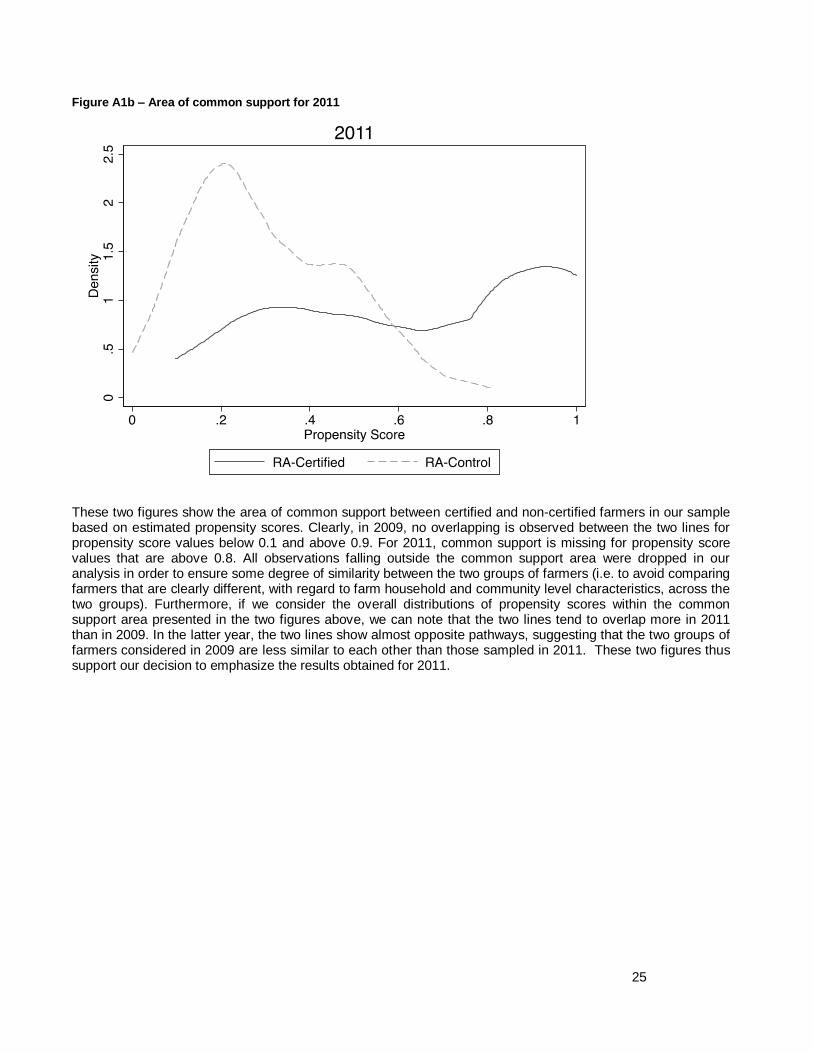
Figure A1b – Area of common support for 2011
These two figures show the area of common support between certified and non-certified farmers in our sample based on estimated propensity scores. Clearly, in 2009, no overlapping is observed between the two lines for propensity score values below 0.1 and above 0.9. For 2011, common support is missing for propensity score values that are above 0.8. All observations falling outside the common support area were dropped in our analysis in order to ensure some degree of similarity between the two groups of farmers (i.e. to avoid comparing farmers that are clearly different, with regard to farm household and community level characteristics, across the two groups). Furthermore, if we consider the overall distributions of propensity scores within the common support area presented in the two figures above, we can note that the two lines tend to overlap more in 2011 than in 2009. In the latter year, the two lines show almost opposite pathways, suggesting that the two groups of farmers considered in 2009 are less similar to each other than those sampled in 2011. These two figures thus support our decision to emphasize the results obtained for 2011.
26
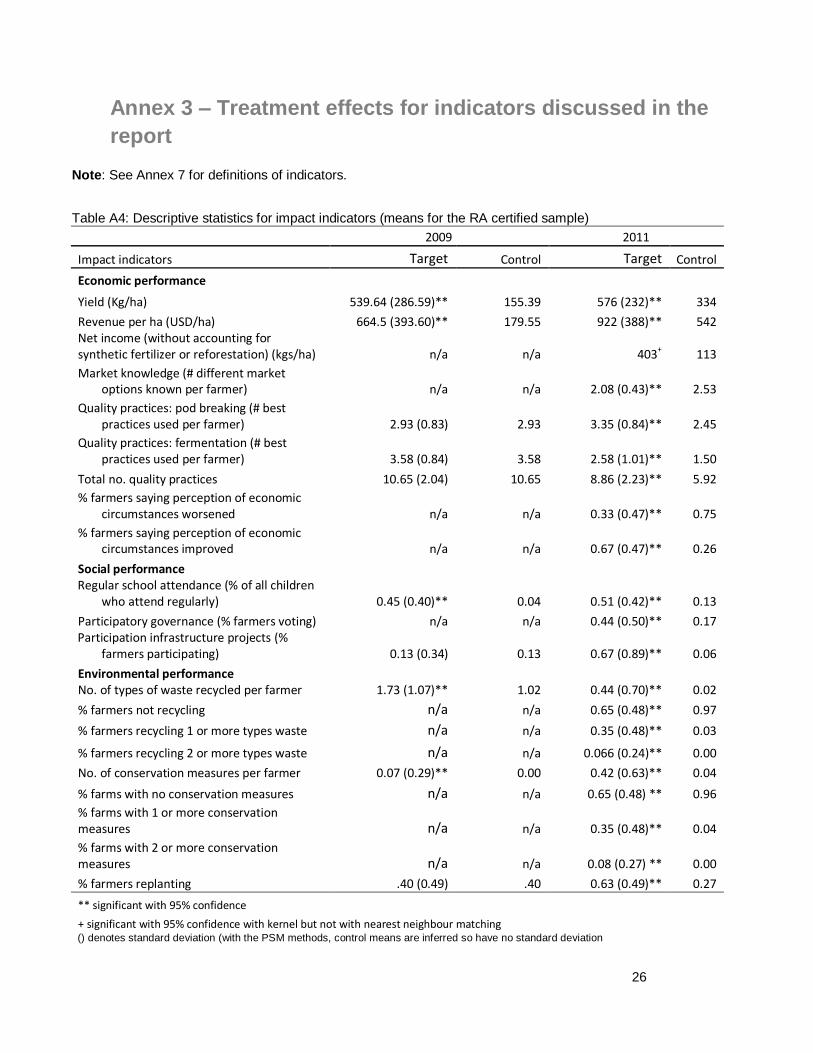
Annex 3 – Treatment effects for indicators discussed in the
report
Note: See Annex 7 for definitions of indicators.
Table A4: Descriptive statistics for impact indicators (means for the RA certified sample)
2009 2011
Impact indicators Target Control Target Control
Economic performance
539.64 (286.59)**
Yield (Kg/ha) 155.39 576 (232)** 334
Revenue per ha (USD/ha) 664.5 (393.60)** 179.55 922 (388)** 542 Net income (without accounting for synthetic fertilizer or reforestation) (kgs/ha) n/a n/a 403
+ 113
Market knowledge (# different market options known per farmer) n/a n/a 2.08 (0.43)** 2.53
Quality practices: pod breaking (# best practices used per farmer) 2.93 (0.83) 2.93 3.35 (0.84)** 2.45
Quality practices: fermentation (# best practices used per farmer) 3.58 (0.84) 3.58 2.58 (1.01)** 1.50
Total no. quality practices 10.65 (2.04) 10.65 8.86 (2.23)** 5.92
% farmers saying perception of economic circumstances worsened n/a n/a 0.33 (0.47)** 0.75
% farmers saying perception of economic circumstances improved n/a n/a 0.67 (0.47)** 0.26
Social performance Regular school attendance (% of all children
who attend regularly) 0.45 (0.40)** 0.04 0.51 (0.42)** 0.13
Participatory governance (% farmers voting) n/a n/a 0.44 (0.50)** 0.17 Participation infrastructure projects (%
farmers participating) 0.13 (0.34) 0.13 0.67 (0.89)** 0.06
Environmental performance No. of types of waste recycled per farmer 1.73 (1.07)** 1.02 0.44 (0.70)** 0.02
% farmers not recycling n/a n/a 0.65 (0.48)** 0.97
% farmers recycling 1 or more types waste n/a n/a 0.35 (0.48)** 0.03
% farmers recycling 2 or more types waste n/a n/a 0.066 (0.24)** 0.00
No. of conservation measures per farmer 0.07 (0.29)** 0.00 0.42 (0.63)** 0.04
% farms with no conservation measures n/a n/a 0.65 (0.48) ** 0.96
% farms with 1 or more conservation measures n/a n/a 0.35 (0.48)** 0.04
% farms with 2 or more conservation measures n/a n/a 0.08 (0.27) ** 0.00
% farmers replanting .40 (0.49) .40 0.63 (0.49)** 0.27
** significant with 95% confidence + significant with 95% confidence with kernel but not with nearest neighbour matching
() denotes standard deviation (with the PSM methods, control means are inferred so have no standard deviation
27
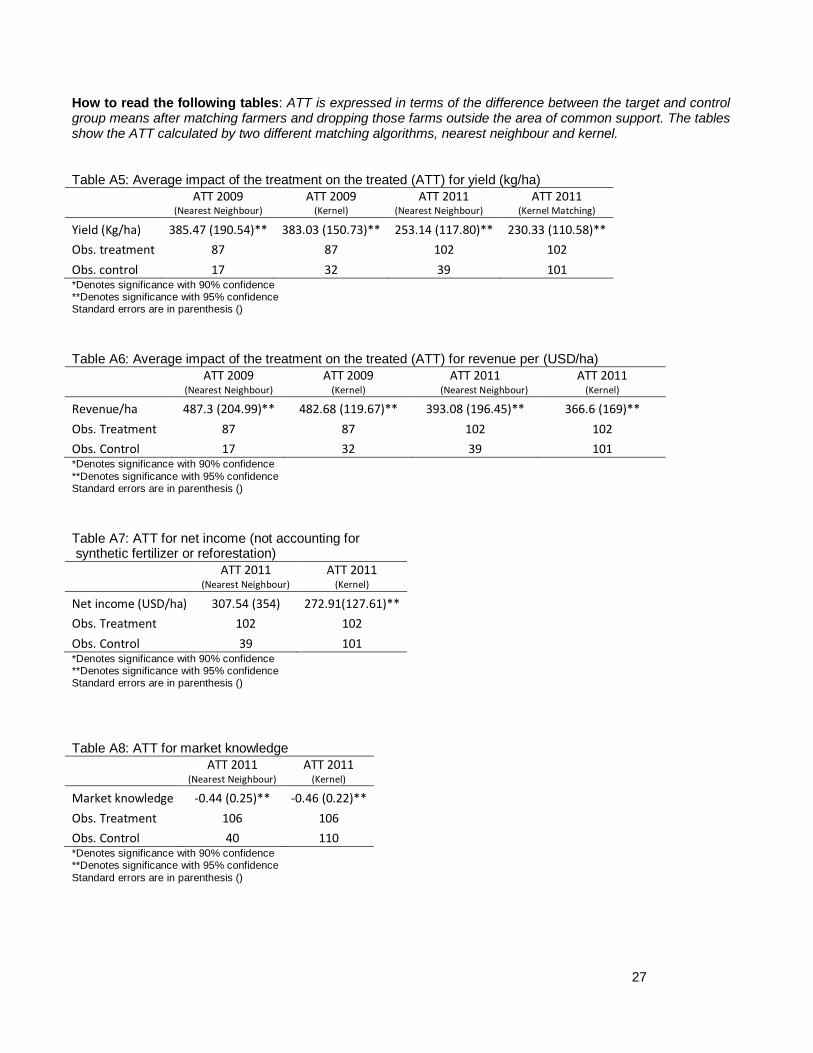
How to read the following tables: ATT is expressed in terms of the difference between the target and control group means after matching farmers and dropping those farms outside the area of common support. The tables show the ATT calculated by two different matching algorithms, nearest neighbour and kernel. Table A5: Average impact of the treatment on the treated (ATT) for yield (kg/ha)
ATT 2009
(Nearest Neighbour)
ATT 2009 (Kernel)
ATT 2011 (Nearest Neighbour)
ATT 2011 (Kernel Matching)
Yield (Kg/ha) 385.47 (190.54)** 383.03 (150.73)** 253.14 (117.80)** 230.33 (110.58)**
Obs. treatment 87 87 102 102
Obs. control 17 32 39 101 *Denotes significance with 90% confidence **Denotes significance with 95% confidence Standard errors are in parenthesis ()
Table A6: Average impact of the treatment on the treated (ATT) for revenue per (USD/ha)
ATT 2009
(Nearest Neighbour) ATT 2009
(Kernel) ATT 2011
(Nearest Neighbour) ATT 2011
(Kernel)
Revenue/ha 487.3 (204.99)** 482.68 (119.67)** 393.08 (196.45)** 366.6 (169)**
Obs. Treatment 87 87 102 102
Obs. Control 17 32 39 101 *Denotes significance with 90% confidence
**Denotes significance with 95% confidence Standard errors are in parenthesis ()
Table A7: ATT for net income (not accounting for synthetic fertilizer or reforestation)
ATT 2011
(Nearest Neighbour) ATT 2011
(Kernel)
Net income (USD/ha) 307.54 (354) 272.91(127.61)**
Obs. Treatment 102 102
Obs. Control 39 101 *Denotes significance with 90% confidence **Denotes significance with 95% confidence Standard errors are in parenthesis ()
Table A8: ATT for market knowledge
ATT 2011
(Nearest Neighbour) ATT 2011
(Kernel)
Market knowledge -0.44 (0.25)** -0.46 (0.22)**
Obs. Treatment 106 106
Obs. Control 40 110 *Denotes significance with 90% confidence **Denotes significance with 95% confidence
Standard errors are in parenthesis ()
28
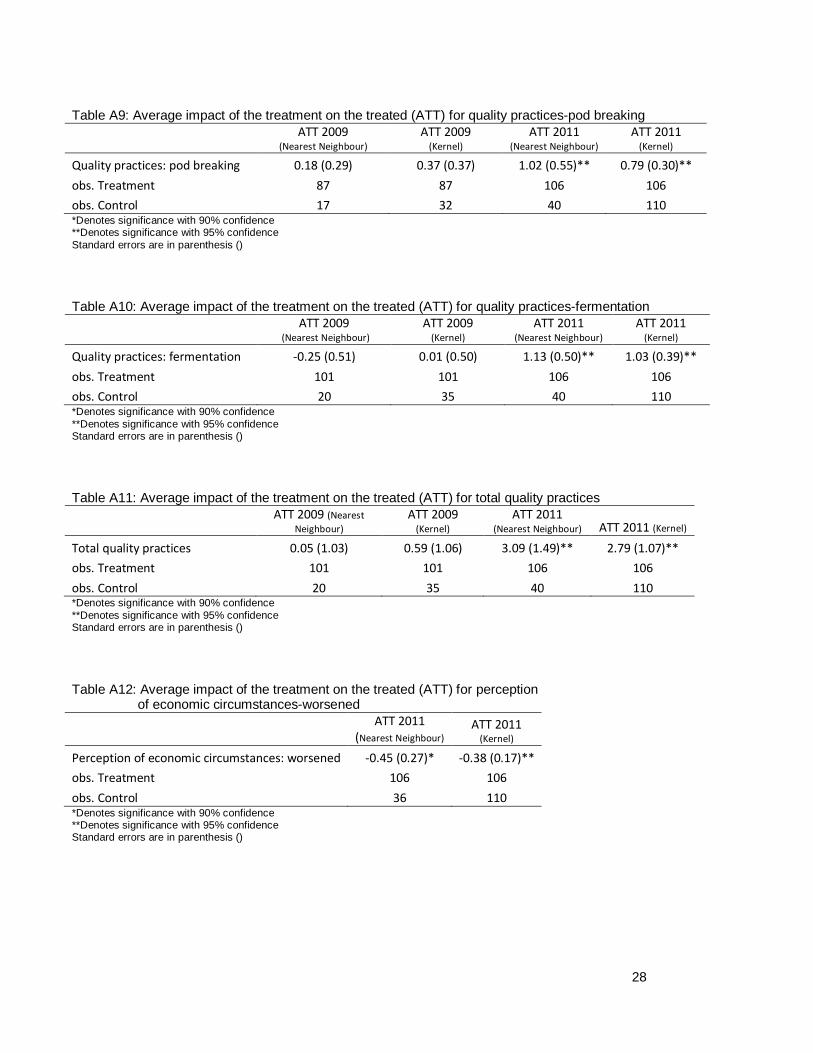
Table A9: Average impact of the treatment on the treated (ATT) for quality practices-pod breaking
ATT 2009
(Nearest Neighbour) ATT 2009
(Kernel) ATT 2011
(Nearest Neighbour) ATT 2011
(Kernel)
Quality practices: pod breaking 0.18 (0.29) 0.37 (0.37) 1.02 (0.55)** 0.79 (0.30)**
obs. Treatment 87 87 106 106
obs. Control 17 32 40 110 *Denotes significance with 90% confidence **Denotes significance with 95% confidence
Standard errors are in parenthesis ()
Table A10: Average impact of the treatment on the treated (ATT) for quality practices-fermentation
ATT 2009
(Nearest Neighbour) ATT 2009
(Kernel) ATT 2011
(Nearest Neighbour) ATT 2011
(Kernel)
Quality practices: fermentation -0.25 (0.51) 0.01 (0.50) 1.13 (0.50)** 1.03 (0.39)**
obs. Treatment 101 101 106 106
obs. Control 20 35 40 110 *Denotes significance with 90% confidence
**Denotes significance with 95% confidence Standard errors are in parenthesis ()
Table A11: Average impact of the treatment on the treated (ATT) for total quality practices
ATT 2009 (Nearest
Neighbour) ATT 2009
(Kernel) ATT 2011
(Nearest Neighbour) ATT 2011 (Kernel)
Total quality practices 0.05 (1.03) 0.59 (1.06) 3.09 (1.49)** 2.79 (1.07)**
obs. Treatment 101 101 106 106
obs. Control 20 35 40 110 *Denotes significance with 90% confidence
**Denotes significance with 95% confidence Standard errors are in parenthesis ()
Table A12: Average impact of the treatment on the treated (ATT) for perception of economic circumstances-worsened
ATT 2011
(Nearest Neighbour) ATT 2011
(Kernel)
Perception of economic circumstances: worsened -0.45 (0.27)* -0.38 (0.17)**
obs. Treatment 106 106
obs. Control 36 110 *Denotes significance with 90% confidence **Denotes significance with 95% confidence Standard errors are in parenthesis ()
29
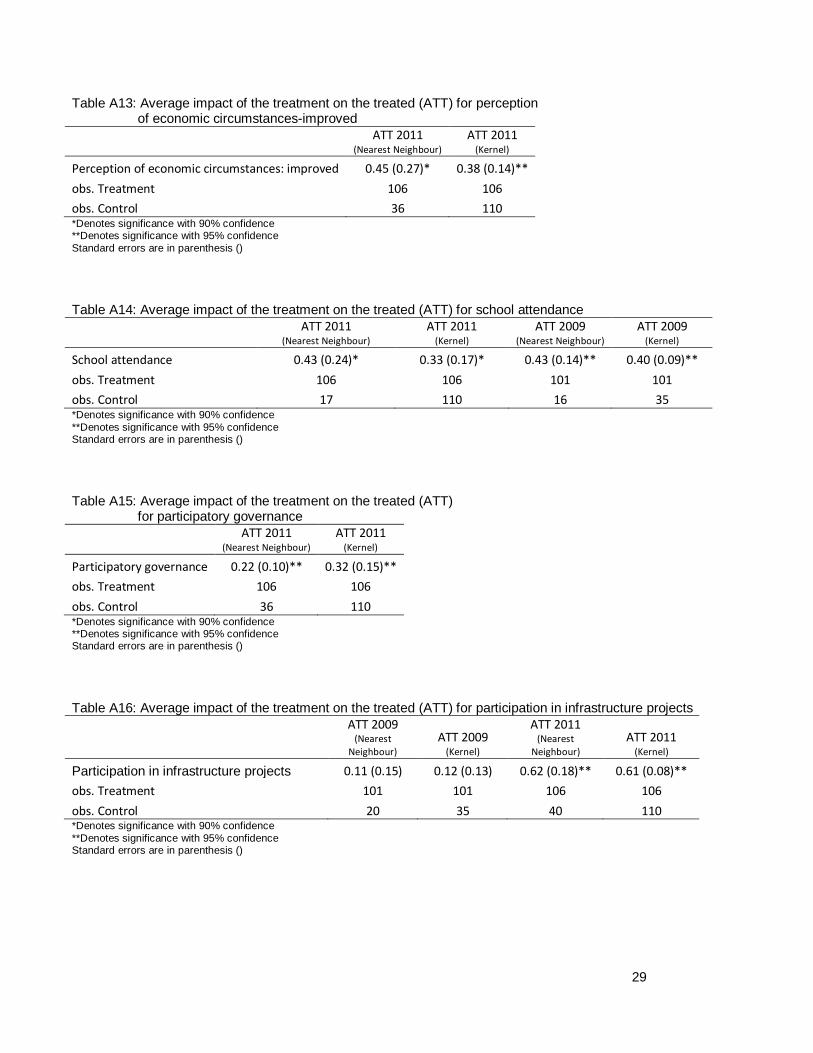
Table A13: Average impact of the treatment on the treated (ATT) for perception of economic circumstances-improved
ATT 2011
(Nearest Neighbour) ATT 2011
(Kernel)
Perception of economic circumstances: improved 0.45 (0.27)* 0.38 (0.14)**
obs. Treatment 106 106
obs. Control 36 110 *Denotes significance with 90% confidence **Denotes significance with 95% confidence
Standard errors are in parenthesis ()
Table A14: Average impact of the treatment on the treated (ATT) for school attendance
ATT 2011
(Nearest Neighbour)
ATT 2011 (Kernel)
ATT 2009 (Nearest Neighbour)
ATT 2009 (Kernel)
School attendance 0.43 (0.24)* 0.33 (0.17)* 0.43 (0.14)** 0.40 (0.09)**
obs. Treatment 106 106 101 101
obs. Control 17 110 16 35 *Denotes significance with 90% confidence
**Denotes significance with 95% confidence Standard errors are in parenthesis ()
Table A15: Average impact of the treatment on the treated (ATT) for participatory governance
ATT 2011
(Nearest Neighbour) ATT 2011
(Kernel)
Participatory governance 0.22 (0.10)** 0.32 (0.15)**
obs. Treatment 106 106
obs. Control 36 110 *Denotes significance with 90% confidence **Denotes significance with 95% confidence Standard errors are in parenthesis ()
Table A16: Average impact of the treatment on the treated (ATT) for participation in infrastructure projects
ATT 2009 (Nearest
Neighbour) ATT 2009
(Kernel)
ATT 2011 (Nearest
Neighbour) ATT 2011
(Kernel)
Participation in infrastructure projects 0.11 (0.15) 0.12 (0.13) 0.62 (0.18)** 0.61 (0.08)**
obs. Treatment 101 101 106 106
obs. Control 20 35 40 110 *Denotes significance with 90% confidence
**Denotes significance with 95% confidence Standard errors are in parenthesis ()
30
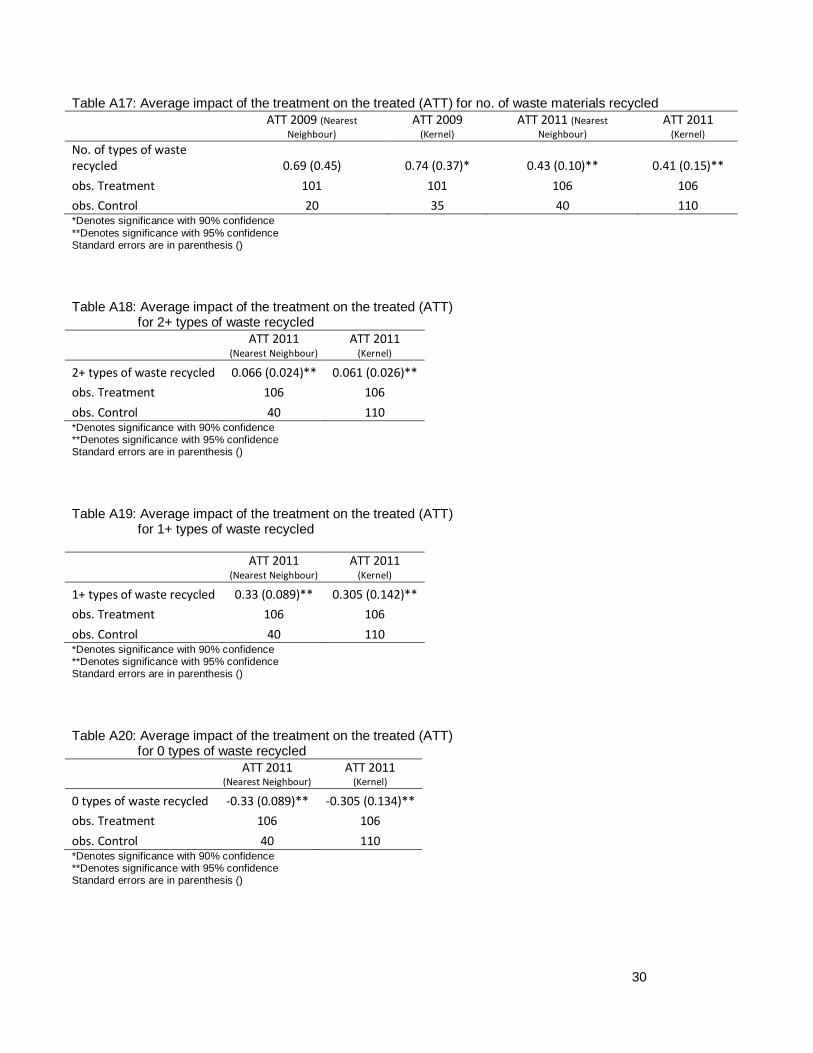
Table A17: Average impact of the treatment on the treated (ATT) for no. of waste materials recycled
ATT 2009 (Nearest
Neighbour) ATT 2009
(Kernel) ATT 2011 (Nearest
Neighbour) ATT 2011
(Kernel) No. of types of waste recycled 0.69 (0.45) 0.74 (0.37)* 0.43 (0.10)** 0.41 (0.15)**
obs. Treatment 101 101 106 106
obs. Control 20 35 40 110 *Denotes significance with 90% confidence
**Denotes significance with 95% confidence Standard errors are in parenthesis ()
Table A18: Average impact of the treatment on the treated (ATT) for 2+ types of waste recycled
ATT 2011
(Nearest Neighbour) ATT 2011
(Kernel)
2+ types of waste recycled 0.066 (0.024)** 0.061 (0.026)**
obs. Treatment 106 106
obs. Control 40 110 *Denotes significance with 90% confidence **Denotes significance with 95% confidence Standard errors are in parenthesis ()
Table A19: Average impact of the treatment on the treated (ATT) for 1+ types of waste recycled
ATT 2011
(Nearest Neighbour) ATT 2011
(Kernel)
1+ types of waste recycled 0.33 (0.089)** 0.305 (0.142)**
obs. Treatment 106 106
obs. Control 40 110 *Denotes significance with 90% confidence **Denotes significance with 95% confidence Standard errors are in parenthesis ()
Table A20: Average impact of the treatment on the treated (ATT) for 0 types of waste recycled
ATT 2011
(Nearest Neighbour) ATT 2011
(Kernel)
0 types of waste recycled -0.33 (0.089)** -0.305 (0.134)**
obs. Treatment 106 106
obs. Control 40 110 *Denotes significance with 90% confidence **Denotes significance with 95% confidence Standard errors are in parenthesis ()
31
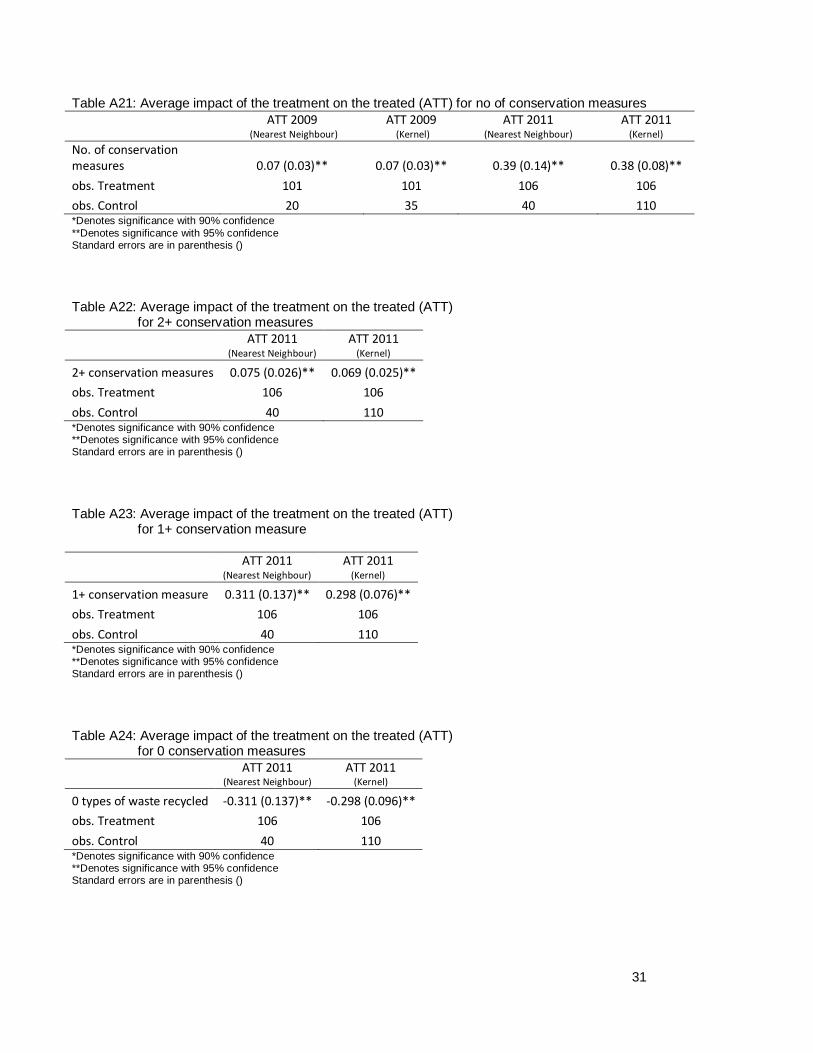
Table A21: Average impact of the treatment on the treated (ATT) for no of conservation measures
ATT 2009
(Nearest Neighbour) ATT 2009
(Kernel) ATT 2011
(Nearest Neighbour) ATT 2011
(Kernel) No. of conservation measures 0.07 (0.03)** 0.07 (0.03)** 0.39 (0.14)** 0.38 (0.08)**
obs. Treatment 101 101 106 106
obs. Control 20 35 40 110 *Denotes significance with 90% confidence
**Denotes significance with 95% confidence Standard errors are in parenthesis ()
Table A22: Average impact of the treatment on the treated (ATT) for 2+ conservation measures
ATT 2011
(Nearest Neighbour) ATT 2011
(Kernel)
2+ conservation measures 0.075 (0.026)** 0.069 (0.025)**
obs. Treatment 106 106
obs. Control 40 110 *Denotes significance with 90% confidence **Denotes significance with 95% confidence Standard errors are in parenthesis ()
Table A23: Average impact of the treatment on the treated (ATT) for 1+ conservation measure
ATT 2011
(Nearest Neighbour) ATT 2011
(Kernel)
1+ conservation measure 0.311 (0.137)** 0.298 (0.076)**
obs. Treatment 106 106
obs. Control 40 110 *Denotes significance with 90% confidence **Denotes significance with 95% confidence Standard errors are in parenthesis ()
Table A24: Average impact of the treatment on the treated (ATT) for 0 conservation measures
ATT 2011
(Nearest Neighbour) ATT 2011
(Kernel)
0 types of waste recycled -0.311 (0.137)** -0.298 (0.096)**
obs. Treatment 106 106
obs. Control 40 110 *Denotes significance with 90% confidence **Denotes significance with 95% confidence Standard errors are in parenthesis ()
32
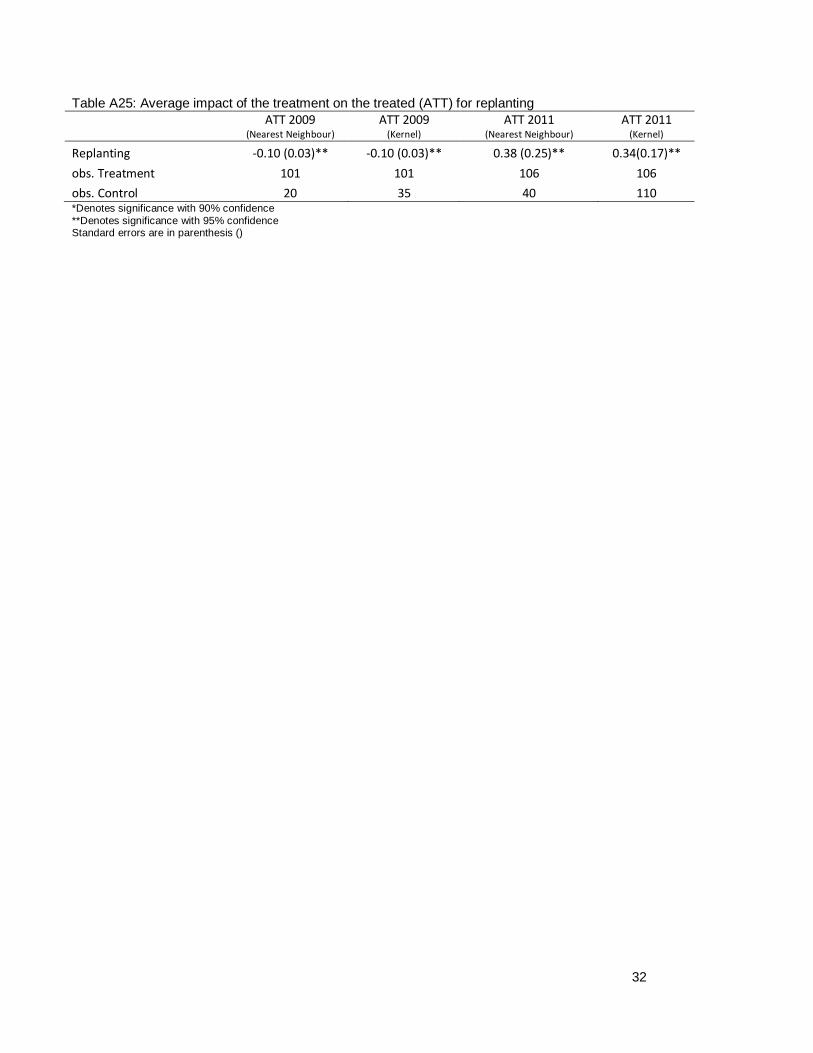
Table A25: Average impact of the treatment on the treated (ATT) for replanting
ATT 2009
(Nearest Neighbour) ATT 2009
(Kernel) ATT 2011
(Nearest Neighbour) ATT 2011
(Kernel)
Replanting -0.10 (0.03)** -0.10 (0.03)** 0.38 (0.25)** 0.34(0.17)**
obs. Treatment 101 101 106 106
obs. Control 20 35 40 110 *Denotes significance with 90% confidence
**Denotes significance with 95% confidence Standard errors are in parenthesis ()
33
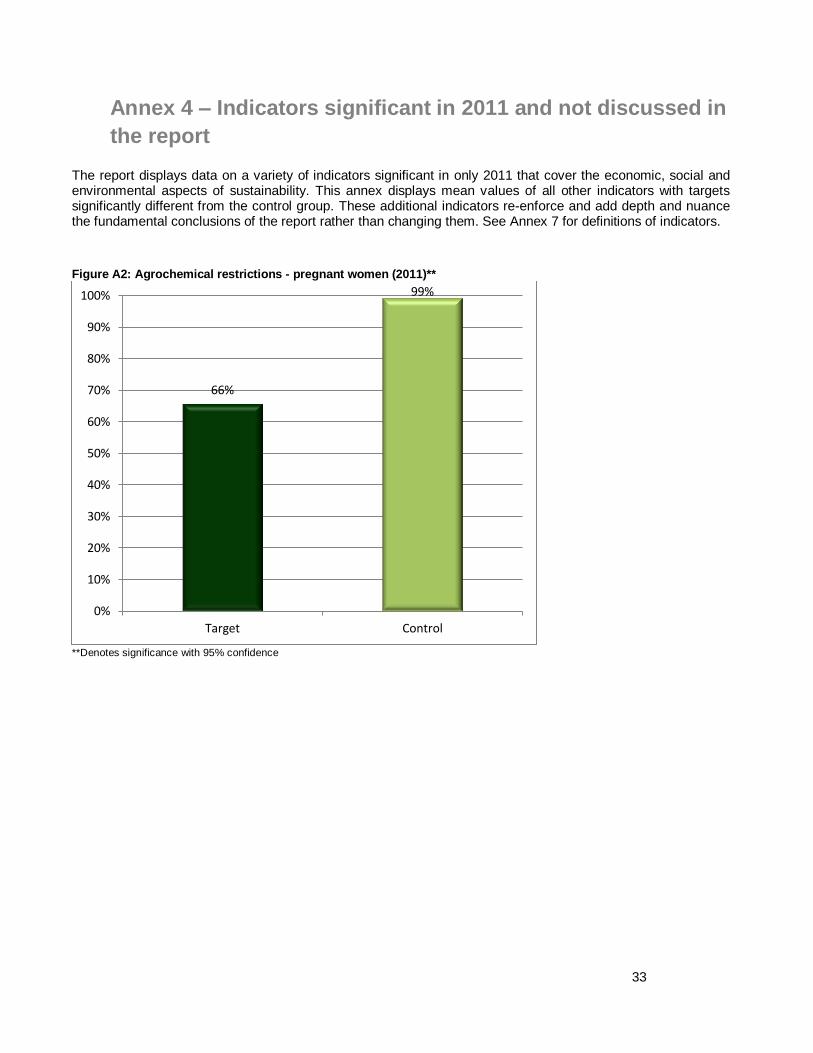
Annex 4 – Indicators significant in 2011 and not discussed in
the report
The report displays data on a variety of indicators significant in only 2011 that cover the economic, social and environmental aspects of sustainability. This annex displays mean values of all other indicators with targets significantly different from the control group. These additional indicators re-enforce and add depth and nuance the fundamental conclusions of the report rather than changing them. See Annex 7 for definitions of indicators.
Figure A2: Agrochemical restrictions - pregnant women (2011)**
**Denotes significance with 95% confidence
66%
99%
0%
10%
20%
30%
40%
50%
60%
70%
80%
90%
100%
Target Control
34
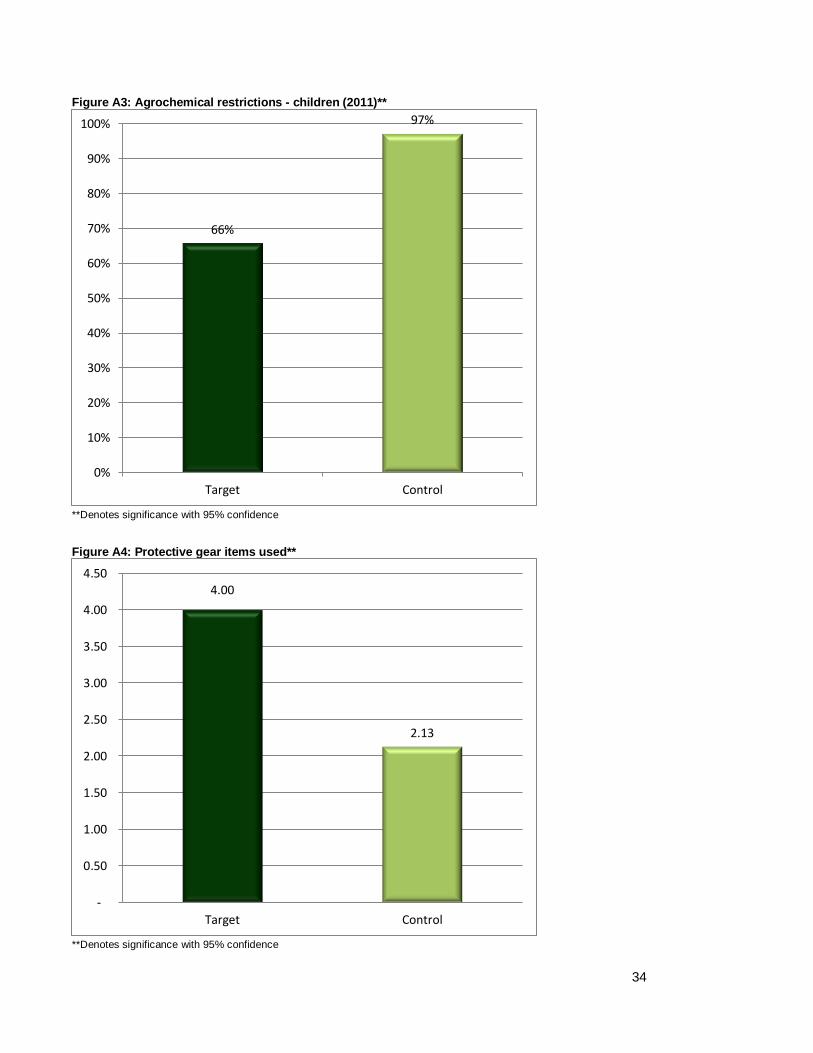
Figure A3: Agrochemical restrictions - children (2011)**
**Denotes significance with 95% confidence
Figure A4: Protective gear items used**
**Denotes significance with 95% confidence
66%
97%
0%
10%
20%
30%
40%
50%
60%
70%
80%
90%
100%
Target Control
4.00
2.13
-
0.50
1.00
1.50
2.00
2.50
3.00
3.50
4.00
4.50
Target Control
35
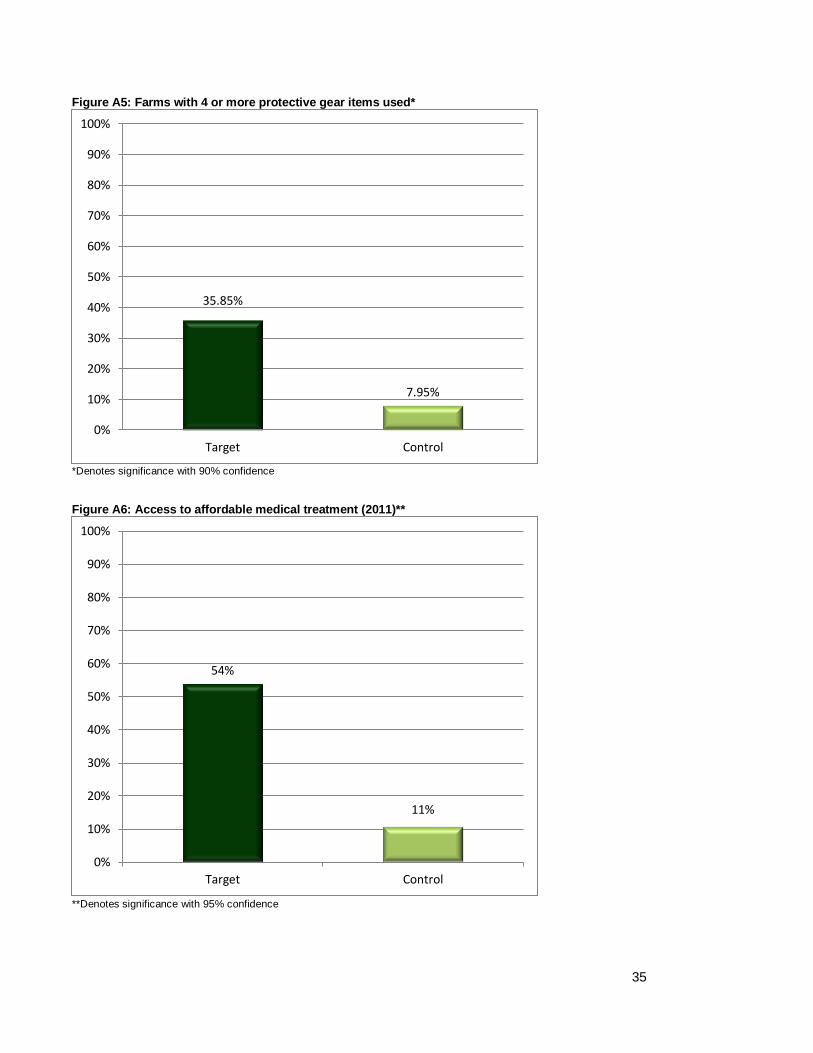
Figure A5: Farms with 4 or more protective gear items used*
*Denotes significance with 90% confidence
Figure A6: Access to affordable medical treatment (2011)**
**Denotes significance with 95% confidence
35.85%
7.95%
0%
10%
20%
30%
40%
50%
60%
70%
80%
90%
100%
Target Control
54%
11%
0%
10%
20%
30%
40%
50%
60%
70%
80%
90%
100%
Target Control
36
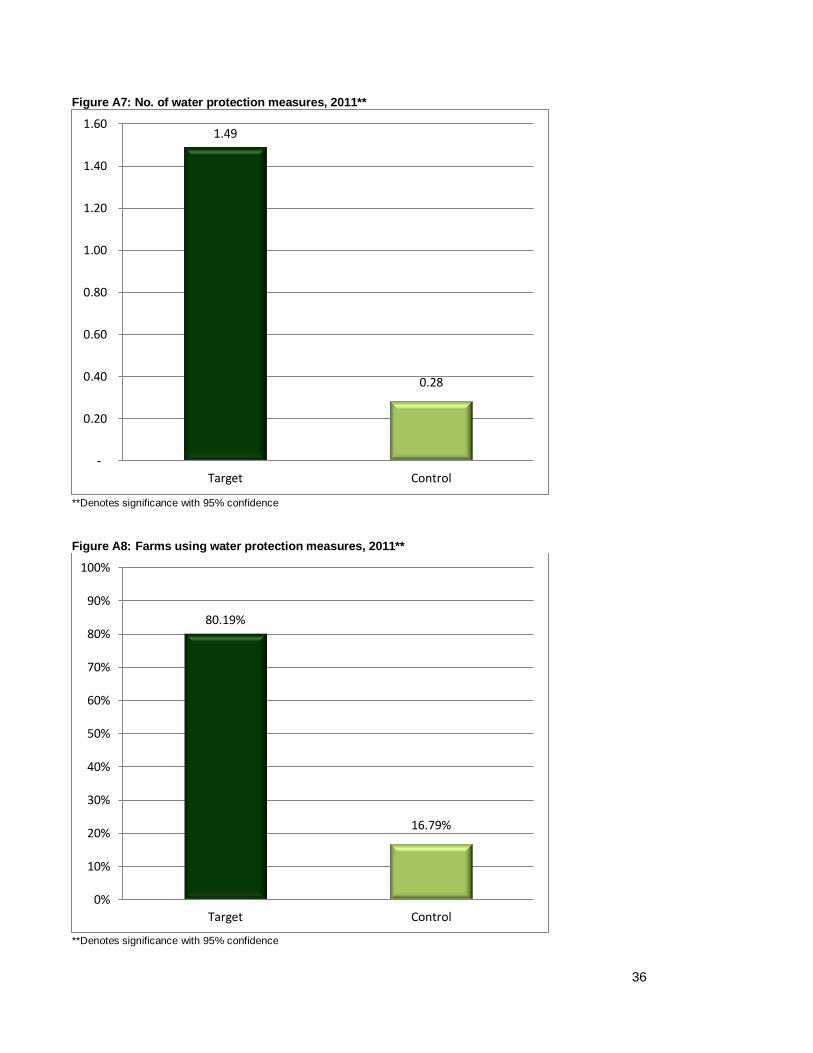
Figure A7: No. of water protection measures, 2011**
**Denotes significance with 95% confidence
Figure A8: Farms using water protection measures, 2011**
**Denotes significance with 95% confidence
1.49
0.28
-
0.20
0.40
0.60
0.80
1.00
1.20
1.40
1.60
Target Control
80.19%
16.79%
0%
10%
20%
30%
40%
50%
60%
70%
80%
90%
100%
Target Control
37
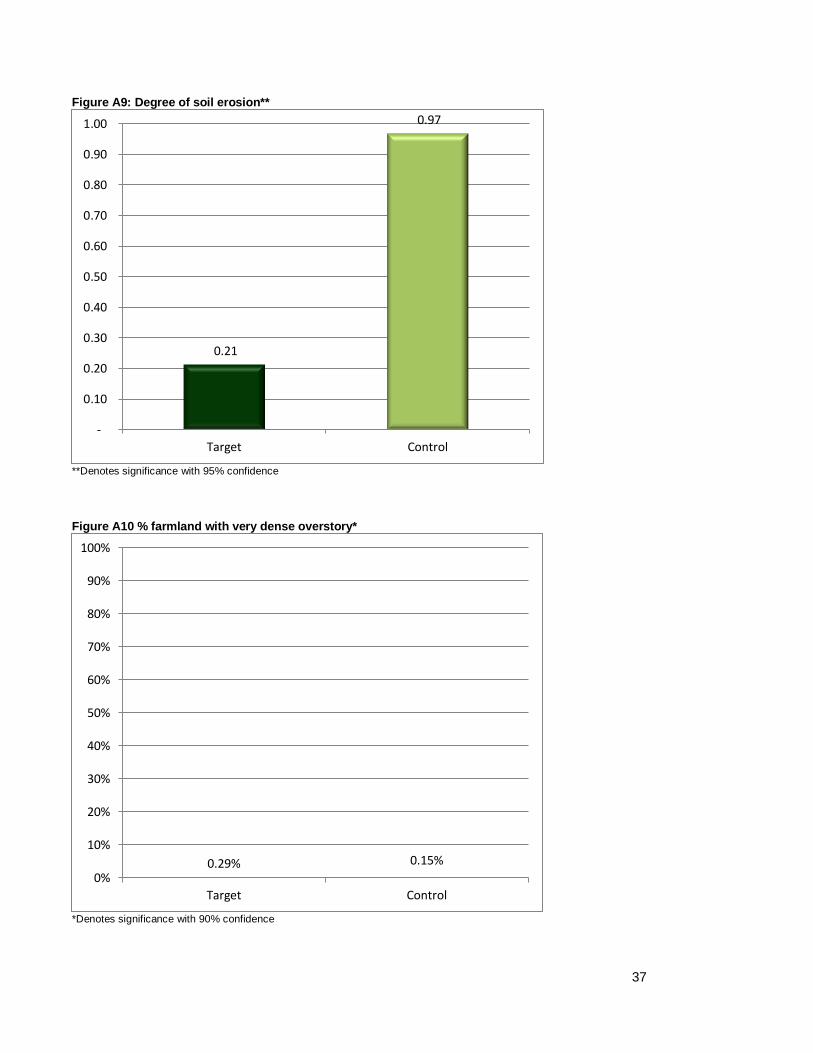
Figure A9: Degree of soil erosion**
**Denotes significance with 95% confidence
Figure A10 % farmland with very dense overstory*
*Denotes significance with 90% confidence
0.21
0.97
-
0.10
0.20
0.30
0.40
0.50
0.60
0.70
0.80
0.90
1.00
Target Control
0.29% 0.15%
0%
10%
20%
30%
40%
50%
60%
70%
80%
90%
100%
Target Control
38
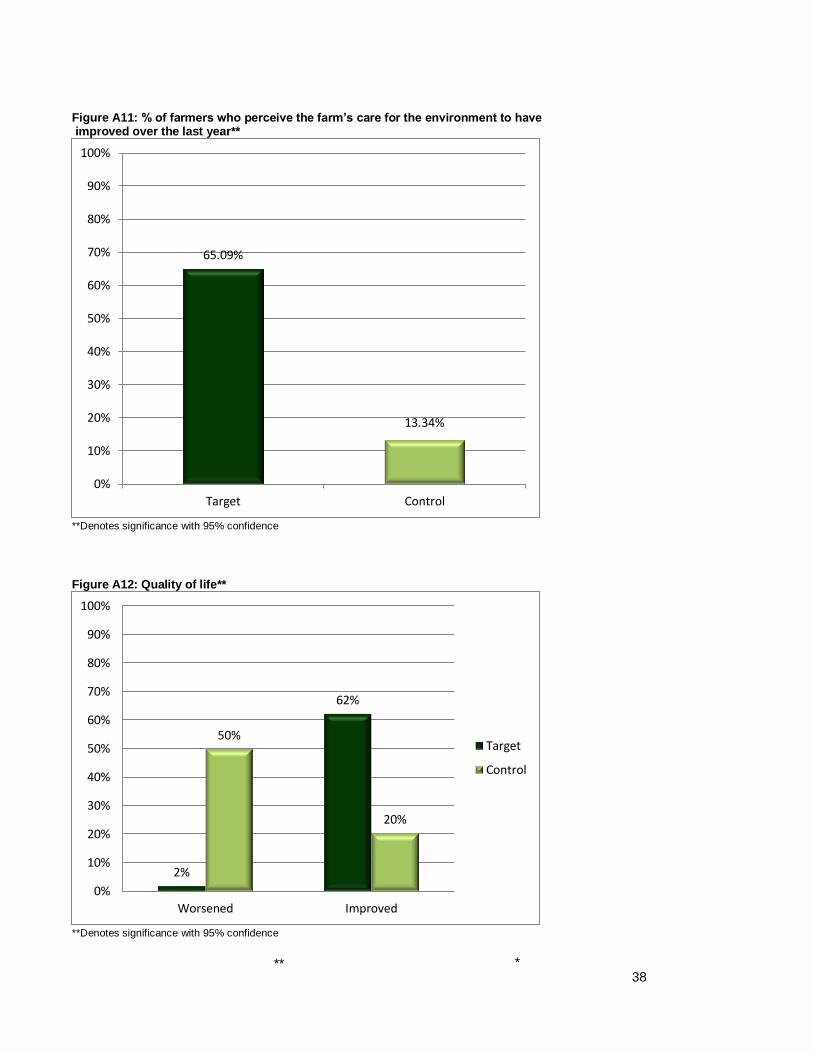
Figure A11: % of farmers who perceive the farm’s care for the environment to have improved over the last year**
**Denotes significance with 95% confidence
Figure A12: Quality of life**
**Denotes significance with 95% confidence
65.09%
13.34%
0%
10%
20%
30%
40%
50%
60%
70%
80%
90%
100%
Target Control
2%
62%
50%
20%
0%
10%
20%
30%
40%
50%
60%
70%
80%
90%
100%
Worsened Improved
Target
Control
** *
39
Annex 5 – Indicators with no significant differences between
target and control groups in 2011
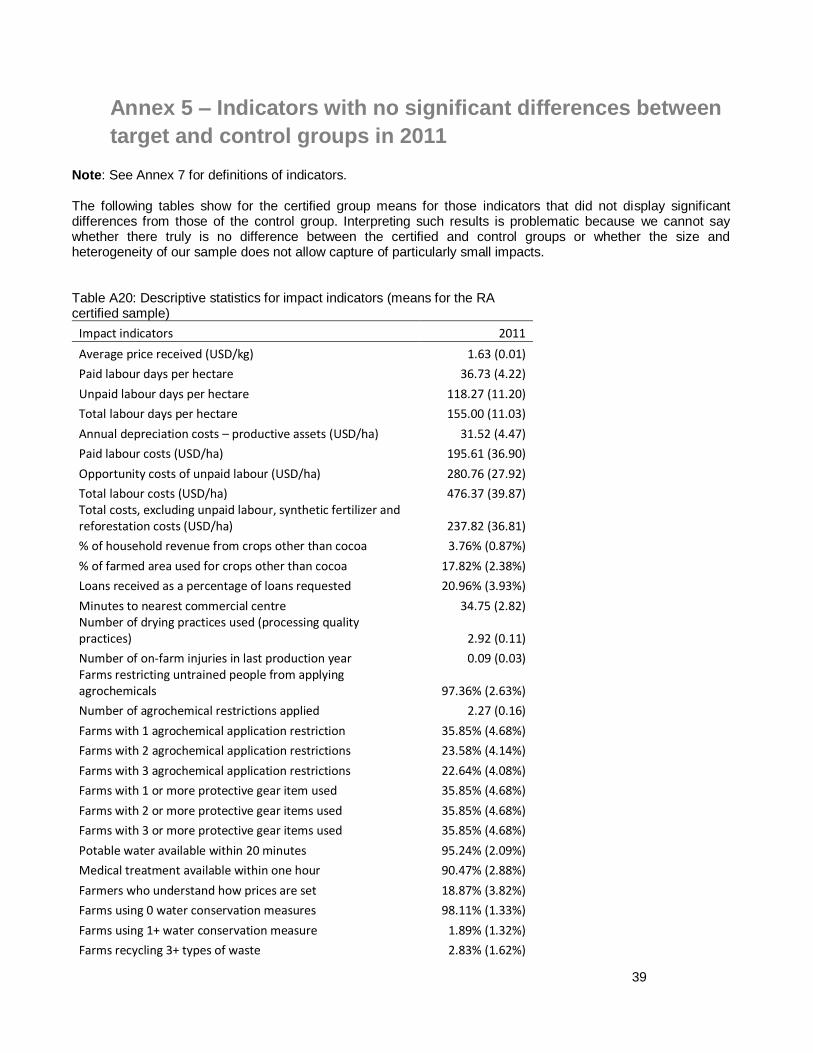
Note: See Annex 7 for definitions of indicators. The following tables show for the certified group means for those indicators that did not display significant differences from those of the control group. Interpreting such results is problematic because we cannot say whether there truly is no difference between the certified and control groups or whether the size and heterogeneity of our sample does not allow capture of particularly small impacts. Table A20: Descriptive statistics for impact indicators (means for the RA certified sample)
Impact indicators 2011
Average price received (USD/kg) 1.63 (0.01)
Paid labour days per hectare 36.73 (4.22)
Unpaid labour days per hectare 118.27 (11.20)
Total labour days per hectare 155.00 (11.03)
Annual depreciation costs – productive assets (USD/ha) 31.52 (4.47)
Paid labour costs (USD/ha) 195.61 (36.90)
Opportunity costs of unpaid labour (USD/ha) 280.76 (27.92)
Total labour costs (USD/ha) 476.37 (39.87) Total costs, excluding unpaid labour, synthetic fertilizer and reforestation costs (USD/ha) 237.82 (36.81)
% of household revenue from crops other than cocoa 3.76% (0.87%)
% of farmed area used for crops other than cocoa 17.82% (2.38%)
Loans received as a percentage of loans requested 20.96% (3.93%)
Minutes to nearest commercial centre 34.75 (2.82) Number of drying practices used (processing quality practices) 2.92 (0.11)
Number of on-farm injuries in last production year 0.09 (0.03) Farms restricting untrained people from applying agrochemicals 97.36% (2.63%)
Number of agrochemical restrictions applied 2.27 (0.16)
Farms with 1 agrochemical application restriction 35.85% (4.68%)
Farms with 2 agrochemical application restrictions 23.58% (4.14%)
Farms with 3 agrochemical application restrictions 22.64% (4.08%)
Farms with 1 or more protective gear item used 35.85% (4.68%)
Farms with 2 or more protective gear items used 35.85% (4.68%)
Farms with 3 or more protective gear items used 35.85% (4.68%)
Potable water available within 20 minutes 95.24% (2.09%)
Medical treatment available within one hour 90.47% (2.88%)
Farmers who understand how prices are set 18.87% (3.82%)
Farms using 0 water conservation measures 98.11% (1.33%)
Farms using 1+ water conservation measure 1.89% (1.32%)
Farms recycling 3+ types of waste 2.83% (1.62%)
40
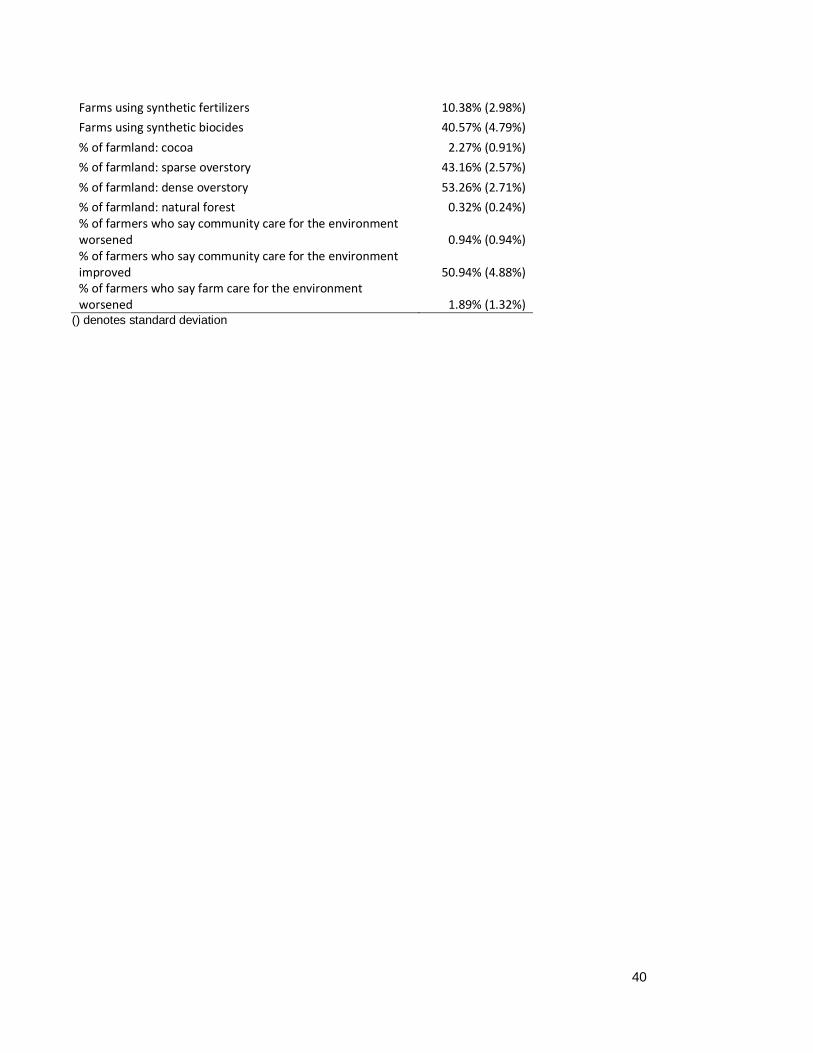
Farms using synthetic fertilizers 10.38% (2.98%)
Farms using synthetic biocides 40.57% (4.79%)
% of farmland: cocoa 2.27% (0.91%)
% of farmland: sparse overstory 43.16% (2.57%)
% of farmland: dense overstory 53.26% (2.71%)
% of farmland: natural forest 0.32% (0.24%) % of farmers who say community care for the environment worsened 0.94% (0.94%) % of farmers who say community care for the environment improved 50.94% (4.88%) % of farmers who say farm care for the environment worsened 1.89% (1.32%)
() denotes standard deviation
41
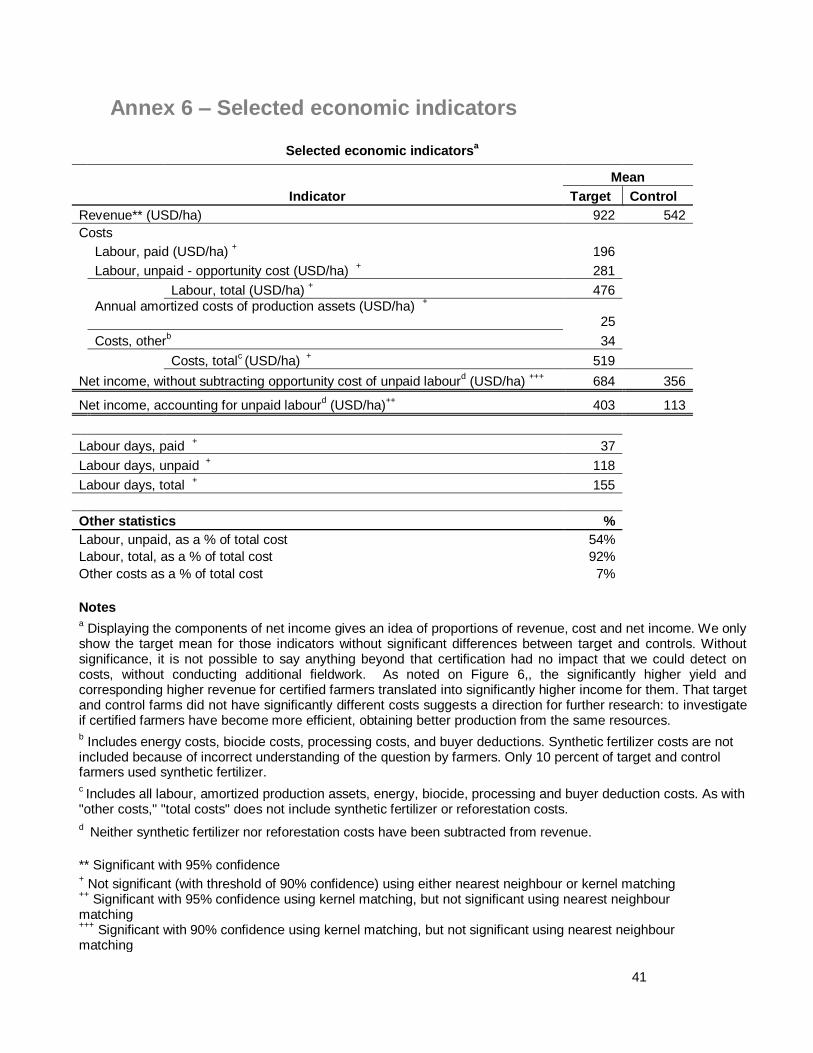
Annex 6 – Selected economic indicators
Selected economic indicatorsa
Indicator
Mean Target Control Revenue** (USD/ha) 922 542 Costs
Labour, paid (USD/ha)
+ 196
Labour, unpaid - opportunity cost (USD/ha)
+ 281
Labour, total (USD/ha)
+ 476
Annual amortized costs of production assets (USD/ha) +
25
Costs, other
b 34
Costs, total
c (USD/ha)
+ 519
Net income, without subtracting opportunity cost of unpaid labourd (USD/ha)
+++ 684 356
Net income, accounting for unpaid labour
d (USD/ha)
++ 403 113
Labour days, paid + 37
Labour days, unpaid + 118
Labour days, total + 155
Other statistics % Labour, unpaid, as a % of total cost 54% Labour, total, as a % of total cost 92% Other costs as a % of total cost 7%
Notes a
Displaying the components of net income gives an idea of proportions of revenue, cost and net income. We only show the target mean for those indicators without significant differences between target and controls. Without significance, it is not possible to say anything beyond that certification had no impact that we could detect on costs, without conducting additional fieldwork. As noted on Figure 6,, the significantly higher yield and corresponding higher revenue for certified farmers translated into significantly higher income for them. That target and control farms did not have significantly different costs suggests a direction for further research: to investigate if certified farmers have become more efficient, obtaining better production from the same resources. b Includes energy costs, biocide costs, processing costs, and buyer deductions. Synthetic fertilizer costs are not
included because of incorrect understanding of the question by farmers. Only 10 percent of target and control farmers used synthetic fertilizer. c Includes all labour, amortized production assets, energy, biocide, processing and buyer deduction costs. As with
"other costs," "total costs" does not include synthetic fertilizer or reforestation costs.
d Neither synthetic fertilizer nor reforestation costs have been subtracted from revenue.
** Significant with 95% confidence +
Not significant (with threshold of 90% confidence) using either nearest neighbour or kernel matching
++ Significant with 95% confidence using kernel matching, but not significant using nearest neighbour
matching
+++ Significant with 90% confidence using kernel matching, but not significant using nearest neighbour
matching
42
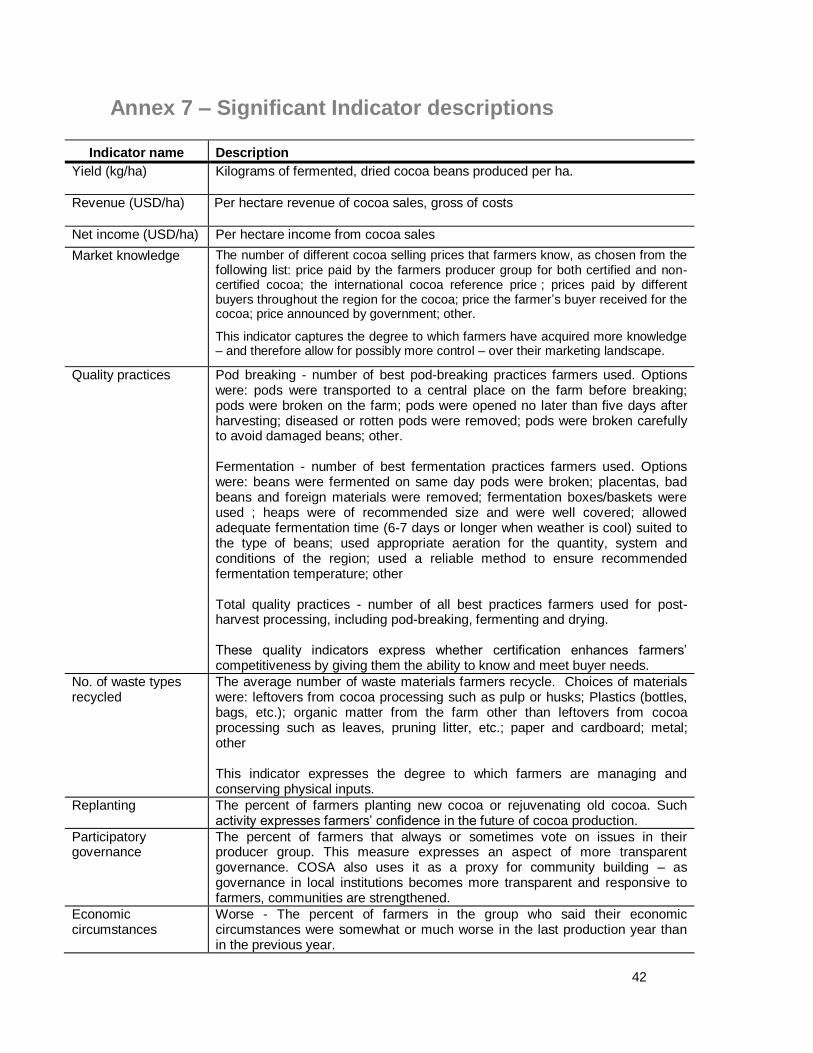
Annex 7 – Significant Indicator descriptions
Indicator name Description
Yield (kg/ha)
Kilograms of fermented, dried cocoa beans produced per ha.
Revenue (USD/ha)
Per hectare revenue of cocoa sales, gross of costs
Net income (USD/ha) Per hectare income from cocoa sales
Market knowledge
The number of different cocoa selling prices that farmers know, as chosen from the
following list: price paid by the farmers producer group for both certified and non-certified cocoa; the international cocoa reference price ; prices paid by different buyers throughout the region for the cocoa; price the farmer’s buyer received for the cocoa; price announced by government; other.
This indicator captures the degree to which farmers have acquired more knowledge – and therefore allow for possibly more control – over their marketing landscape.
Quality practices
Pod breaking - number of best pod-breaking practices farmers used. Options were: pods were transported to a central place on the farm before breaking; pods were broken on the farm; pods were opened no later than five days after harvesting; diseased or rotten pods were removed; pods were broken carefully to avoid damaged beans; other. Fermentation - number of best fermentation practices farmers used. Options were: beans were fermented on same day pods were broken; placentas, bad beans and foreign materials were removed; fermentation boxes/baskets were used ; heaps were of recommended size and were well covered; allowed adequate fermentation time (6-7 days or longer when weather is cool) suited to the type of beans; used appropriate aeration for the quantity, system and conditions of the region; used a reliable method to ensure recommended fermentation temperature; other Total quality practices - number of all best practices farmers used for post-harvest processing, including pod-breaking, fermenting and drying. These quality indicators express whether certification enhances farmers’ competitiveness by giving them the ability to know and meet buyer needs.
No. of waste types recycled
The average number of waste materials farmers recycle. Choices of materials were: leftovers from cocoa processing such as pulp or husks; Plastics (bottles, bags, etc.); organic matter from the farm other than leftovers from cocoa processing such as leaves, pruning litter, etc.; paper and cardboard; metal; other This indicator expresses the degree to which farmers are managing and conserving physical inputs.
Replanting
The percent of farmers planting new cocoa or rejuvenating old cocoa. Such activity expresses farmers’ confidence in the future of cocoa production.
Participatory governance
The percent of farmers that always or sometimes vote on issues in their producer group. This measure expresses an aspect of more transparent governance. COSA also uses it as a proxy for community building – as governance in local institutions becomes more transparent and responsive to farmers, communities are strengthened.
Economic circumstances
Worse - The percent of farmers in the group who said their economic circumstances were somewhat or much worse in the last production year than in the previous year.
43
Improved - The percent of farmers in the group who said their economic circumstances were somewhat or much better in the last production year than in the previous year.
School attendance
We compare children's ages to the grades of school they have completed and then calculate the % of children who have completed the appropriate number of grades for their age group. We assume that if they are not keeping up in school, it is either because they are working or because the family does not make enough money for school fees - either way, it does not reflect favorably on the situation of the farmers if the % is low.
Training
The percent of farmers that received training related to cocoa production and marketing, health and safety issues, environmental issues, and business and basic literacy during the last production year. This measure indicates whether certification is building farmer capacity.
Participation in infrastructure projects
The average number of projects in which farmers in the group participated to create better community infrastructure. Choices of infrastructure projects were: building community agricultural facilities (such as storage, nurseries, and processing facilities); projects to improve access to quality water supply or sewage; projects to improve medical care; projects to improve or construct roads; projects to improve or construct schools; other. This indicator expresses certification effects on strengthening communities by revealing if farmers in certified communities do participate more in community projects.
No. of conservation measures
The average number of practices farmers use to increase water percolation (which can improve water efficiency) and keep soil from washing away. Choices of conservation measures were: mulch or planted soil cover, check dams, drainage channels or diversion ditches, soil ridges around plants, contour planting and terracing, live fences (that is, trees and shrubs) and others that the farmers mention. Other aggregations presented for evaluating this indicator are: the % of farms employing 0 measures, and 1, 2 and 3 or more measures. This aggregation shows how broadly farmers have adopted multiple practices for conserving soil and improving water efficiency. This measure expresses whether certified farmers employ measures that increase the efficiency of resource use and protect the resource base for the future.
Agrochemical restrictions
The % farms restricting vulnerable groups from applying chemical fertilizers and biocides. Vulnerable groups asked about are:
Pregnant women
Children (18 and under)
Untrained people This indicator expresses whether basic rights are protected of workers (including people who work on their own farms) to a safe work environment
44
Protective gear COSA asks about the protective gear used by people working with agrochemicals and aggregates the results in different ways for the fullest picture. Aggregations showing significant differences between target and control groups where:
Average number of items used
% farms with 4 or more items used This indicator also expresses whether worker’s basic rights to a safe healthy work environment are protected (including for people who work on their own farms).
Access affordable medical treatment
% of farms where workers (including people who work on their own farms) have access to medical treatment that is either free, don’t cause difficulty for most workers or are difficult but do not keep workers from obtaining needed treatment. Care is considered unaffordable if costs keep workers from getting treatment for only the most serious conditions or from getting treatment at all. This indicator expresses whether basic human rights to health and safety are protected for those producing farm outputs.
Farms that have received training
% of farms that received some training during the target period This indicator expresses if basic rights to learning are recognized and whether investments are occurring in farmers’ knowledge capital.
Water protection measures
This indicator determines if farmers do any of the following: clean biocide equipment in designated areas away from water sources, and ensures that untreated water either from cocoa processing or living areas enter water bodies. Aggregations of the data presented are:
average number of water protection target and control groups employ and
the % of farms that use any measures at all. This indicator also expresses the capacity of farms and farm households to manage wastes to minimize and/or avoid water, soil and air pollution and degradation.
Erosion
The average soil erosion conditions on a continuous variable for expressing erosion severity. Choices are: severity 0 - no observed signs of erosion; severity 1 – no water rills but visible accumulation of soil downslope; severity 2 – visible water rills of different sizes and soil accumulating downslope; severity 3 - visible rills and gullies of larger size as compared to severity 2 and soil accumulates downslope. There is also an option that the cultivation area is flat. Flat farms are not included in the average erosion calculation. This indicator expresses if certification increases farmers’ capacity to manage their resource base sustainably.
45
Farmland overstory % of the farms with different categories of overstory biodiversity and density. The 6 categories are:
1. No trees 2. Only cocoa trees 3. Cocoa trees with sparse overstory 4. Overstory is denser with more diversity 5. Overstory is yet more dense and diverse 6. Natural forest
(Farmers identify drawings of these categories that most resemble areas of their farm.) For this study, the target and control groups differed significantly only on the % of farms covered by category 5 overstory.
Farms’ care of the environment
% of farmers who said their farm cared for the environment better than the previous year. Farmers can say that care became better, worse or stayed the same. In 2011, target and control farms differed significantly only for the 5 saying care had increased. This measure expresses how farmers perceive environmental care. Perception questions may reflect qualities farmers note that are not revealed by any other questions.
Quality of life
% of farmers saying their quality of life had either worsened or improved since the previous year. This measure is expected to capture whether with all factors the farmer considers relevant, life is improving.