corruption: costs and mitigation strategies€¦ · · 2017-04-09corruption: costs and mitigation...
TRANSCRIPT

Corruption: Costs and Mitigation Strategies
Presented by
Sanjeev GuptaDeputy Director
Fiscal Affairs Department
INTERNATIONAL MONETARY FUND
APRIL 12, 2017

Outline
Definitions and Manifestations
The economic and social costs of corruption
Corruption and Fiscal Policy
Strategies for addressing corruption based on IMF experience
Conclusions
2
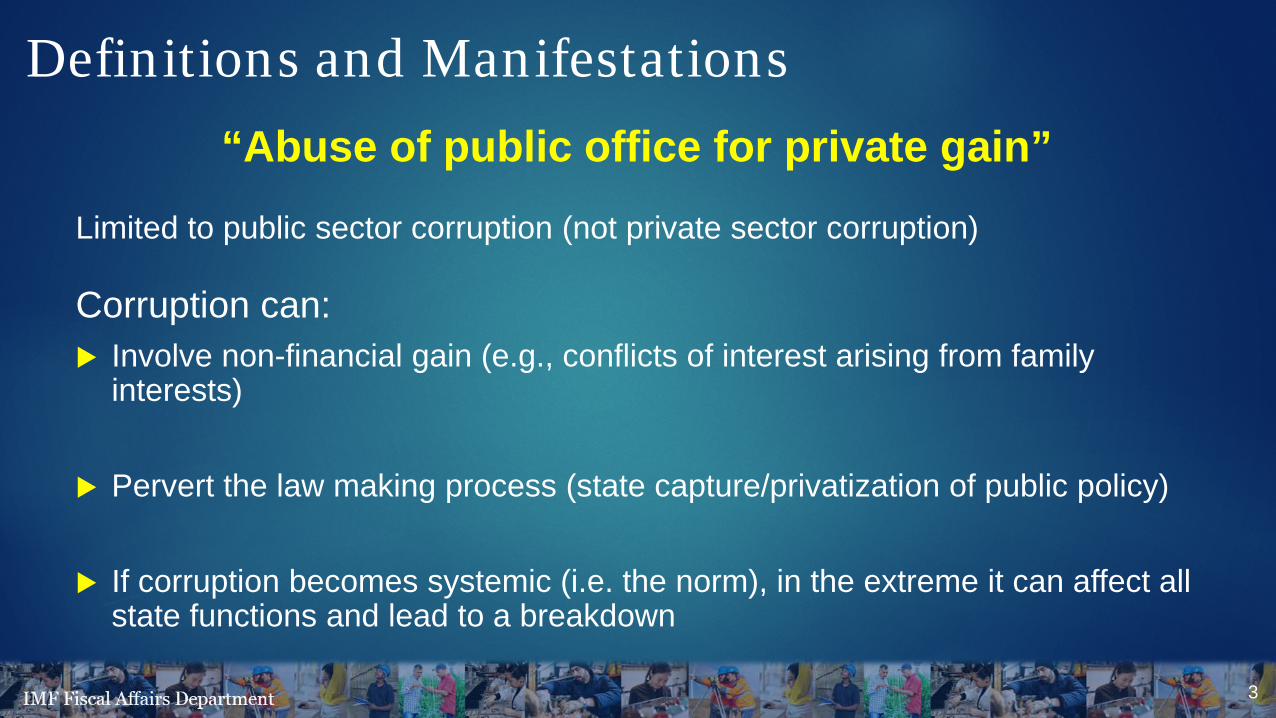
Definitions and Manifestations“Abuse of public office for private gain”
Limited to public sector corruption (not private sector corruption)
Corruption can: Involve non-financial gain (e.g., conflicts of interest arising from family
interests)
Pervert the law making process (state capture/privatization of public policy)
If corruption becomes systemic (i.e. the norm), in the extreme it can affect all state functions and lead to a breakdown
3

The Economic and Social Costs of
Corruption

Potential Inclusive Growth
Fiscal
Corruption
Macro-FinancialStability
• Banking crises• External sector imbalances• Inflation• Fiscal unsustainability• Financial inclusion
Market Regulation
Monetary Policy
Financial Sector
Oversight
Public & PrivatePhysical Capital
• Inefficient public investment• Costly investment and production• Distorted composition of projects• Uncertainty• Distorted asset prices
Human Capital• Insufficient spending on
education/health• Poverty and inequality• Disincentives for skill
acquisition
TFP• Insufficient investment
(R&D)• Inefficiency• Distorted capital
allocation• Skills mismatch
PoliticalInstability
and Conflict
Public Order &
Enforcement
State Functions
5

… and can hinder sound monetary policy
Because of lower public revenues, countries tend to rely more on seignioragefinance
Fiscal dominance Inflation bias as shown in the figure
Corruption further weakens financial oversight and stability
Poor lending and regulatory practices Weak banking supervision
6
CPI Inflation and Corruption Perception Index 1/
(Average for 1995-2014)
Correlation= 0.426***
-40
-30
-20
-10
0
10
20
30
40-2 -1 0 1 2 3
Cor
rupt
ion
Perc
eptio
n In
dex
2/
CPI Inflation1/ Variables presented are deviations from values predicted by income level.2/ Larger numbers indicate lower perceived levels of public sector corruption. Asterisks from the correlation equation imply significance at 1%.

Corruption hampers market access…
Even market participants appear to factor in corruption into their lending decisions
7
Correlation = 0.488**
-40
-30
-20
-10
0
10
20
30
40-1.5 -1 -0.5 0 0.5 1 1.5
Cor
rupt
ion
Perc
eptio
n In
dex
2/
EM Yield Spread (Basis Points) 1/ Variables presented are deviations from values predicted by income level.2/ Larger numbers indicate lower perceived levels of public sector corruption. Asterisks from the correlation equation imply significance at 5%.
Emerging Market Sovereign Spreads and Corruption Perception Index 1/
(Average for 1995-2014)
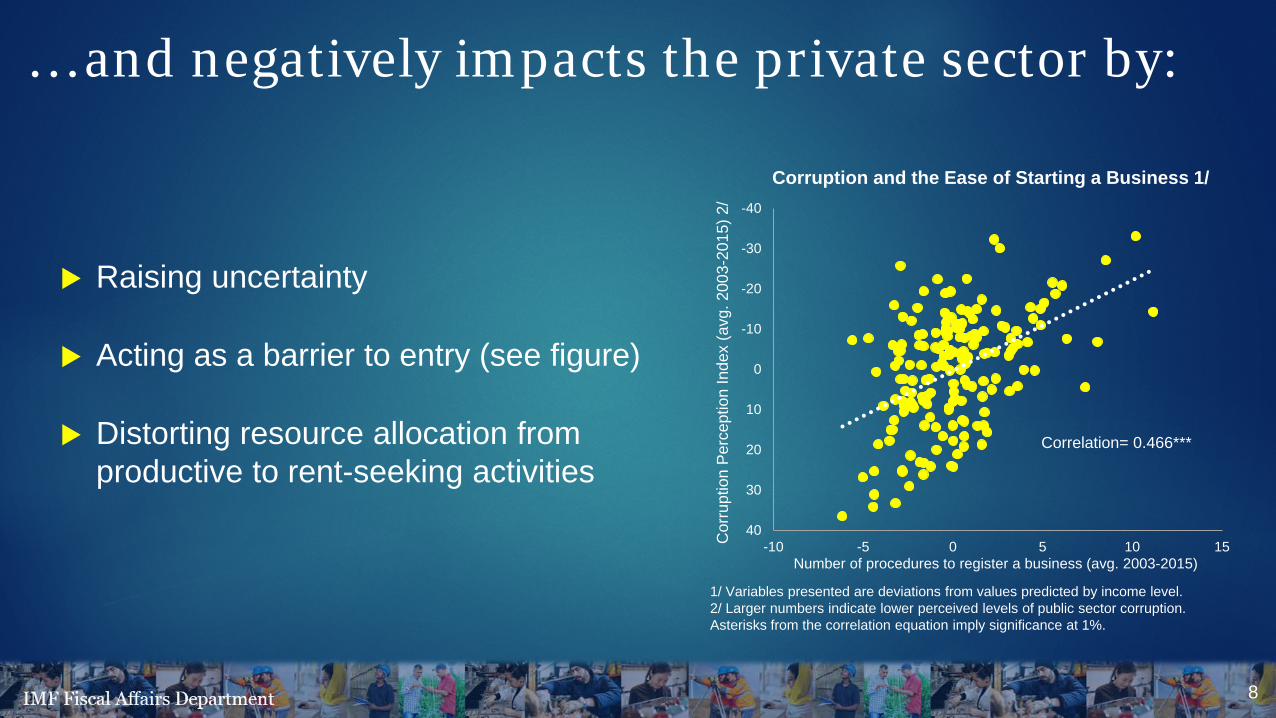
… and negatively impacts the private sector by:
Raising uncertainty
Acting as a barrier to entry (see figure)
Distorting resource allocation from productive to rent-seeking activities
8
Correlation= 0.466***
-40
-30
-20
-10
0
10
20
30
40-10 -5 0 5 10 15C
orru
ptio
n Pe
rcep
tion
Inde
x (a
vg. 2
003-
2015
) 2/
Number of procedures to register a business (avg. 2003-2015)
Corruption and the Ease of Starting a Business 1/
1/ Variables presented are deviations from values predicted by income level.2/ Larger numbers indicate lower perceived levels of public sector corruption. Asterisks from the correlation equation imply significance at 1%.

Corruption is linked to poor social and environmental outcomes
Limits build-up of human capital Through reduced allocations for social programs Compounded by leakages With potential consequences for equality and poverty
9
Studies show that child mortality rates are about one-third higher in countries with high corruption.Infant mortality rates and percent of low-birthweight babies are almost twice as high.
More pollution due to Weaker, poorly enforced environmental regulations Over extraction of natural resources

Political instability and conflict
10
► In the extreme, systemic corruption can lead to political instability and conflict
► It has been argued that natural resource abundance can accentuate the situation

Corruption and Fiscal Policy

Corruption and Expenditure: It undermines quantity and quality of public spending through…
Inflated public procurement costs Siphoning of funds through off-budget transactions Weak payroll controls and Weaknesses in computerized PFM systems
Distorts budget allocations Lower public investment and other priority
spending Lower efficiency of public investment (see figure)
12
Public Investment Efficiency and Corruption Perception Index
0.0
0.1
0.2
0.3
0.4
0.5
0.6
0.7
0.8
0.9
1.0
Corruption Perception Index (avg. 2004-15)
Note: The samples are grouped into high, medium and low corruption in equal numbers based on the Corruption Perception Index. The lines show the range of efficiency for each group. The green and red boxes are the second and third quartile (from the bottom) of the samples, thus the boxes cover 50 percent of the countries.
Publ
ic In
vest
men
t Effi
cien
cyIn
dex
(larg
er n
umbe
rs m
ean
high
er e
ffici
ency
, 0-1
)
High Corruption Medium Corruption Low Corruption

Corruption and taxationCorruption weakens the state’s capacity to raise revenue…
Harms the culture of compliance, increasing tax evasion
As a result, lower revenue limits the ability of the state to provide public services with consequences for growth
More empirical evidence needed…
Several papers document the negative effect of corruption on tax revenues (Friedman, Johnson, Kaufman, and Zoido-Lobaton (2000, JPE), Fjeldstad and Tungodden (2001), Fisman and Svenson (2002), Imam and Jacobs (2007, IMFWP), Besley and Persson (2014, JEP)).
Limited evidence on the transmission mechanisms and the composition effects ((Tanzi and Davoodi (1997), Imam and Jacobs (2007, IMFWP))
Here we report work on taxation and corruption…
Using recently compiled comprehensive dataset of 152 countries covering 1995-2015.
Assess the effects of corruption on tax revenues using disaggregated tax data.
Assess the effects of corruption on specific taxes using micro data derived from new IMF tools
13

Total Tax Revenue
14
0
5
10
15
20
25
30
35
40
0 20 40 60 80
Tax
Rev
enue
(% o
f GD
P)
TI Transparency Index
Total Tax: All Countries
Correlation -0.5175***
Note: Larger numbers on the x-axis indicate higher perceived levels of public sector corruption. Asterisks from the correlation equation imply significance at 1%.
0
5
10
15
20
25
30
35
40
0 20 40 60 80
Tax
Rev
enue
(% o
f GD
P)
TI Transparency Index
Total Tax: Advanced vs. Developing
AdvancedDeveloping
Correlation -0.4754***
Correlation -0.5266***

Taxes on Goods and Services
15
0
2
4
6
8
10
12
14
0 20 40 60 80
Tax
Rev
enue
(% o
f GD
P)
TI Perception Index
VAT Revenue
Correlation -0.3216***
Note:1. Larger numbers on the x-axis indicate higher perceived levels of public sector corruption. 2. Asterisks from the correlation equation imply significance at 1%.3. Data sourced from IMF’s FAD WoRLD Tax Database and Transparency International
0
0.2
0.4
0.6
0.8
1
1.2
0 20 40 60 80 100
C-E
ffici
ency
Rat
io
TI Perception Index
VAT C-Efficiency
Correlation -0.4668***

VAT Policy and compliance gaps
16
Note:1. Data sourced from IMF Revenue Administration’s Fiscal Information Tool (RA-FIT) and Gap program (RA-GAP), and Transparency
International2. Asterisks from the correlation equation imply significance at 1%.
0
1
2
3
4
5
6
7
8
0 20 40 60 80
Com
plia
nce
Gap
TI Perception Index
Correlation 0.5874***
Compliance Gap
0
10
20
30
40
50
60
70
80
0 20 40 60 80
VAT
Ref
und/
VAT
Gro
ss (%
)
TI Perception Index
VAT Refunds Correlation - 0.4301***

Income Tax Revenue
17
0
2
4
6
8
10
12
14
16
0 20 40 60 80
Tax
Rev
enue
(% o
f GD
P)
TI Perception Index
Individual Income Tax
0
1
2
3
4
5
6
7
8
0 20 40 60 80
Tax
Rev
enue
(% o
f GD
P)
TI Perception Index
Corporate Income Tax
Correlation -0.7452*** Correlation -0.0913
Note:1. Larger numbers on the x-axis indicate higher perceived levels of public sector corruption. 2. Asterisks from the correlation equation imply significance at 1%.3. Data sourced from IMF’s FAD WoRLD Tax Database and Transparency International

Other taxes: social security contributions and Trade Tax
18
0
2
4
6
8
10
12
14
16
18
0 50
Tax
Rev
enue
(% o
f GD
P)
TI Perception Index
Social Security Contributions
Correlation -0.4193***
Note:1. Larger numbers on the x-axis indicate higher perceived levels of public sector corruption. 2. Asterisks from the correlation equation imply significance at 1%.3. Data sourced from IMF’s FAD WoRLD Tax Database and Transparency International
0
2
4
6
8
10
12
14
20 40 60 80 100
Tax
Rev
enue
(% o
f GD
P)
TI Perception Index
Trade Tax
Correlation -0.2100***

Trade Efficiency
19
0
5
10
15
20
25
30
35
10 30 50 70 90
Num
ber o
f Day
s
TI Perception Index
All Entry Points
Correlation 0.4217***
Note:1. Larger numbers on the x-axis indicate higher perceived levels of public sector corruption. 2. Asterisks from the correlation equation imply significance at 1%.3. Data sourced from IMF revenue Administration’s Fiscal Information Tool and Transparency International
0
20
40
60
80
100
Air Land Sea
Without Inspection
Low Corruption High Corruption
Air Land Sea
With Inspection
Low Corruption High Corruption
Days To Clear Imports Through Customs

Empirical methodology
Usual regression: 𝒚𝒚𝒊𝒊𝒊𝒊 = 𝜶𝜶 + 𝜷𝜷 ∗ 𝑪𝑪𝑪𝑪𝑪𝑪𝒊𝒊𝒊𝒊 + ∑𝒏𝒏𝒌𝒌 𝜽𝜽𝒌𝒌𝑿𝑿𝒊𝒊𝒊𝒊𝒌𝒌 + 𝜺𝜺𝒊𝒊𝒊𝒊
Data Tax data from IMF databases (WOrLD)
Corruption Perception Index (CPI) from Transparency International
Identification IV pool estimates (more data)
Instrumental variables: Index of ethnolinguistic fractionalization and religion fragmentation.
20

Total Tax Revenue
21
Note:1. Data sourced from IMF’s FAD WoRLD Tax Database and Transparency International2. Asterisks from the correlation equation imply significance at 1%.3. The line graph shows the change in average corruption perception index over time on the secondary axis
Corruption Index Over TimeTotal Tax Revenue
2.60
1.70
2.90 2.95
00.5
11.5
22.5
33.5
44.5
5
Overall 1995-2000 2003-2007 2008-2015Grouping by Time Period
***
***
*** ***
40
45
50
55
60
65
1995
1996
1997
1998
1999
2000
2001
2002
2003
2004
2005
2006
2007
2008
2009
2010
2011
2012
2013
2014
Change in Revenue after 5 points increase in corruption index

Revenue composition
22
0.65 0.75
0.35
2.10
0.85
0
0.5
1
1.5
2
2.5
3
VAT Individual IncomeTax
Corporate IncomeTax
Social SecurityContributions
Trade Tax
Cha
nge
in T
ax R
even
ue
Tax Type
*** ******
***
***
Change in Revenue after 5 points increase in Corruption index
Note:1. Data sourced from IMF’s FAD WoRLD Tax Database and Transparency International2. Asterisks from the correlation equation imply significance at 1%.

Key messages on taxation and corruption Corruption is associated with weak revenue performance
The impact is felt more on VAT—the tax with most revenue potential. Corruption seems to be having a negative impact on its compliance and implementation
Personal income tax affected more than CIT—this has implications for the progressivity and the design of the tax system.
Surprisingly, social security contributions are strongly affected. More digging is needed to understand this result. This might be related to the extent of informality in the economy.
Trade taxes continue to be affected—as reflected in the delays at clearance points. While the importance of these taxes is declining for many developing countries, there are others such as fragile states where they will remain crucial sources of revenue.
23

Strategies for Addressing CorruptionTransparency, Rule of Law, Economic
Reform and Regulation, Building Institutions

Fund Experience: four main areas
25
1. Transparency: providing public with access to information
2. Rule of Law: having a credible threat of prosecution
3. Economic Reform: eliminating excessive regulation
4. Building institutions: all depends on effective institutions

Transparency
GeneralTransparency is a pre-requisite for the proper functioning of the market
It can also be targeted on corruption Development of international standards on fiscal and financial transparency Transparency in extractive industries – these are important because of their
relative share in many economies Supporting international standards on transparent corporate ownership
26

Enhancing the Rule of Law
27
► There must be a credible threat of prosecution
► Sometimes new specialized institutions must be set up where existing ones are themselves corrupt
► An effective anti-money laundering framework must be in place to minimize the laundering of proceeds of corruption
► Enforcement must also target the private sector

Economic Reform
28
Eliminating Excessive Regulation
Excessive regulation is an important source of corruption (Anne Krueger: “rent seeking”)Elimination of excessive regulation and simplification are a cornerstone of anti-corruption strategy (i.e., Ukraine Caribbean, MENA countries).
However, it is important to have an adequate institutional framework in place first when transitioning from state controlled monopolistic markets. (i.e., emerging economies in Eastern Europe)

Building InstitutionsThe key issue is implementation, for which institutions are critical. Four building blocks for effective institutions.
A clear legal framework is requiredFor example: an independent central bank (mandate, oversight, operational and financial autonomy, appointment criteria, dismissal rules, legal protection of staff)
With adequate technical expertiseInstitutions cannot be effective without requisite technical competence
And the right incentive package for non-corrupt behaviorFor example: securing wage adequacy in combination with effective dismissal procedures
With a critical role of leadershipFor example: both setting a personal example and ensuring decisive action
29

Conclusion
Public sector corruption substantially impairs key channels influencing inclusive growth.
Fighting corruption calls for a long term and holistic strategy, albeit appropriately sequenced based on country-specific circumstances.
A crisis can be a catalyst for change; but a crisis setting generally does not permit for full resolution. Determined leadership over time is a key underlying factor.
30

Appendix Tables
31

32
First stageDpdt var.
(1) (2)
Ethno. Fraction. 46.5369*** 18.3044***(1.690) (1.421)
Religion Fragm. -11.0884*** -9.8781***(1.988) (1.320)
Openness -0.1159(0.590)
Log. of Inflation 3.0531***(0.310)
Share of Agric. 17.3537***(3.660)
Log. GDPpc PPP 64.8744***(3.947)
Log. GDPpc PPP 2̂ -4.1659***(0.226)
Constant 40.9355*** -179.5068***(1.123) (17.705)
Observations 1,934 1,934R-squared 0.262 0.672Standard errors in parentheses*** p<0.01, ** p<0.05, * p<0.1
AllCorr. percep. index

33
Corruption and TaxationDpdt var.
(1) (2) (3) (4)
Corr. percep. index -0.0052*** -0.0113*** -0.0005** -0.0005*(0.000) (0.001) (0.000) (0.000)
Corr. percep. indexAE -0.0034*** -0.0002(0.001) (0.000)
Openness 0.0045 0.0036 0.0211*** 0.0212***(0.006) (0.007) (0.008) (0.008)
Log. of Inflation 0.0142*** 0.0168*** -0.0005 -0.0005(0.003) (0.004) (0.001) (0.001)
Share of Agric. -0.1029*** 0.0642 -0.0499 -0.0498(0.032) (0.051) (0.044) (0.044)
Log. GDPpc PPP 0.3204*** 0.3395*** 0.2004*** 0.1993***(0.031) (0.050) (0.040) (0.041)
Log. GDPpc PPP 2̂ -0.0205*** -0.0220*** -0.0102*** -0.0101***(0.002) (0.003) (0.002) (0.002)
Constant -0.6494*** -0.3095* -0.7652*** -0.7538***(0.116) (0.166) (0.189) (0.192)
Observations 1,934 1,934 1,952 1,952R-squared 0.174 0.174AP 97.67 17.58PvalAP 0 0CD 101.2 15.83Standard errors in parentheses*** p<0.01, ** p<0.05, * p<0.1
Total Tax RevenueAll
IV Pool FE

34
Income and Geographical differencesDpdt var.
(1) (2) (3) (4) (5) (6)
Corr. percep. index -0.0113*** -0.0079*** -0.0045*** -0.0050*** -0.0053*** -0.0049***(0.001) (0.001) (0.000) (0.000) (0.000) (0.000)
Corr. percep. Index*AE -0.0034***(0.001)
Corr. percep. Index*DC 0.0034***(0.001)
Corr. percep. Index*CIS 0.0033***(0.000)
Corr. percep. Index*LAC -0.0008***(0.000)
Corr. percep. Index*MENA -0.0004*(0.000)
Corr. percep. Index*SSA 0.0002(0.000)
Constant -0.3095* -0.6448*** -0.3393*** -0.7679*** -0.6325*** -0.6553***(0.166) (0.176) (0.106) (0.114) (0.128) (0.115)
Observations 1,934 1,934 1,934 1,934 1,934 1,934AP 17.58 17.58 60.79 65.60 58.39 53.82PvalAP 0 0 0 0 0 0CD 15.83 15.83 66.28 55.22 46.70 59.17Standard errors in parentheses*** p<0.01, ** p<0.05, * p<0.1
Total Tax RevenueAll
35
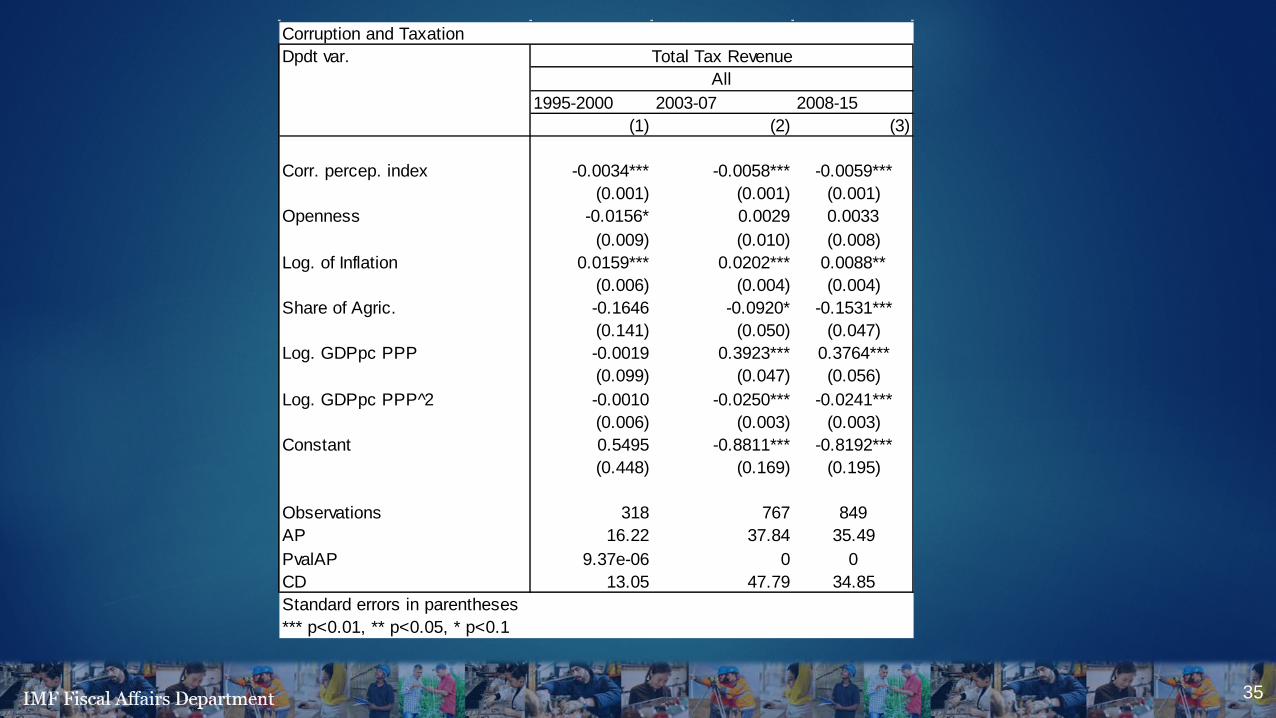
Corruption and TaxationDpdt var.
1995-2000 2003-07 2008-15(1) (2) (3)
Corr. percep. index -0.0034*** -0.0058*** -0.0059***(0.001) (0.001) (0.001)
Openness -0.0156* 0.0029 0.0033(0.009) (0.010) (0.008)
Log. of Inflation 0.0159*** 0.0202*** 0.0088**(0.006) (0.004) (0.004)
Share of Agric. -0.1646 -0.0920* -0.1531***(0.141) (0.050) (0.047)
Log. GDPpc PPP -0.0019 0.3923*** 0.3764***(0.099) (0.047) (0.056)
Log. GDPpc PPP 2̂ -0.0010 -0.0250*** -0.0241***(0.006) (0.003) (0.003)
Constant 0.5495 -0.8811*** -0.8192***(0.448) (0.169) (0.195)
Observations 318 767 849AP 16.22 37.84 35.49PvalAP 9.37e-06 0 0CD 13.05 47.79 34.85Standard errors in parentheses*** p<0.01, ** p<0.05, * p<0.1
Total Tax RevenueAll

36
Corruption and Goods and Services taxesDpdt var. Goods and
Services TaxVAT Excise Tax VAT C-efficiency
(1) (2) (3) (4)
Corr. percep. index -0.0009*** -0.0013*** -0.0001 0.0030*(0.000) (0.000) (0.000) (0.002)
Openness 0.0008 0.0135*** 0.0013 0.0988***(0.002) (0.002) (0.001) (0.011)
Log. of Inflation 0.0019* 0.0021** -0.0002 -0.0086(0.001) (0.001) (0.001) (0.007)
Share of Agric. -0.0432*** 0.0065 0.0024 -0.1409(0.014) (0.016) (0.006) (0.106)
Log. GDPpc PPP 0.1448*** 0.1709*** 0.0284** 0.3489*(0.021) (0.023) (0.012) (0.204)
Log. GDPpc PPP 2̂ -0.0086*** -0.0103*** -0.0015* -0.0133(0.001) (0.001) (0.001) (0.012)
Constant -0.4754*** -0.5662*** -0.1067*** -1.8141**(0.078) (0.086) (0.040) (0.748)
Observations 1,654 1,388 1,574 1,091AP 48.80 48.28 50.19 41.05PvalAP 0 0 0 0.138CD 42.22 36.26 38.82 32.49Standard errors in parentheses*** p<0.01, ** p<0.05, * p<0.1

37
Corruption and Income TaxDpdt var. Income Tax Individual Income Tax Corporate Income Tax
(2) (3) (4)
Corr. percep. index -0.0009*** -0.0015*** 0.0007***(0.000) (0.000) (0.000)
Openness -0.0134*** -0.0125*** 0.0038***(0.002) (0.002) (0.001)
Log. of Inflation 0.0026** 0.0018* 0.0006(0.001) (0.001) (0.001)
Share of Agric. -0.0589*** -0.0404*** -0.0127(0.018) (0.013) (0.017)
Log. GDPpc PPP -0.1108*** -0.0751*** -0.0468**(0.026) (0.029) (0.021)
Log. GDPpc PPP 2̂ 0.0069*** 0.0041** 0.0035***(0.002) (0.002) (0.001)
Constant 0.5786*** 0.4865*** 0.1278(0.094) (0.094) (0.083)
Observations 1,684 1,432 1,508AP 49.95 28.60 42.79PvalAP 0.00812 1.04e-05 2.60e-05CD 40.70 19.50 31.02Standard errors in parentheses*** p<0.01, ** p<0.05, * p<0.1
38
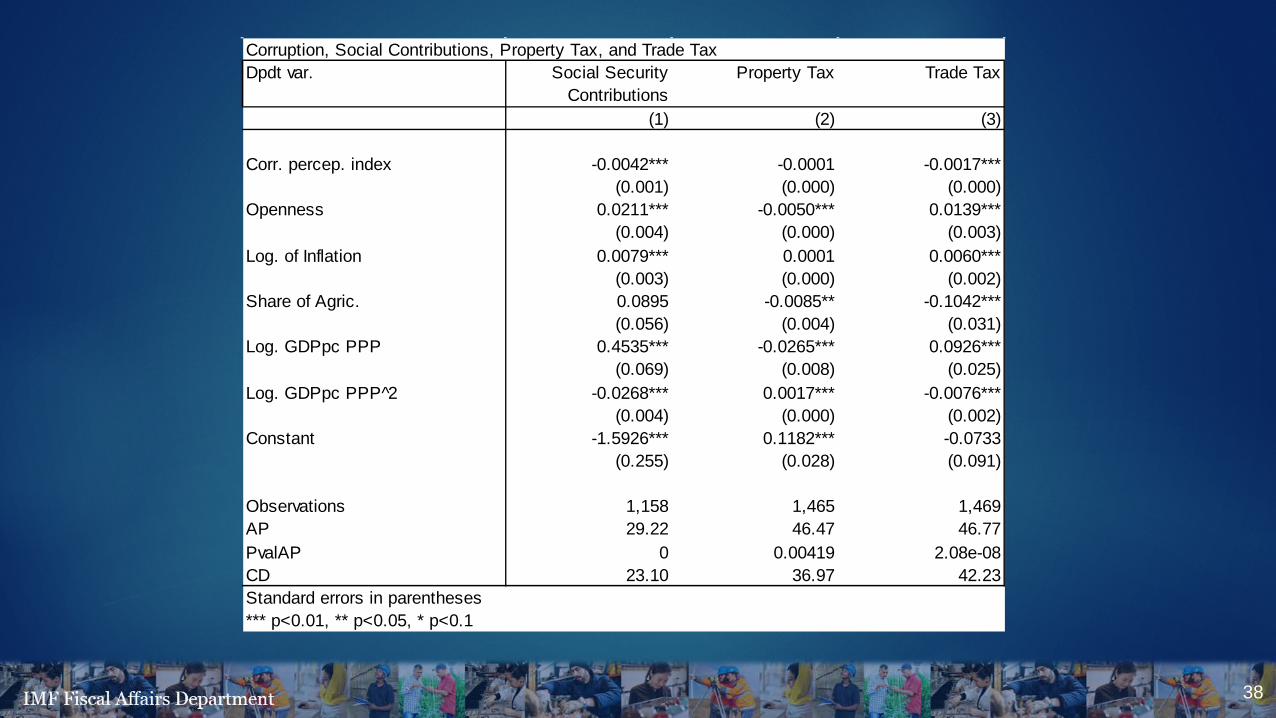
Corruption, Social Contributions, Property Tax, and Trade TaxDpdt var. Social Security
ContributionsProperty Tax Trade Tax
(1) (2) (3)
Corr. percep. index -0.0042*** -0.0001 -0.0017***(0.001) (0.000) (0.000)
Openness 0.0211*** -0.0050*** 0.0139***(0.004) (0.000) (0.003)
Log. of Inflation 0.0079*** 0.0001 0.0060***(0.003) (0.000) (0.002)
Share of Agric. 0.0895 -0.0085** -0.1042***(0.056) (0.004) (0.031)
Log. GDPpc PPP 0.4535*** -0.0265*** 0.0926***(0.069) (0.008) (0.025)
Log. GDPpc PPP 2̂ -0.0268*** 0.0017*** -0.0076***(0.004) (0.000) (0.002)
Constant -1.5926*** 0.1182*** -0.0733(0.255) (0.028) (0.091)
Observations 1,158 1,465 1,469AP 29.22 46.47 46.77PvalAP 0 0.00419 2.08e-08CD 23.10 36.97 42.23Standard errors in parentheses*** p<0.01, ** p<0.05, * p<0.1