corrosion of materials by liquid nak coolant in a … of materials by liquid nak coolant ......
TRANSCRIPT

Corrosion of Materials by Liquid NaK Coolantin a Nuclear Power System
J. Zhang,* R. Kapernick, and T. F. Marcille
Los Alamos National Laboratory, International Nuclear System Engineering Group, MS K-575Los Alamos, New Mexico 87545
Received May 24, 2007Accepted January 12, 2008
Abstract – Corrosion of the primary coolant structural materials in a nuclear power system is a potentialconcern when liquid metal is used as the coolant. For the current space reactor design, liquid sodium-potassium eutectic (NaK) has been selected as a candidate for the primary coolant and stainless steel asthe structural material, so whether or not corrosion is a problem for this system must be determined. Thispaper documents a first step to understanding the extent of corrosion in the selected candidate design.Data available in the literature have been compiled and are analyzed, factors affecting corrosion areassessed, and a theoretical basis of the corrosion mechanisms by liquid metals is presented. This studyprovides some useful information for the design of NaK coolant systems and some recommendations forwhat additional experimental and theoretical work is needed to understand the corrosion mechanisms andlimitations of using NaK as a primary coolant.
I. INTRODUCTION
Corrosion of structural materials by liquid-metal cool-ants such as sodium, lead, bismuth, potassium, and theiralloys is an important concern and potential limitation intheir use in nuclear power systems. Studies have shownthat corrosion by liquid metal can be a physical or achemical process, or both. When steel is exposed to liq-uid metal, some of its constituents can dissolve into theliquid and may or may not react with the impurities inthe liquid. Also, the liquid can penetrate into the steelalong the grain boundaries or other defects, which changesthe microstructure, composition, and surface morphol-ogy and thus the properties of the material to some depthinto the material. Such changes can become significantwith time and may eventually lead to material failure.
Recently, liquid sodium-potassium alloy ~NaK!,which had been used as the coolant in the EBR-I andSNAP-8 reactors, has been selected as a candidate cool-ant for a next-generation space reactor because of its lowmelting point and relatively high heat transfer capacity.Compared with liquid sodium, which has been used as acoolant in many terrestrial fast breeder reactors, studies
on corrosion by liquid NaK are not plentiful, and most ofthem for its use as a nuclear reactor coolant were carriedout prior to 1970. Despite these shortcomings, we havecompiled and assessed available data and studies to pro-vide some understanding of the corrosion by NaK and todetermine what further experiments and studies areneeded to answer this concern.
II. LIQUID-METAL CORROSION MECHANISM
Compared to corrosion by aqueous media, whichhas been found to be primarily an electro-chemical pro-cess, corrosion by liquid metal is a physical or physical-chemical process involving the dissolution of materialconstituents into the coolant, transportation of these con-stituents in the liquid and solid phases, and reactionsbetween the corrosion products and impurities. The cor-rosion can be described in terms of the thermodynamicsand kinetics of the several interactions that lead to trans-port of the corrosion products into and through the liquid-metal medium. The driving forces for such corrosionmechanisms are states of nonequilibria such as the solu-bility of metals and nonmetals in the liquid and their*E-mail: [email protected]
NUCLEAR SCIENCE AND ENGINEERING: 160, 75–97 ~2008!
75

interactions both in the liquid and solid surfaces in con-tact with the liquid metal.1 The corrosion types and mech-anisms of liquid-metal corrosion are shown briefly inFig. 1 and described below.
II.A. Solution Corrosion
The driving force for solution corrosion is the chem-ical potential for dissolution of solid surfaces in contactwith the liquid. It can be simply expressed by
A ~solid metal!b A ~in liquid metal! .
Solution corrosion is primarily a function of the solubil-ity of the solid in the liquid, which is a function of tem-perature. The dissolution process of solid metal willcontinue until the chemical potential of the dissolvedsolid metal has the same chemical potential in the twophases. The corrosion rate by this mechanism dependson both the dissolution rate at the liquid-solid interfaceand the transport rate in the liquid.
There are several types of solution-corrosion pro-cesses, as shown in Fig. 1. Uniform solution corrosion isan even rate of surface recession with a complete lack ofsubsurface effects.2 It occurs only in high-purity elemen-tal materials and is quite rare in practice. Intergranularsolution corrosion is much more common in engineeringpractice. It occurs in the deposited phases at the grainboundaries in the material, which are much less resistantto the liquid metal than the grain body.2 Further, if the
dissolution rates in various crystal directions are differ-ent, crystalline facets are expected to be developed.3
For alloy or steel materials, there will be a leachingsolution corrosion that results from the selective disso-lution of the alloy constituents. The leaching solutioncorrosion has been described as a combination of disso-lution and chemical reaction mechanisms. It removesalloy constituents at various rates, which results in a com-position change of the surface layer. If the layer contin-ues to develop and the removal of the alloy constituentsexceeds a specific minimum threshold level, the layerwill become a new phase layer.4 For example, a ferritelayer has been observed on Type 316 stainless steel~SS316! after being exposed to liquid sodium.5
Stress corrosion is another important concern inliquid-metal corrosion. The combination of the dissolu-tion and mechanical stress can cause cracking of the ma-terials, which has been observed at bends in a liquidsodium-potassium ~NaK! loop.6
Solution corrosion results in weight loss, surface re-cession, and phase changes and in the potential for thedevelopment of cracks and cracking propagation and con-tamination of the liquid. All of these phenomena are po-tentially serious problems for materials in liquid-metalsystems. For example, decarburization resulting from theloss of carbon from low-alloy steel by liquid sodiumcauses significant property changes of the steel at theoperation temperature for short times, which may lead tomechanical failure of the components containing theliquid-metal coolant.
Fig. 1. Corrosion types and mechanisms of liquid-metal corrosion.
76 ZHANG, KAPERNICK, and MARCILLE
NUCLEAR SCIENCE AND ENGINEERING VOL. 160 SEP. 2008

II.B. Penetration Corrosion
Penetration corrosion results from the diffusion ofliquid metal into the material lattice. It can proceed uni-formly or intergranularly. The intergranular penetrationcan be accelerated in austenitic stainless steels becauseof sensitization. The austenitic steel becomes sensitizedwhen chromium and carbon combine to form chromiumcarbide, which is subsequently precipitated in the grainboundaries. Therefore, sensitization is a function of theactivity and distribution of carbon and chromium, andsome evidence indicates that sensitization occurs morereadily in carbon-contaminated sodium than in othermedia.7
Penetration of liquid metal into the material dependsin part on the surface tension. It occurs when the grainboundary interfacial energy is greater than twice the solid-liquid interfacial energy.8 If the material is stressed, pen-etration may occur when liquid lowers the surface energyof the solid. The liquid penetrates into the solid throughvarious paths: grain boundaries, specific crystallographicdirection, vacancies and pores, formed defects, etc. Theliquid penetrates into the solid metal in the areas wheredefects reach the surface, and then the corrosion frontmoves along grain boundaries or defects. The impuritiesin the liquid diffuse into the solid materials, and the im-purities in the solid diffuse into the liquid, resulting inthe impurities’ redistribution in the two phases. The dif-fusion direction of the impurities can be determined fromthe coefficients of equilibrium distribution.9
Penetration corrosion may result in phase transfor-mation and new phase formation. The inward diffusionof liquid-metal atoms and their interactions with one ormore of the alloy components result in intermetallic com-pounds that can precipitate on the surface. Because pen-etration is generally coupled with chemical reactions dueto the impurities in the two phases, complex compoundsare formed within the limits of the grain boundaries.Impurities such as oxygen and carbon are redistributedbecause of their different chemical potentials in the twophases.
II.C. Chemical Corrosion
Chemical corrosion results from reactions betweenthe materials of construction and the impurities in theliquid metal. Given that some level of impurities gener-ally exists, chemical corrosion is very common. It pro-duces simple or complex corrosion products on the solidmaterial surface or in the liquid that may stimulate orsuppress interaction. The products may be soluble, looselyor tightly adherent, and affect the net corrosion rate. Sim-ilar to penetration corrosion, chemical corrosion can leadto interstitial impurities’ redistribution or partition of theimpurities between the liquid solid materials. It can alsoresult in chemical compound formation, surface layerdeposition, and particle formation in the liquid.
II.D. Mass Transfer
In a static system, mass transfer is due to diffusiononly, whereas in a flowing system, mass transfer is dueto both convection and diffusion. Further, deposition ofthe corrosion products, reactants, and the impuritiesin the coolant may happen during the transport through-out the loop by the liquid-metal coolant. Mass transferin liquid-metal systems has been categorized into twotypes:10 dissimilar-metal mass transfer or active gradi-ent mass transfer and thermal gradient mass transfer ortemperature gradient mass transfer.
Dissimilar-metal mass transfer can occur in bothisothermal and nonisothermal systems. The driving forcefor this mass transfer is the thermodynamic requirementthat the chemical potential of each element should beequivalent in all phases; i.e., the free energy of thesystem approaches its minimum value through the al-loying of different metals. Such mass transfer can bedescribed briefly by the following: Atoms of metal Adissolve into the liquid metal and are carried by theliquid metal to the surface of metal B where the atomsof A come out the solution, alloy with metal B, anddiffuse into metal B. It has been shown that such masstransfer becomes increasingly important as the systemtemperature increases and occurs in a system built ofdifferent materials.
Thermal gradient mass transfer can occur onlyin nonisothermal systems ~by definition!. The drivingforce of this type of mass transfer is the difference inthe solubility of the corrosion products in the high-and low-temperature sections of the system. The corro-sion products enter into the liquid at the high-temperaturesection and are transported to a low-temperaturesection, where they come out of the liquid. Com-pared to dissimilar-metal mass transfer, there isno alloying process, and the precipitates can remainsuspended in the liquid as particles or deposited on thesurfaces.
Because most engineering systems are nonisother-mal and the construction materials are steel or other al-loyed materials, the overall mass transfer is generallycaused by both dissimilar-metal and thermal gradient masstransfer.
III. FACTORS AFFECTINGLIQUID-METAL CORROSION
As discussed above, liquid-metal corrosion involvesthree processes: interactions between the liquid and solidat the solid surface and transport of corrosion products0impurities in the liquid, and transport in the solid. Fac-tors affecting these three processes are divided into threegroups: environmental, metallurgical, and technological,as shown in Fig. 2.
CORROSION BY NaK COOLANT 77
NUCLEAR SCIENCE AND ENGINEERING VOL. 160 SEP. 2008

III.A. Environmental Factors
Liquid-metal environmental conditions include sys-tem temperatures, liquid-metal composition, flow condi-tions, and the flow path geometry structures. Temperaturesthroughout the loop affect dissolution0chemical reactionrates, corrosion product diffusion in both solid and liq-uid, and liquid-metal properties such as viscosity anddensity. Increasing temperature results in higher disso-lution rates, higher solubility, higher diffusion coeffi-cients, and smaller viscosities and thus leads to a highercorrosion rate.
In an isothermal loop, if there is only concentrationgradient mass transfer, species concentrations eventu-ally reach an equilibrium distribution, at which point nofurther corrosion occurs. Sustained corrosion can occuronly in a nonisothermal system. With temperature gradi-ents, elements in the steel will be dissolved in the hotsections, transported to locations with lower tempera-tures, and precipitate. It has been shown that as the tem-perature difference through the loop increases, corrosionin hot sections of the loop becomes more severe. Greaterprecipitation in colder areas can accelerate corrosion inthe hot sections and may become the controlling step forthe corrosion in a nonisothermal system.
For different liquid metals and0or alloys, the thermo-dynamics can be quite different. So the corrosion rate isalso affected by the liquid-metal composition, includingits impurities. For example, liquid lead and lead-bismuthare more corrosive than sodium. However, the presenceof oxygen in lead and lead-bismuth may result in a pro-tective oxide layer on the material surface, while theoxygen in liquid sodium can accelerate the corrosionsignificantly.
The flow condition ~principally flow velocity! is an-other important environmental factor that affects the cor-rosion rate. In a flowing system, although mass transferbetween the coolant and solid surface takes place byboth diffusion and convection, it is convection that dom-inates the transport because convection is much fasterthan species diffusion. However, the corrosion rate be-comes independent of the velocity if the velocity is highenough. Experimental results from liquid sodium loopshave shown that the corrosion rate in the hot leg is al-most proportional to the flow velocity when the velocityis not too high and is independent of the velocity if thevelocity exceeds a critical value. It appears that the crit-ical value is in the range of 3 to 4.5 m0s ~Ref. 11!.
In a nonisothermal liquid-metal system, the corro-sion rate is also affected by loop geometry such as the
Fig. 2. Factors affecting liquid-metal corrosion.
78 ZHANG, KAPERNICK, and MARCILLE
NUCLEAR SCIENCE AND ENGINEERING VOL. 160 SEP. 2008

flow path geometry structure. It has been reported thatthe corrosion0precipitation profile in a nonisothermallead-bismuth loop depends on the loop length, hydraulicdiameter, and flow path geometries.12 Also, the numberof different types of materials and their surface areas,temperatures, and local flow conditions have to be takeninto account because of dissimilar-metal mass transfereffects.
III.B. Metallurgical Factors
Metallurgical factors include the composition andmicrostructure of the materials and their impurities. Dif-ferent material constituents have different mobilities andsolubilities in the liquid, resulting in different leachingrates. It has been shown that Ni and Cr in stainless steelhave high initial leaching rates in a sodium loop. Micro-structure is important because it affects greatly the prop-erties of the materials, diffusion rates of the corrosionspecies in the materials, and liquid-metal penetration intothe material.
The structural material compositions of the systemalso affect the transport of impurities in the liquid. Forexample, oxygen concentration is almost a constant in asodium loop made of pure iron, while it is a function oflocation in a sodium loop made of steel.13
One method for improving the anticorrosion proper-ties of a material is by alloying the materials to form thethermodynamically stable interstitial phases. The alloy-ing can also increase the creep strength of the materials.
The presence of impurities such as oxygen and car-bon in the structural materials has also been found toenhance corrosion. The impurities can promote liquid-metal penetration into the material as well as phasedeposition.
III.C. Technological Factors
Technological factors include the stress state, newphase formation due to machining, welding, assemblingof structure, and surface conditions. Experimental expe-rience in a NaK loop indicates that the crack formationat a bend is due to its external stress.6 Therefore, thestress state has to be taken into account when operating aliquid-metal system. The surface condition of the struc-tural materials also affects the corrosion rate. Throughdeposition of a protective layer, the anticorrosion prop-erties can be significantly improved. If the new phaseformed during the technological process has less corro-sion resistance, obviously, the corrosion rate of the ma-terials is increased.
IV. SOLUBILITY DATA
Although most common nonmetals and metals havelow solubility in liquid sodium and NaK, it has been
recognized that solubility plays an important role in cor-rosion by liquid sodium and NaK. Generally, solubilitycan be expressed as a function of temperature:
log Si ~ppm! � A �B
T ~K!, ~1!
where
S � solubility of species i in the liquid at temper-ature T
A, B � constants.
IV.A. Solubility of Nonmetals
The solubility of oxygen in liquid sodium has beendetermined by several authors. The solubility data weresummarized in the book by Borgstedt and Mathews.14
The authors recommended the solubility equation devel-oped by Eichelberger15:
log SO ~ppm! � 6.239 �2447
T ~K!, ~2!
in the temperature range 373 to 828 K in sodium. Thesolubility of oxygen in liquid potassium is much higherthan in sodium. Based on Williams, Grand, and Miller’sdata16 in the temperature range 338 to 783 K, Sreedha-ran and Gnanamoorthy17 developed the following corre-lation for the solubility of oxygen in liquid potassium:
log SO ~ppm! � 5.3015 �876
T ~K!. ~3!
Using a vacuum distillation technique, Ganesan, Adel-helm, and Borgstedt18 reported a lower oxygen solubil-ity in potassium in the temperature range 323 to 473 K.The constants in Eq. ~1! are A � 4.1012 and B � �774.3.Krishnamurthy et al.19 reported that the constants areA � 3.9702 and B � �420.4 in the temperature range343 to 675 K.
There are few data on oxygen solubility in liquidNaK. Krishnamurthy et al.20 developed a correlation forNaK ~55 wt% K! in the temperature range 333 to 703 K:
log SO ~ppm! � 4.8480 �1101.11
T ~K!, ~4!
and Sakai et al.21 developed a correlation for NaK ~78wt% K! in the temperature range 363 to 483 K:
log SO ~ppm! � 7.09 �2795
T ~K!. ~5!
Figure 3 shows curves of the oxygen solubility as afunction of temperature. The figure indicates that thesolubility of oxygen in liquid sodium and NaK is much
CORROSION BY NaK COOLANT 79
NUCLEAR SCIENCE AND ENGINEERING VOL. 160 SEP. 2008

less than that in liquid potassium. The solubility in NaK~78 wt% K! is almost the same as that in sodium. Krish-namurthy et al.20 concluded that the closeness in the sol-ubility curves was due to the container being made ofstainless steel, which lowers the solubility of oxygen inNaK. Based on this, one can use a cold trap method topurify the NaK in a system made of stainless steel.
To study the effect of the fraction of potassium on ox-ygen solubility in a liquid sodium-potassium alloy, Krish-namurthy et al.20 carried out solubility measurements fora range of potassium fractions at a temperature of 473 K.The data are shown in Fig. 4. The solubility increases withthe potassium fraction when the fraction is,40 wt%, butwhen the fraction exceeds 40 wt%, the solubility is al-most constant. Using Eq. ~3!, the solubility in pure potas-sium at 473 K is;2815 ppm, which is much higher thanthat in NaK, even for NaK-78 wt% K, which indicates thatthe oxygen properties in NaK are more similar to that inliquid sodium rather than that in liquid potassium.
Carbon and nitrogen are the other two important spe-cies in the liquid that affect corrosion. No experimentalcorrelation was found for the solubility of carbon andnitrogen in NaK. For carbon in sodium, it is recommendthat the correlation developed by Ainsley et al.22 beused, which was also recommended by Borgstedt andMathews14:
log SC ~ppm! � 7.646 �5790
T ~K!. ~6!
As shown in Fig. 3, the solubility of carbon in sodium ismuch lower than that of oxygen at the same temperature.
The solubility of nitrogen in sodium is extremelylow. The following correlation is recommended by Borg-stedt and Mathews14:
log SN ~ppm! � �7.17 �2780
T ~K!. ~7!
IV.B. Solubility of Metals
The solubility of the main constituents of steel suchas the iron, nickel, and chrome in liquid sodium andpotassium has been studied extensively and summarizedin a handbook.23 However, the solubility of iron in so-dium is scattered, and there has been little effort to studythe solubility of these metals in liquid NaK. As recom-mended in Ref. 14, the following correlations areproposed:
log SFe, Na ~ppm! � 4.720 �4166
T ~K!~8!
for iron in the sodium in the temperature range 658 to997 K,
log SFe, K ~ppm! � 8.193 �6166
T ~K!~9!
for iron in potassium in the temperature range 900 to1200 K,
log SNi, Na ~ppm! � 2.07 �1570
T ~K!~10!
Fig. 3. Oxygen solubility in liquid sodium, potassium, andNaK and carbon concentration in sodium. 1: Oxygen solubilityin potassium, Eq. ~3!. 2: Oxygen solubility in NaK ~55 wt% K!,Eq. ~4!. 3: Oxygen solubility in sodium, Eq. ~2!. 4: Oxygensolubility in NaK ~78 wt% K!, Eq. ~5!. 5: Carbon solubility insodium, Eq. ~6!.
Fig. 4. Oxygen solubility in NaK as a function of potas-sium fraction.
80 ZHANG, KAPERNICK, and MARCILLE
NUCLEAR SCIENCE AND ENGINEERING VOL. 160 SEP. 2008

for nickel in sodium in the temperature range 573 to1173 K,
log SNi, K ~ppm! � 3.89 �3040
T ~K!~11!
for nickel in potassium in the temperature range 941 to1328 K,
log SCr, Na ~ppm! � 9.35 �9010
T ~K!~12!
for chromium in sodium in the temperature range 948 to1198 K, and
log SCf, K ~ppm! � 4.158 �4130
T ~K!~13!
for chromium in potassium in the temperature range 1000to 1300 K.
There are no correlations for the solubility of Fe, Ni,and Cr in liquid NaK. Data were found from only oneexperiment24 on the solubility of Fe in liquid NaK ~68mol% K!. The solubility at 973 K was measured to be15 ppm. In the absence of data, the following correlationis proposed:
Si,NaK �Si,Na Si,K
Si,Na MK � Si,K MNa
, ~14!
where MNa and MK are the mole fractions in the NaKeutectic. Equation ~14! has the same form as that used tocalculate the NaK physical properties such as the densityand viscosity based on the properties of Na and K~Ref. 11!. Using Eq. ~14!, the solubility of Fe in NaK ~68mol% K! at 973 K is calculated to be 8.8 ppm, which is
believed to agree well with the experimental results~15 ppm! considering that there are many uncertainties.The recommended solubility curves for Fe, Cr, and Ni inliquid sodium and potassium, and the estimated solubil-ity curves for Fe, Cr, and Ni employing Eq. ~14! areshown in Fig. 5. From these curves, iron is the mostsoluble element, while chromium has the highest corro-sion resistance.
V. EXPERIMENTAL RESULTS OF STAINLESSSTEEL IN LIQUID NaK
Liquid NaK was selected as the coolant for the SNAPreactor systems. As part of the SNAP reactor design ef-forts, experiments for the corrosion of the SNAP struc-tural materials by liquid NaK were conducted by manyresearchers. However, it has proved difficult to analyzeor compare these data, not only because the test condi-tions are very different and the test results are very scat-tered but also because critical information on the testconditions is often missing. In the present discussion, wefocus on the experimental results on stainless steels, whichare often used as the construction materials for nuclearreactor systems. The compositions of the stainless steelsconsidered are shown in Table I, including two nickelsteels for comparison.
Before the 1950s, most of the experiments on NaKcorrosion were carried out in static ~no flow! capsules,as discussed in a report by Kelman, Wilkinson, and Yag-gee.25 The experimental data on stainless steel, all takenfrom Kelman, Wilkinson, and Yaggee’s report, are shownin Table II. As the data in Table II indicate, all the stain-less steels that were considered displayed good perfor-mance in a NaK environment up to a temperature of
TABLE I
Compositions of Steels Considered in the Present Study
Steel Type Cr Ni C Mn Si P S
SS302 17–19 8–10 0.15a 2a 2–3 0.045a 0.03a
SS303 17–19 8–10 0.15a 2a 1a 0.2a 0.15a 0.6Mo or 0.6Zr,0.15SeSS310 24–26 19–22 0.25a 2a 1.5a 0.045a 0.03a
SS304 18–20 8–12 0.08a 2a 1a 0.045a 0.03a
SS316 16–18 10–14 0.08a 2a 1a 0.045a 0.03a Mo 2–3SS318SS321 17–19 9–12 0.08a 2a 1a 0.045a 0.03a 5xC minSS347 17–19 9–13 0.08a 2a 1a 0.045a 0.03a Cb � Ta 10xC minSS430 11.5–13 — 0.12a 1a 1a 0.04a 0.03a
Croloy 9M 8–10 — 0.15a 0.6a 1.0a 0.03 0.03 0.9–1.10 Mo
Hastelloy N 7 Base 0.08a 0.08a 1a 0.02 0.02 16 Mo 0.2a Co 0.5W 0.35 CuHastelloy C 22 Base 0.01 0.05a 0.08a — — 2.5 Co, 0.35 V, 3.0W
aThe maximal weight percent.
CORROSION BY NaK COOLANT 81
NUCLEAR SCIENCE AND ENGINEERING VOL. 160 SEP. 2008

7608C. Even at a temperature of 8258C, there is only onecase showing a weight loss, with a corrosion rate of 25.4mm0yr. Most of the cases indicate a weight gain, attrib-uted by Kelman, Wilkinson, and Yaggee to the formationof an adherent Cr2O3 film on the sample surfaces due toa slight contamination of oxygen in the NaK. In verypure NaK, there is very small initial weight loss, whichdecreases rapidly with increasing exposure time as indi-cated by the experimental results on Type 310 stainlesssteel ~SS310! at 7608C.
Based on these pre-1950s experimental data, Kelman,Wilkinson, and Yaggee25 concluded that stainless steelsare extremely resistant to attack by NaK at temperaturesup to 7608C and possibly above. They also believed that
the attack of stainless steels by NaK is not influenced bythe presence of other metals in the same system nor dothe stainless steels influence the attack of other metalsby NaK. Further, they concluded that carburization wouldtake place if there were a carbon source in the system.
It should be noted that static experimental data can-not be applied to a flowing system, especially a noniso-thermal system. Further, the corrosion rates calculatedusing these data are very nonconservative because thecorrosion approaches zero for long-term exposures. Cal-culating the recession rate based on weight loss is alsomisleading because the calculation is based on the as-sumption that the weight loss is due to uniform recessionof the surface. In reality, the attack layer will be thicker
Fig. 5. Curves of solubility of Fe, Cr, and Ni. ~a!, ~b!, and ~c! 1, solubility in potassium; 2, solubility in NaK ~78 wt% K!;3, solubility in sodium. ~d! Calculated results of the comparison between solubility in NaK ~78% K!.
82 ZHANG, KAPERNICK, and MARCILLE
NUCLEAR SCIENCE AND ENGINEERING VOL. 160 SEP. 2008

TABLE II
Experimental Data on NaK Corrosion Before 1950s
Weight Change ~mg0mm2{yr�1 ! Recession
Steel TypeNa in NaK~wt%!
Temperature~8C!
Time~h! Range Average mil0yr mm0yr Description
SS302 56 200 144 �0.1 �0.3 �0.2 0.10 2.5 Static56 600 144 �1.0 �0.1 �0.3 Gain Gain Static
SS303 56 640 144 — — �0.4 0.25 6.4 Static
SS304 100 500 168 Nil �0.34 �0.2 Gain Gain Static100 538 500 �0.5 �0.5 �0.05 Gain Gain Flow100 650 165 — — �2.0 Gain Gain Static
0 760 500 — — �5.0 Gain Gain Static20 760 200 �2.7 �1.9 �0.1 0.60 15.2 Static20 760 500 Nil �0.1 Nil Gain Gain Static20 760 1000 Nil Nil Nil Nil Nil Static56 825 100 — — �0.59 Gain Gain Static56 825 500 — — �1.0 1.0 25.4 Static
SS316 100 500 170 Nil �0.16 �0.1 Gain Gain Static36 538 500 Nil Nil Nil Nil Nil Flow56 650 144 — — �0.7 Gain Gain Static
100 760 165 — — �1.5 Gain Gain Static20 760 200 �0.2 �0.3 �0.3 0.2 5.0 Static20 760 500 �0.1 �0.1 �0.1 0.05 1.3 Static20 760 1000 Nil Nil Nil Nil Nil Static
SS318 20 760 200 �0.14 �0.18 �0.18 Gain Gain Static20 760 500 �0.5 �0.5 �0.5 Gain Gain Static20 760 1000 Nil Nil Nil Nil Nil Static
SS321 20 538 200 — — �0.3 0.50 12.7 Static
SS347 56 200 144 �0.4 �0.4 Nil Gain Gain Static56 450 4370 Nil �0.23 �0.04 Gain Gain Flow22 450 2100 — — �0.01 — — Static
100 500 800 �0.07 �0.21 �1.0 Gain Gain Static100 500 750 �0.04 �0.35 �0.02 Gain Gain Static
34 538 500 �0.4 �1.7 �0.2 Gain Gain Flow56 600 144 Nil �0.4 �0.1 Gain Gain Static22 600 144 — — �1.1 — — Static
100 650 165 — — �2.0 — — Static20 760 200 �0.7 �0.5 �0.3 Gain Gain Static20 760 500 �0.5 �0.5 �0.5 Gain Gain Static20 760 1000 �0.1 �0.1 �0.1 Gain Gain Static
SS310 100 538 500 �0.17 �2.60 �1.4 Gain Gain Flow20 589 3000 �0.01 �0.057 �0.013 Gain Gain Flow54 600 144 — — �0.6 Gain Gain Static
100 650 145 — — �2.0 Gain Gain Static20 760 50 — — �1.6 1.0 25.4 Static20 760 200 — — �1.3 0.75 19.05 Static20 760 500 Nil �0.5 �0.3 0.20 5.08 Static20 760 1000 — — �0.4 0.23 5.8 Static20 760 1500 �0.3 �0.4 �0.4 0.20 5.08 Static20 760 5000 — — Nil Nil Nil Static56 825 100 — — Nil Nil Nil Static56 825 500 — — �2.0 Gain Gain Static20 571 200 — — �0.3 0.2 5.08 Static
SS430 56 600 144 — — Nil Gain Gain Static56 600 144 — — �3.7 Gain Gain Static
CORROSION BY NaK COOLANT 83
NUCLEAR SCIENCE AND ENGINEERING VOL. 160 SEP. 2008
than the calculated recession layer because of selectiveand intergranular corrosion, decarburization, and carbu-rization. All these phenomena can change the propertiesof the steel at the surface leading to materials failure.
Pratt & Whitney Aircraft has operated several NaK~56% K! loops built of SS316 to study the corrosionresistance of SS316 at different operation conditions.26,27
The test conditions and test results from the two reportsare summarized in Table III. All the tests were short-term tests, less than ;500 h.
The type NSSA loop had very high oxygen concen-trations as indicated in Table III. The pretest oxygenlevels were in the range of 750 to 1020 ppm ~1A1! and205 to 1575 ppm ~2A2!. Recession and deposition thick-nesses were measured as well as the solution attackthickness. The attacks are characterized as sparse at-tacks. The largest recession occurred at the heater exit,where the temperature was 904.48C, the highest temper-ature in the loop. The maximum recession was abouttwo times larger in 1A1 ~which had a longer test dura-tion! than in 2A2. The largest deposition ~71.12 mm! in1A1 occurred at the cooler midsection, and the largestdeposition ~15.2 mm! in 2A2 occurred at the end of thecooler. The largest solution attack thickness in 1A1 was38.1 mm and occurred at the entrance of the cooler,and the largest solution attack thickness in 2A2 was25.4 mm and occurred at the heater hot isothermal sec-tion. The differences between the results from 1A1 and2A2 were attributed to the different oxygen concentra-tions and exposure times. It is expected that the oxygenin the NaK played an important role in the experimen-tal results.
Compared with the NSSA loop, the NSSB loop hadtwo separated heater sections, a higher coolant velocityat the heater, and a lower oxygen concentration as indi-cated in Table III. The NSSB-1A1 test was run for 353 h,and the NSSB-3A3 test was run for 459.5 h. A sigmaphase was observed along the loop, and no deposits werefound. There was no apparent solution attack. For 1A1the attack is characterized by surface voids, while for3A3, the attack is characterized by pitting, except at thelocation downstream of the tank. The 1A1 loop had thelargest attack thickness ~101.6 mm! after the surge tank,while at the same location in the 3A3 loop, the attackthickness ~2.54 mm! was the smallest in the loop. In the3A3 loop, the largest attack thickness was 20.3 mm andoccurred at the second heater exit and at the cooler. Thedata from the two NSSB loops are very scattered as shownin Table III.
The NSSC loop had the lowest oxygen concentra-tion ~,100 ppm! and the highest temperature differenceamong the three loops ~NSSA, NSSB, and NSSC!. Thereport27 on the corrosion results from NSSC is a sum-mary, and there is no detailed information on the loopand results. However, it was reported that the solutionattack at the hot isothermal section was up to 2.54 mmand the thickness at the cooler zone was up to 25.4 mm.
The heaviest deposition occurred at the cooler exit. Pre-test and post-test analysis on the chemistry compositionsof the steel at the isothermal hot and cold zones revealeda significant loss of chromium, molybdenum, carbon,and nitrogen in the hot zone. A slight decrease in car-bon and nitrogen and a slight increase of molybdenumwere also found in the cold zone.
Two experimental loops were built by Atomics In-ternational.2,28 One loop had a maximum temperature of7608C, and the other had a maximum temperature of6508C. For both loops, the temperature difference in theloop was 658C. The oxygen concentrations were verylow ~,20 ppm!, and the flow velocity was low ~;0.03m0s!. The test durations were several thousand hours.The liquid was 78% K NaK.
Table IV summarizes the test conditions and results.Table IV indicates that there were no significant differ-ences in corrosion attack among the three types of steels.Intergranular0general corrosion and pitting were re-ported at both temperatures. Decarburization was ob-served in the tests at 7608C.
A view of the microstructure of Type 304 stainlesssteel ~SS304! samples tested at 650 and 7608C is givenin Fig. 6 for comparison. At 6508C, the corrosion ap-pears to be primarily intergranular in nature and has alight colored second phase that often appears at the rootof the penetration.2 At 7608C, the corrosion appears tobe more general in nature, and leaching is evident. It wasalso reported that the specimen at 6508C showed sensi-tization, while the specimen at 7608C showed carbidecoalescence.2
Long-term experiments ~up to 32 600 h! were car-ried out in an SS316 loop by Idaho Nuclear Corpora-tion.29–31 Liquid NaK ~77.2% K! was pumped in a loopwith a maximum temperature of 7608C and a minimumtemperature of 5938C. The flow velocity was 1.7 m0s,and the oxygen concentration was controlled in a rangeof 30 to 50 ppm by a cold trap. Corrosion effects wereexamined at different parts of the loop after the run. Asummary of the results is given in Table V. Results fromRef. 30 are also included in Table V.
The Idaho Nuclear Corporation results indicate thatType 318 stainless steel ~SS318!, Type 348 stainless steel~SS348!, SS304, and SS316 are suitable materials of con-struction for a nonisothermal NaK loop with a maximumtemperature of 7608C. Although there are some compo-sition changes at the surface areas exposed to NaK suchas the loss of C and Ni at the hot isothermal section,these changes do not greatly affect the material proper-ties in a way that can lead to material failure. The gen-eral corrosion depth is limited to 50.8 mm after exposurefor 32 600 h.
A sigma phase was found just below the decarburi-zation layer when the temperature was above 5938C.SS316, SS318, and SS348 appear to have more sigmaphase ~whose concentration increases with time! thanType 304L stainless steel. Carbide precipitation at the
84 ZHANG, KAPERNICK, and MARCILLE
NUCLEAR SCIENCE AND ENGINEERING VOL. 160 SEP. 2008

TABLE III
Corrosion Data of SS316 by NaK ~56% K! by Pratt & Whitney*
LoopTime~h! Location
Temperature~8C!
Solution Attack~mm!
Deposition~mm!
Recession~mm! Description
NSSA-1A1 369 Heater entrance 832.2 20.3 10.16 38.1 to 50.8 Sparse attack andmetallic deposit
Heater exit 904.4 15.24 88.9 Concentrated surfaceattack
Hot isothermal 904.4 25.4 76.2 to 88.9 Sparse attackCooler at 0.30 m 885 38.1Cooler at 0.76 m 857 10.2 71.12 Sparse attackCooler at 1.06 m 8838 22.7 10.7 Sparse attack
NSSA-2A2 515 Heater entrance 832.2 25.4 38.1 Sparse attackHeater exit 904.4 25.4 25.4 to 38.1 Sparse attackHot isothermal 904.4 25.4 25.4 to 38.1 Sparse attackCooler at 0.30 m 885 25.4 Sparse attackCooler at 0.76 m 857 7.6 Sparse pitting attackCooler at 1.06 m 838 15.2 15.2 Sparse attack metallic
deposit
NSSB-1A1 353Location
Temperature~8C!
Attack~mm!
Sigma Phase~mm!, Description
First heater entrance 832.2 20.3 Across the wall-660.4Second heater entrance 887.8 25.4 Across the wall-711.2Secondary heater exit 904.4 25.4 Across the wall-737After the surge tank 904.4 101.6 Half way across the wall-1041.0Before cooler 904.4 25.4 Across the wall-1371.6Cooler entrance 904.4 15.2 Across the wall-2108Cooler exit 832.2 17.8 Across the wall-2057
NSSB-3A3 459.5 First heater entranceo 832.2 10.2 Width-686, depth-25.4–50.8First heater exit 887.8 10.2 Width-584, depth-25.4–50.8Second heater entrance 887.8 12.7 Width-457, depth-25.4– 63.5Secondary heater exit 904.4 20.3 Width-457, depth-25.4–76.2After the surge tank 904.4 2.54 Width-1473, depth-25.4–76.2Before cooler 904.4 20.3 Width-1219, depth-12.5–72.2Middle of the cooler 871.1 20.3 Width-2083, depth-12.5–25.4Cooler exit 832.2 7.62 Width-2083
On NSSB: ~1! No apparent solution attack; ~2! no deposit; ~3! for 1A1, the attack is surface void while for 3A3, the attack is pitexcept the location after surge tank.
NSSC-1A1 500 Maximal solution corrosion at hot isothermal leg, 8718C 2.54 mmMaximal deposition thickness at cooler exit, 6498C 25.4 mm
Chemical Analysis
Ni~%!
Cr~%!
Mo~%!
C~ppm!
N~ppm!
Pretest heater 11.47 19.76 1.65 560 600Pretest cold isothermal 11.95 19.94 1.99 860 490Posttest heater 11.32 18.65 1.42 125 410Posttest cold isothermal 11.95 19.81 2.18 790 370
Deposit Chemical Analysis
Deposit weightFe~%!
Ni~%!
Cr~%!
0.06 g 4.91 32.5 47.2
*NSSA: Maximal temperature, 904.48C; temperature difference, 72.28C; flow velocity at heater, 5.79 m0s; flow velocity at cooler, 1.98 m0s; pretestoxygen, 750 to 1020 ppm ~1A1! and 305 to 1575 ppm ~2A2!; posttest, 1630 ~2A2!.
NSSB: Maximal temperature, 904.48C; temperature difference, 72.28C; flow velocity at heater, 10.66 m0s; flow velocity at cooler, 3.35 m0s; pretestoxygen, 113 to 400 ppm ~1A1! and 115 to 290 ppm ~2A2!.
NSSC: Maximal temperature, 871.18C; temperature difference, 222.28C; flow velocity at heater, 7.26 m0s; flow velocity at cooler, 4.26 m0s; oxygenconcentration, ,100 ppm.
CORROSION BY NaK COOLANT 85
NUCLEAR SCIENCE AND ENGINEERING VOL. 160 SEP. 2008

grain boundary was found. SS304 appears to have lesscarbide precipitation than SS316 and more than SS348.At welds and bends, the corrosion phenomena of thesteel seem to be similar to phenomena in pipes. Crackspropagating both transgranularly and inner-granularlywere found at 316 fittings after ;16 000 h ~Fig. 7!, butanalysis of the cracks indicates that they were not due toNaK corrosion but rather due to external stress. There-fore, the effect of external stress on material failure hasto be taken into account when designing a nonisothermalNaK loop.
Eleven experimental loops were set up at Oak RidgeNational Laboratory32 ~ORNL! to study corrosion by liq-uid NaK ~78% K! for materials in the primary coolantsystem of SNAP-8. The total length of each loop was;8.12 m. The experiments were carried out at three dif-ferent oxygen levels: ,30, ;80, and .100 ppm. Theoxygen level was controlled by a cold trap method at thebeginning, followed by a hot trap method. Specimensmade of materials proposed to be used in SNAP-8~chromized Hastelloy N, Hastelloy C, Croloy 9M, SS316,and Type 347 stainless steel ~SS347!! were installed at
TABLE IV
Corrosion of Various Stainless Steels by NaK ~78% K! by Atomics International
Loop description: Maximal temperature, 760 or 6508C; temperature difference, 658C; flow velocity, ;0.03 m0s;oxygen concentration, ,20 ppm.
Temperature 6508C Temperature 7608C
Steel TypeTime~h!
Attack~mm! Description
Attack~mm! Description
SS304 1500 No apparent attack Slight decarburization2500 35.5 Intergranular 35.6 Pitting3500 Slight general corrosion 33.0 Intergranular4500 38.1 Pitting 58.4 Decarburization
SS316a 1000 66.0 General corrosion Slight general corrosion2000 63.5 Intergranular 10.2 Decarburization3000 25.4 General corrosion 20.3 Decarburization
SS347 1500 17.8 Intergranular 15.2 Intergranular corrosion2500 50.8 General corrosion 10.2 Pitting3500 48.3 Intergranular 15.2 General corrosion4500 50.8 Pitting 63.5 Decarburization
aThe high corrosion rate for SS316 at 6508C is unknown. Excess oxygen in loop. It can be considered realistic.
Fig. 6. SS304 exposed to NaK ~78% K! for 4500 h: ~a! 6508C and ~b! 7608C.
86 ZHANG, KAPERNICK, and MARCILLE
NUCLEAR SCIENCE AND ENGINEERING VOL. 160 SEP. 2008

TABLE V
Experimental Results of Different Geometries from Idaho Nuclear Corporation
Conditions: Maximal temperature, 7608C; temperature difference, 1678C; flow velocity, 1.7 m0s; oxygen concentration, 20 to 30 ppm;fluid NaK ~77.8% K!.
Steel Type Sample Geometry Test Conditions Test Results
SS316 Pipe The sample was cut from the hot leg, was inservice for 1118 h below 5938C, and 15 174 hat ;5938C.
1. 25.4-mm depth decarburization.2. Sigma growth across the wall beyond the
decarburization layer.3. Surface composition changed.4. Carbide precipitation at the the grain
boundaries and concentration of up to 11%sigma phase.
5. Hardness changed little.
Fitting Two pipe tee connectors: ~1! 3240 h of serviceat 593 to 7608C and 360 h of service below5938C; ~2! 15 800 h of service at 593 to 7608Cand 1150 h of service below 5938C.
1. Cracks were observed in welds.2. Cracks were propagated both transgranularly
and intergranularly.
Pump Located upstream from the cold trap, 20 136 hof service at 550 to 5938C and 1295 h ofservice below 5508C.
1. 127-mm depth carburization.2. Mass deposition observed.3. Sigma phase presented.4. Chromium concentration changes along the
carburization region, 20 to 30% less than in thebased steel.
5. Nickel concentration was constant throughoutthe region and only 80% of that in the basesteel.
Pipe ~1! 1120 h of service below 6008C and15 180 h of service above 6008C. ~2! 300 h ofservice below 6008C and 16 000 h of serviceabove 6008C. ~3! 1410 h of service below6008C and 31 190 h of service above 6008C.
1. General corrosion ,50.8 mm.2. Carbon depletion and precipitation at the grain
boundary.3. Sigma phase observed, and its transformation
increases with increasing service time. Sample~3! has three times more sigma phase than thatof sample ~1!.
Pipe-elbow-pipe 4397 h of service below 5378C and 9789 h ofservice above 5378C.
1. No general corrosion.2. Carbide precipitation at the grain boundary.3. No sigma phase.4. Embrittlement results observed.
SS304 Tee fitting 261 h of service below 6008C and 15 370 h ofservice above 6008C.
1. No general corrosion.2. Carbon depletion and carbide precipitation
observed.3. Only trace quantities of sigma phase formation
in the cross section of the tee.4. Sigma phase is,1%, and carbide phase is;2%.5. The samples were ductile and not brittle.
Pipe-elbow-pipe 4397 h of service below 5378C and 9789 h ofservice above 5378C.
1. Carbide precipitation at the grain boundary, lessthan SS316 but more than SS348.
2. Trace amount of sigma phase.3. Particularly hard spot was observed.
SS348 Pipe-elbow-pipe 4397 h of service below 5378C and 9789 h ofservice above 5378C.
1. Carbide precipitation at the grain boundary.2. Appreciable concentration of sigma phase.3. Sigma phase is in the complex chromium-
nickel-columbium austenite matrix.4. Particularly hard spot was observed.5. No general corrosion.
SS318 Pipe ~low-semi elliptical! 1410 h of service below 6008C and 31190 h ofservice above 6008C
1. No carbon depletion.2. Sigma phase and embrittlement observed.3. Micro structure change.4. No general corrosion.
CORROSION BY NaK COOLANT 87
NUCLEAR SCIENCE AND ENGINEERING VOL. 160 SEP. 2008

TABLE VI
Summary of the Test Conditions and Test Results of Corrosion by NaK ~78% K! from ORNL
Loop Test Conditions
Loop Loop 1 Loop 1A Loop 2 Loop 4 Loop 5 Loop 7 Loop 8 Loop 9 Loop 10 Loop 13 Loop 14
Tmax ~8C! 758 758 760 764 758 696 703 711 707 787 787Tmin~8C! 593 568 568 574 568 582 574 576 564 574 577CO ~ppm! ,30 ,30 ;80 ,30 Unknown .100 ,30 .100 ,30 Unknown ;30H2 ~cm30h! 0 0 0 0.57 0.5 0.63 0.58 0 0 0.55 0.28Time ~h! 701 2608 2205 2683 5828 2705 2435 2476 1048 2000 2659
Samples’ Local Test Conditions
Local Temperature ~8C!
Number MaterialsLocation~m!
V~m0s! Loop 1 Loop 1A Loop 2 Loop 4 Loop 5 Loop 7 Loop 8 Loop 9 Loop 10 Loop 13 Loop 14
1 Hastelloy N 0 133 593 568.33 582 575 587 582 574 577 564 590 5932 Hastelloy N 0.597 135 649 626.67 637 633 640 620 618 621 6133 Hastelloy N 1.195 138.5 708 696.11 701 704 702 658 660 668 661 653 6524 Hastelloy N 1.652 141.5 758 758.33 760 764 758 696 703 711 708 711 7045 SS347 1.722 126 758 758.33 760 764 758 696 703 711 708 711 7046 SS316 1.898 5.5 758 758.33 760 764 758 696 703 711 708 711 7047 Croloy 9M 2.953 84.2 749 738.33 742 738 743 686 689 695 692 696 682
11 Croloy 9M 3.796 84 721 712.22 716 716 717 674 676 666 677 682 65416 SS316 3.93 82.5 698 689.44 693 693 695 658 654 652 661 666 64210 Croloy 9M 4.148 81.9 677 665.56 669 671 672 643 639 638 645 649 63115 SS316 4.289 81.5 653 642.78 646 648 649 627 624 624 629 632 618
9 Croloy 9M 4.429 81 632 619.44 622 625 627 612 609 610 613 616 6078 Croloy 9M 4.921 80.2 605 592.22 594 598 599 595 592 598 589 598 596
12 Hastelloy C 5.027 285 605 592.22 594 598 599 595 592 598 589 598 59613 SS316 5.87 420 599 587.78 586 583 591 588 585 593 582 593 58214 SS316 8.015 655 593 568.33 582 575 587 582 574 577 564 574 577
~Continued!
88Z
HA
NG
,KA
PE
RN
ICK
,andM
AR
CIL
LE
NU
CL
EA
RS
CIE
NC
EA
ND
EN
GIN
EE
RIN
GV
OL
.160S
EP.2008

Total Weight Loss ~Measured!
Weight Loss ~mg0cm2 !
Number Materials Loop 1 Loop 1A Loop 2 Loop 4 Loop 5 Loop 7 Loop 8 Loop 9 Loop 10 Loop 13 Loop 14
1 Hastelloy N 0.28 1.13 1.55 1.7 0.47 3.19 0.39 13.67 0.31 0.25 0.432 Hastelloy N �0.6 �0.24 0.23 �0.35 �1.21 0.28 �0.11 2.35 �0.143 Hastelloy N �2.17 �2.17 �2.68 �4.31 �7.33 �1.55 �0.84 �1.66 �1.08 �0.74 �0.94 Hastelloy N �4.08 �8.11 �7.91 �11.5 �20 �5.99 �2.64 �7.63 �3.08 �2.24 �2.55 SS347 �0.66 �0.97 �2.99 �5.22 �2.3 �6.28 �0.82 �35.14 �0.76 �0.97 �1.466 SS316 �0.27 �0.35 �0.98 �1.34 �0.69 �2.49 �0.18 �16.22 �0.25 �0.36 �0.347 Croloy 9M 0.2 0.32 �1.46 �3.01 �0.38 �10.24 �0.03 �104.6 0.11 �0.4 �0.13
11 Croloy 9M 0.11 0.29 �0.22 �0.46 0.89 �2.84 0.05 �33.1 �0.14 �0.16 0.0116 SS316 0.09 0.2 0.11 �0.21 0.63 �0.49 �0.33 �3.52 �0.12 0.07 0.110 Croloy 9M 0.08 0.44 0.38 0.32 1.03 �0.35 0.03 1.36 0 �0.03 0.1815 SS316 0.12 0.37 0.55 0.74 0.98 0.1 �0.37 4.08 �0.03 0.24 0.17
9 Croloy 9M 0.17 0.39 0.74 1.77 0.9 0.99 0.04 9.77 �0.07 0.07 0.278 Croloy 9M 0.04 0.38 1.44 2.38 0.77 3.99 0.05 36 0.05 0.29 0.39
12 Hastelloy C 0.93 1.16 2.64 10.49 1.5 7.94 0.44 70.3 0.57 1.27 1.1813 SS316 0.76 5.54 1.56 10.37 0.46 41.2 0.28 1.1 0.3814 SS316 0.18 0.41 2.12 1.9 0.45 8.49 0.26 24 0 0.66 0.79
Recession Rate ~Calculated!
Recession Rate ~mm0yr!
Number Materials Loop 1 Loop 1A Loop 2 Loop 4 Loop 5 Loop 7 Loop 8 Loop 9 Loop 10 Loop 13 Loop 14
1 Hastelloy N 3.94921 5.40254 6.95014 6.26468 0.7973 11.6599 1.58357 54.5869 1.53251 1.2359 1.59892 Hastelloy N �8.4626 �1.1474 1.03131 �1.2898 �2.0528 1.02344 �0.4466 9.38399 �0.69213 Hastelloy N �30.6064 �10.375 �12.017 �15.883 �12.435 �5.6655 �3.4108 �6.6287 �5.3391 �3.6582 �3.34654 Hastelloy N �57.5457 �38.774 �35.4681 �42.379 �33.93 �21.894 �10.72 �30.468 �15.226 �11.074 �9.29595 SS347 �10.3096 �4.6376 �13.407 �19.236 �3.9019 �22.954 �3.3295 �140.32 �3.7571 �4.7953 �5.42886 SS316 �4.27093 �1.6734 �4.39428 �4.938 �1.1706 �9.1013 �0.7309 �64.77 �1.2359 �1.7797 �1.26427 Croloy 9M 3.20421 1.52992 �6.54658 �11.092 �0.6447 �37.429 �0.1218 �417.69 0.54379 �1.9774 �0.4834
11 Croloy 9M 1.76232 1.38649 �0.98647 �1.6951 1.5099 �10.381 0.20302 �132.17 �0.6921 �0.791 0.0371816 SS316 1.42364 0.9562 0.49324 �0.7739 1.0688 �1.791 �1.3399 �14.056 �0.5932 0.346 0.3718410 Croloy 9M 1.28169 2.10365 1.70391 1.17923 1.7474 �1.2793 0.12181 5.43074 0 �0.1483 0.6693115 SS316 1.89819 1.76897 2.46618 2.72698 1.6626 0.36551 �1.5024 16.2922 �0.1483 1.1865 0.63212
9 Croloy 9M 2.72358 1.86459 3.31813 6.52263 1.5268 3.61858 0.16242 39.0134 �0.346 0.346 1.003968 Croloy 9M 0.64084 1.81678 6.4569 8.77055 1.3063 14.584 0.20302 143.755 0.24718 1.4336 1.45016
12 Hastelloy C 13.5136 5.54597 11.8377 38.6567 2.5447 29.0218 1.78659 280.721 2.81783 6.2783 4.3876713 SS316 3.63357 20.4155 2.6465 37.9037 1.8678 164.519 1.3842 5.4379 1.4129814 SS316 2.84729 1.96021 9.506 7.0017 0.7634 31.0321 1.05571 95.8365 0 3.2628 2.93751
CO
RR
OS
ION
BY
NaK
CO
OL
AN
T89
NU
CL
EA
RS
CIE
NC
EA
ND
EN
GIN
EE
RIN
GV
OL
.160S
EP.2008

the different locations in the test loops. A simple dia-gram of the loop32 as well as the locations of the speci-mens is shown in Fig. 8. The test conditions ~temperatures,oxygen concentrations, and flow velocities in the loop!
and measured specimen weight changes are given inTable VI. The calculated recession0deposition rates ~orcorrosion rate! based on the weight changes are alsoshown in Table VI. Considering that liquid attack maybe leaching, penetration, etc., the attack rate by the liq-uid on the materials should be greater than the recessionrate shown in Table VI. The recession rate can be treatedas a minimum estimate of the attack rate.
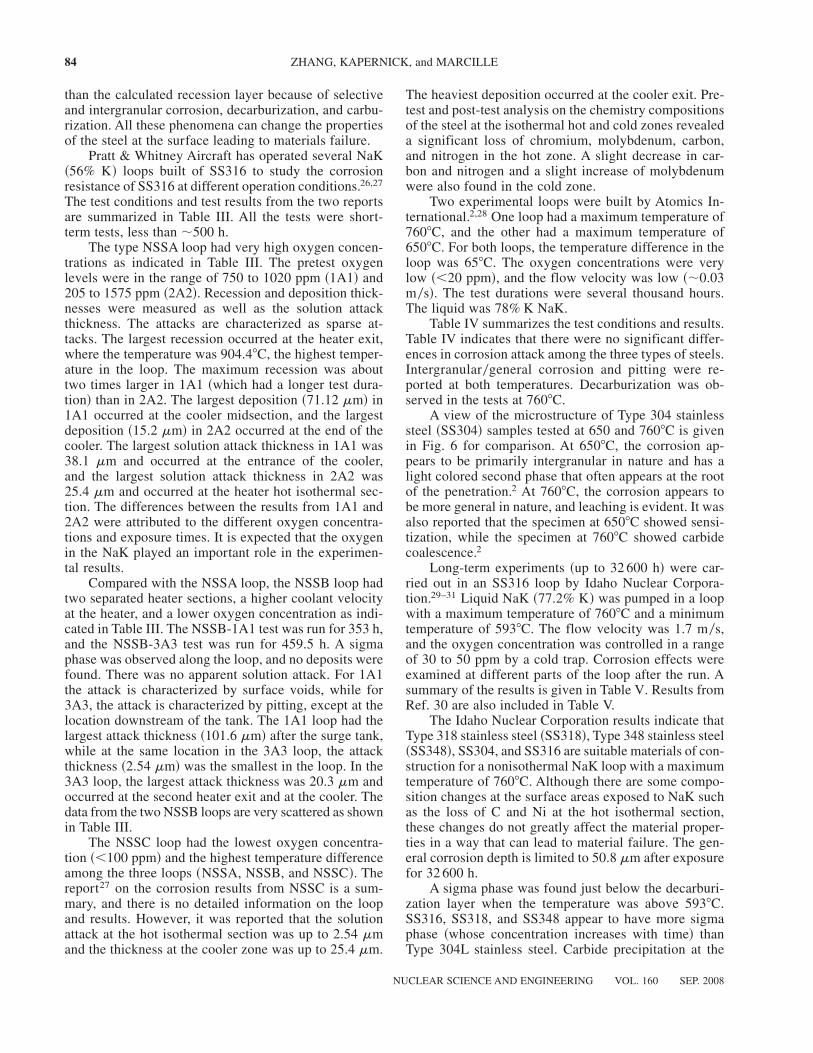
Examples of distributions of the specimens’ weightchanges around the loops ~loops 1A and 2! are shownin Fig. 9. Clearly, there was material migration fromthe hot sections to the cold sections. The migrationof metallic elements was in the form of particulatematter and diffusion alloying, while the migration ofcarbon was in the form of carburization and decarburi-zation of the materials. For a low oxygen in the loops~,30 ppm!, the migration of metallic elements wasvery low compared with carbon, which was quite se-vere. The original carbon content in Croloy 9M was;0.11% at the hot end section ~No. 7!, and it reducedto a range from ;0.002 to ;0.01% after the tests.The chromized Hastelloy N had the highest corro-sion rate, which was seven times greater than thatof SS347 and SS316. Reference 32 reports that in-creasing the oxygen concentrations from 30 ppm to;80 ppm increased the weight loss of SS316 andSS347 by a factor of 3 to 4. However, the oxygen con-centration had little effect on the corrosion rate of Hast-elloy N.
Fig. 7. Crack on inside of pipe tee connector after 15 800 h~Ref. 29!. Fine black lines indicated with arrows are grainboundaries outlined by etching. Black arrow shows the crack.
Fig. 8. Diagram of the corrosion loop in ORNL for SNAP-8. The locations of specimens in the loop were given. Thecoordinate of the specimen at the inlet of the heat was set to zero, and the coordinate increases along the streamwise direction.
90 ZHANG, KAPERNICK, and MARCILLE
NUCLEAR SCIENCE AND ENGINEERING VOL. 160 SEP. 2008
Phase identification studies indicate that carbidephases and the sigma phase develop in SS347 and SS316.Results also indicate that in SS347 the sigma phase grad-ually decomposes as carburization proceeds across thespecimen. Analysis of deposition layers indicates thatthe deposits consist mostly of nickel, chromium, and man-ganese in low-oxygen loops and are mostly iron and chro-mium in high-oxygen loops.
Adding hydrogen into the liquid has no effect on themass transfer rate for both metallic elements and carbon.Therefore, the hydrogen in the liquid has no effect on thecorrosion rate at the hot section or on the deposition rateat the cold section. It was also reported that the cold trapmethod was an effective way to control the hydrogenlevel in liquid NaK.
The weight loss given in Table VI indicates that thecorrosion rate depends on the specimen location in theloop, as well as the specimen composition. The weightloss increases with time and reaches a linear dependenceon the time for long-term operation.
VI. ANALYSIS AND DISCUSSION
As indicated in the experimental review in Sec. V,all of the experimental studies on liquid NaK corrosionwere carried out before 1970. The experimental tech-niques at that time permit only limited analysis of theexperimental results. Further, the experimental resultsare very scattered, and the experimental conditions arenot well documented. Use of these data is very limited inthe design of a liquid-metal–cooled space reactor.
VI.A. Exposure Time Effects
As noted earlier, in a nonisothermal coolant loopsuch as in a nuclear reactor, corrosion is expected tocontinue throughout the duration of operation, eventu-ally reaching a constant rate.
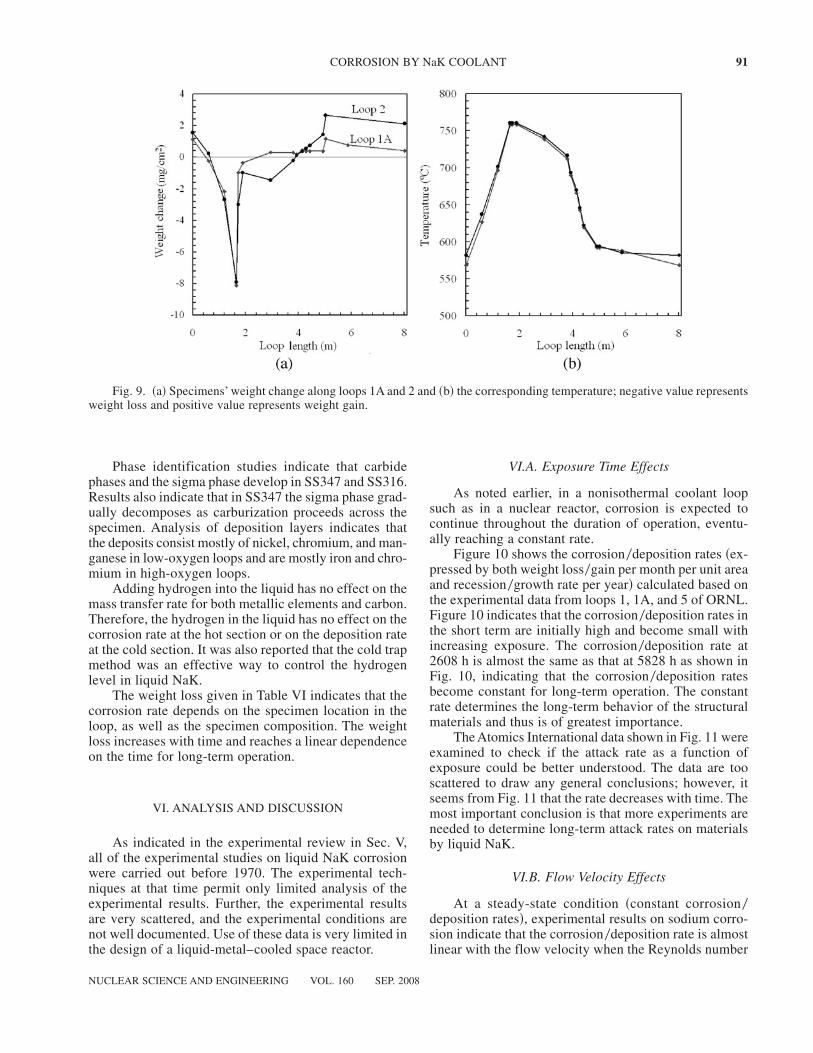
Figure 10 shows the corrosion0deposition rates ~ex-pressed by both weight loss0gain per month per unit areaand recession0growth rate per year! calculated based onthe experimental data from loops 1, 1A, and 5 of ORNL.Figure 10 indicates that the corrosion0deposition rates inthe short term are initially high and become small withincreasing exposure. The corrosion0deposition rate at2608 h is almost the same as that at 5828 h as shown inFig. 10, indicating that the corrosion0deposition ratesbecome constant for long-term operation. The constantrate determines the long-term behavior of the structuralmaterials and thus is of greatest importance.
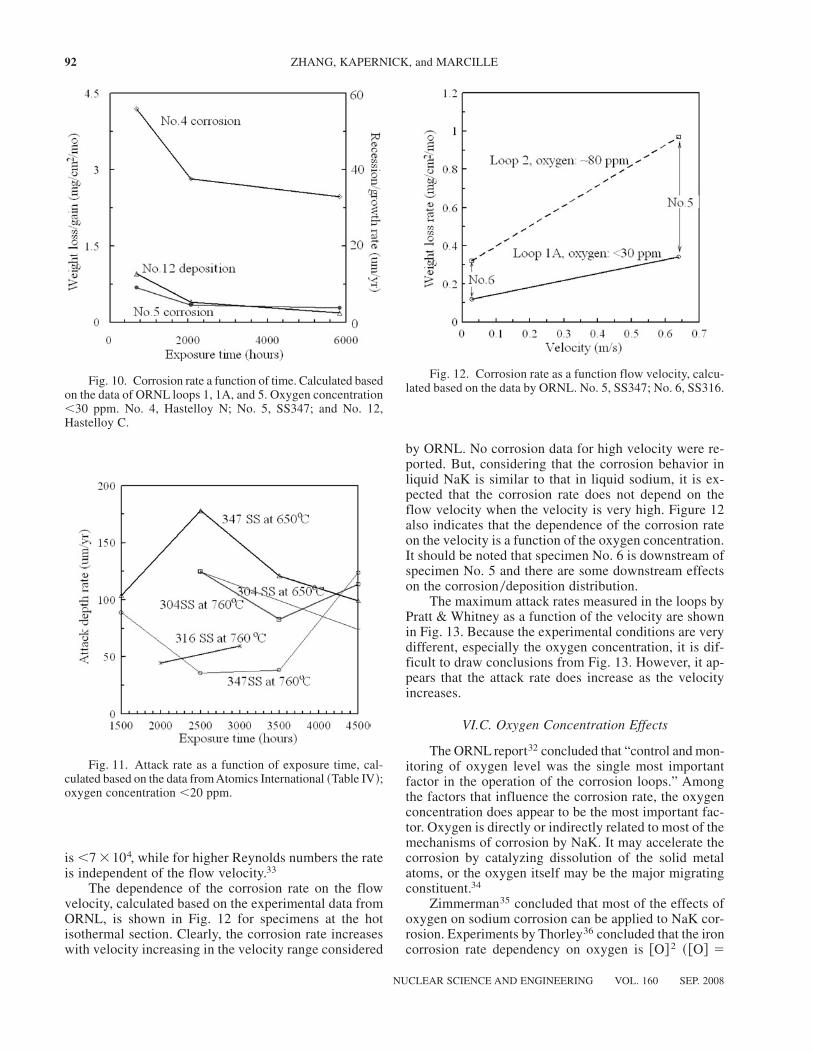
The Atomics International data shown in Fig. 11 wereexamined to check if the attack rate as a function ofexposure could be better understood. The data are tooscattered to draw any general conclusions; however, itseems from Fig. 11 that the rate decreases with time. Themost important conclusion is that more experiments areneeded to determine long-term attack rates on materialsby liquid NaK.
VI.B. Flow Velocity Effects
At a steady-state condition ~constant corrosion0deposition rates!, experimental results on sodium corro-sion indicate that the corrosion0deposition rate is almostlinear with the flow velocity when the Reynolds number
Fig. 9. ~a! Specimens’ weight change along loops 1A and 2 and ~b! the corresponding temperature; negative value representsweight loss and positive value represents weight gain.
CORROSION BY NaK COOLANT 91
NUCLEAR SCIENCE AND ENGINEERING VOL. 160 SEP. 2008
is,7 �104, while for higher Reynolds numbers the rateis independent of the flow velocity.33
The dependence of the corrosion rate on the flowvelocity, calculated based on the experimental data fromORNL, is shown in Fig. 12 for specimens at the hotisothermal section. Clearly, the corrosion rate increaseswith velocity increasing in the velocity range considered
by ORNL. No corrosion data for high velocity were re-ported. But, considering that the corrosion behavior inliquid NaK is similar to that in liquid sodium, it is ex-pected that the corrosion rate does not depend on theflow velocity when the velocity is very high. Figure 12also indicates that the dependence of the corrosion rateon the velocity is a function of the oxygen concentration.It should be noted that specimen No. 6 is downstream ofspecimen No. 5 and there are some downstream effectson the corrosion0deposition distribution.
The maximum attack rates measured in the loops byPratt & Whitney as a function of the velocity are shownin Fig. 13. Because the experimental conditions are verydifferent, especially the oxygen concentration, it is dif-ficult to draw conclusions from Fig. 13. However, it ap-pears that the attack rate does increase as the velocityincreases.
VI.C. Oxygen Concentration Effects
The ORNL report32 concluded that “control and mon-itoring of oxygen level was the single most importantfactor in the operation of the corrosion loops.” Amongthe factors that influence the corrosion rate, the oxygenconcentration does appear to be the most important fac-tor. Oxygen is directly or indirectly related to most of themechanisms of corrosion by NaK. It may accelerate thecorrosion by catalyzing dissolution of the solid metalatoms, or the oxygen itself may be the major migratingconstituent.34
Zimmerman35 concluded that most of the effects ofoxygen on sodium corrosion can be applied to NaK cor-rosion. Experiments by Thorley36 concluded that the ironcorrosion rate dependency on oxygen is @O# 2 ~ @O# �
Fig. 10. Corrosion rate a function of time. Calculated basedon the data of ORNL loops 1, 1A, and 5. Oxygen concentration,30 ppm. No. 4, Hastelloy N; No. 5, SS347; and No. 12,Hastelloy C.
Fig. 11. Attack rate as a function of exposure time, cal-culated based on the data from Atomics International ~Table IV!;oxygen concentration ,20 ppm.
Fig. 12. Corrosion rate as a function flow velocity, calcu-lated based on the data by ORNL. No. 5, SS347; No. 6, SS316.
92 ZHANG, KAPERNICK, and MARCILLE
NUCLEAR SCIENCE AND ENGINEERING VOL. 160 SEP. 2008

oxygen concentration!, for iron-based steel is @O#1.5, andfor nickel alloy is @O# 0.
The calculated corrosion0deposition rates based onthe data from ORNL are shown in Fig. 14. For stainlesssteel ~Nos. 5 and 14!, the corrosion0deposition rates in-crease with the oxygen concentration. Fitting the dataproduces a corrosion rate proportionality of @O#1.1 anddeposition rate proportionality of @O#1.6, consistent withits dependence in sodium corrosion. For nickel-basedsteel ~Nos. 4 and 12!, the corrosion0deposition rates de-pend little on the oxygen concentration as shown inFig. 14.
The oxygen concentration also affects the corrosion0deposition along the loop as shown in Fig. 9a. Figure 13indicates that the attack rate increases as the oxygen con-centration increases.
By analyzing the deposition, the ORNL report con-cluded that the oxygen level affects the composition ofthe deposit at the cold leg. For a low oxygen concentra-tion, the deposit is composed mainly of nickel, while fora high oxygen concentration, the deposit is composedmainly of iron and chromium.
VI.D. Temperature and TemperatureDifference Effects
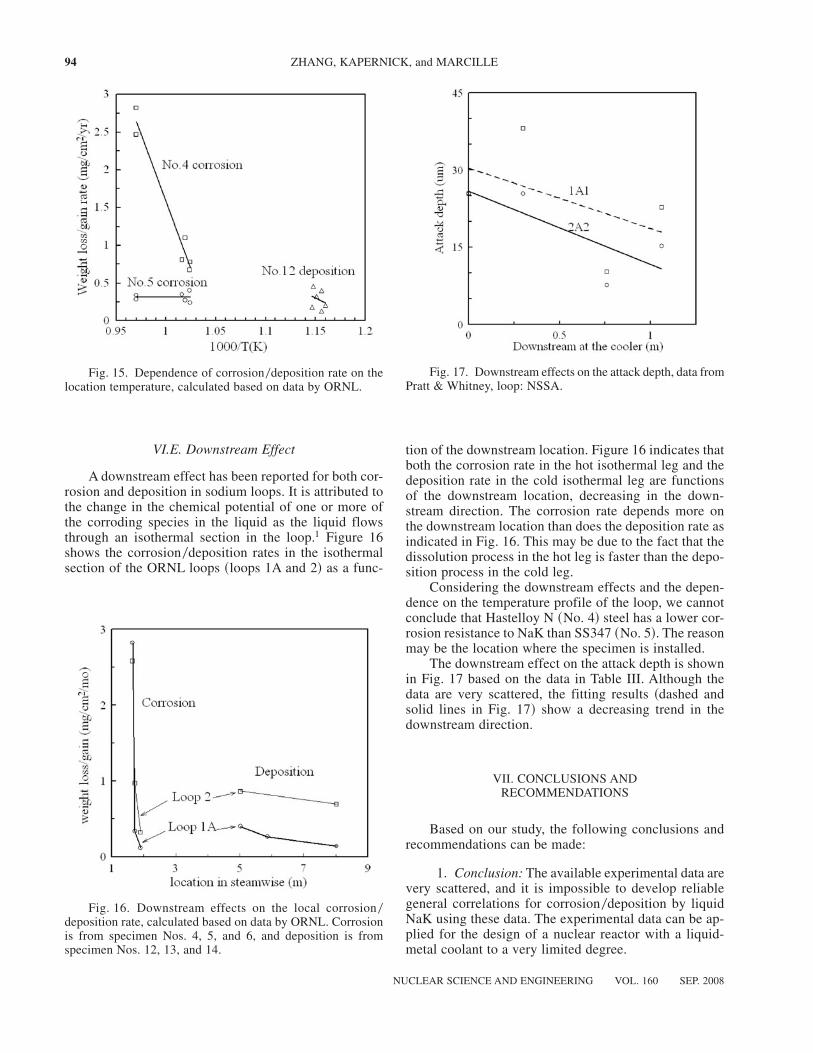
The temperature and the temperature profile of theexperimental loop are important factors that affect thecorrosion0deposition rate and distribution. The depen-dence of the corrosion0deposition rate on the local tem-perature is shown in Fig. 15. For No. 4 ~Hastelloy N!,the corrosion rate increases dramatically with increasingthe temperature, while it appears that the corrosion rateof No. 5 ~SS347! does not depend on the temperature. It
should be noted that this conclusion is specific to thisparticular loop, and one cannot conclude that the corro-sion rate of SS347 in liquid NaK does not depend on thetemperature. Figure 15 also shows that the depositionrate increases with increasing the temperature.
The kinetic model12 for lead-bismuth corrosion ina nonisothermal loop has shown that the corrosion0deposition distribution and the local corrosion deposi-tion rate depend strongly on the temperature profile, sothat this effect must be included when analyzing exper-imental data from a nonisothermal loop. However, basedon current experimental data, we cannot draw any spe-cific conclusions for the dependence of NaK corrosionon the temperature gradient. For sodium, Thorley36 con-cludes that the temperature difference does not affectthe iron corrosion rate, while correlations developed byGeneral Electric33 show a dependence of the depositionrate on the temperature difference.
Fig. 13. Dependence of the attack rate on the flow veloc-ity, calculated based on data by Pratt & Whitney ~Table III!.
Fig. 14. Oxygen dependence corrosion0deposition rate.No. 4, Hastelloy N; No. 5, SS347; No. 12, Hastelloy C; No. 14,SS316.
CORROSION BY NaK COOLANT 93
NUCLEAR SCIENCE AND ENGINEERING VOL. 160 SEP. 2008
VI.E. Downstream Effect
A downstream effect has been reported for both cor-rosion and deposition in sodium loops. It is attributed tothe change in the chemical potential of one or more ofthe corroding species in the liquid as the liquid flowsthrough an isothermal section in the loop.1 Figure 16shows the corrosion0deposition rates in the isothermalsection of the ORNL loops ~loops 1A and 2! as a func-
tion of the downstream location. Figure 16 indicates thatboth the corrosion rate in the hot isothermal leg and thedeposition rate in the cold isothermal leg are functionsof the downstream location, decreasing in the down-stream direction. The corrosion rate depends more onthe downstream location than does the deposition rate asindicated in Fig. 16. This may be due to the fact that thedissolution process in the hot leg is faster than the depo-sition process in the cold leg.
Considering the downstream effects and the depen-dence on the temperature profile of the loop, we cannotconclude that Hastelloy N ~No. 4! steel has a lower cor-rosion resistance to NaK than SS347 ~No. 5!. The reasonmay be the location where the specimen is installed.
The downstream effect on the attack depth is shownin Fig. 17 based on the data in Table III. Although thedata are very scattered, the fitting results ~dashed andsolid lines in Fig. 17! show a decreasing trend in thedownstream direction.
VII. CONCLUSIONS ANDRECOMMENDATIONS
Based on our study, the following conclusions andrecommendations can be made:
1. Conclusion: The available experimental data arevery scattered, and it is impossible to develop reliablegeneral correlations for corrosion0deposition by liquidNaK using these data. The experimental data can be ap-plied for the design of a nuclear reactor with a liquid-metal coolant to a very limited degree.
Fig. 15. Dependence of corrosion0deposition rate on thelocation temperature, calculated based on data by ORNL.
Fig. 16. Downstream effects on the local corrosion0deposition rate, calculated based on data by ORNL. Corrosionis from specimen Nos. 4, 5, and 6, and deposition is fromspecimen Nos. 12, 13, and 14.
Fig. 17. Downstream effects on the attack depth, data fromPratt & Whitney, loop: NSSA.
94 ZHANG, KAPERNICK, and MARCILLE
NUCLEAR SCIENCE AND ENGINEERING VOL. 160 SEP. 2008

Recommendation: Experiments should be per-formed ~a! to isolate separate effects and ~b! to simulatethe conditions of the nuclear coolant system condi-tions in an operating space reactor ~demonstration test-ing!. Theoretical studies should be performed to interpretthese experimental data and to guide the design of thereactor.
2. Conclusion: Although the attack by NaK changesthe composition of the materials in contact with NaK,such as sigma phase formation, decarburization, and car-burization, no material failure due to such changes hasbeen reported.
Recommendation: The effects of the compositionchange by attack of NaK on the substrate properties haveto be identified, especially for a long-term operation sys-tem. A model needs to be developed to account for cor-rosion in the reactor component and system design.Material mechanical property testing needs to be per-formed and factored into the component structural de-sign assessments.
3. Conclusion: The local temperature and the tem-perature profile have significant effects on the loop cor-rosion and deposition. Generally, the corrosion0depositionrate increases with the increasing temperature and gen-erally increases with an increasing temperature differ-ence in the loop. The temperature profile also determineswhere in the loop corrosion and deposition take place.
Recommendation: Integral loop experiments shouldbe performed to quantify the effects of the temperatureprofile on corrosion and deposition. These effects needto be incorporated into the reactor design models andanalyses.
4. Conclusion: The corrosion0deposition rates byNaK depend strongly on the oxygen level. Both of themincrease with the increasing oxygen. Given the limitedand scattered data at present, it is not possible at presentto develop an idea relationship between the attack rateand the oxygen concentration.
Recommendation: Experiments with various oxy-gen concentrations should be performed to develop acorrelation for the effect of oxygen concentration on theattack rate by NaK and be incorporated into the reactordesign models and analyses.
5. Conclusion: A cold trap is an effective methodto control the oxygen concentration as well as the hydro-gen concentration.
Recommendation: Designs considering iron-based al-loys should consider incorporating a cold trap to controloxygen. Design studies and testing need to be performedto develop a cold trap that is reliable and effective.
6. Conclusion: The corrosion rate of nickel alloydepends little on the oxygen concentration. Increasingthe oxygen concentration leads to high iron mass transfer.
Recommendation: As noted above, the effects of ox-ygen on the mass transfer of species should be quantified.
7. Conclusion: Mass transfer of carbon is signifi-cant through decarburization at the hot leg and carburi-zation at the cold leg.
Recommendation: Further studies ~test, analyses, andmodel development! on the mass transfer of carbon andits effects on the property change on the materials shouldbe conducted.
8. Conclusion: There are no solubility data for iron,chromium, nickel, etc.
Recommendation: Experimental studies should bedone to qualify the solubility.
9. Conclusion: In the velocity range considered,the corrosion deposition rate increases with increasingflow velocity.
Recommendation: Velocity effects should bequantified.
10. Conclusion: Loop geometry affects the corro-sion and deposition rates.
Recommendation: The models discussed aboveshould be developed and used to optimize the design tominimize the corrosion and deposition rate in the cool-ant circuit.
11. Conclusion: Hydrogen appears to have little ef-fect on the corrosion0deposition rate.
Recommendation: Studies on the effects of hydro-gen and other impurities in the loop should be performed.
12. Conclusion: Radiolytic effects of liquid NaK arenot well understood in a reactor.
Recommendation: The radiation chemistry of a re-actor cooled by liquid NaK has to be understood beforeNaK is used as the coolant in a nuclear power system.
REFERENCES
1. J. R. WEEKS and H. S. ISAACS, “Corrosion and Deposi-tion of Steels and Nickel-Base Alloys in Liquid Sodium,” Ad-vances in Corrosion Science and Technology, Vol. 3, p. 1, M. G.FONTANA and R. W. STAEHLE, Eds., Plenum Press ~1973!.
2. J. P. PAGE, “A Review of Liquid Metal Corrosion in theSNAP 8 Temperature Regimes ~1200–15008F!,” NAA-SR-MEMO-6575, Atomics International ~1961!.
3. A. S. BRASUNAS, “Liquid Metal Corrosion,” Corrosion,9, 78 ~1953!.
4. O. J. FOUST, Sodium-NaK Engineering Handbook, Vol.5, p. 119, Gordon and Breach, New York ~1972–1979!.
CORROSION BY NaK COOLANT 95
NUCLEAR SCIENCE AND ENGINEERING VOL. 160 SEP. 2008

5. F. A. COMPRELLI, F. J. HETZLER, and T. A. LAU-RITZEN, “Clad Compatibility with Mixed-Oxide Fuel andSodium,” Proc. Conf. Safety, Fuels, and Core Design inLarge Fast-Power Reactors, Argonne, Illinois, October 11–14, 1965, p. 355, ANL-7120, Argonne National Laboratory~1965!.
6. T. L. HOFFMAN, “Corrosion Experience with Type 316Stainless Steel in Sodium-Potassium Eutectic Alloy at 14008F,” IN-1185, TID-4500, Idaho Nuclear Corporation ~1968!.
7. O. J. FOUST, Sodium-NaK Engineering Handbook,Vol. 5, p. 123, Gordon and Breach, New York ~1972–1979!.
8. D. H. GURINSKY, J. R. WEEKS, and C. J. KLAMUT,“Corrosion in Liquid Metal Systems,” N65-29446, Oak RidgeNational Laboratory ~1965!.
9. E. M. LYUTYI, “Problems of High-Temperature Liquid-Metal Corrosion of Refractory Metals and Alloys,” Soviet UnionMater. Sci., 24, 441 ~1988!.
10. J. R. DISTEFANO and E. E. HOFFMAN, “CorrosionMechanisms in Refractory Metal-Alkali Metal Systems,” At.Energy Rev., 2, 3 ~1964!.
11. O. J. FOUST, Sodium-NaK Engineering Handbook, Vol.5, p. 163, Gordon and Breach, New York ~1972–1979!.
12. J. ZHANG and N. LI, “Corrosion0Precipitation in Non-Isothermal and Multi-Modular LBE Loop Systems,” J. Nucl.Mater., 326, 201 ~2004!.
13. A. W. THORLEY, “The Corrosion of Iron in Sodium andthe Influence of Alloying Elements on Its Mass Transfer Be-havior,” Material Behavior and Physical Chemistry in LiquidMetal Systems, p. 18, H. U. BORGSTEDT, Ed., Plenum Press,New York and London ~1982!.
14. H. U. BORGSTEDT and C. K. MATHEWS, Applied Chem-istry of the Alkali Metals, Plenum Press, New York and Lon-don ~1987!.
15. R. L. EICHELBERGER, The Solubility of Oxygen in Liq-uid Sodium: A Recommended Expression, AI-AEC-12685, U.S.Atomic Energy Commission ~1968!.
16. D. D. WILLIAMS, J. A. GRAND, and R. R. MILLER,“Determination of the Solubility of Oxygen Bearing Impuri-ties in Sodium, Potassium and Their Alloys,” J. Phys. Chem.,63, 68 ~1959!.
17. O. M. SREEDHARAN and J. B. GNANAMOORTHY,“Oxygen Potentials in Alkali Metals and Oxygen DistributionCoefficients Between Alkali and Structural Metals—An As-sessment,” J. Nucl. Mater., 89, 113 ~1980!.
18. V. GANESAN, C. H. ADELHELM, and H. U. BORG-STEDT, “Solubility of Oxygen Liquid Potassium,” J.Less-Common Metals, 113, 253 ~1985!.
19. D. KRISHNAMURTHY, A. THIRUVENGADASAMI,N. P. BHAT, and C. K. MATHEWS, “Solubility of Oxygenin Liquid Potassium,” J. Less-Common Metals, 135, 285~1987!.
20. D. KRISHNAMURTHY, S. VANA VARAMBAN, A.THIRUVENGADASAMI, and C. K. MATHEWS, “Solubilityof Oxygen in Sodium-Potassium Alloys,” J. Less-Common Met-als, 153, 363 ~1989!.
21. T. SAKAI, M. GUNJI, S. MATSUMOTO, and Y. ISHII,“Determination of Oxygen Solubility in NaK-78% by VacuumDistillation Method,” J. Nucl. Sci. Technol., 20, 1032 ~1983!.
22. R. AINSLEY, L. P. HARTLIB, P. M. HOLROYD, and G.LONG, “The Solubility of Carbon in Sodium,” J. Nucl. Mater.,52, 255 ~1974!.
23. H. U. BORGSTEDT and C. GUMINSKI, Metals in Liq-uid Alkali Metals, Oxford University Press, Oxford, UnitedKingdom ~1996!.
24. P. G. DRUGAS and L. R. KELMAN, “Equipment andProcedures for Studying the Equilibrium Solubility of Iron inNaK,” ANL-5359, Argonne National Laboratory ~1951!.
25. L. R. KELMAN, W. D. WILKINSON, and F. L. YAG-GEE, “Resistance of Materials to Attack by Liquid Metals,”ANL-4417, Argonne National Laboratory ~1950!.
26. G. E. COYLE, “Type 316 Stainless Steel Inpile ForcedConvection Liquid Metal Corrosion Tests-NSSA-1A1, NSSA-2A2, NSSB-1A1, and NSSB-3A3,” FIM-3915, Pratt & Whit-ney ~1958!.
27. M. J. REIB, “Type 316 Stainless Steel Forced ConvectionNaK Corrosion Loop Tests, NSSC 1A1, 2A2,” TIM-655, Pratt& Whitney ~1961!.
28. M. A. PERLOW, “SNAP-2 Primary Coolant Develop-ment,” NAA-SR-6439, North American Aviation ~1961!.
29. T. HOFFMAN, “Corrosion Experience with Type 316Stainless Steel in Sodium-Potassium Eutectic Alloys at 14008F,”IN-1185, Idaho Nuclear Corporation ~1968!.
30. T. L. HOFFMAN, “Performance of Types 304, 316, and348 Stainless Steel in NaK at High Temperatures,” IN-1089,Idaho Nuclear Corporation ~1967!.
31. T. L. HOFFMAN and T. L. HOFFMAN, “Performance ofType 316 Stainless Steel in Sodium-Potassium Eutectic Alloy
96 ZHANG, KAPERNICK, and MARCILLE
NUCLEAR SCIENCE AND ENGINEERING VOL. 160 SEP. 2008

During 32600 Hours Service,” Conf.-710310-1, Idaho NuclearCorporation ~1971!.
32. H. W. SAVAGE et al., “SNAP-8 Corrosion Program Sum-mary Report,” ORNL-3898, Oak Ridge National Laboratory~1965!.
33. R. S. FIDDLER and M. J. COLLINS, “A Review ofCorrosion and Mass Transport in Liquid Sodium and the Ef-fects on the Mechanical Properties,” At. Energy Rev., 13, 3~1975!.
34. J. R. WEEKS, “Mechanisms of Liquid Metal Corrosion,”BNL-7553, Brookhaven National Laboratory ~1963!.
35. C. A. ZIMMERMAN, “Corrosion of Type 316 StainlessSteel in NaK Service—A Literature Survey,” IDO-14651, Phil-lips Petroleum Corporation ~1965!.
36. A. W. THORLEY, The Corrosion of Iron in Sodium andthe Influence of Alloying Elements on Its Mass Transfer Be-havior, Material Behavior and Physical Chemistry in LiquidMetal Systems, p. 19, H. U. BORGSTEDT, Ed., Plenum Press.New York and London ~1982!.
CORROSION BY NaK COOLANT 97
NUCLEAR SCIENCE AND ENGINEERING VOL. 160 SEP. 2008