corrosion inhibition of mild steel in 1 m hcl solution by
TRANSCRIPT
Int. J. Electrochem. Sci., 6 (2011) 2998 - 3016
International Journal of
ELECTROCHEMICAL SCIENCE
www.electrochemsci.org
Corrosion Inhibition of Mild Steel in 1 M HCl Solution by
Xylopia Ferruginea Leaves from Different Extract and
Partitions
W.A.W. Elyn Amira1, A.A. Rahim
1,*, H. Osman
1, K. Awang
2, P. Bothi Raja
1
1 School of Chemical Sciences, University Sains Malaysia, 11800 Penang, Malaysia.
2 Department of Chemistry, Faculty of Science, Universiti Malaya, 50603 Kuala Lumpur, Malaysia.
*E-mail: [email protected]
Received: 8 February 2011 / Accepted: 31 May 2011 / Published: 1 July 2011
The influence of Xylopia ferruginea leaves extract and partitions in different solvents on the corrosion
behavior of mild steel (MS) in 1 M HCl was studied using weight loss, potentiodynamic polarization,
electrochemical impedance spectroscopy (EIS) and Scanning Electron Microscope (SEM) techniques.
The results revealed that Xylopia ferruginea was an excellent green inhibitor and the inhibition
efficiencies obtained from weight loss and electrochemical experiments were in good agreement.
Potentiodynamic polarization studies clearly reveal that all inhibitors behaved as mixed-type inhibitors
with predominant anodic effectiveness. The Nyquist plots showed that on increasing the inhibitor
concentration, the charge transfer resistance increased and the double layer capacitance decreased. The
adsorption of inhibitors on MS surface obeys the Langmuir adsorption isotherm. SEM studies
confirmed that the corrosion protection of MS was by the adsorption of inhibitors. The effectiveness as
corrosion inhibitors is in the order of chloroform partition (CP) > n-hexane partition (HP) > methanol
extracts (ME).
Keywords: Corrosion inhibitor, Xylopia ferruginea, mild steel, adsorption isotherm
1. INTRODUCTION
Corrosion is a very common phenomenon in industries and it has wide amount of interest
because of its hazardous nature on metals [1]. Due to the excellent mechanical properties and low cost,
mild steel is extensively used as a constructional material in many industries. However, when exposed
to the corrosive industrial environment, it is easily corroded. Normally, acid solutions such as
hydrochloric acid are widely used such as in acid pickling, industrial cleaning, oil well cleaning, etc.
The use of inhibitors is one of the most practical methods for protection against corrosion to protect
Int. J. Electrochem. Sci., Vol. 6, 2011
2999
metal dissolution and acid consumption [2]. Synthetic organic compounds [3-5] and organic
compounds which can be extracted from natural resources could serve as effective corrosion inhibitors
due to the presence of polar functions with S, O, or N atoms in the molecule, heterocyclic compounds
and π electrons [6-11]. Recently the use of synthetic inhibitors has created environmental problems due
to its toxicity properties. Therefore researchers are now focusing on development of cheap, non-toxic
and environmental friendly corrosion inhibitors from natural products. These natural organic inhibitors
that can be extracted or synthesized from potential herbs, spice and medicinal plants can be used as
corrosion inhibitors of mild steel in acidic solution due to its active chemical activity, low toxicity and
low cost [12-15].
Alkaloids are naturally occurring chemical compounds containing basic nitrogen atoms which
are produced by a large variety of organisms, including bacteria, fungi, plants, and animals. Many
plants are known to produce various types of alkaloids [16, 17]. Alkaloids such as papaverine, strych-
nine, quinine, piperine, liriodenine, oxoanalobine and nicotine were also studied as corrosion inhibitors
in acid medium [18-20]. The genus Xylopia is distributed in tropical Africa and Malaysia [21]. X.
ferruginea is a species of plants in the Annonaceae family. It is a medium sized forest tree which can
reach up 10 to 20 meters in height. X. ferruginea is easily found in Peninsular Malaysia except in
Perlis, Penang and Seberang Prai. It is also distributed in Thailand, Borneo and Sumatera [22]. The
extracts of this plant, which contains numerous naturally environmental organic compounds, may be
utilized as natural corrosion inhibitors. The genus Xylopia is known to contain alkaloids of aporphine
and tetrahydroberberine types and specifically X. ferruginea extracts contain significant amount of
atheroline alkaloids [23]. In this paper, the corrosion inhibitor property of alkaloids in different solvent
extract and partition of X. ferruginea leaves on mild steel in 1 M HCl was investigated by weight loss,
potentiodynamic polarization, EIS and SEM techniques.
2. EXPERIMENTAL
2.1. Materials
Mild Steel (MS) of the following composition (wt. %: 0.039 % P; 0.06% Si; 0.55% Mn;
0.205% C; Fe balance) were used in this studies. The MS specimens were mechanically cut into
dimensions of 30.0 x 10.0 x 1.00 mm for weight loss studies and 30.0 x 30.0 x 1.00 mm for
electrochemical studies. Prior to all measurements, the specimens were polished successively with a
series of emery paper (grade 350, 500, 800, 1000, 1200 and 1500). Then, the specimens were washed
with double distilled water and acetone (AR grade) and dried at room temperature (27±2 °C). The 1 M
HCl solution was prepared by dilution of analytical grade 37% HCl with double distilled water.
2.2. Inhibitors preparation
Air-dried leaves of X. ferruginea (1.0 kg) were pulverized into fine powder and extracted
exhaustively with methanol at room temperature (27±2 °C). Concentration of the combined methanol
Int. J. Electrochem. Sci., Vol. 6, 2011
3000
extracts yielded a dark green crude extract of methanol extract (ME) (214.5 g). This extract was
suspended in methanol:water (l:2) overnight and successively partitioned with n-hexane (yield 6.3 g)
to yield the n-hexane partition (HP). The remaining aqueous extract was partitioning again with
chloroform to yield the chloroform partition (CP) (4.1 g). These ME, HP, and CP was used for the
corrosion inhibitor studies. The maximum solubility of extracts in 1 M HCl was found to be 500 ppm.
All inhibitors were dissolved in 1 M HCl at different concentrations ranging from 50 ppm to 500 ppm.
The 1 M HCl solution in the absence of inhibitors was taken as blank for comparison.
2.3. Weight loss measurements
MS specimens were immersed in triplicate in 100 mL of the test solutions (1 M HCl) with and
without addition of inhibitors of different concentrations at room temperature (27±2 °C). The cleaned
specimens were weighed before and after 2 hours of immersion in the test solution. The percentage
inhibition efficiency (%IE) was calculated by Eq. (1).
Where, W(o) is the weight loss of MS without inhibitor and W(i) is the weight loss of MS with
inhibitor.
2.4. Electrochemical measurements
Electrochemical studies were carried out using Gamry Instruments reference 600
(potentiostat/galvanostat/ZRA). A classical three electrode system was used for these studies. Mild
steel specimens were used as a working electrode, platinum (Pt) electrode and saturated calomel
electrode (SCE) served as auxillary and reference electrodes, respectively. All electrochemical
experiments were conducted at room temperature (27±2 °C) using 100 mL of test solution. Before the
potentiodynamic polarization (Tafel) and electrochemical impedance spectroscopy (EIS) experiments,
the electrode was allowed to corrode freely and its open circuit potential (OCP) was recorded as a
function of time up to 30 min.
AC impedance measurements were carried out at the corrosion potential (Ecorr) with frequency
range from 100,000 to 0.1 Hz at an amplitude of 10 mV and scan rate of 10 points per decade. The
impedance diagrams are given in Nyquist representation. The electrical equivalent circuit for the
system was obtained. The %IE was calculated from the charge transfer resistance (Rct) values by using
the Eq. (2).

Int. J. Electrochem. Sci., Vol. 6, 2011
3001
Where, Rct(o) is the charge transfer resistance of MS without inhibitor and Rct(i) is the charge
transfer resistance of MS with inhibitor.
The Tafel polarization curves were recorded by scanning the electrode potential from -300 mV
to 300 mV (vs SCE) with a scanning rate of 1 mV/s. The linear Tafel segments of the anodic and
cathodic curves were extrapolated to corrosion potential to obtain the corrosion current densities (Icorr).
The %IE was obtained from Eq. (3).
Where, Icorr(o) is the corrosion current densities of MS without inhibitor and Icorr(o) is the
corrosion current densities of MS with inhibitor.
2.5 Fourier transform infrared spectroscopy (FTIR) analyses
All inhibitors were characterized by FTIR spectroscopy for identification of the active
functional groups. The FTIR study was carried out by using the Perkin Elmer System 2000 FTIR
instrument.
2.6 Scanning Electron Microscope (SEM) analyses
SEM LEO SUPRA 50VP - Scanning Electron Microscope was used for monitoring the surface
morphological changes. For this study, finely polished MS plates were immersed in 1 M HCl solution
in the presence and absence of 500 ppm of green inhibitors for 2 h. Then the specimens were cleaned
with distilled water and acetone, dried in cold air blaster and used for the analysis.
3. RESULTS AND DISCUSSION
3.1 Weight loss measurements
The inhibition efficiency of MS exposed to 1 M HCl at room temperature (27±2 °C) as a
function of concentration of different inhibitors is shown in Figure 1 and Table 1. It is observed that
the inhibition efficiency of MS increased with increasing concentrations of inhibitors. This behavior
could be attributed to the increase in adsorption of inhibitor on the metal or at the solution interface on
increasing its concentration. The highest %IE was 82, 88 and 94% for ME, HP and CP respectively.
Comparison of the inhibition efficiencies of inhibitors shows that the efficiencies followed the trend:
CP > HP > ME. This is due to the high alkaloids chemical constituents in CP that can be adsorbed onto
the MS surface. The higher yield of creamy precipitate for Mayer’s test was obtained for CP compared
to NP and ME, which indicated that CP contained the highest alkaloids content.

Int. J. Electrochem. Sci., Vol. 6, 2011
3002
Table 1. Inhibition efficiency (%IE) values for the corrosion of MS in 1 M HCl in the absence and
presence of different concentrations of inhibitors from weight loss measurement at 27±2 °C for
2 h of immersion time.
Inhibitors Concentrations (ppm) Weight loss (g) %IE
ME 0 0.0174 -
50 0.0104 40
100 0.0069 60
200 0.0043 75
300 0.0035 80
500 0.0031 82
HP 0 0.0180 -
50 0.0089 51
100 0.0072 60
200 0.0040 78
300 0.0030 83
500 0.0021 88
CP 0 0.0203 -
50 0.0039 81
100 0.0030 85
200 0.0015 92
300 0.0013 94
500 0.0016 92
Figure 1. Percentage inhibition (%IE) of different inhibitors in 1 M HCl from the weight loss method
Concentration, ppm
Int. J. Electrochem. Sci., Vol. 6, 2011
3003
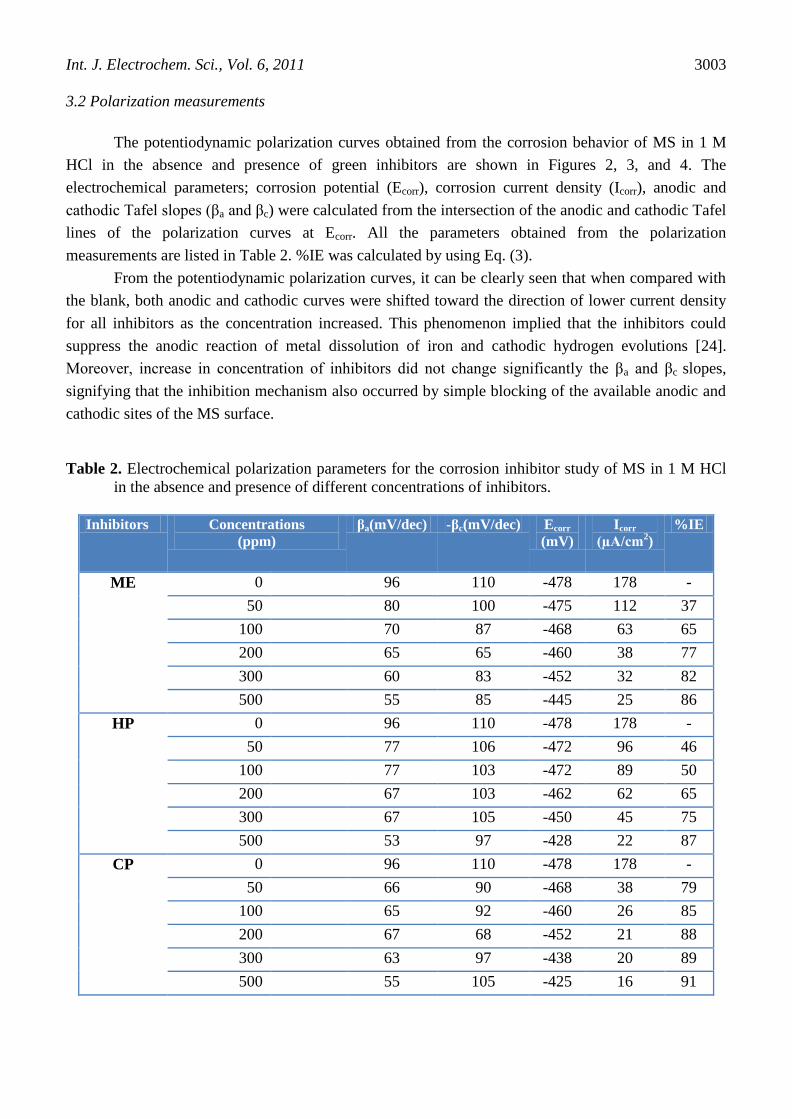
3.2 Polarization measurements
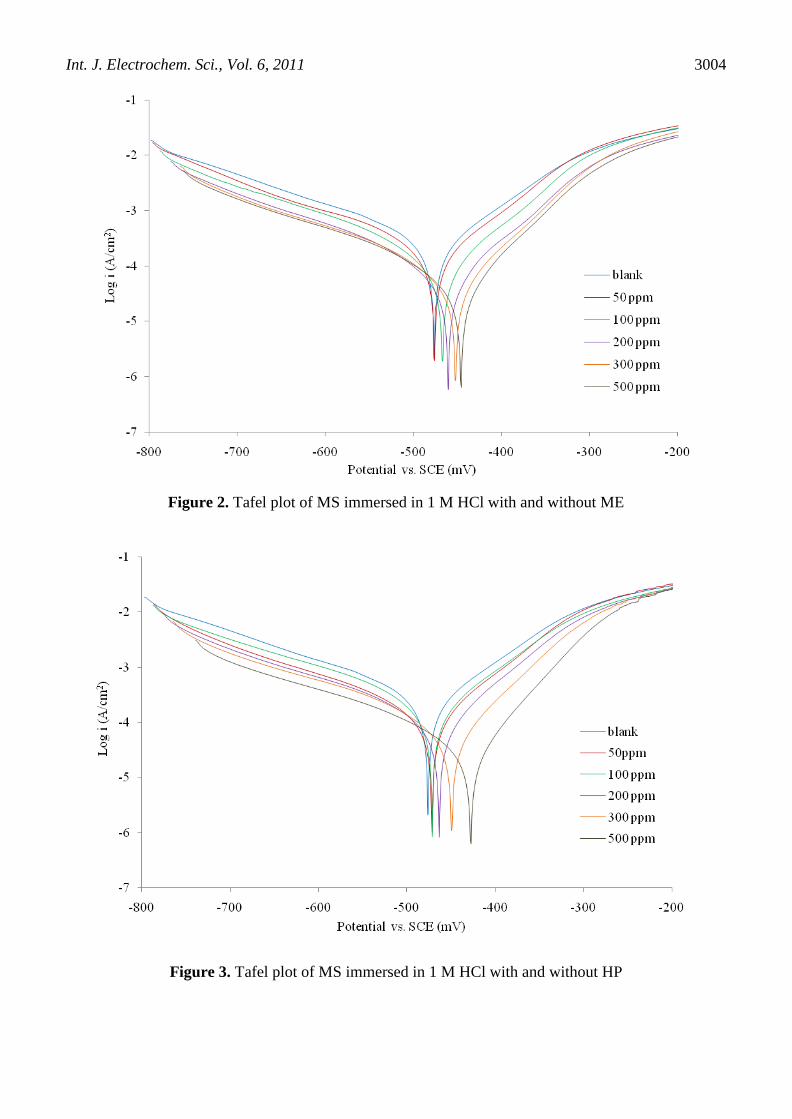
The potentiodynamic polarization curves obtained from the corrosion behavior of MS in 1 M
HCl in the absence and presence of green inhibitors are shown in Figures 2, 3, and 4. The
electrochemical parameters; corrosion potential (Ecorr), corrosion current density (Icorr), anodic and
cathodic Tafel slopes (βa and βc) were calculated from the intersection of the anodic and cathodic Tafel
lines of the polarization curves at Ecorr. All the parameters obtained from the polarization
measurements are listed in Table 2. %IE was calculated by using Eq. (3).
From the potentiodynamic polarization curves, it can be clearly seen that when compared with
the blank, both anodic and cathodic curves were shifted toward the direction of lower current density
for all inhibitors as the concentration increased. This phenomenon implied that the inhibitors could
suppress the anodic reaction of metal dissolution of iron and cathodic hydrogen evolutions [24].
Moreover, increase in concentration of inhibitors did not change significantly the βa and βc slopes,
signifying that the inhibition mechanism also occurred by simple blocking of the available anodic and
cathodic sites of the MS surface.
Table 2. Electrochemical polarization parameters for the corrosion inhibitor study of MS in 1 M HCl
in the absence and presence of different concentrations of inhibitors.
Inhibitors Concentrations (ppm)
βa(mV/dec) -βc(mV/dec) Ecorr
(mV) Icorr
(µA/cm2)
%IE
ME 0 96 110 -478 178 -
50 80 100 -475 112 37
100 70 87 -468 63 65
200 65 65 -460 38 77
300 60 83 -452 32 82
500 55 85 -445 25 86
HP 0 96 110 -478 178 -
50 77 106 -472 96 46
100 77 103 -472 89 50
200 67 103 -462 62 65
300 67 105 -450 45 75
500 53 97 -428 22 87
CP 0 96 110 -478 178 -
50 66 90 -468 38 79
100 65 92 -460 26 85
200 67 68 -452 21 88
300 63 97 -438 20 89
500 55 105 -425 16 91
Int. J. Electrochem. Sci., Vol. 6, 2011
3004
Figure 2. Tafel plot of MS immersed in 1 M HCl with and without ME
Figure 3. Tafel plot of MS immersed in 1 M HCl with and without HP

Int. J. Electrochem. Sci., Vol. 6, 2011
3005
Figure 4. Tafel plot of MS immersed in 1 M HCl with and without CP
In the presence of inhibitors, the Ecorr of mild steel shifted 3-53 mV anodically compared to the
blank. This indicates that the inhibitor reduce the corrosion rates predominantly by dissolution of metal
(anodic mode). The inhibitors may shift the equilibrium of corrosion process to the passive direction
causing a formation of thin passivation oxide film over the anodic sites, which may increase the anodic
potential and depressed the oxidation process. From previous study, it was reported that an inhibitor
can be classified as cathodic or anodic type if the displacement in the Ecorr is more than 85mV with
respect to Ecorr of the blank [25]. Thus, this reveals that all inhibitors act as mixed-type inhibitor with
predominant anodic effectiveness.
From Table 2, the inhibition of these reactions was more pronounced on the increasing of
inhibitor concentration for all inhibitors, reaching values of 86, 87 and 91% for ME, HP and CP,
respectively. The maximum inhibition of 91% was obtained for 500 ppm CP in 1 M HCl solution.
3.3. Electrochemical impedance spectroscopy (EIS) measurements
The Nyquist plots for MS in 1 M HCl in the absence and presence of green inhibitors are
shown in Figures 5, 6 and 7. Nyquist impedance plots were analysed by fitting the experimental data to
a simple circuit model, Figure 8, that includes the solution resistance (Rs), charge transfer element (Rct)
constant phase element (CPE) and surface inhomogeneity (n) and the values are depicted in Table 3.

Int. J. Electrochem. Sci., Vol. 6, 2011
3006
Figure 5 shows depressed Nyquist plots which are not perfect semicircles as expected from the
theory of EIS. This difference can be explained by non-ideal behaviour of double layer as a capacitor.
Therefore it is necessary to use a constant phase element, CPE, instead of double layer capacity to
account for non-ideal behaviour. This CPE, which is considered as a surface irregularity, causes a
greater depression in Nyquist semicircle diagram, where the metal-solution interface acts as a capacitor
with irregular surface [26]. The CPE can be modelled as follows [27]:
Where ZCPE is the impedance, j the square root of -1, ω the frequency, C the capacitance and n
is a measure of the non-ideality of the capacitor (surface irregularity) and has a value in the range of 0
≤ n ≤ 1. If the electrode surface is homogeneous and plane, the value of n equals to 1 and the metal-
solution interface acts as a capacitor with regular surface.
The Nquist plots in Figures 5, 6 and 7 yield a capacitive loop at high frequencies in the absence
and presence of inhibitors, indicating that the corrosion process is mainly controlled by a charge
transfer process [28]. It is also observed that the diameters of the capacitive loop increase with
increasing green inhibitor concentrations which indicates the increasing coverage of metal surface.
Further, it is clear from Table 2 that by increasing the inhibitor concentration, the Rct values increase.
Table 3. Electrochemical impedance parameters for the corrosion of MS in 1 M HCl in the absence
and presence of different concentrations of inhibitors.
Inhibitors Concentrations
(ppm)
Rs
(Ω.cm2)
Rct
(Ω.cm2)
CPE x 105
(µF/cm2)
n %IE
ME 0 3.449 109.6 19.62 0.8219 -
50 2.946 150.6 18.70 0.8206 52
100 3.094 267.6 17.25 0.8191 59
200 4.302 451.3 14.85 0.8068 76
300 3.347 482.7 13.07 0.7996 77
500 4.087 621.9 12.66 0.7868 82
HP 0 3.449 109.6 19.62 0.8219 -
50 3.794 138.6 19.14 0.8201 21
100 3.914 142.2 17.18 0.8087 23
200 3.761 237.0 14.49 0.8096 54
300 3.405 362.1 13.56 0.7772 70
500 2.969 749.3 12.37 0.7346 85
CP 0 3.449 109.6 19.62 0.8219 -
50 3.429 299.1 14.87 0.8037 63
100 3.391 622.7 12.99 0.7735 82
200 3.484 779.5 10.07 0.7349 86
300 2.983 959.5 9.947 0.7273 89
500 2.758 1595 9.886 0.5984 93

Int. J. Electrochem. Sci., Vol. 6, 2011
3007
Figure 5. Nquist plots of MS immersed in 1 M HCl with and without ME
Figure 6. Nquist plots of MS immersed in 1 M HCl with and without HP

Int. J. Electrochem. Sci., Vol. 6, 2011
3008
Figure 7. Nquist plots of MS in 1 M HCl with and without CP
Figure 8. Equivalent circuit model for Nyquist plots
This is because, the addition of inhibitor increases the adsorption of phyto-constituents over the
metal surface and results in the formation of a protective layer; which may decrease the electron
transfer between the metal surface and the corrosive medium. On the other hand, the values of CPE
decreased with an increase in inhibitor concentrations and thus the inhibition efficiencies increase. The
decrease in CPE values can be attributed to a decrease in local dielectric constant and/or an increase in
the thickness of the electrical double layer which leads to an increase in the inhibition efficiency.
Therefore it is suggested that the inhibitors act by adsorption at the MS surface or solution interface.
Besides, the change in CPE values is caused by the gradual displacement of water molecules by the
adsorption of the organic molecules on the MS surface, decreasing the extent of the metal dissolution
[29]. The values of n (Table 3), ranging between 0.8219 and 0.5984, indicate that the charge transfer
CPE Rs
Rct

Int. J. Electrochem. Sci., Vol. 6, 2011
3009
process controls the dissolution mechanism of MS in 1 M HCl solution in the absence and in the
presence of the inhibitors [30]. The higher frequency range loops have depressed semi-circular
appearance, 0.5 ≤ n ≤1, which is often referred to as frequency dispersion as a result of the non-
homogeneity or the roughness of the metal surface [31, 32]. However, from the Table 3, the decrease
in n values as concentration of inhibitors increase is similarly observed by several studies indicated the
increase in non-homogeneity of the MS surface [33-35]. However, the increase in non-homogeneity is
not related to the roughness or smoothness of the surface of MS as shown by SEM micrographs in
Figure 9.
Inhibition efficiency, calculated from the values of Rct (Eq. 2) was found to be maximum at 500
ppm for all inhibitors with %IE 82, 85 and 93% of ME, HP, and CP respectively. In conclusion, the
results of the electrochemical studies were in good agreement with the results of gravimetric studies
with slight deviations. This is due to the difference in immersion period of MS in the aggressive media
[36]. From all studies, the corrosion inhibition ability of all inhibitors is in the order of CP > HP > ME
which can be explained due to the alkaloids content.
3.4. SEM analyses
Surface morphology of MS was studied by scanning electron microscopy after 2 h immersion
in 1 M HCl before and after addition of the green inhibitors. Figure 9(a) represent the micrograph
obtained of polished MS without being exposed to the corrosive environment while Figure 9(b)
showed strongly damaged MS surface due to the formation of corrosion products after immersion in 1
M HCl solution. SEM images of MS surface after immersion in 1 M HCl with 500ppm ME, HP and
CP are shown in Figures9(c, d and e). It could be seen that no pits and cracks are observed in the
micrographs after immersion of MS in 1 M HCl in the presence of inhibitors except polishing lines.
Thus, it revealed the presence of a good protective film upon adsorption of inhibitor molecules onto
the MS surface, which was responsible for the inhibition of corrosion.
a b

Int. J. Electrochem. Sci., Vol. 6, 2011
3010
Figure 9. SEM images of MS (a) Polished MS, (b) MS in 1 M HCl, (c) MS in 1 M HCl with ME (500
ppm), (d) MS in 1 M HCl with HP (500 ppm), (e) MS in 1 M HCl with CP (500 ppm)
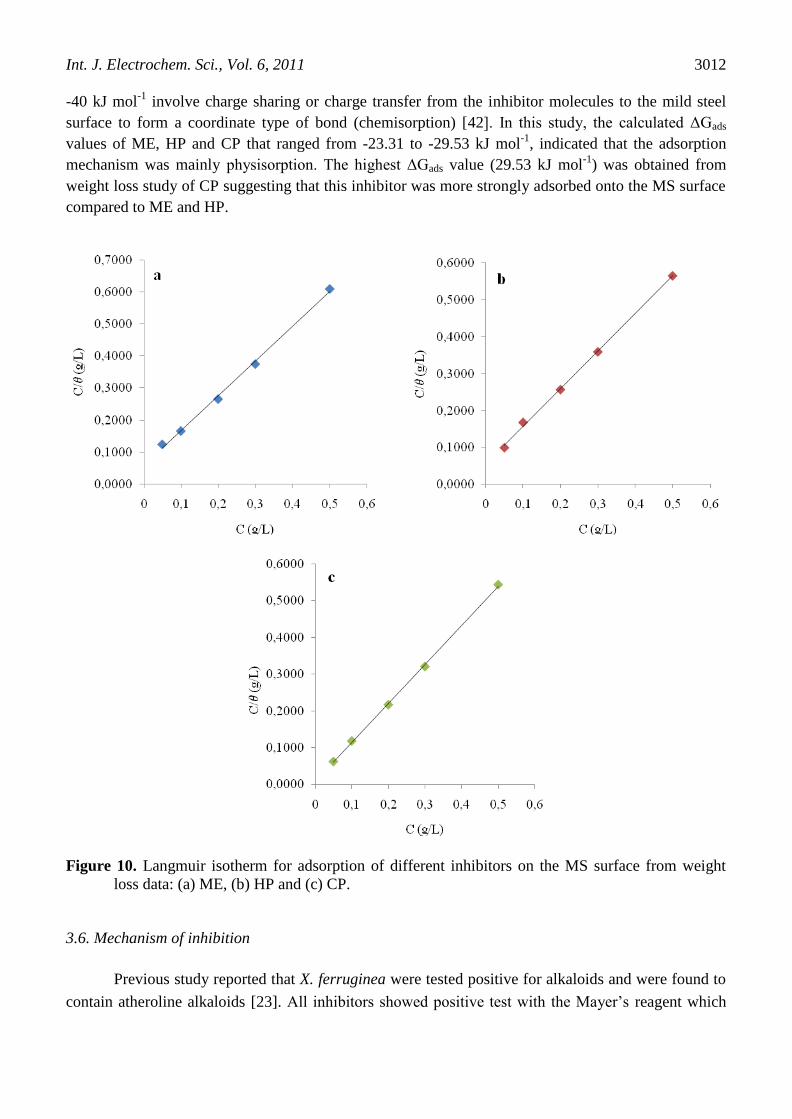
3.5. Adsorption isotherm
Basic information on the interaction between the inhibitors and the MS surface can be provided
by the adsorption isotherm. In order to obtain the isotherm, the surface coverage values (θ) (defined as
θ = %IE/100) were evaluated by using the %IE values obtained from weight loss, potentiodynamic and
EIS studies. The θ values increased with increasing inhibitor concentration as a result of more inhibitor
molecules adsorption on the metal surface. The θ values for different concentrations of ME, HP and
CP were tested by fitting to several adsorption isotherms including Temkin, Langmuir, and Frumkin.
For all three methods used in this study (weight loss, potentiodynamic and EIS), all inhibitors best
fitted the Langmuir isotherm (Figure 10). This isotherm assumed that the adsorbed molecules occupied
only on one site and there was no interaction with other molecules adsorbed. Under these
circumstances, the proportionality between θ and bulk concentration (C) of the adsorbing inhibitors is
as follows [37].
c d
e
c

Int. J. Electrochem. Sci., Vol. 6, 2011
3011
Here K is the equilibrium constant. It is convenient to rearrange the equation, yielding:
Figure 10 gives the result of Langmuir’s plot for corrosion inhibition data of the inhibitors.
Linear plots of C/θ against the C were obtained with the slope in the range of 1.00 to 1.12 which is
close to unity. These results suggest that the inhibitor occupies about 1.00 to 1.12 adsorption sites on
the MS surface [38]. Besides, the results show that all the linear correlation coefficients (R2) were
almost equal to unity. Thus, the adsorption phenomenon of inhibitors into the mild steel surface obeys
the Langmuir isotherm.
The equilibrium constant, K is related to the free energy of adsorption (ΔGads) at a single
temperature as reported [39-41]. The value of ΔGads was calculated by Eq. 7.
(7)
Where 1000 is the concentration of water in solution expressed in g/L, R is the molar gas
constant and T is the temperature (27±2 °C).
The calculated values are given in Table 4. The values of ΔGads from the different techniques
used for all inhibitors were in good agreement with each other. The negative values of ΔGads are an
indication of the spontaneous adsorption of inhibitor on the MS surface [37].
Table 4. The values of free Gibs energy of adsorption calculated using different studies results of ME,
HP and CP.
Inhibitors Methods Slope R2 K (g/L) ΔGads (kJ mol
-1)
ME Weight loss 1.09 0.9975 17.21 -24.33
Potentiodynamic 1.02 0.9948 15.43 -24.05
EIS 1.12 0.9986 21.46 -24.88
HP Weight loss 1.02 0.9987 18.32 -24.48
Potentiodynamic 1.00 0.9869 11.43 -23.31
EIS 1.08 0.9914 16.56 -24.23
CP Weight loss 1.06 0.9994 138.9 -29.53
Potentiodynamic 1.08 0.9999 98.04 -28.67
EIS 1.03 0.9994 39.84 -26.42
Generally values of ΔGads around -20 kJ mol-1
or lower are consistent with electrostatic
interactions between the charged metal and ions in solution (physisorption). Those more negative than
Int. J. Electrochem. Sci., Vol. 6, 2011
3012
-40 kJ mol-1
involve charge sharing or charge transfer from the inhibitor molecules to the mild steel
surface to form a coordinate type of bond (chemisorption) [42]. In this study, the calculated ΔGads
values of ME, HP and CP that ranged from -23.31 to -29.53 kJ mol-1
, indicated that the adsorption
mechanism was mainly physisorption. The highest ΔGads value (29.53 kJ mol-1
) was obtained from
weight loss study of CP suggesting that this inhibitor was more strongly adsorbed onto the MS surface
compared to ME and HP.
Figure 10. Langmuir isotherm for adsorption of different inhibitors on the MS surface from weight
loss data: (a) ME, (b) HP and (c) CP.
3.6. Mechanism of inhibition
Previous study reported that X. ferruginea were tested positive for alkaloids and were found to
contain atheroline alkaloids [23]. All inhibitors showed positive test with the Mayer’s reagent which
Int. J. Electrochem. Sci., Vol. 6, 2011
3013
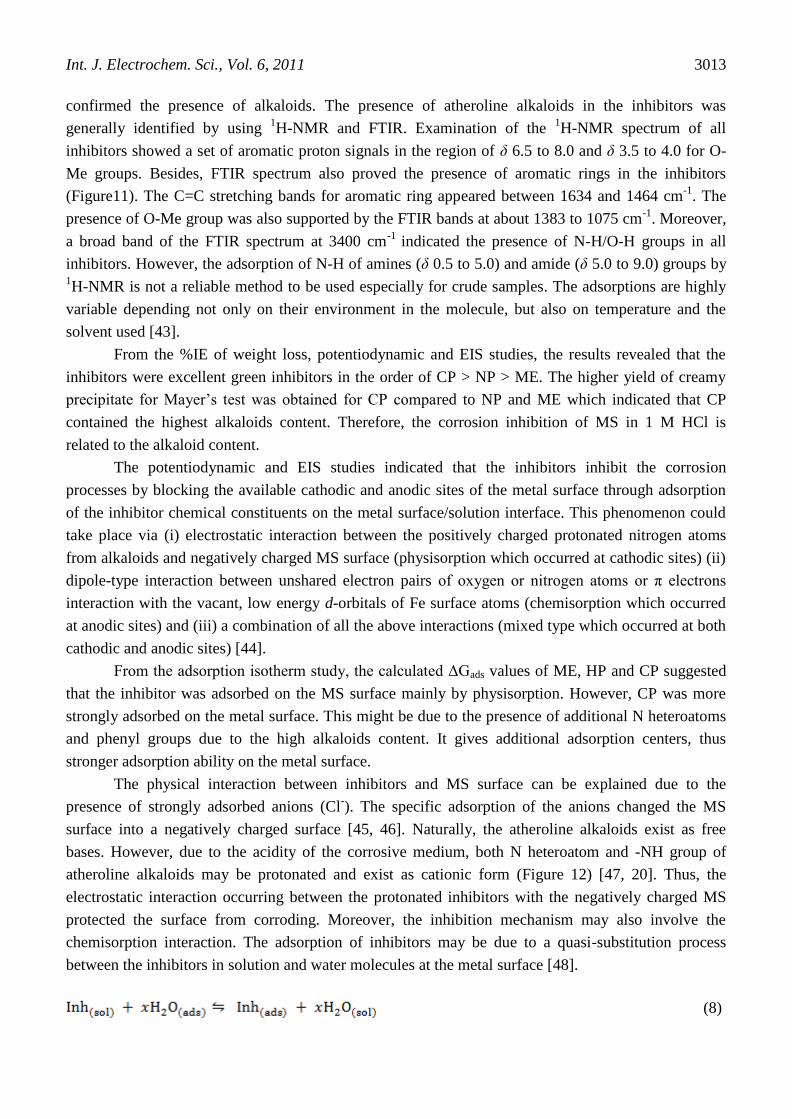
confirmed the presence of alkaloids. The presence of atheroline alkaloids in the inhibitors was
generally identified by using 1H-NMR and FTIR. Examination of the
1H-NMR spectrum of all
inhibitors showed a set of aromatic proton signals in the region of δ 6.5 to 8.0 and δ 3.5 to 4.0 for O-
Me groups. Besides, FTIR spectrum also proved the presence of aromatic rings in the inhibitors
(Figure11). The C=C stretching bands for aromatic ring appeared between 1634 and 1464 cm-1
. The
presence of O-Me group was also supported by the FTIR bands at about 1383 to 1075 cm-1
. Moreover,
a broad band of the FTIR spectrum at 3400 cm-1
indicated the presence of N-H/O-H groups in all
inhibitors. However, the adsorption of N-H of amines (δ 0.5 to 5.0) and amide (δ 5.0 to 9.0) groups by 1H-NMR is not a reliable method to be used especially for crude samples. The adsorptions are highly
variable depending not only on their environment in the molecule, but also on temperature and the
solvent used [43].
From the %IE of weight loss, potentiodynamic and EIS studies, the results revealed that the
inhibitors were excellent green inhibitors in the order of CP > NP > ME. The higher yield of creamy
precipitate for Mayer’s test was obtained for CP compared to NP and ME which indicated that CP
contained the highest alkaloids content. Therefore, the corrosion inhibition of MS in 1 M HCl is
related to the alkaloid content.
The potentiodynamic and EIS studies indicated that the inhibitors inhibit the corrosion
processes by blocking the available cathodic and anodic sites of the metal surface through adsorption
of the inhibitor chemical constituents on the metal surface/solution interface. This phenomenon could
take place via (i) electrostatic interaction between the positively charged protonated nitrogen atoms
from alkaloids and negatively charged MS surface (physisorption which occurred at cathodic sites) (ii)
dipole-type interaction between unshared electron pairs of oxygen or nitrogen atoms or π electrons
interaction with the vacant, low energy d-orbitals of Fe surface atoms (chemisorption which occurred
at anodic sites) and (iii) a combination of all the above interactions (mixed type which occurred at both
cathodic and anodic sites) [44].
From the adsorption isotherm study, the calculated ΔGads values of ME, HP and CP suggested
that the inhibitor was adsorbed on the MS surface mainly by physisorption. However, CP was more
strongly adsorbed on the metal surface. This might be due to the presence of additional N heteroatoms
and phenyl groups due to the high alkaloids content. It gives additional adsorption centers, thus
stronger adsorption ability on the metal surface.
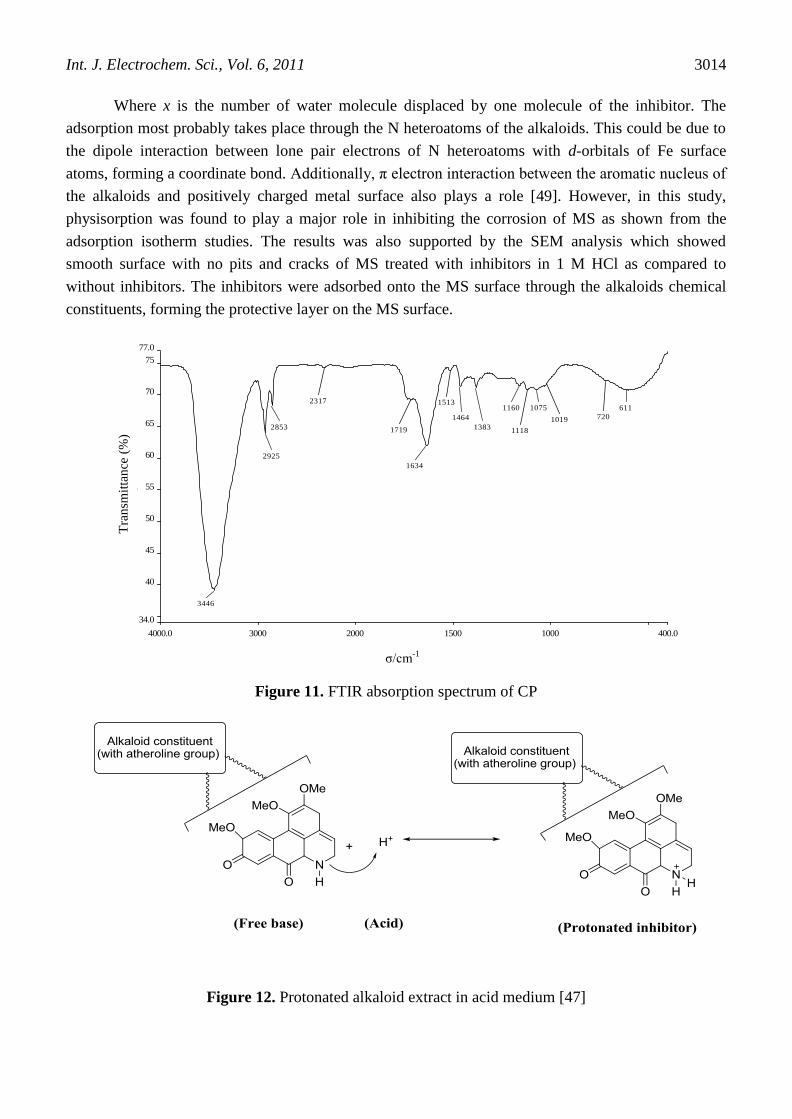
The physical interaction between inhibitors and MS surface can be explained due to the
presence of strongly adsorbed anions (Cl-). The specific adsorption of the anions changed the MS
surface into a negatively charged surface [45, 46]. Naturally, the atheroline alkaloids exist as free
bases. However, due to the acidity of the corrosive medium, both N heteroatom and -NH group of
atheroline alkaloids may be protonated and exist as cationic form (Figure 12) [47, 20]. Thus, the
electrostatic interaction occurring between the protonated inhibitors with the negatively charged MS
protected the surface from corroding. Moreover, the inhibition mechanism may also involve the
chemisorption interaction. The adsorption of inhibitors may be due to a quasi-substitution process
between the inhibitors in solution and water molecules at the metal surface [48].
(8)
Int. J. Electrochem. Sci., Vol. 6, 2011
3014
Where x is the number of water molecule displaced by one molecule of the inhibitor. The
adsorption most probably takes place through the N heteroatoms of the alkaloids. This could be due to
the dipole interaction between lone pair electrons of N heteroatoms with d-orbitals of Fe surface
atoms, forming a coordinate bond. Additionally, π electron interaction between the aromatic nucleus of
the alkaloids and positively charged metal surface also plays a role [49]. However, in this study,
physisorption was found to play a major role in inhibiting the corrosion of MS as shown from the
adsorption isotherm studies. The results was also supported by the SEM analysis which showed
smooth surface with no pits and cracks of MS treated with inhibitors in 1 M HCl as compared to
without inhibitors. The inhibitors were adsorbed onto the MS surface through the alkaloids chemical
constituents, forming the protective layer on the MS surface.
Figure 11. FTIR absorption spectrum of CP
Figure 12. Protonated alkaloid extract in acid medium [47]
σ/cm-1
Tra
nsm
itta
nce
(%
)
4000.0 3000 2000 1500 1000 400.0
34.0
40
45
50
55
60
65
70
75
77.0
cm-1
%T
3446
2925
2853
1634
1464
1383
1160 1075 6112317
1719
1513
7201019
1118

Int. J. Electrochem. Sci., Vol. 6, 2011
3015
4. CONCLUSIONS
The corrosion inhibition potential of MS corrosion in 1 M HCl of Xylopia ferruginea was
studied by weight loss, potentiodynamic polarization, EIS and SEM techniques. The main conclusions
drawn from the studies are:
1) The effectiveness of the inhibitors as corrosion inhibitors is in the order of CP > HP > ME.
2) The inhibition efficiency increases with increasing inhibitor concentration and reaches a
maximum at 500 ppm of CP.
3) Polarization studies clearly revealed that all inhibitors acts as mixed-type inhibitors with
predominant anodic effectiveness in 1 M HCl medium.
4) AC Impedance plot of mild steel showed that as the inhibitor concentration is increased, the
charge transfer resistance will increase while the capacitance double layer values will decrease.
5) The results obtained from weight loss, polarization and impedance studies are in good
agreement.
6) SEM micrographs revealed the presence of a protective layer over the metal surface by the
inhibitors through an adsorption process which obey the Langmuir adsorption isotherm. The
ΔGads values of all inhibitors suggested that the inhibitors were adsorbed on the MS surface
mainly by physisorption.
7) Supporting the Mayer test, 1H-NMR and FTIR studies confirmed the presence of alkaloids in
the inhibitor that are related to the anticorrosion potential of the these green inhibitors.
ACKNOWLEDGMENTS
The authors are grateful to the MOSTI for the fellowship under National Science Fund (NSF) and
Universiti Sains Malaysia for the financial support from the Research University (RU) grant
(1001/PKIMIA 811143) and USM-RU-PRGS grant (1001/PKIMIA/833035).
References
1. H.H. Uhlig and R.W. Revie, Corrosion and corrosion control, Wiley, New York (1985).
2. H.A. Sorkhabi, D. Seifzadeh and M.G. Hosseini, Corros. Sci., 50 (2008) 3363.
3. F. Farelas and A. Ramirez, Int. J. of Electrochem. Sci., 5 (2010) 797.
4. X. Joseph Raj and N. Rajendran, Int. J. Electrochem. Sci., 6 (2011) 348.
5. P.K. Gogoi and B. Barhai, Int. J. Electrochem. Sci., 6 (2011) 136.
6. M.A. Quraishi and D. Jamal, J. Appl. Electrochem., 32 (2002) 425.
7. M. Elayyachy, A. El Idrissi and B. Hammouti, Corros. Sci., 48 (2006) 2470.
8. K.C. Emregül and M. Hayvalí, Corros. Sci., 48 (2006) 797.
9. B. Mernari, H. Elattari, M. Traisnel, F. Bentiss and M. Lagrenee, Corros. Sci., 40 (1998) 391.
10. L. Wang, Corros. Sci., 43 (2001) 2281.
11. M.E. Azhar, M. Mernari, M. Traisnel, F. Bentiss and M. Lagrenee, Corros. Sci., 43 (2001) 2229.
12. W. Li, Q. He, C. Pei and B. Hou, Electrochim. Acta, 52 (2007) 6390.
13. W. Li, X. Zhao, F. Liu and B. Hou, Corros. Sci., 50 (2008) 3261.
14. S. Ramesh, S. Rajeswari and S. Maruthamuthu, Mater. Lett., 57 (2003) 4547.

Int. J. Electrochem. Sci., Vol. 6, 2011
3016
15. E. Stupnisek-Lisac and S. Podbrscek, J. Appl. Electrochem., 24 (1994) 779.
16. K. Srivasthava and P. Srivasthava, Corros. Prev. Control, 27 (1980) 5.
17. R.M. Saleh, A.A. Ismail and A.A. El-Hosary, Corros. Prev. Control, 31 (1984) 21.
18. B.C. Jain and J.N. Gour, J. Electrochem. Soc., 27 (1978) 165.
19. M. Dahmani, A. Et-Touhami, S.S. Al-Deyab, B. Hammouti and A. Bouyanzer, Int. J.
Electrochem. Sci., 5 (2010) 1060.
20. M. Lebrini, F. Robert and C. Roos, Int. J. of Electrochem. Sci., 5 (2010) 1698.
21. J. Sinclair, A Revesion of Malayan Annonaceae, Gardens Bull., Singapore (1955).
22. K. Mat-Salleh and F. Ahmad, Proceedings of the Seminar on Malaysian Traditional Medicine,
Kuala Lumpur (1988).
23. M. Kamaliah, A.H.A. Hadi and K. Shaari, Malaysian Journal of Science, 12 (1990) 53.
24. S. Martinez and M. Metikos-Hucovic, J. App. Electrochem., 33 (2003) 1137.
25. Y. Yan, W. Li, L. Cai and B. Hou, Electrochim. Acta, 53 (2008) 5953.
26. J. Cruz, T. Pandiyan and E.G. Ochoa, J. Electroanal. Chem., 8 (2005) 583.
27. D.F. Roeper, D. Chidambaram, C.R. Clayton and G.P. Halada, Electrochim. Acta, 53 (2008) 2130.
28. Y. Tang, X. Yang, W. Yang, R. Wan, Y. Chen and X. Yin, Corros. Sci., 52 (2010) 1801.
29. E. Mc-Cafferty and N. Hackerman, J. Electrochem. Soc., 119 (1972) 146.
30. M.A. Quraishi and R. Sardar, J. Appl. Electrochem., 33 (2003) 1163.
31. P. Bommersbach, C. Alemany-Dumont, J.P. Millet and B. Normand, Electrochim. Acta, 51 (2005)
1076.
32. A.V. Benedetti, P.T.A. Sumodjo and K. Nobe, Electrochim. Acta, 40 (1995) 2657.
33. H. Ashassi-Sorkhabi, D. Seifzadeh and M.G. Hosseini, Corros. Sci., 50 (2008) 3363.
34. M.A. Quraishi, A. Singh, V.K. Singh, D.K. Yadav and A.K. Singh, Materials Chemistry and
Physics, 122 (2010) 114.
35. Z. Tao, S. Zhang, W. Li and B. Hou, Corros. Sci., 51 (2009) 2588.
36. A.Y. El-Etre, M. Abdullah and Z.E. El-Tantaury, Corros. Sci., 47 (2004) 385.
37. M.G. Hosseini, S.F.L. Mertens and M.R. Arshadi, Corros. Sci., 45 (2003) 1473.
38. L. Larabi, Y. Harek, O. Benali and S. Ghalem, Progress in Organic Coatings, 54 (2005) 256.
39. P. Lowmunkhong, D. Ungthararak and P. Sutthivaiyakit, Corros. Sci., 52 (2010) 30.
40. A.M. Abdel-Gaber, B.A. Abd-El-Nabey and M. Saadawy, Corros. Sci., 51 (2009) 1038.
41. S.A. Umoren, Y. Li and F.H. Wang, Corros Sci., 52 (2010) 1777.
42. F. Bentiss, M. Lebrini, M. Lagrenee, M. Traisnel, A. Elfarouk and H. Vezin, Electrochim. Acta,
52 (2007) 6865.
43. L.P. Donald, M.L. Gary, S.K. George and R.V. James, Introduction to spectroscopy, Brooks/Cole,
United State (2009).
44. D. Schweinsgberg, G. George and H. Nishihara, J. Electrochem. Soc., 137 (1990) 1354.
45. Z.A. Iofa, V.V. Batrakov and Cho-Ngok-Ba, Electrochim. Acta, 9 (1964) 1645.
46. A. Frignani, F. Zucchi and C. Monticelli, Br. Corros. J., 18 (1983) 19.
47. P.B. Raja and M.G. Sethuraman, Mater. Lett., 62 (2008) 113.
48. J.O. Bokris and D.A.J. Swinkels, J. Electrochem. Soc., 11 (1964) 736.
49. G. Trabenelli and F. Mansfeld (Eds.), Corrosion Mechanisms, Marcel Dekker, New York (1987).
© 2011 by ESG (www.electrochemsci.org)