corrosion and corrosion inhibition of mild steel in h2so4 ... · weight a certain amount (about 500...
TRANSCRIPT

www.ccsenet.org/ijc International Journal of Chemistry Vol. 2, No. 2; August 2010
ISSN 1916-9698 E-ISSN 1916-9701 54
Corrosion and Corrosion Inhibition of Mild Steel in H2SO4 Solutions by Zizyphus Spina-Christi as Green Inhibitor
Aisha M. Al- Turkustani
King Abdulaziz University, Girls College of Education Chemistry Department, Jeddah KSA
E-mail: [email protected]
Sanaa T. Arab King Abdulaziz University, Girls College of Education
Chemistry Department, Jeddah KSA E-mail: [email protected]
Areej A. Al- Reheli
Tabook University, Chemistry Department, Tabook KSA E-mail: [email protected]
Abstract The corrosion and corrosion inhibition of mild steel in 1.0 M H2SO4 containing 10% ethyl alcohol(EtOH) by Zizyphus Spina-Christi (ZSC) extracts (aqueous extract and alcoholic extract) has been studied using chemical techniques( hydrogen evolution(HE) and mass loss(ML)) and electrochemical techniques(electrochemical impedance spectroscopy(EIS) and potentiodynamic polarization(PDP)). The effect of acid concentration on the corrosion rate of mild steel increases with acid concentration (0.25-1.5) M showing first order corrosion reaction without changing the reaction mechanism, and the results showed that when the concentration of ZSC extracts (aqueous extract and alcoholic extract) increased the rate of steel corrosion is decreased, which indicates that the inhibition of the corrosion process is produced. Electrochemical impedance spectroscopy results showed that the corrosion and corrosion inhibition of steel occurred mainly by charge transfer. The electrochemical results of polarization also showed that the extracts of ZSC plant act as mixed type inhibitors, they retarded both cathodic and anodic reaction. The experimental results from chemical and electrochemical studies were fit Langmuir isotherm. Values of equilibrium constant of adsorption Kads and the standard free energy of adsorption o
.adsGΔ , for the extracts are calculated. Keywords: Corrosion, Inhibition, Mild steel, Zizypus Spina-Charisti, Acids, Sulphuric acid 1. Introduction Acid solutions are generally used for the removal of rust and scale in several industrial processes. Sulphuric acid is often used as a pickling acid for steel and its alloys (Bentiss et. al., 1999). Mild steel is employed widely in most industries due to its low cost and availability in ease for the fabrication of various reaction vessels such as cooling tower tanks, pipelines, etc.( Ramesh et. al., 2003). inhibitors are (Vasanth, 2009): substance which retards substances which retard the cathodic processes and / or the anodic processes, that inhibitors function in one or more ways to control corrosion: by adsorption of a thin film onto the surface of a corroding material, by inducing the formation of a thick corrosion product, or by changing the characteristic of the environment resulting in reduced aggressiveness. Inhibitors are generally used in these processes to control the metal dissolution. Acid inhibitors are essentially used in metal finishing industries, acidizing of oil wells, cleaning of boilers and heat exchangers (Khaled, 2003). Corrosion of metals is a serious environmental problem that has been given adequate attention in the oil and gas industries because, during industrial processes such as acid cleaning and etching, metal surfaces are often made to come in contact with acidic medium, indicating that the use of inhibitors is necessary (Abdallah, 2005; Anauda et.al., 2005; Ashassi-Sorkhabi et.al., 2006). Although there are numerous options for controlling the corrosion of metals, the use of inhibitors is one of the best methods for protecting metals against corrosion. An

www.ccsenet.org/ijc International Journal of Chemistry Vol. 2, No. 2; August 2010
Published by Canadian Center of Science and Education 55
inhibitor can be chosen from compounds that have hetero atoms in their aromatic ring system or synthesized from cheap raw materials (Chetounani et.al., 2004; Bouyanzer and Hammouti,2004; Ebenso et.al.,2004; Bendahou et.al., 2006; Eddy, 2008). However, the problem of finding an inhibitor that has little or no impact on the environment has attracted numerous researches in recent times (Eddy, 2008). Green or safe corrosion inhibitors are biodegradable and do not contain heavy metals or other toxic compounds (Eddy, 2009). Most green corrosion inhibitors are obtained from ethanol, aqueous, acid, methanol, or formaldehyde extract of plant materials (Odiongenyi et.al., 2009). The successful use of naturally occurring substances to inhibit the corrosion of metals in acidic and alkaline environments has been reported by some research groups (El-Etre , 2003; Chetounani et.al., 2004; El-Etre et.al., 2005; Bendahou et.al., 2006; El-Etre, 2006; Ebenso et.al., 2008; *Eddy et.al., 2008; **Eddy et.al., 2008; ***Eddy et.al., 2008; Odoemela and ****Eddy, 2008; Ebenso et.al., 2009). However, the use of aqueous extract and alcoholic extract of Zizyphus Spina-Christi (ZSC) plant as a green inhibitor has not been reported elsewhere. Therefore the objective of the present study is aimed at investigating inhibitive and adsorption properties of aqueous and alcoholic extracts of Zizyphus Spina-Christi leaves for the corrosion of mild steel in H2SO4. Zizyphus Spina-Christi plant belongs to the Rhamnaceae subfamily (Fig. (1)), this plant have been successfully used for numerous medicinal applications including internal use (Adzu et.al., 2001). Also, in Saudi Arabia it use to treat ulcers, wounds, eye diseases and bronchitis, which is a diuretic and the reduce of fever (Dweek, 2005). Zizyphus Spina-Christi(ZSC) leaves contains on the sugars and several organic compounds such as glucose, fructose, Ramnoz, Sabonin and Glicosed (Mahran et.al., 1996), and main components of the plant installers alpha Trbinol and contains alkaloids and also it have a high percentage of flavonoids (0.66%), Table (1) illustrate the chemical composition of some of the most important components of Zizyphus Spina-Christi(ZSC) plant. 2. Experimental 2.1 Materials preparation Mild steel of the composition (wt%) as: Mn(0.275), Ni(0.015), Pb(0.004), Al(0.077) and Fe(99.629) was used for the study. The sample was polished using a series of emery paper up to 1200 grade. It washed thoroughly with deionized water and dried with acetone and with a stream of air. All reagents used (H2SO4 and KCl) for the study were analar grade and deionized water was used for their preparation. Preparation of Zizyphas Spina-Christi (ZSC) Extracts (Inhibitor) The leaves of ZSC plant was collected from trees in Jeddah city KSA, it has been purified from the impurities and then washed with deionized water and left to dry in the air for two days. The aqueous extract and alcoholic extract of the plant were prepared as follows: 1. Weight a certain amount (about 500 grams) of dried leaves of the plant and was crushed in an electric mixer, then add to it the appropriate solvent (deionized water or ethyl alcohol) and heat until boiling, the mixture is cooled for 24 hours and then be feltrated. 2. Extraction is repeated several times from the same pool, so extract collect and dried in the air to be concentrated and deposited to the least possible amount of solvent used. 3. The extract was collect after concentrated it and placed in a standard flask 250 ml capacity and complete to the mark with the appropriate solvent and therefore is a solution study. 2.2 Corrosion Measurements Two kinds of measurements were used these are: 2.2.1 Chemical measurement Hydrogen evolution (HE) and weight loss (ML) were carried out as described elsewhere (Mylius and Niethen, 1957). 2.2.2 Electrochemical measurement Impedance and polarization measurements have been performed with an ACM Gill AC instruments using a platinum foil as the auxiliary electrode. The electrode potential was measured against a saturated calomel electrode (SCE). Details of the experimental procedure, electrolytic cell and electric circuits have been fully described (Ateya et.al., 1981; Zaafarany; 2009). The percentage inhibition efficiencies (Inh.%) were calculated using the following equations from chemical methods (HE and ML), respectively:

www.ccsenet.org/ijc International Journal of Chemistry Vol. 2, No. 2; August 2010
ISSN 1916-9698 E-ISSN 1916-9701 56
Inh.HE % = (1- R / R₀) 100 (1) Inh.ML % = (1- R` /R`₀ ) 100 (2)
Where R₀, R`₀ , R and R` are the corrosion rates without and with inhibitor, respectively. Also, inhibition efficiencies from electrochemical methods (EIS and PDP), are respectively:
(4)
Where R-1ct₀, i⁰corr., R-1
ct and icorr. are charge transfer and corrosion current without and with inhibitor, respectively. 3. Results and Discussion 3.1 Effect of Sulfuric Acid Concentration Containing 10% EtOH on Mild Steel Corrosion at 30°C. 3.1.1 Chemical Study The influence of H2SO4+10%EtOH concentrations (0.25M, 0.5M, 1.0M and 1.5M) on mild steel corrosion at 30⁰ C is shown in Figure (2). It is clear that as the concentration of the H2SO4 solution increases, the slop of the straight lines also increases, indicating an increase in the dissolution of mild steel, e.g. increases of corrosion rate. The ideality of the straight lines in Figure (2) indicates the absence of any insoluble formed layer on the surface of the metal through the process of corrosion. The presence of induction period in the beginning of the interaction indicates the dissolution of the oxide layer formed on the surface of mild steel. The decrease of induction period in the beginning of the interaction with increasing acid concentration is detected. The rates of corrosion from HE and ML methods (R & R`) are recorded in Table (2), it is found that the rates of corrosion increases with increasing acid concentration, this indicates that steel corrosion in H2SO4 is concentration dependent. The relation between corrosion rate and acid concentration can be illustrate by the kinetic equation as: Where A represents corrosion rate constant which represents the rate of metal dissolution (corrosion), n reaction order and C molar concentration of H2SO4 acid. The relationship log R and / or log R' Vs. log C gave a straight lines as in Figure (3). The slopes of these lines represent the reaction order (n) and the intercept is log A,. It was found that the value of n is equal to unity indicating that corrosion of mild steel in H2SO4 solution is the first order reaction depends on the concentration of H2SO4 acid. 3.1.2 Electrochemical Study 3.1.2.1 Electrochemical impedance spectroscopy measurements (EIS) Figure (4) shows electrochemical impedance spectra (Nyquest plots) at open circuit potential for mild steel corrosion in different concentrations of H2SO4 containing 10% EtOH at 30º C. It gives one capacitive loop at high and med frequencies with the presence an inductive loop at low frequencies. This study allow the separation of charge transfer and diffusion process and describe the processes at the surface and also, calculate the charge transfer resistance and adsorption process (Kendig et.al., 1986; Mcdonald, 1987). As shown from Figure (5a) a good agreement between the theoretically calculated values of impedance and recorded laboratory values with a relatively low error. Also, Figure (5b) shows the equivalent electrical circuit of the system under study, which consists of [Rs (Cdl Rct (QR)] using the Setup - ZSimDemo-322 program. The electrochemical impedance parameters, solution resistance (Rsol.), double layer capacitance (Cdl.) and constant phase element (Q) were calculated and recorded in Table(3). The resistance element with constant phase is given from equation: Where CPEZ electrode resistance, Q the combination properties of items associated with each surface, electrically active, and does not depend on the frequency, n is constant value in the range -1 ≤ n ≤ 1. It should be noted that when n is greater value, the more complete and closed of capacitive circuits and the surface is homogeneous, if n value is small this means that the capacitive circuit unclose this will lead to a diffusion control and the surface is not homogeneous, J is imaginary number = -1 and ω is the angular frequency value of the imaginary part at the highest of the impedance is equal to = 2πf (Hosseini et.al., 2003). It is clear from Table (3) that: • The decrease of the relative capacitive circuit from their axes attributed to frequency disturbance as a result of the
100)/1(%. ..ocorrcorrp iiInh −=
100)/1(%. 11 −−−=οctctR RRInh
ct(3)
CnAR logloglog += (5)
1])([ −= nCPE JQZ ω (6)

www.ccsenet.org/ijc International Journal of Chemistry Vol. 2, No. 2; August 2010
Published by Canadian Center of Science and Education 57
heterogeneity of the surface of steel sample under study (Metikos- Hukovic et.al., 1994). • The presence of capacitive loops show that the process of corrosion is under charge transfer control, i.e., under activation control (Muralidharan, 1993; Ashassi- Sorkhabi, and Seifzadeh, 2006), where it is noted that by increasing acid concentration the radii of the circuit decrease (Rct decrease) while increasing the value of CdI due to the increase in the concentration of active species such as H+ at the electrode surface with increasing acid concentration, which lead to increase the charge transfer process at the electrical double layer. • The value of n at all concentrations close to unity and diffraction of the unit due to the dispersion in the frequency of a fixed timetable which is a result to the heterogeneity in the electrical items that presence on the metal surface. 3.1.2.2 Potentiodyanamic polarization measurements (PDP) Figure (6) shows the effect of H2SO4 concentration containing 10% EtOH on the cathodic and anodic polarization behavior of mild steel at 30⁰C. It is clear that the increasing in acid concentration lead to displacement both cathodic and anodic curves to high current densities with the shift in corrosion potential to more positive values (noble potentials). Table (4) gives the values of corrosion potential (Ecorr.), corrosion current (Icorr.), cathodic (βc) and anodic (βa) Tafel slopes for mild steel corrosion at the different concentrations of H2SO4. The results will be interpreted as: • A regular increase in corrosion current density Icorr. (acceleration of corrosion) with increase acid concentration, as illustrated in Figure (7a) the dependence of Icorr. on the concentration of the acid according to the following equation (Murthy and Dwarakadasa, 1995): Where a and b are constants depend on the characteristics and properties of sample surface. • The displacement in Ecorr. to more positive (less negative) values as increase of acid concentration indicate on the contribution of each of the cathodic and anodic process in the process of corrosion, where the increase in Ecorr. values indicate that the corrosion of mild steel in H2SO4 solutions containing 10% EtOH is under the anodic control (Uhlig, 1971). Figure (7b) gives the relationship between the Ecorr. and logC according to the following equation (Beccaria and Poggi, 1986): where E⁰
corr. represents corrosion potential when the concentration of acid equal to unity, R universal gas constant, T temperature in Kelvin, n the number of electrons, F Faraday constant = 96500 coulomb and C concentration, it has been found that the value of n = 9.1338×10⁻². The plots of Icorr.and/or Ecorr.Vs. log C of acid give a straight lines with correlation coefficient equal to 92.27 and 96.91, respectively and the line indicates to the corrosion of mild steel depend on acid concentration. 3.2 Effect of Zizyphus Spina-Christi (ZSC) on mild steel corrosion in 1.0 M H2SO4 containing 10% EtOH at 30⁰C 3.2.1 Chemical Study Dissolution of iron (mild steel) metal which occurs at the anode is spontaneous process, while, the cathodic process under these conditions, in presence of sulfuric acid, is represented by the reduction reaction is hydrogen gas evolution as in the equation: Where Hads.is hydrogen ions adsorbed on metal surface which catalyze to react with another hydrogen ions to contain covert hydrogen gas in bubble form on cathode surface. The amount of hydrogen gas evolved in presence of inhibitor depends on its ability to prevent this reaction and protected the metal from corrosion (Oguzie, 2005). Figures (8 and 9) show the variation of hydrogen volume evolved as a function of time when immersion of mild steel sample in 1.0 M H2SO4 containing 10% EtOH in presence of aqueous extract (Fig.(8)) and alcoholic extract (Fig.(9)) of ZSC plant at 30⁰C, respectively. A straight lines in all figures were obtained. The presence of an induction period which it is necessary to begin the metal dissolution and the evolution of hydrogen gas is found. It is clear that the induction period increased with concentration of aqueous extract and /or alcoholic extract increase, i.e., reduction in the corrosion rate, but in the case of alcoholic extract after concentration 5%v/v, the induction period become less, this means that is increased in corrosion rate of mild steel sample. Also mass loss measurements give a similar behavior to the measurements of hydrogen gas, this behavior indicates to the high
42log. SOHcorr CbaI += (7)
CnFRTEE corrcorr log)/303.2(.. += o (8)
(9) 2222 HHeH ads →→++

www.ccsenet.org/ijc International Journal of Chemistry Vol. 2, No. 2; August 2010
ISSN 1916-9698 E-ISSN 1916-9701 58
ability of the extracts to inhibit the corrosion of mild steel under study and the efficiency of inhibition depends on the concentration of aqueous extract and alcoholic extract of ZSC plant. Tables (5 and 6) give corrosion rates (Rcorr.) and inhibition efficiency (Inh.%) calculated from HE and ML methods. It is clear from the Tables that there are a decrease in the corrosion rate (increase in Inh.%) by increase the concentration of aqueous extract and alcoholic extract of ZSC leaves and made a more effective equal 91.24 from MLM and 92.62 from HEM, respectively at the concentration 20.0%v/v of the aqueous extract, whereas alcoholic extract (Table(6)) gives corrosion rates which decrease as increase in concentration of the extract until it reaches to 5.0%v/v, after that an increase in the rate of corrosion will occur by increase the concentration of the extract lead to more less but the inhibition efficiency still high (around 90 % ) . The increase in the Inh.% by increase concentration of the extract may attributed to a dissolved complexes as a result of the interaction of components of the aqueous extract and / or alcoholic extract of the ZSC plant with mild steel surface and adsorbed on the surface of the sample, leading to increase the inhibition efficiency as concentration of the extract increased, where the adsorption of these complexes lead to block most of the active centers on the surface of the mild steel sample and thereby increasing the surface coverage (Orubite and Oforka, 2004; El-Etre, 2006; Arab, 2008). But at high concentrations of alcoholic extract of ZSC plant, the complexes formed on mild steel surface become soluble complexes in solution, leading to less coverage of the surface of mild steel sample and to less inhibition efficiency. 3.2.2 Electrochemical Study 3.2.2.1 Electrochemical impedance spectroscopy measurements (EIS) Figures (10 and 11) show electrochemical impedance spectra of mild steel under study at the open circuit potential in 1.0 M H2SO4 solution containing 10% EtOH at 30ºC in the presence of different concentrations of aqueous extract and alcoholic extract of the ZSC plant, respectively. It is clear from the figures that the presence of a capacitive loops at the low frequencies accompanied by the spread of diffusion tail at the high concentrations of the extracts especially in aqueous extract. Table (7) gives the electrochemical impedance parameters, Rct, n, CdI and Inh.% of mild steel sample in 1.0 M H2SO4 containing 10% EtOH in the absence and the presence of different concentrations of aqueous extract and alcoholic extract of ZSC plant, and the results interpreted as: • The presence of organized capacitive circles in the absence and presence of different concentrations of aqueous and alcoholic extracts of ZSC plant indicates that the mechanism of corrosion of mild steel sample is under charge transfer control and the presence of the two extracts of ZSC plant did not change the mechanical of corrosion (Metikoš- Hukovi and Babic, 1998; Larabi et.al., 2004; Bentiss et.al., 2005). • The radii of the capacitive circles increased by increasing the concentration of the two extracts, which means that the increase in charge transfer resistance (Rct), indicating that a thin layer of extract molecules formed and adsorbed on the metal surface, so the increase of the corrosion inhibition for mild steel sample under study will occurred. The increase the electrical double layer capacity (CdI) with increase the concentration of the extracts by adsorption the components of ZSC plant on the surface of mild steel sample, which leads to reduced thickness of the charged double layer on the surface of mild steel (Aramaki et.al., 1987) is suggested. It is found that in the case of alcoholic extract, by increasing the concentration increase the value of charge transfer resistance (Rct), until it reaches to 7.0% v/v after this, the increase in the concentration of alcoholic extract lead to decrease in Rct value, where this concentration called the critical concentration. • The appearance of diffusion tail in the presence of high concentrations of aqueous extract indicates, the formation of a porous layer from extract components (Chen et. al., 2000) with a degree of protection depends on the porosity of this layer. The pores control in the spread of ions to and from the metal surface, this is expected to be less porosity with increasing concentration of the extract. Figure (12) represents schematic diagram of the porosity layer of inhibitor which cover up the surface of the metal. To simulate the electrochemical processes that occur at the interface metal / inhibitor layer / electrolyte solution, impedance data processing by software simulation results, where it is found that the type of the proposed circuit depends on the concentration of the extract as follows: 1 - Figure (13a) illustrates a good match between the theoretically calculated values of impedance and recorded laboratory with a relatively low error. Figure (13b) shows equivalent electrical circuit of the system under study, which consists of [Rs (CdI Rct (QR)] where: (A) at concentrations [0.2-10.0]%v/v of the aqueous extracts. (B) at all concentrations under study of the alcoholic extract.

www.ccsenet.org/ijc International Journal of Chemistry Vol. 2, No. 2; August 2010
Published by Canadian Center of Science and Education 59
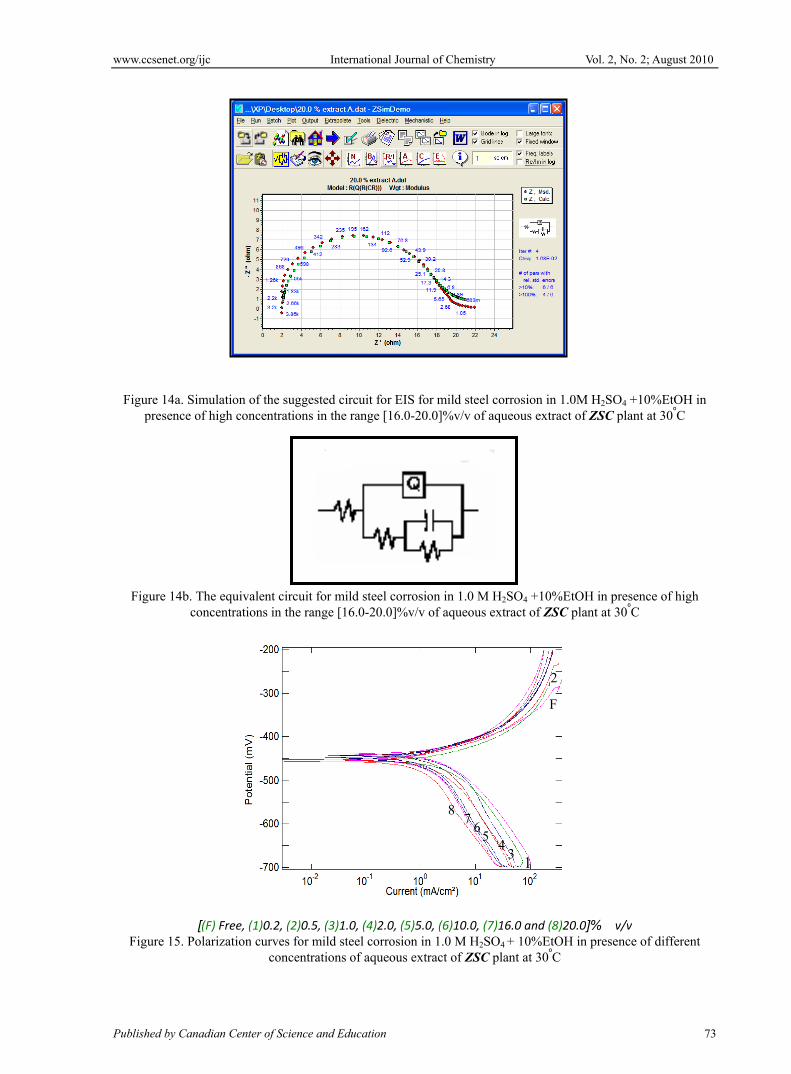
2 - Figures (14a) and (14b) show the equivalent electrical circuit, which consists of Rs [Q (Rct (CdI R))] for the corrosion inhibiting systems at high concentrations [16.0-20.0]%v/v of aqueous extract of ZSC plant, where it can be seen from Figure (17b) that the presence of a cell composed of (R and (CdI are responsible for the corrosion process called cell corrosion. 3.2.2.2 Potentiodynamic polarization measurements (PDP) Figures (15 and 16) show the cathodic and anodic polarization curves for mild steel corrosion in 1.0 M H2SO4 containing 10% EtOH in the absence and the presence of different concentrations of aqueous extract and alcoholic extract of ZSC plant at 30ºC, respectively. It is noted that the addition of increasing concentrations of the extract accompaniment by a parallel shift for each of cathodic and anodic polarization curves towards the areas with low current densities. As shown in Table (8), the values of corrosion potential (Ecorr), corrosion current (Icorr.) and Tafel slopes (βc and βa) for mild steel in absence and presence of different concentrations of the two extracts of ZSC plant, the results are interpreted as follows: • Ecorr shifted to more negative values and / or less negative in irregular way, this shift in cathodic and anodic curves show that the extracts under study acts as mixed inhibitors to control both the cathodic and anodic reactions. • The inhibition efficiency (Inh.%) increases (lower rates of corrosion) in the case of aqueous extract of ZSC plant with increasing the concentration, it gives the highest percentage of inhibition equal to 64.06% at a concentration 20%v/v, whereas in the case of alcoholic extract the inhibition efficiency increase with increasing the concentration up to 5.0%v/v (critical concentration), where the percentage of inhibition is equal to 87.11% after that the decrease inhibition efficiency occurs with increasing the concentration of alcoholic extract, this means, an increase in corrosion rates, i.e., the inhibition efficiency increase with increasing concentration of the extract to reach the critical concentration and then decreased with the increase of concentration. The decrease in the corrosion rate can explain to the inhibition efficiency of aqueous extract and alcoholic extract of ZSC plant on the cathodic part of polarization curves through the reduction of hydrogen ions H+ and also its effectiveness on the anodic part due to adsorption of the extract components on the surface of mild steel sample which contain a barrier hinders the process of hydrogen gas evolution and metal dissolution (Arab and Emran, 2008). • Table (8) shows that, Tafel slopes βc and βa have values which is almost constant in both extracts (aqueous and alcoholic) do not differ from those observed in uninhibited solution and can be explained by the fact that the component particles of the extracts are adsorbed on the active centers on mild steel surface by simple mechanical block (Abdel-Gaber et.al., 2006). No change in the corrosion mechanism by adding different concentrations of the inhibitor is suggested, this has been found in a previous study (S. Rengamani, 1993). Tables (9 and 10) illustrate the inhibition efficiencies (Inh.%) for mild steel corrosion in 1.0 M H2SO4 containing 10% EtOH in absence and presence of different concentrations of the extracts of ZSC plant at 30ºC from different techniques. It is clear that simple differences between Inh.% calculated from the chemical and electrochemical methods due to that the chemical measurements give an intermediate average corrosion rates while the electrochemical measurements give an instantaneous corrosion rates (Rengamani et.al., 1993; Arab et. al., 2005). As shown from Table (10) that the highest percentage of inhibition were recorded at a concentration of 5.0%v/v of the alcoholic extract from chemical measurements (HE and ML) and from polarization measurements (PDP) and at concentration 7.0%v/v from impedance measurements (EIS) due to the different methods of measurement. 3.3 Adsorption Isotherm The inhibition process in an acid environment occurs by appropriate adsorption of inhibitor molecules or components of the extract under study at the interface metal / solution and the adsorption process occurs as a result of the existence of electrostatic attraction between: 1. Metal-charged and the particles of charged inhibitor. 2. The polar interaction between uncharged inhibitor molecules with the metal. 3. Interaction of the type π with the metal. 4. All of the above (Schweinsberg et.al., 1988). The adsorption process depends on the electronic structure of the inhibitor (molecules of extract), the nature of metal surface, reaction temperature and the number of active centers on the surface (Abdel-Gaber et. al., 2006). The decrease in corrosion rate of mild steel under study by adding the studied extracts of ZSC plant due to the adsorption of components of the extract on the metal surface or to form a protective barrier layer which separate

www.ccsenet.org/ijc International Journal of Chemistry Vol. 2, No. 2; August 2010
ISSN 1916-9698 E-ISSN 1916-9701 60
the surface of the mild steel sample and the center of corrosion (Rengamni et.al., 1994; Muralidharan et. al., 1995). The adsorption process can be described by two main types of interactions: physical adsorption and chemical adsorption, or both, the type of adsorption depends on the nature and charge of the metal, structure of the extract and the type of electrolyte solution (Bentiss et.al., 1999). Figure (17) illustrates the relationship between Inh.% deduced from different methods and the logarithm of the concentration of the studied extracts.The figure shows an adsorption curves with S-shape adsorption isotherm, which indicates that the interaction takes place in one step attributed to the formation of a single layer of extract molecules adsorbed on mild steel surface in the case of aqueous extract. But in the case of alcoholic extract the curve indicated that the adsorption will occur in two steps, because the alcoholic extract contains a large number of active substances are extracted from ZSC plant with alcohol that are more than that in the case of aqueous extract, since it is possible that adsorb some small molecules on mild steel surface followed by adsorption of flavonoid compounds and alkaloids of large size. In the case of aqueous extract the waxes, and sugars found in ZSC plant will be extracted and these materials would reduce the inhibition effectiveness. The decrease of inhibition efficiency in the case of alcoholic extract after critical concentration due to the presence of organic compounds in alcoholic extract, which form a fixed complexes and/ or less stable have an oxidative property (Donahue and Nobe, 1967), and it is clear that at low concentrations of the alcoholic extract the inhibition efficiency increase with increasing the concentration of extract which is proposed to be an insoluble complex adsorbed on mild steel surface, leading to more inhibition efficiency with increasing the concentration of the extract under study, this complex lead to block most of the active centers on mild steel surface, thereby increasing the surface coverage. In contrast, at high concentrations of alcoholic extract, the complex formed becomes dissolved in the solution as a result of the accumulation of a large number of molecules, leading to less surface coverage, and reduced the inhibition efficiency (Frignani, 1965). The assumption that the process of adsorption is the process of replacing between extract molecules and water molecules on the electrode surface is as follows (Bockris, J.O'M. and Swinkels, 1964; Bastidas, 2000): Where Ex(sol) and Ex(ads) refer to the extract molecules in solution and extract molecules adsorbed on the metal surface, respectively, H2O(ads)water molecule adsorb on the metal surface and X is the number of water molecules which replaced by one molecule of the extract. For more information on the electrochemical mechanical interaction is essential to select an appropriate adsorption isotherm. The application of the results obtained it give a straight line as shown in figures (18) and (19) and by applying the following relation (Langmuir) (Tsure et.al., 1978; . Oguzie et.al., 2004):
(12) where C represents the concentration of extract, Θ degree of surface coverage and Kads equilibrium constant of adsorption which related to free energy of adsorption by the following equation (Rengamni et.al., 1994; Muralidharan et.al., 1995; Bockris and Swinkels, 1994; Bastidas, 2000):
WhereOHC
2 is the molar concentration of water molecules at the interface between the electrode surface and the
solution and the energy in this case known as the standard free energy o.adsGΔ , R universal gas constant is equal to
8.314 J.mol-1 and T temperature in Kelvin.
Tables (11 and 12) represent the results derived from the application of Langmuir relationship 1−ΘinhC Vs. .inhC
where the adsorption parameters are recorded for the studied extracts of ZSC plant from different techniques. The results applied give linear correlation coefficients close to one which confirms that the adsorption of the
.1
.1
inhads
inh CK
C +=Θ −
.)(2)(.)(2.)( soladsadssol OHExOXHEx +⇔+ (10)
)1/( .inhinh KCKC +=Θ (11)
)/exp(1..
2
RTGC
K adsOH
ads Δ−= (13)

www.ccsenet.org/ijc International Journal of Chemistry Vol. 2, No. 2; August 2010
Published by Canadian Center of Science and Education 61
extracts components on the surface of mild steel sample under study is the basic step in the process of inhibition,
the negative value of o.adsGΔ indicates that the adsorption process of inhibitor molecules on mild steel surface is
spontaneous.
By examining the chemical composition of Zizyphus Spina-Charisti plant, Table (1) shows that the extracts of this plant (aqueous and / or alcoholic) contain both alpha - Trbinol, alkaloids, flavonoids, Bepta alkaloid and glycosides. In view of these components it is clear that the majority of organic compounds containing oxygen or nitrogen atoms and all have pairs of free electrons, so these compounds will be able to adsorbe on mild steel surface through the free electrons on the oxygen atom and / or nitrogen atom. The occurrence of the adsorption of the compounds in the extracts on mild steel surface constitutes the barrier for mass and charge transfer, leading to reduced interaction between the sample with central corrosion and thus decrease the corrosion rate, moreover, these compounds may be form complexes with ions of iron (mild steel), causing the covering (lock) of anodic sites (microanodes) and/or cathodic sites (micocathodes) generated on the mild steel surface under conditions of corrosion and lead to disability soluble of iron. 4. Conclusion The following main conclusions are drawn from the present study: • The corrosion rate of mild steel increases with increasing H2SO4 acid concentration (0.25-1.5)M showing first order corrosion reaction without changing the reaction mechanism. • The concentration of extract increased the rate of steel corrosion is decreased, which indicates that the inhibition of the corrosion process is produced. • Electrochemical impedance spectroscopy results showed that the corrosion and corrosion inhibition of steel occurred mainly by charge transfer. • The electrochemical results of polarization also showed that the extracts of zizyphus Spina-Christi act as mixed type inhibitors, they retarded both cathodic and anodic reaction. • The experimental results from chemical and electrochemical studies were fit Langmuir adsorption isotherm. • Value of the standard free energy of adsorption o
.adsGΔ , for the extracts have negative sign which indicates that the adsorption process of inhibitor molecules on mild steel surface is spontaneous. References Abdallah, M. (2004). Portug. Electrochimica Acta, 22, 161. Abdel-Gaber, A.M., Abd-El-Nabey, B.A., Sidahmed, I. M., El-Zayady, A. M. and Saadawy. (2006). Corros. Sci., 48, 2765-2779. Adzu, B., Amos, S., Wambebe, C. and Gamaniel, K. (2001). Fitoterapia., 4, 344-350. Anauda, L., Sathiyanathan, R.A., Maruthamuthu, S.B., Selvanayagam, M.C., Mohanan, S.B. and Palaniswamy, N.B. (2005). Indian J. Chem. Tech, 12, 356. Arab, S. T., Al-Turkustani, A. M. and Al-Nami, S. Y. (2005). Mater. Sci. Res. Ind., 3, 99-110. Arab, S.T., Al-Turkustani, A. M. and Al- Dhahiri, R. H. (2008). J. Kore. Chem. Soc., 52, 281-294. Arab, S. T. and Emran, K. M. (2008). Mater. Lett., 62, 1022- 1032. Aramaki K., Hagiwara M. and Nishihara, H. (1987). Corros. Sci., 27, 487-497. Ashassi- Sorkhabi, H. and Seifzadeh, D. (2006). Int. J. Electrochem. Sci., 1, 92-98. Ashassi-Sorkhabi, H., Shaabani, B., Aligholipour, B. and Seifzadeh, D. (2006). Appl. Surf. Sci., 252, 4039. Ateya, B.G., Anadouli, B.E. and El-Nizamy, F.M. (1981). Bull. Chem. Soc., Japan, 54, 3157. Bastidas, J. J. Polo, E. Cano and G. Torres, (2000). J. Mater. Sci., 35, 2637- 2642. Beccaria, A. M. and Poggi, G. (1986). J. Br.Corros., 42, 470. Bendahou, M.A., Benadellah, M.B.E. and Hammouti, B.B. (2006). Pigment and Resin Technol, 35, 95. Bentiss,F., Lagrenee, M., Traisnel, M., J.C. Hornez. (1999). Corrosion Scicence, 41, 789. Bentiss, F., Lagrenee, M., Traisnel, M., Mernari, B. and Elattari, H. (1999). J. App. Electrochem., 29,

www.ccsenet.org/ijc International Journal of Chemistry Vol. 2, No. 2; August 2010
ISSN 1916-9698 E-ISSN 1916-9701 62
1073-1078. Bentiss, F., Lebrini, M. and Lagrene, M. (2005). Corros. Sci., 47, 2915- 2931. Bockris, J.O'M. and Swinkels, J.O'M. (1964). J.Electrochem. Soc., 111, 736-743. Bouyanzer, A. and Hammouti, B. (2004). Pigment and Resin Technol, 33, 287. Bouyanzer, A. and Hammouti, B. (2004). Pigment and Resin Tech, 33, 287. Chen Y., Hong T., Gopal, M. and Jepson, W. P. (2000). Corros. Sci., 42, 979- 990. Chetounani, A. , Hammouti, B. and Benkaddour, M. (2004). Pigment and Resin Technol, 33, 26. Donahue, M. F. and Nobe, K. (1967). J. Electrochem. Soc., 114, 1012. Dweek, A. C. (2005). FLS FRESC FRESH- Technical Editor. Ebenso, E.E., Ibok, U.J., Ekpe, U.J., Umoren, S., Ekerete, J., Abiola, O.K., Oforka, N.C. and Martinez,S. (2004). Trans. SAEST, 39, 117. Ebenso, E.E., Eddy, N.O. and Odiongenyi, A.O. (2008). Afri. J. Pure and Appl. Chem., 2, 107. Ebenso, E.E., Eddy, N.O. and Odiongenyi, A.O. (2009). Portug. Electrochimica Acta, 27(1),13. *Eddy, N.O., Ekwumemgbo, P. and Odoemelam, S.A. (2008). Inter. Journal Physical Sciences, 3, 1. **Eddy N.O., Odoemelam, S.A. and Akpanudoh, N.W. (2008). J. Chem. Technol., 4, 1. ***Eddy, N.O., Odoemelam, S.A. and Odiongenyi, A.O. (2008). J. Appl. Electrochem, DOI 10. 1007/s10800-008-9731. ****Eddy, N.O. (2008). Inhibition of corrosion of mild steel by some antibiotics, Ph.D. Thesis, University of Calabar. Eddy, N.O. and Ebenso, African, E.E. (2008). J. Pure Appl. Chem., 2(6), 1. Eddy, N.O. and Odoemelam, S.A. (2009). Pigment and Resin Technol, 38(2), 111. El-Etre, A.Y. (2003). Corros. Sci, 45, 2485. El-Etre, A.Y., Abdallah, M. and El-Tantawy, Z.E. (2005). Corros. Sci., 47, 385. El-Etre, A. Y. (2006). Appl. Surf. Sci., 252, 8521-8525. Frignani, A., Trabaneli, G., Zucchi, F. and Zucchini, M. (1975). Proceeding of the 4th Eur. Sym. on Corros. Inh. Univ. Ferrara, Italy, 3, 652. Hosseini, M., Mertens, S. F. L. and Arshadi, M. R. (2003). Corros. Sci., 45, 1473- 1489. Kendig M. W., Allen, A. T., Jeanjaquct, S. and Mansfeld, F. (1986). In Electrochemical Techniques for Corrosion Engineering, Ed. R. Badoian, NACE. Khaled, K.F. (2003). Electrochimica Acta, 48, 2493. Larabi, L. and Harek, Portug, Y. (2004). Electrochiem. Acta, 22, 227-247. Mahran, G.E.D.H., Glombitza, K.W., Mirhom, Harmann, Y.W., R. and Michel, C.G. (1996). Plant Medica., 62 163- 165. Mcdonald, J. R. (1987). Impedance Spectroscopy, John Wiley & Sons, New York. 37. Metikos- Hukovic, M., Babic, R., Grubac, Z. and Brinic, S. (1994). J.Appl. Electrochem., 24, 772- 778. Metikoš- Hukovi, M., and Babic, R. (1998). J. Appl. Electrochem., 28, 433- 439. Muralidharan, S., Quraishi, M. A. and Iyer, S. V. K. (1993). J. Portug. Electrochem. Acta., 11, 255. Muralidharan, S., Phani, K. L.N., Pitchumani, S., Ravichandran, S. and Iyer, S.V. K. (1995). J. Electrochem. Soc., 142 1478- 1483. Murthy, K. S. and Dwarakadasa, E. S. (1995). J.Br. Corros., 30, 111-115. Mylius, F. and Niethen, S. (1957). J. Amer. Chem. Soc., 79, 1966. Odiongenyi, A. O., Odoemelam, S. A. and Eddy, N. O. (2009). Portug.Electrochimica Acta, 27 (1), 33. Odoemelam, S.A. and Eddy, N.O. (2008). J. Surface Sci. Technol, 24, 1.

www.ccsenet.org/ijc International Journal of Chemistry Vol. 2, No. 2; August 2010
Published by Canadian Center of Science and Education 63
Oguzie, E. E., Okolue, B.N., Ebenso, E.E., Onuoha, G.N. and Onuchukwu, A. I. (2004). Mater. Chem. Phys., 87, 394-401. Oguzie, E. E. (2005). Pigment & Resin Technology, 34, 321-326. Orubite, K. O. and Oforka, N. C. (2004). Mater.Lett., 58, 1768-1772. Ramesh, S., Rajeswari, S. and Maruthamuthu, S. (2003). Materials Letters, 57, 4547. Rengamani, S., Vasudevan, T. and Iyer, J. (1993). Indian, J. Technol., 31, 519. Rengamni, S., Muralidharan, S.K., Ulandainalhan, M. and Iyer, S. V. K. (1994). J. Appl. Electrochem., 24, 355 -360. Schweinsberg, D., George, G., Nanayakkawa, A. and Steinert, D. (1988). Corros. Sci., 28, 33- 42. Tsure, T., Haruyama, S. and Gijutsu, B. J. (1978). Japan, Soc. Corros. Eng., 27, 573. Uhlig, H. H. (1971). Corrosion and Corrosion Control, 2nd Edn., John Wiley and Sons Inc. Vasanth, K.L. NACE. National Association of Corrosion Engineers, Paper# 233, Corrosion 96. Zaafarany,I. (2009). Por. Electrochemica Acta, 27(5), 631-643.
Table 1. The chemical composition of some of the most important components of Zizyphus Spina-Christi (ZSP) plant Table 2. Corrosion rates of mild steel (R, R') in different concentrations of H2SO4 +10% EtOH at 30º C
flavonoids
alkaloids
styrol
olenwic acid
Methyl palmetat
pharnecylaceton C
1.5 1.0 0.5 0.25 (M)
42SOHC
5.1886 3.7037 2.3743 0.9596 R×102 (ml.cm‐2.min.‐1)
11.112 7.2565 4.5607 1.9865 R'×105 (g.cm‐2.min.‐1)
O
O
H O
H
H
O
O H
H
O
O O
N
OCH3
O
HO
H H

www.ccsenet.org/ijc International Journal of Chemistry Vol. 2, No. 2; August 2010
ISSN 1916-9698 E-ISSN 1916-9701 64
Table 3. Electrochemical parameters obtained from impedance measurements for mild steel corrosion in different concentrations of H2SO4 +10% EtOH at 30º C Table 4. Polarization parameters for mild steel corrosion in different concentrations of H2SO4_10% EtOH at 30⁰C
‐βc (mV.dec.‐1)
βa (mV.dec.‐1)
Icorr. (mA.cm.‐2)
‐Ecorr (V) 42SOHC
(M)
69.20 54.63 3.629 0.512 0.25
109.9 73.55 5.369 0.489 0.50
86.80 40.10 15.17 0.450 1.00
146.8 71.43 17.21 0.446 1.50
Table 5. Corrosion rates and inhibition efficiency for mild steel sample in 1.0 M H2SO4+ 10% EtOH in the presence of different concentrations of aqueous extract ZSC plant at 30° C
n Q (Ω.-1cm.-2 s.n)
Rct (Ω.cm 2)
Cdl (μF.cm.-2)
Rsol.
(Ω.cm.-2) 42SOHC
(M)
0.659 6.796×10⁻⁴ 10.69 73.08 2.955 0.25
0.720 7.228×10⁻³ 6.190 132.7 3.084 0.50
0.948 2.358×10⁻³ 4.521 163.6 1.007 1.00
0.863 4.542×10⁻⁴ 2.729 231.4 1.296 1.50
Inhibition Effeciency Corrosion Rate CEx
(V/V%)
Inh.MLM% Inh.HEM% R'MLM×105
(g. cm.-2 min.-1)RHEM×102
(ml. cm.-2 min.-1) - - 7.256 3.704 0.0
22.36 24.85 5.633 2.783 0.2
35.10 36.90 4.709 2.337 0.5
50.86 52.51 3.656 1.759 1.0
63.28 63.76 2.664 1.342 2.0
66.29 64.40 2.4451.318 5.0
82.02 84.49 1.304 0.574 10.0
89.44 87.64 0.766 0.457 16.0 91.24 92.62 0.635 0.273 20.0

www.ccsenet.org/ijc International Journal of Chemistry Vol. 2, No. 2; August 2010
Published by Canadian Center of Science and Education 65
Table 6. Corrosion rates and inhibition efficiency for mild steel sample 1.0 M H2SO4 + 10% EtOH in the presence of different concentrations of alcoholic extract of ZSC plant at 30° C
Inhibition Effeciency Corrosion Rate CEx
(V/V%) Inh.MLM% Inh.HEM% R'MLM×105
(g. cm.-2 min.-1)RHEM×102
(ml. cm.-2 min.-1) - - 7.256 3.704 0.0
52.62 53.94 3.438 1.706 0.2
76.56 76.90 1.700 0.855 0.5
82.99 81.29 1.235 0.692 1.0
87.55 86.03 0.902 0.517 2.0
95.07 92.78 0.357 0.267 5.0
91.46 91.67 0.606 0.308 7.0
90.18 90.25 0.712 0.360 10.0
Table 7. Electrochemical impedance parameters for the corrosion of mild steel sample in of 1.0 M H2SO4 +10% EtOH in the absence and presence of different concentrations of aqueous extract (A) and alcoholic extract (B) of ZSC plant at 30º C
Inh. % )( 1−
ctR n Q
(Ω-1cm.-2 sn) Rct
(Ω.cm2) Cdl
(μF.cm.-2) Rsol.
(Ω.cm.-2) CEx
(V/V%)
Ext
ract
(A)
- 0.948 2.358×10⁻³ 4.521 163.6 1.007 0.0
31.02 0.875 2.287×10⁻³ 6.555 102.5 1.460 0.2
47.22 0.948 1.444×10⁻⁵ 8.566 96.26 1.232 0.5
53.59 1.000 1.228×10⁻⁴ 9.743 89.80 1.274 1.0
56.40 0.974 8.168×10⁻⁴ 10.37 85.43 1.311 2.0
61.29 0.820 2.114×10⁻³ 11.68 75.24 1.680 5.0
69.26 0.821 1.145×10⁻⁴ 14.71 60.27 1.542 10.0
76.51 0.221 4.179×10⁻³ 19.25 47.87 0.442 16.0
80.51 0.800 7.472×10⁻³ 23.20 46.68 0.824 20.0
59.15 0.798 4.096×10⁻⁴ 11.07 109.8 1.826 0.2
Ext
ract
(B)
75.99 0.835 1.910×10⁻⁴ 18.83 52.04 1.611 0.5
83.72 0.800 1.911×10⁻³ 27.78 48.66 1.944 1.0
86.04 0.790 2.263×10⁻⁵ 32.39 43.67 2.207 2.0
87.19 0.738 2.840×10⁻⁵ 35.31 40.11 2.495 5.0
92.43 0.665 3.008×10⁻⁴ 59.79 32.64 2.833 7.0
90.70 0.804 1.852×10⁻⁴ 48.64 36.68 2.294 10.0

www.ccsenet.org/ijc International Journal of Chemistry Vol. 2, No. 2; August 2010
ISSN 1916-9698 E-ISSN 1916-9701 66
Table 8. Potentiodynamic polarization parameters for the corrosion of mild steel sample in of 1.0 M H2SO4 +10% EtOH in the absence and presence of different concentrations of aqueous extract (A) and alcoholic extract (B) of ZSC plant at 30º C
Table 9. The inhibition efficiences for mild steel corrosion in 1.0 M H2SO4 +10%EtOH in presence of different concentrations of aqueous extract of ZSC plant from different measurements at 30⁰C
Inhibition Effeciency CEx (V/V%)
PDP EIS MLM HEM - - - - 0.0
28.17 31.02 22.36 24.85 0.2 38.05 47.22 35.10 36.90 0.5 44.71 53.59 50.86 52.51 1.0 48.13 56.40 63.28 63.76 2.0 54.13 61.29 66.29 64.40 5.0 54.53 69.26 82.02 84.49 10.0 63.57 76.51 89.44 87.64 16.0 64.06 80.51 91.24 92.62 20.0
Inh.%
-βc
(mV.dec.-1)
βa
(mV.dec.-1)
Icorr.
(mA.cm.-2)
-Ecorr.
(v)
CEx
(V/V%)
Ext
ract
(A)
- 86.80 40.10 15.17 0.450 0.0
28.17 84.40 47.36 10.90 0.455 0.2
38.05 84.60 41.82 9.40 0.451 0.5
44.71 89.34 49.43 8.39 0.444 1.0
48.13 97.74 44.73 7.87 0.443 2.0
54.13 96.68 45.19 6.96 0.450 5.0
54.53 80.49 40.05 6.90 0.447 10.0
63.57 89.88 48.26 5.52 0.453 16.0
64.06 80.05 41.57 5.45 0.457 20.0
53.24 87.06 50.75 7.095 0.450 0.2
Ext
ract
(B)
54.00 81.53 43.14 6.980 0.459 0.5
67.83 80.99 44.73 4.881 0.461 1.0
76.14 88.63 46.64 3.622 0.456 2.0
87.11 80.95 50.62 1.955 0.455 5.0
79.96 80.65 49.18 3.041 0.463 7.0
78.67 92.35 45.27 3.236 0.452 10.0

www.ccsenet.org/ijc International Journal of Chemistry Vol. 2, No. 2; August 2010
Published by Canadian Center of Science and Education 67
Table 10. The inhibition efficiences for mild steel corrosion in 1.0 M H2SO4 +10%EtOH in presence of different concentrations of alcoholic extract of ZSC plant from different measurements at 30⁰C
Inhibition Effeciency CEx (V/V%)
PDP EIS MLM HEM - - - - 0.0
28.17 31.02 22.36 24.85 0.2 38.05 47.22 35.10 36.90 0.5 44.71 53.59 50.86 52.51 1.0 48.13 56.40 63.28 63.76 2.0 54.13 61.29 66.29 64.40 5.0 54.53 69.26 82.02 84.49 10.0 63.57 76.51 89.44 87.64 16.0 64.06 80.51 91.24 92.62 20.0
Table 11. Linear corrolation coefficients and adsorption parameters for Langmuir relationship for aqueous extract of ZSC plant on mild steel in 1.0 M H2SO4 + 10% EtOH at 30⁰C Table 12. Linear corrolation coefficients and adsorption parameters for Langmuir relationship for alcoholic extract of ZSC plant on mild steel in 1.0 M H2SO4 + 10% EtOH at 30⁰C
Figure 1. Ziyzphus Spina-Christi (ZSP) plant
Techniques Slope Correlation Coefficient
Kads (M-1)
-ΔG oads
(kJ mol.-1)
HEM 1.06 0.992 1.099 10.37 MLM 1.07 0.994 1.074 10.29 EIS 1.25 0.993 1.275 10.37 PDP 1.55 0.994 1.246 10.67
Techniques Slope Correlation Coefficient
Kads (M-1)
-ΔG oads
(kJ mol.-1)
HEM 1.08 0.999 8.936 15.63 MLM 1.08 0.999 11.26 16.22 EIS 1.08 0.999 7.530 15.20 PDP 1.23 0.996 7.412 15.16

www.ccsenet.org/ijc International Journal of Chemistry Vol. 2, No. 2; August 2010
ISSN 1916-9698 E-ISSN 1916-9701 68
12 3 4
(1) 0.25M , (2) 0.5M, (3) 1.0M , (4)1.5M
Figure 2. Variation of hydrogen/ time curves for mild steel corrosion in different concentrations of H2SO4 +10%EtOH at 30⁰ C
Figure 3. The relation between (a) log R and/ or (b) log R` for mild steel and log C of H2SO4+ 10% EtOH at
30⁰ C
(1) 0.25M , (2) 0.5M, (3) 1.0M , (4)1.5M Figure 4. Nyquest plots for mild steel corrosion in different concentrations of H2SO4+10% EtOH at 30º C
Tim e (m in.)
0 20 40 60
Vou
lme
of h
ydro
gen
(ml.c
m.-2
)
0.0
0.5
1.0
1.5
2.0
1
2
4
log C
-0.6 -0.4 -0.2 0.0 0.2
log
R'
-4.8
-4.6
-4.4
-4.2
-4.0
-3.8
(b)
log C
-0.6 -0.4 -0.2 0.0 0.2
log
R
-2.0
-1.8
-1.6
-1.4
-1.2 (a)

www.ccsenet.org/ijc International Journal of Chemistry Vol. 2, No. 2; August 2010
Published by Canadian Center of Science and Education 69
1 2 3 4
-20
Figure 5a. Smulation of the suggested circuit of EIS for mild steel corrosion in different concentrations of H2SO4 + 10% EtOH at 30⁰C
Figure 5b. The equivalent circuit for mild steel corrosion in different Concentrations of H2SO4+10%EtOH at 30⁰C
(1) 0.25M , (2) 0.5M, (3) 1.0M , (4)1.5M
Figure 6. Polarization curves for mild steel corrosion in different Concentrations of H2SO4+10%EtOH at 30⁰C

www.ccsenet.org/ijc International Journal of Chemistry Vol. 2, No. 2; August 2010
ISSN 1916-9698 E-ISSN 1916-9701 70
log C
-0.6 -0.4 -0.2 0.0 0.2
I cor
r.
5
10
15
(a)
logC
-0.6 -0.4 -0.2 0.0 0.2
Eco
rr.
-0.52
-0.50
-0.48
-0.46
-0.44
-0.42 (b)
Time (min.)
0 20 40 60
Vol
ume
of h
ydro
gen
(ml.
cm-2
)
0.0
0.5
1.0
1.5
2.0
1
2
34
5678
Time (min.)
0 10 20 30 40 50 60
Vol
ume
of h
ydro
gen
(ml.
cm.-2
)
0.0
0.5
1.0
1.5
2.0F
1
23456 7
Figure 7. The relation a) Icorr., b)Ecorr.for mild steel corrosion Vs. logC of H2SO4+10% EtOH at 30⁰C
[(F) Free, (1)0.2, (2) 0.5, (3) 1.0, (4)2.0, (5)5.0, (6)10.0, (7)16.0, and (8) 20.0]% v/v
Figure 8. Variation of hydrogen/ time curves for mild steel corrosion in different concentrations of H2SO4 +10%EtOH in presence of aqueous extract of ZSC plant at 30⁰ C
[(F) Free, (1)0.2, (2)0.5, (3) 1.0, (4)2.0, (5)5.0, (6)7.0 and (7)10.0]% v/v
Figure 9. Variation of hydrogen/ time curves for mild steel corrosion in different concentrations of H2SO4 +10%EtOH in presence of alcoholic extract of ZSC plant at 30⁰ C

www.ccsenet.org/ijc International Journal of Chemistry Vol. 2, No. 2; August 2010
Published by Canadian Center of Science and Education 71
[(F) Free, (1)0.2, (2) 0.5, (3) 1.0, (4)2.0, (5)5.0, (6)10.0, (7)16.0 and (8) 20.0]% v/v Figure 10. Nyquist plots of the corrosion of mild steel sample 1.0 M H2SO4 10%
EtOH in the presence of different concentrations of aqueous extract of ZSC plant at 30º C
[(F) Free, (1)0.2, (2)0.5, (3) 1.0, (4)2.0, (5)5.0, (6)7.0 and (7)10.0]% v/v Figure 11. Nyquist plots of the corrosion of mild steel sample 1.0 M H2SO4+10%
EtOH in the presence of different concentrations of alcoholic extract of ZSC plant at 30º C
F 1 2 3 4 5 6 7 8
F 1 2 3 4
6
7 5

www.ccsenet.org/ijc International Journal of Chemistry Vol. 2, No. 2; August 2010
ISSN 1916-9698 E-ISSN 1916-9701 72
Figure 12. Graphic shows the components of the inhibitor porous layer formed on the surface of the metal.
Figure 13a. Simulation of the suggested circuit for EIS for mild steel corrosion in 1.0 M H2SO4 +10%EtOH in presence of different concentrations in the range [0.2-10.0]%v/v of aqueous extract and at all concentrations of
alcoholic extract of ZSC plant at 30⁰C
Figure 13b. The equivalent circuit for mild steel corrosion in 1.0M H2SO4 +10%EtOH in presence of different concentrations in the range [0.2-10.0]%v/v of aqueous extract and at all concentrations of alcoholic extract of
ZSC plant at 30⁰C
Inhibitor film
Interface between metal and inhibitor film
Pores in the film
www.ccsenet.org/ijc International Journal of Chemistry Vol. 2, No. 2; August 2010
Published by Canadian Center of Science and Education 73
Figure 14a. Simulation of the suggested circuit for EIS for mild steel corrosion in 1.0M H2SO4 +10%EtOH in presence of high concentrations in the range [16.0-20.0]%v/v of aqueous extract of ZSC plant at 30⁰C
Figure 14b. The equivalent circuit for mild steel corrosion in 1.0 M H2SO4 +10%EtOH in presence of high
concentrations in the range [16.0-20.0]%v/v of aqueous extract of ZSC plant at 30⁰C
[(F) Free, (1)0.2, (2)0.5, (3)1.0, (4)2.0, (5)5.0, (6)10.0, (7)16.0 and (8)20.0]% v/v Figure 15. Polarization curves for mild steel corrosion in 1.0 M H2SO4 + 10%EtOH in presence of different
concentrations of aqueous extract of ZSC plant at 30⁰C
F
1
2
345678

www.ccsenet.org/ijc International Journal of Chemistry Vol. 2, No. 2; August 2010
ISSN 1916-9698 E-ISSN 1916-9701 74
log C
-0.5 0.0 0.5 1.0
Inh.
%
50
60
70
80
90
EISPDP
log C
-0.5 0.0 0.5 1.0
Inh.
%
50
60
70
80
90
HELMLM
log C
-0.5 0.0 0.5 1.0
Inh.
%
30
40
50
60
70
80
EISPDP
log C
-0.5 0.0 0.5 1.0
Inh.
%
20
40
60
80
HEMMLM
[(F) Free, (1)0.2, (2)0.5, (3) 1.0, (4)2.0, (5)5.0, (6)7.0 and (7)10.0]% v/v Figure 16. Polarization curves for mild steel corrosion in 1.0 M H2SO4 + 10%EtOH in presence of different
concentrations of alcoholic extract of ZSC plant at 30⁰C (a)
(b)
Figure 17. The relation between Inh.% from different methods and log C for mild steel corrosion in 1.0M H2SO4 +10%EtOH in presence different concentrations of (a) aqueous extract and (b) alcoholic extract of ZSC plant at
30⁰ C
F1234
5
67

www.ccsenet.org/ijc International Journal of Chemistry Vol. 2, No. 2; August 2010
Published by Canadian Center of Science and Education 75
Figure 18. Langmuir relationship for the adsorption of aqueous extract components of ZSC on mild steel surface
in 1.0 M H2SO4 +10%EtOH at 30⁰C from different methods
Cinh
0 5 10 15 20
Ci n
hΘ−1
0
5
10
15
20
HEM
Cinh
0 5 10 15 20
Cin
hΘ−1
0
5
10
15
20
MLM
Cinh
0 5 10 15 20
Cin
hΘ−1
0
5
10
15
20
25
EIS
Cinh
0 5 10 15 20
Cin
hΘ−1
0
5
10
15
20
PDP

www.ccsenet.org/ijc International Journal of Chemistry Vol. 2, No. 2; August 2010
ISSN 1916-9698 E-ISSN 1916-9701 76
Figure 19. Langmuir relationship for the adsorption of alcoholic extract components of ZSC on mild steel surface in 1.0 M H2SO4 +10%EtOH at 30⁰C from different methods
Cinh.
0 2 4 6 8 10
Cin
hΘ−1
0
2
4
6
8
10
MLM
Cinh.
0 2 4 6 8 10
Cin
h.Θ
−1
0
2
4
6
8
10
HEM
Cinh.
0 2 4 6 8 10
Cin
h.Θ
−1
0
2
4
6
8
10
12
PDP
Cinh.
0 2 4 6 8 10
Cin
h.Θ
−1
0
2
4
6
8
10
EIS