correspondence / memorandum -...
TRANSCRIPT

CORRESPONDENCE / MEMORANDUM DATE: February 17, 2014 TO: Deferred Compensation Board Members FROM: Shelly Schueller Deferred Compensation Director SUBJECT: Calvert Equity Fund This item is for informational purposes only. No Board action is required. At its November 2013 meeting, the Board requested an update on the Calvert Social Investment Fund Equity Portfolio (Calvert), due to its performance as compared to its benchmarks during the second and third quarters of 2013. Calvert was added to the core investment lineup by the Board in 2003 as a “socially responsible” fund option. This fund seeks growth of capital through investment in stocks of issuers in industries believed to offer opportunities for potential capital appreciation and which satisfy the fund's investment and social criteria. The fund evaluates criteria in the areas of environmental stewardship, equal opportunity, employee and community relations, and others. As of December 31, 2013, approximately 3,100 participants held $39,193,700.00 in this fund. The Investment Committee reviewed the performance of this fund at the February 13, 2014, meeting and did not recommend any status changes.
The Calvert Equity Fund “invests primarily in the common stocks of U.S. large-cap companies, although it may have other investments, including foreign stocks and mid-cap stocks. The Fund defines large-cap companies as those whose market capitalization falls within the range of the S&P 500 Index. Sub-advisor Atlanta Capital looks for established companies with a history of steady earnings growth and selects companies based on its opinion that the company has the ability to sustain growth through high profitability and that the stock is favorably priced with respect to those growth expectations. The Fund seeks to invest in companies and other enterprises that demonstrate positive environmental, social and governance performance as they address corporate responsibility and sustainability challenges.”1
Christine Teske from Calvert, and portfolio manager Paul Marshall of Atlanta Capital will be at the March 4, 2014, Board meeting to share information on the fund and answer questions. Attachment
1 http://www.calvert.com/fundprofile.html?fund=919
STATE OF WISCONSIN Department of Employee Trust Funds
Robert J. Conlin SECRETARY
801 W Badger Road PO Box 7931 Madison WI 53707-7931 1-877-533-5020 (toll free) Fax (608) 267-4549 http://etf.wi.gov
Board Mtg Date Item #
DC 3.4.14 7
Reviewed and approved by Matt Stohr, Administrator, Division of Retirement Services Electronically Signed 2/19/14

4550 Montgomery AvenueBethesda, Maryland 20814
Calvert Equity Portfolio
Presentation to
Wisconsin Deferred Compensation Board
March 4, 2014
FOR INSTITUTIONAL USE ONLY. NOT FOR PUBLIC DISTRIBUTION.(CAE #1)Reviewed as of 12/31/13.

2CALVERT INVESTMENTS® | 2014
I. Calvert Investments Overview
II. Calvert’s Leadership in Sustainable & Responsible Investing
III. Calvert Equity Portfolio
Agenda
Calvert Investments® and the Calvert Investments logo are registered trademarks of Calvert Investments, Inc. Calvert Investments is a trade name representing Calvert Investments, Inc. and its subsidiaries, including Calvert Investment Management, Inc. and Calvert Investment Distributors, Inc.(#PT20798)
FOR INSTITUTIONAL USE ONLY. NOT FOR PUBLIC DISTRIBUTION.(CAE #2)Reviewed as of 12/31/13.

3CALVERT INVESTMENTS® | 2014
Calvert Overview (as of 12/31/13)
Assets under management -approx. $13.0 Billion
Founded - 1976
Strategies - >30 equity and fixed-income
Client Profile - retirement plan providers, endowments & foundations, retirement plans, pension funds, insurance companies, and high net worth investors
Location - Bethesda, Maryland
Parent company - Ameritas Mutual Holding Company
Setting Industry Standards for Asset Management Calvert - Five Key Strengths
Discipline: A Powerful Combination of Rigorous Analysis and Independent Thinking
Experience: Seasoned Equity Management, Fixed-Income Management, and ESG Research Teams
Choice: Offering Our Clients a Choice of Investment Styles, Strategies, and Products
Integrity: A Steadfast Adherence to Strong Ethics and Sound Values
Commitment: We Seek to Build Long-Term Relationships and to Exceed Client Expectations
Reviewed as of 12/31/13. (CO #1)
FOR INSTITUTIONAL USE ONLY. NOT FOR PUBLIC DISTRIBUTION.

4CALVERT INVESTMENTS® | 2014Reviewed as of 12/31/13.
Sustainability Research Department10 professionals
Fixed-IncomeTeam of 20 investment professionals
In-House Tax Exempt / Money MarketManagement
In-House Taxable Fixed-Income
Management
Credit Research Team
EquitiesTeam of 10 investment professionals
Sub-AdvisoryOversight
In-HouseEquity
Management
Equity Research Team
Teams of Investment Experts Bring Experience and Insight to the Process
As of 12/31/13
(CO #2)
FOR INSTITUTIONAL USE ONLY. NOT FOR PUBLIC DISTRIBUTION.
5CALVERT INVESTMENTS® | 2014
Hig
her R
isk/
Rew
ard
Pot
entia
lLo
wer
Ris
k/R
ewar
d P
oten
tial
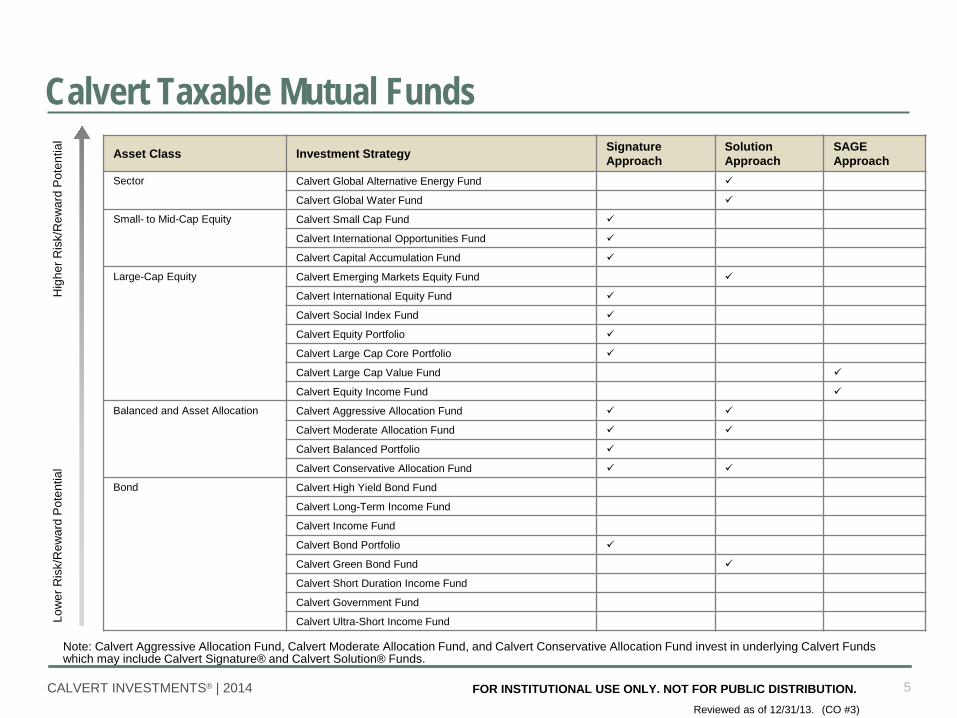
Calvert Taxable Mutual FundsAsset Class Investment Strategy Signature
ApproachSolution Approach
SAGE Approach
Sector Calvert Global Alternative Energy Fund
Calvert Global Water Fund
Small- to Mid-Cap Equity Calvert Small Cap Fund
Calvert International Opportunities Fund
Calvert Capital Accumulation Fund
Large-Cap Equity Calvert Emerging Markets Equity Fund
Calvert International Equity Fund
Calvert Social Index Fund
Calvert Equity Portfolio
Calvert Large Cap Core Portfolio
Calvert Large Cap Value Fund
Calvert Equity Income Fund
Balanced and Asset Allocation Calvert Aggressive Allocation Fund
Calvert Moderate Allocation Fund
Calvert Balanced Portfolio
Calvert Conservative Allocation Fund
Bond Calvert High Yield Bond Fund
Calvert Long-Term Income Fund
Calvert Income Fund
Calvert Bond Portfolio
Calvert Green Bond Fund
Calvert Short Duration Income Fund
Calvert Government Fund
Calvert Ultra-Short Income Fund
Note: Calvert Aggressive Allocation Fund, Calvert Moderate Allocation Fund, and Calvert Conservative Allocation Fund invest in underlying Calvert Funds which may include Calvert Signature® and Calvert Solution® Funds.
FOR INSTITUTIONAL USE ONLY. NOT FOR PUBLIC DISTRIBUTION.Reviewed as of 12/31/13. (CO #3)

6CALVERT INVESTMENTS® | 2014
A World-Class Institutional Asset Manager • A guiding principle for Calvert Investments has always been that investment returns and responsible
corporate behavior are inextricably linked. We combine rigorous analysis and independent thinking to uncover opportunities for performance, always rooted in discipline, and consistency.
• Beyond core institutional asset management capabilities, Calvert Investments offers sustainable investments that include:
• A commitment to the integration of Environmental, Social, and Corporate Governance (ESG) factors • A rigorous review of financial performance along with a thorough assessment of ESG performance
when analyzing companies* • Operational standards of the highest integrity and transparency
*ESG criteria varies by fund; see a fund’s prospectus for details.
FOR INSTITUTIONAL USE ONLY. NOT FOR PUBLIC DISTRIBUTION.(SRI #1)Reviewed as of 12/31/13.

7CALVERT INVESTMENTS® | 2014Reviewed as of 12/31/13.
Calvert’s History of Sustainable & Responsible Investing 1982
FIRST OUT OF SOUTH AFRICA, FIRST BACK INIn 1982, Calvert Social Investment Fund (CSIF) was the first mutual fund to take a stand against the practice of apartheid in South Africa. In 1994, CSIF
became one of the first funds to invest in a free South Africa.
1990PROMOTING COMMUNITY-BASED INVESTING
In 1990, CSIF was the first mutual fund to directly invest a small portion of its assets in communities, providing credit, jobs, and homes for a better quality of life.
INVESTING IN EARLY-STAGE COMPANIESIn 1990, the Special Equities Program was created to invest
in early-stage companies focused on solutions toenvironmental or social concerns.
1999PROTECTING INDIGENOUS PEOPLES’ RIGHTS
In 1999, Calvert created the nation’s first mutual fund policy on indigenous peoples’ rights.
2007GOING GREEN
In 2007, Calvert Global Alternative Energy Fund was launched as one of a handful of actively managed SRI sector funds.
TAKING A STAND ON SUDANIn 2007, Calvert partnered with the Sudan Divestment Task Force and the Save
Darfur Coalition to help increase the impact of targeted divestment and influence the Sudanese government to end the genocide in Darfur.
1986LEADER IN SHAREHOLDER ADVOCACYIn 1986, CSIF filed a shareholder resolution with the Angelica Corporation regarding labor-management issues, which made it the first mutual fund to sponsor a shareholder resolution tied to a social issue.
1992GOING GLOBALIn 1992, Calvert International Equity Fund was launched, making it the first SRI international mutual fund. .
1998FILING DOL LETTERIn 1998, Calvert requested and obtained an Advisory Opinion Letter from the Department of Labor that established the fiduciary basis for defined contribution plans to invest in SRI funds.
2004EMPOWERING WOMENIn 2004, the Calvert Women’s Principles® introduced the first code of conduct focusing on empowering women in the workplace worldwide.
SUSTAINABILITYCalvert published its first corporate sustainability report.
2008 - 2009EXPANDING SRI APPROACHESIn 2008, Calvert introduced three distinct approaches to SRI investing: Calvert Signature® Strategies, Calvert Solution® Strategies, and Calvert SAGE™ Strategies.
ENHANCING IN-HOUSE EQUITY CAPABILITIESIn 2008 and 2009, Calvert expanded in-house equity strategies to include the Calvert International ADR and International “Terror Free” Strategies, U.S. Large-Cap Value and U.S. Large-Cap Core Strategies, Alternative Global Equity Strategy, and U.S. Small-Cap Strategy. In-house equity capabilities include direct integration of ESG insights into investment portfolios.
CALVERT GLOBAL WATER FUNDCalvert launched a second Calvert Solution® Strategies Fund.
FOR INSTITUTIONAL USE ONLY. NOT FOR PUBLIC DISTRIBUTION.(SRI #2)
2012CALVERT EMERGING MARKETS EQUITY FUND
First Calvert fund to invest in a broad range of developing countries..
DODD-FRANK ACTSupported enactment of Dodd-Frank Act implementing regulations related to
resource reporting and conflict minerals laws that strengthen governance and human rights.

8CALVERT INVESTMENTS® | 2014
Leadership in ESG for Over 25 Years• A full range of ESG investment strategies, with active
company engagement for institutional clients• Double Diligence® employs both a rigorous review of
financial performance and a thorough assessment of corporate integrity to identify companies with strong management and solid business practices
• In-house sustainability research team of expert analysts• Global leadership that has influenced corporate and
government policies and practices
Calvert Signature StrategiesCalvert's original approach comprising two distinct research frameworks: a rigorous review of financial performance, and a thorough assessment of environmental, social, and governance performance.
Calvert Solution StrategiesThematic approach to solving some of today's most pressing environmental and sustainability challenges.
Calvert SAGETM Strategies“Enhanced engagement” approach emphasizing strategic engagement with senior management to advance environmental, social, and governance performance in companies that may not meet certain standards today, but have the potential to improve.
®
®
FOR INSTITUTIONAL USE ONLY. NOT FOR PUBLIC DISTRIBUTION.(SRI #3)Reviewed as of 12/31/13.

9CALVERT INVESTMENTS® | 2014Reviewed as of 12/31/13.
ESG Strategies Employ Unique Approaches and Criteria
*Calvert International Equity Fund and Calvert International Opportunities Fund do not have a gambling exclusion and seek to avoid investing in companies that derive more than 10% of revenues from the production of tobacco or alcohol products. **Human rights criteria may vary by fund. ***Calvert International Opportunities Fund may, in select cases, invest in companies with existing nuclear power if they are demonstrating leadership in alternative energy.
ORIGINAL APPROACH THEMATIC APPROACH ENHANCED ENGAGEMENT APPROACH
Calvert Signature ApproachInvestment strategies that integrate two distinct research frameworks: a rigorous review of financial performance, and a thorough assessment of environmental, social, and governance performance.
Calvert Solution ApproachInvestment strategies that selectively invest in companies that produce products and services designed to solve some of today’s most pressing sustainability challenges. Each Solution Strategy has different criteria that reflect the overarching issues of, and opportunities in, its sector.
Calvert SAGE™ ApproachInvestment strategies that emphasize strategic engagement to advance environmental, social, and governance performance in companies that may not meet certain standards today, but have the potential to improve. (SAGE: Sustainability Achieved through Greater Engagement)
INVESTMENT EXCLUSIONS INVESTMENT EXCLUSIONS INVESTMENT EXCLUSIONS
Tobacco*Weapons Firearms Alcohol*
Gambling* Human rights issues** Nuclear***
CALVERT GLOBAL ALTERNATIVE ENERGY FUND No new nuclear Human rights issues**
CALVERT GLOBAL WATERFUND & CALVERT EMERGING MARKETS FUND TobaccoWeapons Human rights issues**
TobaccoWeapons Human rights issues**
INVESTMENT CRITERIA INVESTMENT CRITERIA INVESTMENT CRITERIA
Holdings pass all core criteria: CALVERT GLOBAL ALTERNATIVE ENERGY FUND & CALVERT GLOBAL WATER FUND Holdings are considered by the criteria relevant to the sector, including specific issues related to human rights and indigenous peoples’ rightsCALVERT EMERGING MARKETS EQUITY FUNDSeeks to invest in companies that demonstrate credible corporate actions to address global sustainability challenges.
All companies are eligible except those that are excluded for tobacco, weapons, and human rights issues
Governance and ethics EnvironmentWorkplace safety Product safety
Human rights Indigenous peoples’
rights Community relations
ADVOCACY APPROACH ADVOCACY APPROACH ADVOCACY APPROACH
Advocacy on select companies with four strategic advocacy priorities guiding our company-specific and cross-sectoralactivities: Diversity and women Environment and climate change Human rights, labor rights, and indigenous
peoples’ rights Governance and disclosure
Advocacy on select companies with focus on issues specific to the sector:CALVERT GLOBAL ALTERNATIVE ENERGY FUND Core environment, social and governance criteriaCALVERT GLOBAL WATER FUND Disclosure and transparency Equitable and affordable access to water Climate change Stakeholder engagementCALVERT EMERGING MARKETS EQUITY FUNDAdvocacy promotes corporate action to address global sustainability challenges.
Enhanced engagement approach taken with key companies, including: Company dialogues Multi-stakeholder engagement Proxy voting Shareholder resolutions Other company-specific and cross-sectoral activities
®
FOR INSTITUTIONAL USE ONLY. NOT FOR PUBLIC DISTRIBUTION.(SRI #4)
®
10CALVERT INVESTMENTS® | 2014
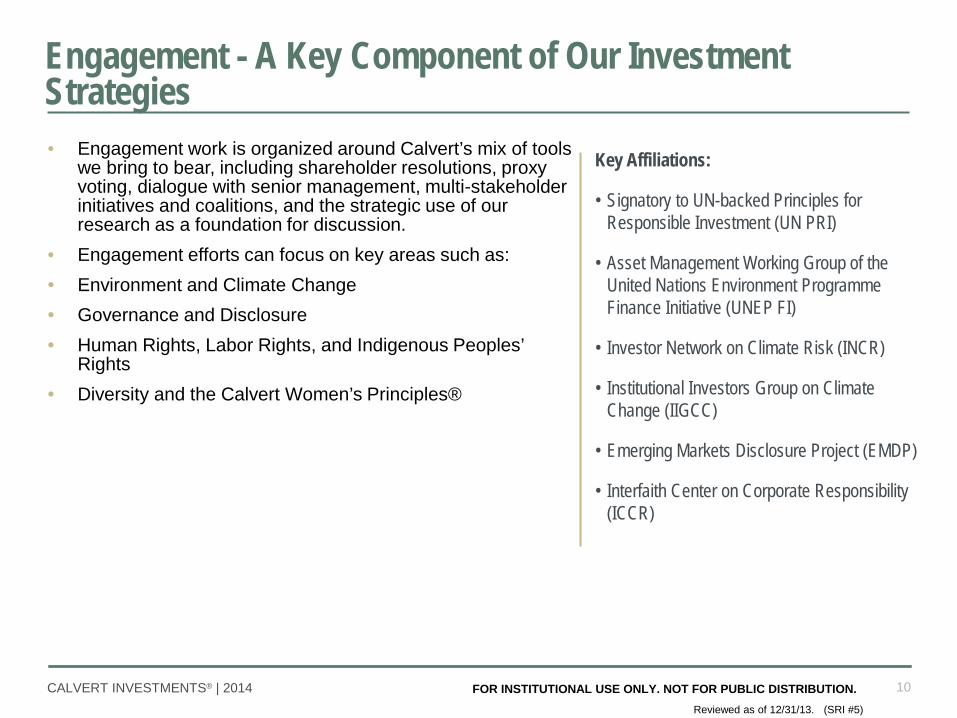
Key Affiliations:
• Signatory to UN-backed Principles for Responsible Investment (UN PRI)
• Asset Management Working Group of the United Nations Environment Programme Finance Initiative (UNEP FI)
• Investor Network on Climate Risk (INCR)
• Institutional Investors Group on Climate Change (IIGCC)
• Emerging Markets Disclosure Project (EMDP)
• Interfaith Center on Corporate Responsibility (ICCR)
Engagement - A Key Component of Our Investment Strategies • Engagement work is organized around Calvert’s mix of tools
we bring to bear, including shareholder resolutions, proxy voting, dialogue with senior management, multi-stakeholder initiatives and coalitions, and the strategic use of our research as a foundation for discussion.
• Engagement efforts can focus on key areas such as:• Environment and Climate Change• Governance and Disclosure• Human Rights, Labor Rights, and Indigenous Peoples’
Rights• Diversity and the Calvert Women’s Principles®
FOR INSTITUTIONAL USE ONLY. NOT FOR PUBLIC DISTRIBUTION.(SRI #5)Reviewed as of 12/31/13.

11CALVERT INVESTMENTS® | 2014Reviewed as of 12/31/13.
Calvert Equity Portfolio
CalvertSustainability
Research Team
CalvertSub-Advisory
Oversight Team
Atlanta Capital(Sub-Advisor)
FOR INSTITUTIONAL USE ONLY. NOT FOR PUBLIC DISTRIBUTION.(IPCE #1)
12CALVERT INVESTMENTS® | 2014Reviewed as of 12/31/13.
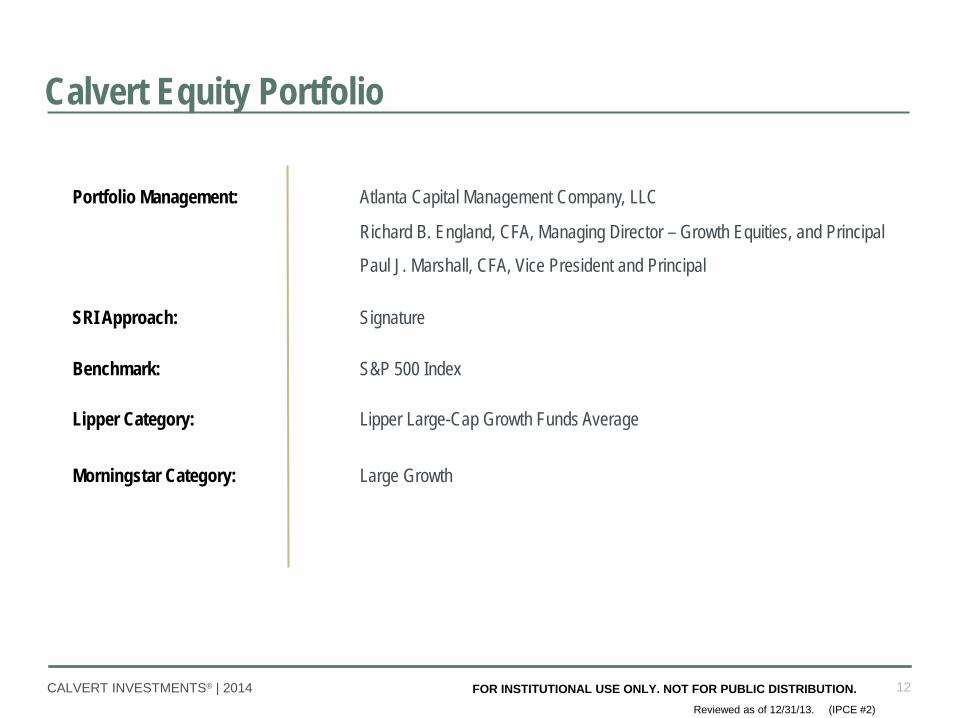
Calvert Equity Portfolio
Portfolio Management: Atlanta Capital Management Company, LLC
Richard B. England, CFA, Managing Director – Growth Equities, and Principal
Paul J. Marshall, CFA, Vice President and Principal
SRI Approach: Signature
Benchmark: S&P 500 Index
Lipper Category: Lipper Large-Cap Growth Funds Average
Morningstar Category: Large Growth
FOR INSTITUTIONAL USE ONLY. NOT FOR PUBLIC DISTRIBUTION.(IPCE #2)

13CALVERT INVESTMENTS® | 2014
Calvert Equity Portfolio - A High-Quality ApproachAtlanta Capital Management Company (ACM)• Founded in 1969 • Majority-owned subsidiary of Eaton Vance Corp.; 20% employee
ownership• ACM had approximately $18.1 Billion in AUM as of
December 31, 2013• Stable executive management team
Success begins with ACM’s philosophyCompanies with a history of consistent growth & stability of earnings may provide attractive returns with moderate risk over the long-term.
ACM’s investment processWe look at the world primarily from a bottom-up, fundamental perspective.Our analysis is focused on what we call “critical variables” − those factors we believe are most tied to potential outperformance.Securities chosen for the portfolio exhibit the greatest ratio of upside potential to downside risk.
The Portfolio strives to achieve superior
performance relative to the S&P 500 Index while maintaining a risk profile
that is low relative to its peer group
FOR INSTITUTIONAL USE ONLY. NOT FOR PUBLIC DISTRIBUTION.(IPCE #3)Reviewed as of 12/31/13.
14CALVERT INVESTMENTS® | 2014Reviewed as of 12/31/13.
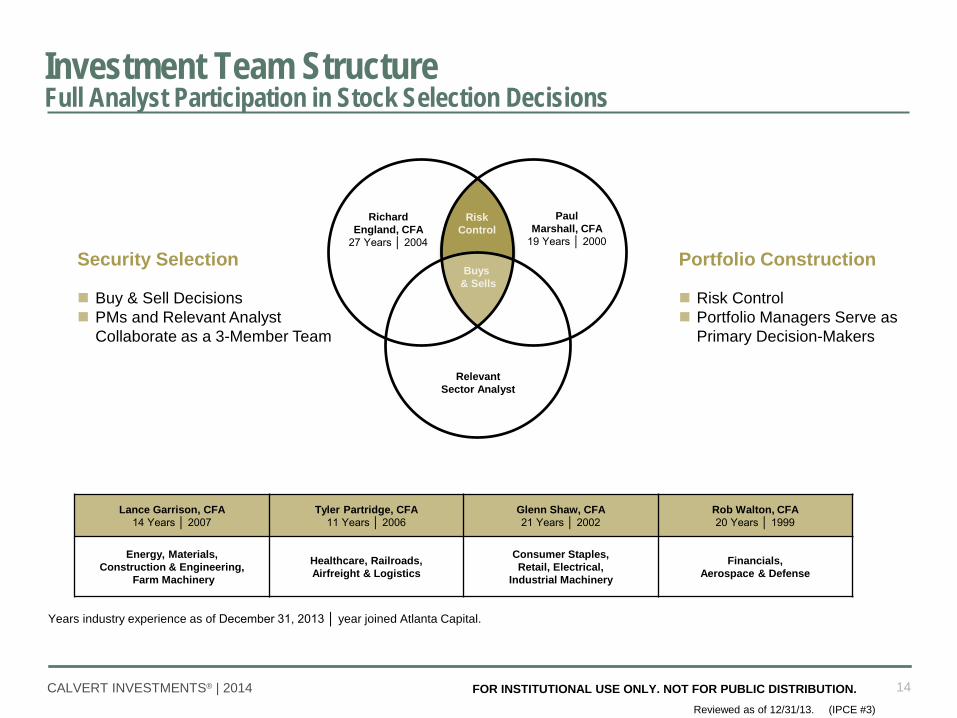
Lance Garrison, CFA14 Years │ 2007
Tyler Partridge, CFA11 Years │ 2006
Glenn Shaw, CFA21 Years │ 2002
Rob Walton, CFA20 Years │ 1999
Energy, Materials,Construction & Engineering,
Farm Machinery
Healthcare, Railroads,Airfreight & Logistics
Consumer Staples, Retail, Electrical,
Industrial Machinery
Financials,Aerospace & Defense
RichardEngland, CFA
27 Years │ 2004
PaulMarshall, CFA
19 Years │ 2000
RelevantSector Analyst
Buys & Sells
RiskControl
Portfolio Construction
Risk Control Portfolio Managers Serve as
Primary Decision-Makers
Security Selection
Buy & Sell Decisions PMs and Relevant Analyst
Collaborate as a 3-Member Team
Investment Team StructureFull Analyst Participation in Stock Selection Decisions
Years industry experience as of December 31, 2013 │ year joined Atlanta Capital.
FOR INSTITUTIONAL USE ONLY. NOT FOR PUBLIC DISTRIBUTION.(IPCE #3)

15CALVERT INVESTMENTS® | 2014
Calvert’s ESG Assessment
Review and evaluate companies on ESG
performance
Portfolio Management
Fundamental, bottom up stock analysis
The Process in Action: Double Diligence®
Rigorous review of financial performance, plus a thorough assessment of ESG performance
• High quality
• U.S. large-cap
• Consistent earnings growth
• Projected earnings growth seeks to be greater than the broad market average
• Environment
• Governance and ethics
• Workplace
• Product safety and impact
• International operations / human rights
• Indigenous Peoples’ rights
• Community relations
FOR INSTITUTIONAL USE ONLY. NOT FOR PUBLIC DISTRIBUTION.(IPCE #5)Reviewed as of 12/31/13.

16CALVERT INVESTMENTS® | 2014Reviewed as of 12/31/13.
─ Earnings growth greater than market
─ >$3B market cap─ Apply high quality
criteria
─ Fundamental analysis─ Sustainable growth─ Attractive valuation
─ 45-55 Holdings─ 5% Max position sizes─ Maximum 30% exposure
to any one Economic Sector
─ 40-50% Annual turnover─ ESG criteria review
─ Fundamentals deteriorate─ Loss of confidence in
Management─ Overvaluation─ ESG criteria review
ACM believes that high-quality growth companies can produce consistently increasing earnings and dividends, thereby providing attractive returns
with moderate risk over the long-term.
Calvert Equity Portfolio Investment Approach
1.Initial Universe
2.Stock Selection Process
3. Portfolio Construction
4.Manage Risk Sell Discipline
FOR INSTITUTIONAL USE ONLY. NOT FOR PUBLIC DISTRIBUTION.(IPCE #6)

17CALVERT INVESTMENTS® | 2014
Investment ProcessBuilding a High Quality Growth UniverseInitial investable universe reviewed for:• High quality characteristics• Demonstrated history of consistent growth & stability in earnings • At least 20 quarters of operating history, 40 quarters preference
Above Average Earnings • Projected earnings growth (3-5 years) seeks to be greater than the broad market average
Minimum $3 billion market capitalization
1.Initial Universe
2.Stock Selection Process
3. Portfolio Construction
4.Manage Risk/Sell Discipline
300-350 High Quality stocks remain for further evaluation
FOR INSTITUTIONAL USE ONLY. NOT FOR PUBLIC DISTRIBUTION.(IPCE #7)Reviewed as of 12/31/13.

18CALVERT INVESTMENTS® | 2014
Investment ProcessACM Fundamental Analysis of High Quality Companies
Financial Strength & Profitability
• Consistent Demand Over Business Cycle• Strong Competitive Position in a Growing Market• Relatively Low Capital Intensity• Cash Flow > Net Income
• Strong and Rising Margins• Stable to Improving Sales Growth• Secular Tailwinds that Support Organic Growth• Productive Use of Internally Generated Capital
• Sales Ramp of Key New Products• Progress in Driving Margin Expansion• Opportunities for Deployment of Capital• Success in Geographic or Market Expansion
Stock-SpecificCritical Variables
AttractiveBusiness Model
As High Quality Managers, We Look For:
As Growth Managers, We Favor:
To Validate Our Fundamental Thesis, We May Focus On:
100-150 high quality targeted stocks remain for further evaluation
1.Initial Universe
2. Stock Selection Process
3. Portfolio Construction
4.Manage Risk/Sell Discipline
FOR INSTITUTIONAL USE ONLY. NOT FOR PUBLIC DISTRIBUTION.(IPCE #8)Reviewed as of 12/31/13.

19CALVERT INVESTMENTS® | 2014
Most Attractive
Average
Least Attractive
• Attractive Business Model
• Financial Strength & Profitability
• Critical Variables
UpsidePotential
DownsideRisk
100 – 150Target List
Relative attractiveness of reward-to-risk profile provides
basis for buy, sell and weighting decisions.
Proprietary forecasts compared to expectations determine
reward-to-risk profile.
Fundamental analysis determines strength of business model &
earnings growth potential.
Are Wall Street earnings estimates too low?
Are Wall Street earnings estimates too high?
+ Earnings Growth+ ∆ (P/E) Multiple+ Dividend Income= Total Return Estimate
Upside vs. DownsideInvestment Case
1.Initial Universe
2. Stock Selection Process
3. Portfolio Construction
4.Manage Risk/Sell Discipline
Investment ProcessBridging Stock Selection and Portfolio Construction
FOR INSTITUTIONAL USE ONLY. NOT FOR PUBLIC DISTRIBUTION.(IPCE #9)Reviewed as of 12/31/13.

20CALVERT INVESTMENTS® | 2014
Investment ProcessConstructing a High Quality Growth Portfolio
Most Attractive
Average
Least Attractive
Relative attractiveness of reward-to-risk profile provides basis for buy, sell and weighting decisions.
45-55 High Quality Holdings
5% Max Position Sizes
Maximum 30% exposure to any one economic Sector
40-50% Annual Turnover
High Quality Candidates
Meets ESG Criteria
Calvert Equity Portfolio
High Quality candidates that meet risk/reward standards are reviewed for ESG criteria. The
vast majority of candidates pass.
Double Diligence is a rigorous review of financial performance, plus a thorough assessment of
ESG performance.
1.Initial Universe
2. Stock Selection Process
3. Portfolio Construction
4.Manage Risk/Sell Discipline
®
FOR INSTITUTIONAL USE ONLY. NOT FOR PUBLIC DISTRIBUTION.(IPCE #10)Reviewed as of 12/31/13.

21CALVERT INVESTMENTS® | 2014
Investment ProcessSell Discipline – Change in the Reward-to-Risk ProfileA stock is sold as its relative reward-to-risk ratio declines, often due to one or more of the following factors:• Fundamentals, often as captured by the critical variables, fail to develop as we expected.
We work to uncover this before the market does.• Valuation multiple expands beyond an attractive level, failing to provide adequate potential for
upside return.• Confidence in management deteriorates, increasing concerns regarding accounting & corporate
governance issues. • Company fails to maintain adherence to ESG criteria.
1.Initial Universe
2. Stock Selection Process
3. Portfolio Construction
4. Manage Risk/Sell Discipline
FOR INSTITUTIONAL USE ONLY. NOT FOR PUBLIC DISTRIBUTION.(IPCE #11)Reviewed as of 12/31/13.
22CALVERT INVESTMENTS® | 2014
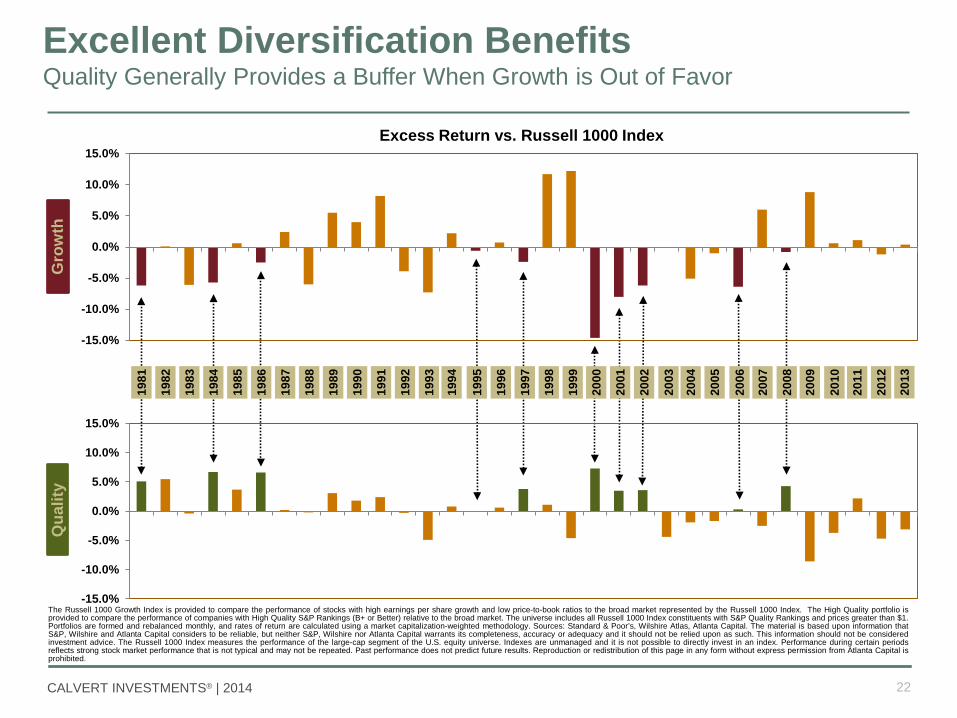
The Russell 1000 Growth Index is provided to compare the performance of stocks with high earnings per share growth and low price-to-book ratios to the broad market represented by the Russell 1000 Index. The High Quality portfolio isprovided to compare the performance of companies with High Quality S&P Rankings (B+ or Better) relative to the broad market. The universe includes all Russell 1000 Index constituents with S&P Quality Rankings and prices greater than $1.Portfolios are formed and rebalanced monthly, and rates of return are calculated using a market capitalization-weighted methodology. Sources: Standard & Poor’s, Wilshire Atlas, Atlanta Capital. The material is based upon information thatS&P, Wilshire and Atlanta Capital considers to be reliable, but neither S&P, Wilshire nor Atlanta Capital warrants its completeness, accuracy or adequacy and it should not be relied upon as such. This information should not be consideredinvestment advice. The Russell 1000 Index measures the performance of the large-cap segment of the U.S. equity universe. Indexes are unmanaged and it is not possible to directly invest in an index. Performance during certain periodsreflects strong stock market performance that is not typical and may not be repeated. Past performance does not predict future results. Reproduction or redistribution of this page in any form without express permission from Atlanta Capital isprohibited.
-15.0%
-10.0%
-5.0%
0.0%
5.0%
10.0%
15.0%
Gro
wth
Qua
lity
Excess Return vs. Russell 1000 Index
-15.0%
-10.0%
-5.0%
0.0%
5.0%
10.0%
15.0%
Excellent Diversification BenefitsQuality Generally Provides a Buffer When Growth is Out of Favor
1981
1982
1983
1988
1984
1987
1985
1986
1989
1990
1991
1992
1993
1994
1995
1996
1997
1998
1999
2000
2001
2002
2003
2004
2008
2005
2006
2007
2009
2010
2011
2012
2013
23CALVERT INVESTMENTS® | 2014
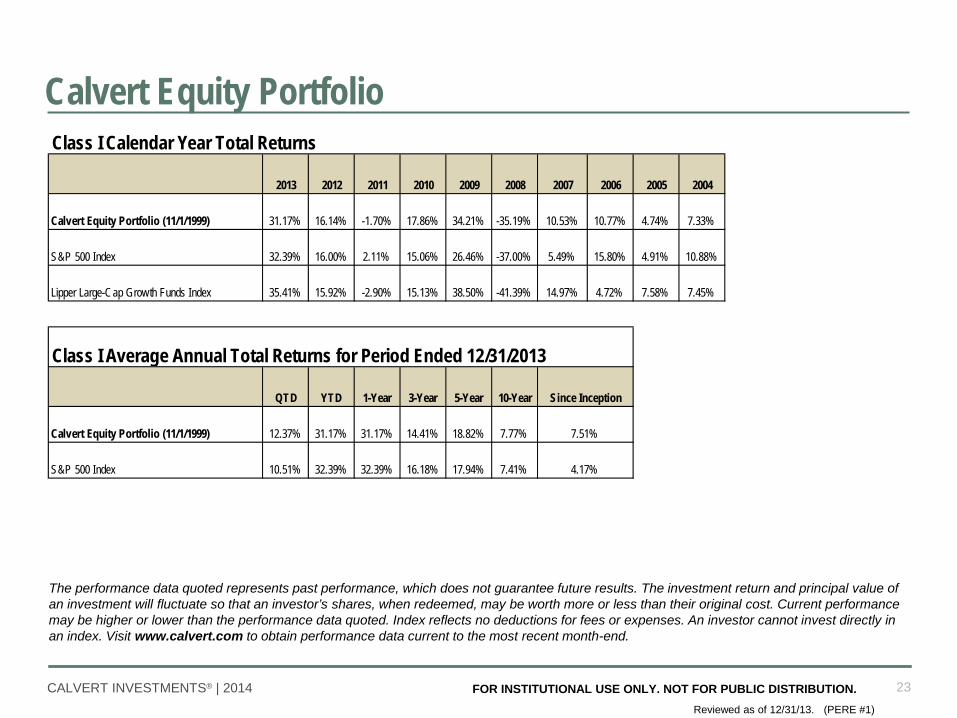
The performance data quoted represents past performance, which does not guarantee future results. The investment return and principal value of an investment will fluctuate so that an investor’s shares, when redeemed, may be worth more or less than their original cost. Current performance may be higher or lower than the performance data quoted. Index reflects no deductions for fees or expenses. An investor cannot invest directly in an index. Visit www.calvert.com to obtain performance data current to the most recent month-end.
Reviewed as of 12/31/13.
Calvert Equity Portfolio
(PERE #1)
FOR INSTITUTIONAL USE ONLY. NOT FOR PUBLIC DISTRIBUTION.
2013 2012 2011 2010 2009 2008 2007 2006 2005 2004
Calvert Equity Portfolio (11/1/1999) 31.17% 16.14% -1.70% 17.86% 34.21% -35.19% 10.53% 10.77% 4.74% 7.33%
S&P 500 Index 32.39% 16.00% 2.11% 15.06% 26.46% -37.00% 5.49% 15.80% 4.91% 10.88%
Lipper Large-Cap Growth Funds Index 35.41% 15.92% -2.90% 15.13% 38.50% -41.39% 14.97% 4.72% 7.58% 7.45%
QTD YTD 1-Year 3-Year 5-Year 10-Year
Calvert Equity Portfolio (11/1/1999) 12.37% 31.17% 31.17% 14.41% 18.82% 7.77%
S&P 500 Index 10.51% 32.39% 32.39% 16.18% 17.94% 7.41%
Class I Calendar Year Total Returns
Class I Average Annual Total Returns for Period Ended 12/31/2013
Since Inception
7.51%
4.17%

24CALVERT INVESTMENTS® | 2014Reviewed as of 12/31/13.
Calvert Equity Portfolio Risk Characteristics
Source: Zephyr StyleAdvisor using Morningstar™ and/or Lipper data.
FOR INSTITUTIONAL USE ONLY. NOT FOR PUBLIC DISTRIBUTION.(PERE #2)
Standard Deviation Alpha Beta
Excess Return R-Squared
Tracking Error
Information Ratio
Sharpe Ratio
Calvert Equity Portfolio (11/1/1999) 12.97% -1.84% 1.03 -1.77% 91.84% 3.72% -0.48 1.11
S&P 500 Index 12.11% 0.00% 1.00 0.00% 100.00% 0.00% 0.00 1.33
Summary Statistics for Class I Shares: 3-year period ended 12/31/2013

25CALVERT INVESTMENTS® | 2014Reviewed as of 12/31/13.
Calvert Equity Portfolio Characteristics
Net assets include all share classes. Number of Holdings for the fund includes special equities, if applicable.
Source: Analysis performed by FactSet.
FOR INSTITUTIONAL USE ONLY. NOT FOR PUBLIC DISTRIBUTION.(PERE #3)
Holding Portfolio Weight
CVS CAREMARK CORP 4.58%
APPLE INC 4.13%
GOOGLE INC CL A 3.94%
QUALCOMM INC 3.36%
COCA COLA CO/THE 3.10%
GILEAD SCIENCES INC 3.04%
ALLERGAN INC 2.77%
EXPRESS SCRIPTS HOLDING CO 2.76%
INTERCONTINENTALEXCHANGE GRO 2.74%
AMERICAN EXPRESS CO 2.69%
Total 33.11%
Top 10 Holdings (% of net assets, as of 12/31/2013)
Calvert Equity Portfolio S&P 500 Index
Net Assets $2,972.19 M N/A
Number of Holdings 112 N/A
Weighted Average Cap. $100,857.3 (MM) $113,301.6 (MM)
Weighted Median Market Cap. 57,189.27 (MM) 64,142.82 (MM)
P/E, 1-year trailing 22.23 18.01
P/E, 1-year forward 19.9 16.81
EPS Growth, past 3 years 15.62% 11.31%
EPS Growth, next 3 - 5 years 15.07% 11.75%
Price to Book 3.63 2.68
Dividend Yield 1.12% 1.96%
Return on Equity 19.91% 18.42%
Holdings Based Statistics (as of 12/31/2013)

26CALVERT INVESTMENTS® | 2014Reviewed as of 12/31/13.
Calvert Equity Portfolio Characteristics
Source: MSCI. MSCI makes no express or implied warranties or representations and shall have no liability whatsoever with respect to any MSCI data contained herein. The MSCI data may not be further redistributed or used as a basis for other indices or any securities or financial products. This report is not approved, reviewed or produced by MSCI.
Analysis performed by FactSet.
FOR INSTITUTIONAL USE ONLY. NOT FOR PUBLIC DISTRIBUTION.(PERE #4)
Sectors Calvert Equity Portfolio S&P 500 Index +/-
Consumer Disc. 18.61% 12.54% 6.07%
Consumer Staples 11.74% 9.76% 1.98%
Energy 3.10% 10.28% -7.18%
Financials 12.59% 16.18% -3.59%
Health Care 16.72% 12.95% 3.76%
Industrials 10.46% 10.94% -0.48%
Information Tech 24.22% 18.63% 5.59%
Materials 2.56% 3.50% -0.94%
Telecomm Services 0.00% 2.30% -2.30%
Utilities 0.00% 2.93% -2.93%
GICS Sector Weights Holdings-Based Statistics (as of 12/31/2013)

27CALVERT INVESTMENTS® | 2014Reviewed as of 12/31/13.
Calvert Equity Portfolio Analysis by Sector
Source: Analysis performed by FactSet. Equity holdings only. Return calculation is based on daily holding periods and excludes all fund expenses and trading costs.
FOR INSTITUTIONAL USE ONLY. NOT FOR PUBLIC DISTRIBUTION.(PERE #5)
Portfolio Average Weight
Benchmark Average Weight
Average Weight Difference
Portfolio Return
Benchmark Return
Return Difference Sector Effect Stock Effect Total Effect
Information Tech 24.74% 17.90% 6.84% 14.78% 13.28% 1.49% 0.17% 0.35% 0.53%
Consumer Disc. 19.24% 12.47% 6.77% 9.48% 10.81% -1.33% 0.01% -0.22% -0.20%
Health Care 15.29% 13.09% 2.21% 16.80% 10.13% 6.67% -0.01% 0.97% 0.96%
Financials 12.41% 16.24% -3.83% 17.12% 10.33% 6.79% 0.01% 0.79% 0.81%
Consumer Staples 11.85% 10.08% 1.77% 13.88% 8.66% 5.22% -0.03% 0.59% 0.57%
Industrials 10.04% 10.83% -0.79% 10.35% 13.50% -3.14% -0.01% -0.29% -0.29%
Energy 3.72% 10.42% -6.70% -0.80% 8.35% -9.15% 0.15% -0.43% -0.28%
Materials 2.71% 3.49% -0.79% 5.86% 10.66% -4.80% 0.00% -0.10% -0.10%
Telecomm Services 0.00% 2.40% -2.40% 0.00% 5.47% -5.47% 0.12% 0.00% 0.12%
Utilities 0.00% 3.07% -3.07% 0.00% 2.79% -2.79% 0.24% 0.00% 0.24%
Total 100.00% 100.00% 0.00% 12.86% 10.51% 2.35% 0.65% 1.67% 2.35%
Performance Attribution vs. S&P 500 Index (Quarter ended 12/31/2013)

28CALVERT INVESTMENTS® | 2014Reviewed as of 12/31/13.
Calvert Equity Portfolio Attribution
Source: Analysis performed by FactSet. Equity holdings only. Return calculation is based on daily holding periods and excludes all fund expenses and trading costs.
(PERE #6)
FOR INSTITUTIONAL USE ONLY. NOT FOR PUBLIC DISTRIBUTION.
Holding Sector Average WeightHolding Period
ReturnContribution to
Portfolio
CVS Caremark Corporation Consumer Staples 4.53% 26.59% 1.14%
Google Inc. Class A Information Tech 4.06% 27.95% 1.09%
Apple Inc. Information Tech 4.18% 18.38% 0.74%
IntercontinentalExchange Group, Inc. Financials 2.75% 24.35% 0.64%
Gilead Sciences, Inc. Health Care 3.02% 19.59% 0.58%
Holding Sector Average WeightHolding Period
ReturnContribution to
Portfolio
Fastenal Company Industrials 1.56% -4.97% -0.10%
Cameron International Corporation Energy 1.86% 1.99% -0.08%
eBay Inc. Information Tech 1.98% -1.61% -0.03%
Varian Medical Systems, Inc. Health Care 0.35% -2.98% -0.02%
Genesee & Wyoming, Inc. Class A Industrials 0.39% 1.45% 0.00%
Top Contributors by Holding (Quarter ended 12/31/2013)
Bottom Contributors by Holding (Quarter ended 12/31/2013)

29CALVERT INVESTMENTS® | 2014Reviewed as of 12/31/13.
Calvert Equity Portfolio Attribution
Source: Analysis performed by FactSet. Equity holdings only. Return calculation is based on daily holding periods and excludes all fund expenses and trading costs.
(PERE #7)
FOR INSTITUTIONAL USE ONLY. NOT FOR PUBLIC DISTRIBUTION.
Sector Average Weight Return Contribution
Information Tech 24.74% 14.78% 3.58%
Health Care 15.29% 16.80% 2.55%
Financials 12.41% 17.12% 2.10%
Consumer Disc. 19.24% 9.48% 1.84%
Consumer Staples 11.85% 13.88% 1.65%
Sector Average Weight Return Contribution
Energy 3.72% -0.80% -0.08%
Telecomm Services - - 0.00%
Utilities - - 0.00%
Materials 2.71% 5.86% 0.17%
Industrials 10.04% 10.35% 1.05%
Top Contributors by Sector (Quarter ended 12/31/2013)
Bottom Contributors by Sector (Quarter ended 12/31/2013)

30CALVERT INVESTMENTS® | 2014
Contact Information and DisclosuresFor more information on Calvert funds for institutional investors or on other institutional products, please call Calvert at 800.327.2109 or visit www.calvert.com for a free summary prospectus and/or prospectus. An investor should consider the investment objectives, risks, charges and expenses of an investment carefully before investing. The summary prospectus and prospectus contain this and other information. Read them carefully before you invest or send money.
Investment in mutual funds involves risk, including possible loss of principal invested. Equity funds are subject to the following risks: the stock market may fall in value, causing prices of stocks held by a fund to fall; individual investments of a fund may not perform as expected; and a fund’s portfolio management practices may not achieve the desired result. Large-cap companies may be unable to respond quickly to new competitive challenges such as changes in technology, and also may not be able to attain the high growth rate of successful smaller companies, especially during extended periods of economic expansion. Prices of small- and mid-cap stocks can be more volatile than those of larger, more established companies. Small- and mid-cap companies are more likely to have more limited product lines, fewer capital resources and less depth of management than larger companies.
Funds that employ a value strategy are subject to the risks that the market may not recognize a security’s intrinsic value for a long time, and that a stock judged to be undervalued by the fund’s Advisor or Subadvisor may actually be appropriately priced and may not appreciate as anticipated. Funds that employ a growth strategy are subject to the risks that the prices of growth company securities may fall due to changing economic, political or market conditions or disappointing earnings results, and that growth stocks generally lack the dividends of some value stocks that can cushion stock prices in a falling market. Funds with an emphasis on dividend-paying stocks are subject to the risk that a company may reduce or eliminate its dividend, which may adversely affect the fund’s ability to generate income. Foreign investments involve greater risks than U.S. investments, including political and economic risks and the risk of currency fluctuations. The risks of investing in emerging market securities are greater than those of investing in securities of developed foreign countries. An index fund has operating expenses; a market index does not. Although expected to track its target index as closely as possible while satisfying its investment criteria, an index fund will not be able to match theperformance of the index exactly.
Calvert mutual funds are underwritten and distributed by Calvert Investment Distributors, Inc., member FINRA and subsidiary of Calvert Investments, Inc. www.calvert.com
Reviewed as of 12/31/13. (DE #1)
FOR INSTITUTIONAL USE ONLY. NOT FOR PUBLIC DISTRIBUTION.