correlations in aftershock and seismicity patterns
TRANSCRIPT
www.elsevier.com/locate/tecto
Tectonophysics 413
Correlations in aftershock and seismicity patterns
Robert Shcherbakov a,b,*, Jordan Van Aalsburg a, John B. Rundle a, Donald L. Turcotte b
a Center for Computational Science and Engineering, University of California, Davis, CA 95616, USAb Department of Geology, University of California, Davis, CA 95616, USA
Received 21 November 2004; received in revised form 10 May 2005; accepted 4 October 2005
Available online 1 December 2005
Abstract
Correlations in space and time play a fundamental role in earthquake processes. One direct manifestation of the effects of
correlations is the occurrence of aftershocks due to the stress transfer in the vicinity of a main shock. Less obvious and more
speculative changes in correlations may occur in the background seismicity before large earthquakes. Using statistical physics it is
possible to introduce a measure of spatial correlations through a correlation length. This quantity characterizes how local
fluctuations can influence the occurrence of earthquakes over distances comparable with the correlation length. In this work,
the physical basis of spatial correlations of earthquakes is discussed in the context of critical phenomena and the percolation
problem. The method of two-point correlation function is applied to the seismicity of California. Well defined variations in time of
the correlation length are found for aftershock sequences and background seismicity. The scaling properties of our obtained
distributions are analyzed with respect to changes in several scaling parameters such as lower magnitude cutoff of earthquakes, the
maximum time interval between earthquakes, and the spatial size of the area considered. This scaling behavior can be described in
a unified manner by utilizing the multifractal fit. Utilizing the percolation approach the time evolution of clusters of earthquakes is
studied with the correlation length defined in terms of the radius of gyration of clusters. This method is applied to the seismicity of
California.
D 2005 Elsevier B.V. All rights reserved.
Keywords: Earthquakes; Two-point correlation function; Correlation length; Percolation; Radius of gyration; Multifractal scaling
1. Introduction
Earthquake catalogs contain information concerning
the history and mechanisms of nonlinear processes in
the upper brittle layer of the Earth’s crust. These
catalogs are also a source of information for various
earthquake prediction algorithms. Some of these algo-
rithms are based on studies of possible repetitive
precursory patterns of seismicity. The existence of
0040-1951/$ - see front matter D 2005 Elsevier B.V. All rights reserved.
doi:10.1016/j.tecto.2005.10.009
* Corresponding author.
E-mail addresses: [email protected] (R. Shcherbakov),
[email protected] (J. Van Aalsburg), [email protected]
(J.B. Rundle), [email protected] (D.L. Turcotte).
these patterns requires that earthquakes are correlated
in space and time. Therefore, studies of earthquake
correlations represent an important part of the general
problem of understanding the physics of earthquakes
and are also crucial for the development of any pre-
diction methods. It is also believed that correlations
are inherently present in the Earth’s crust and are
signatures of the nonlinear dynamics of rheological,
frictional, chemical, and other processes. From this
point of view, the Earth’s crust can be considered as
a strongly-correlated nonlinear dissipative system. To
study different aspects of the correlations of this sys-
tem we will utilize concepts developed in statistical
physics.
(2006) 53–62
R. Shcherbakov et al. / Tectonophysics 413 (2006) 53–6254
Spatial and temporal correlations are inherent in the
theory of static and dynamic critical phenomena where
they play a central role (Ma, 1976; Hohenberg and
Halperin, 1977). In the last two decades the ideas of
criticality have been applied to earthquake physics
(Rundle et al., 1997, 2000, 2003; Harris, 1998; Bow-
man et al., 1998; Jaume and Sykes, 1999). Recent
studies suggest that many dynamical dissipative sys-
tems fluctuate around a steady state, i.e., system dy-
namics builds up long-range correlations in the system
and produce power-law distributions of event sizes such
as the Gutenberg–Richter scaling for earthquakes
(Gutenberg and Richter, 1954) before a large earth-
quake destroys the correlated state. The system retreats
from the steady state only to start rebuilding the long-
range correlations (Sornette and Helmstetter, 2002).
This idea is appealing from the geophysical point of
view and could be associated with the presence of
characteristic earthquakes.
It is natural to hypothesize that a seismogenic zone
treated as a strongly-correlated, highly nonlinear dis-
sipative dynamical system can be characterized by
suitably defined correlation lengths. For any given
point in space and time, this system has one or
more characteristic lengths over which it is correlated.
The occurrence of an earthquake at a point can trigger
earthquakes over distances comparable to a correlation
length. The probability of such an event occurring is
quantified using a correlation function. To fully define
a problem we also assume that the correlation prop-
erties of the system are changing over time. This
measure of correlations can be used to monitor the
seismic activity in a region.
The first quantitative studies of correlations in seis-
mogenic zones were carried out by Kagan and Knopoff
(1976, 1980) and Kagan (1981a,b) who considered the
two-, three-, and four-point correlation functions for the
spatial distribution of earthquake epicenters and hypo-
centers. The power-law behavior of the correlation
functions they obtained indicated a self-similar spatial
structure of earthquake clusters and was related to the
fractal geometry of fault networks. For shallow earth-
quakes, no characteristic length scale was found for
distances between hypocenters ranging from a few
kilometers up to 1000 km utilizing several regional
and worldwide catalogs available at that time. These
results can be used in constructing geometrical models
for earthquake fault systems. The second-order moment
(the two-point correlation function) for central Califor-
nia (1969–1982) was also analyzed by Reasenberg
(1985) who found the presence of clustering related
to the aftershock process. This analysis was aimed at
finding precursory behavior in California seismicity by
analyzing the pairwise statistical interdependence of
earthquakes.
The fractal properties of the spatial distribution of
earthquake hypocenters were examined by Robertson
et al. (1995) for four seismic data sets in California.
They found that the fractal capacity dimension of the
distribution of faults df61.9, is nearly equal to the
fractal dimension of the backbone of a 3d percolating
cluster. Kosobokov and Mazhenkov (1994) introduced
an additional term (Clog L, where L is a linear size of
an area) into the Gutenberg–Richter scaling which
quantifies the spatial distribution of earthquakes.
Their analysis shows that the coefficient C is a fractal
dimension of a set of epicenters, vary from 1.0 to 1.5,
and correlate with the geometry of tectonic features.
Guo and Ogata (1997) estimated the fractal dimension
of the hypocenter distribution for 34 aftershock
sequences in Japan from 1971 to 1995 based on the
two-point correlation function. The values of fractal
dimensions found for different regions correspond to
various degrees of heterogeneity of fault networks.
Nanjo and Nagahama (2004) studied 14 aftershock
sequences following large main shocks in Japan.
They argue that aftershock distributions become less
clustered with increasing fractal dimensions of active
fault systems.
The concept of a growing correlation length prior
to large earthquakes was examined by Zoller et al.
(2001), Zoller and Hainzl (2002). They suggested that
the growth of correlations reflects the changes in the
state of the regional stress field prior to large earth-
quakes. They used the single-link cluster algorithm
(Frohlich and Davis, 1990) to construct clusters of
earthquakes. The correlation length was defined as a
median of a cumulative distribution function of cluster
links.
Keilis-Borok and Soloviev (2003) and Zaliapin et
al. (2003a,b) have used the notion of Premonitory
Seismicity Patterns (PSPs) to analyze the sequence of
earthquake events in their retrospective analysis of
seismicity and also in several prediction algorithms.
One of these PSPs is an increase in correlation range.
They used several patterns of increased seismic ac-
tivity to monitor an increase in correlations among
earthquakes.
An attempt to introduce a universal scaling law for
earthquakes has been proposed by Christensen et al.
(2002) and Bak et al. (2002). These authors estimated
the probability distribution of the interoccurrence time
intervals s between earthquakes, PL,m(s), within an areaof linear size L and cutoff magnitude mc as scaling
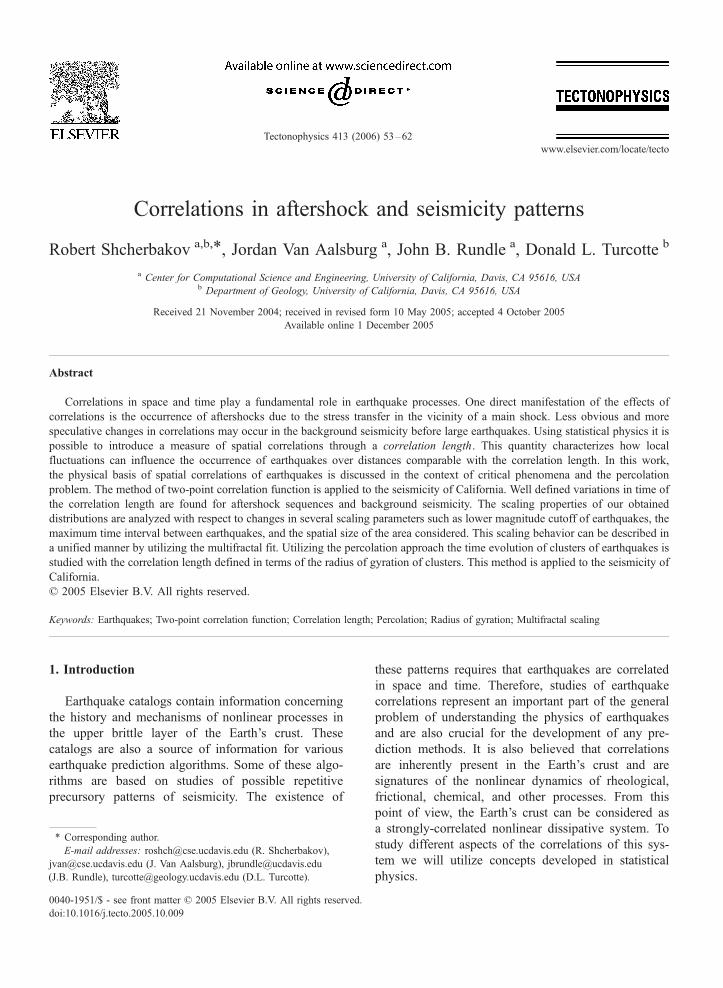
Fig. 1. Dependence of the probability density function P(r) and cumulative correlation function C(r) on the separation distance r prior to (a) and
after (b) several large earthquakes in California. For each curve a 1 /2 year time interval has been chosen with square areas of size 18�18 centeredon the epicenter of each main shock and with all earthquakes greater than mc=2.0, included. The values of P(r) decrease with increasing r and the
values of C(r) increase.
R. Shcherbakov et al. / Tectonophysics 413 (2006) 53–62 55
parameters. For Southern California they found a uni-
versal scaling with
PL;mcsð Þ ¼ s�pg sLdf 10�bmc
� �: ð1:1Þ
They associated s - p with Omori’s law ( p61.0),
10- bm with GR scaling (b61.0), and Ldf with fractal
spatial scaling (df61.2) for the 2d location of earth-
quake epicenters. Two distinct scaling regions were
found, for short times, these results correspond to a
generalized Omori’s law for aftershocks (Shcherbakov
et al., 2004) and for long times they are associated with
the uncorrelated regime of main shocks. To take into
account the spatial heterogeneity and nonstationarity of
earthquake occurrence rates, Corral (2003, 2004) has
found that the fast decay for long times is not expo-
nential, but another power law.
In the work reported here we have employed two
approaches to study the correlations between earth-
quakes. In the next two sections, we apply the two-
point correlation function method to aftershock
sequences of major California earthquakes. In this con-
text, we have studied the temporal evolution of the
correlation length defined as a mean of the two-point
distribution function prior to and after the main shocks.
To study the scaling properties of the two-point corre-
lation functions, we have used a multifractal analysis.
In Section 4, we have mapped the seismic activity onto
the framework of the percolation problem and have
studied the temporal behavior of the correlation length
prior to and after major earthquakes in California. In
our analyses we have used the catalogs provided by the
Southern California Earthquake Center (SCSN catalog,
http://www.data.scec.org/) and the Northern California
Earthquake Data Center (NCSN catalog, http://quake.
geo.berkeley.edu/ncedc/).
2. Two-point correlation function
Earthquake occurrences can be treated as a stochas-
tic point process. To study spatial correlations in such a
process it is useful to define a two-point correlation
integral (Grassberger and Procaccia, 1983)
C rð Þ¼ limNYl
1
N2
XNi;j¼1
h r �jxi�xjj� �
u 2k
Z r
o
P rVð ÞrVdrV;
ð2:1Þ
where r is the Euclidian distance between pairs of point
events (earthquake epicenters), xi are their vector coor-
dinates, h(x) is the Heaviside step function. The sum-
mation is over all pairs of N events, and P(r) is the
probability density function. The two-point correlation
integral (2.1) was introduced as a measure of the
strangeness of attractors of dissipative dynamical sys-
tems that exhibit chaotic behavior. It was shown (Grass-
berger and Procaccia, 1983) that for these systems the
integral behaves as a power-law for small r
C rð Þ~rv : ð2:2Þ
The correlation length n is defined as the first mo-
ment of the density correlation function P(r)
nuE r½ � ¼ 2k
Z l
0
r2P rð Þdr : ð2:3Þ
R. Shcherbakov et al. / Tectonophysics 413 (2006) 53–6256
Another possibility is to use a median value of the
correlation integral as a correlation length.
In this section, we have applied the two-point
correlation function analysis to foreshock and after-
shock sequences of large earthquakes in California.
We have also studied the temporal evolution of the
correlation length prior to and after these earthquakes.
In Fig. 1 the correlation integral C (2.1) and the
probability density function P(r) are given for the
Landers, Northridge, and Hector Mine earthquakes.
Time intervals of 180 days before and 180 days after
the main shocks have been taken. All earthquakes with
magnitudes greater than mc=2.0 in square areas of
18�18 size centered on the main shock epicenters for
the prescribed time periods have been considered. The
visual inspection of the figure shows a change in the
behavior of the correlation function before and after
main shocks. The occurrence of aftershocks creates a
broader scaling regime in the correlation function that
we attribute to the self-similar nature of the aftershock
process. This has a geometric component reflected in
the fractal structure of a fault network upon which
aftershocks occur.
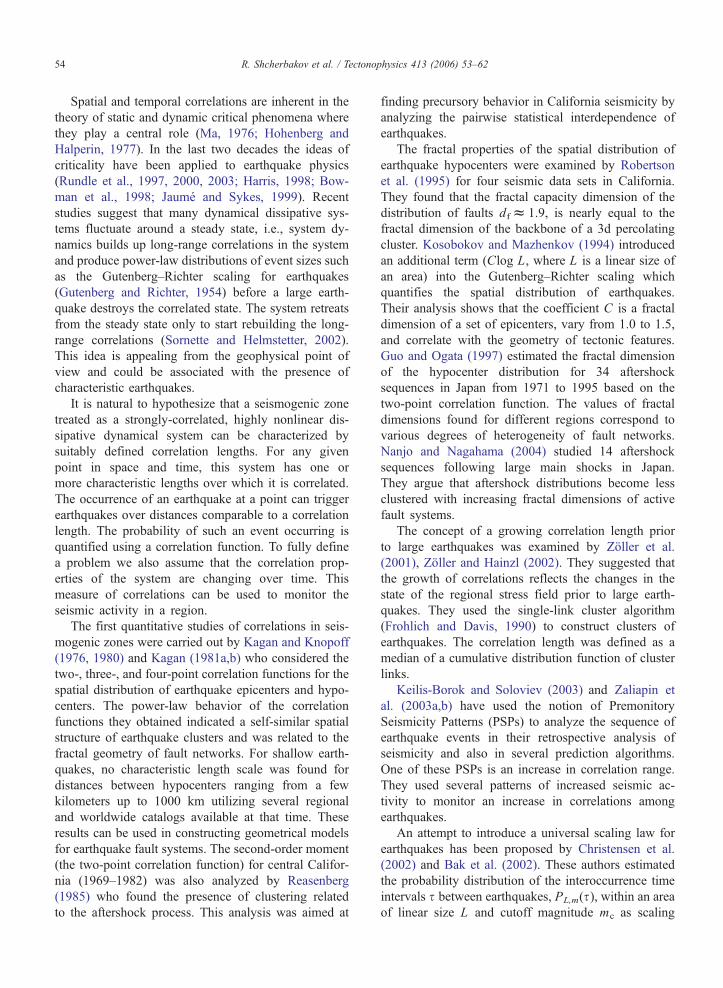
In Fig. 2 the time evolution of the correlation length
prior to and after the main shocks under consideration
is given. We have employed a running window with the
fixed number of events WN=200 and a constant event
shift to calculate the values of the correlation length
from (2.3) in each event window. Time intervals of 2
years prior to and after the main shocks have been
Fig. 2. Time evolution of the correlation length n defined in (2.3) prior to and
with 200 events and shifts by 10 events has been used for the time interv
evolution of the correlation length for each window.
considered. Further analysis have showed that the be-
havior of the mean, median, and the second moment are
basically the same. The drastic change in the behavior
of the correlation length at the time of the main shocks
is attributed to the occurrence of aftershocks which
reduce the mean value of the distance between pairs
of events, whereas, foreshocks are more uniformly
spread and contribute to larger values of the correlation
length.
3. Scaling properties of the two-point correlation
function
The observed features of the two-point correlation
function suggest that the system exhibits self-similar
behavior over some range of scales associated with its
nonlinear dynamics and/or the fractal geometry of the
fault network. Usually, this type of behavior depends on
several scaling parameters such as the linear size of the
region under consideration, the lower magnitude cutoff
of earthquakes used, the maximum time interval be-
tween earthquakes specified, etc. These parameters in-
troduce finite-size effects due to spatial limits of the
region considered and the availability of earthquake
catalog data in it. Varying these parameters, one can
observe functional changes in the scaling behavior of a
given distribution. Moreover, in some instances it is
possible to introduce a scaling law that incorporates in a
unified manner the size effects of the distribution func-
tion. In statistical physics this approach is known as a
after several large earthquakes in California. A moving event window
al of 2 years prior to and after the main shocks to compute the time
R. Shcherbakov et al. / Tectonophysics 413 (2006) 53–62 57
finite-size scaling analysis (Barber, 1983). In this sec-
tion, we have analyzed the scaling properties of the
two-point correlation function introduced previously by
varying the lower magnitude cutoff mc of earthquakes,
the maximum time interval between earthquakes T, and
the linear size of the region under consideration L or the
maximum distance between pairs of earthquakes R. We
have performed this analysis for aftershock sequences
of large main shocks in California and for the seismicity
for all of Southern California.
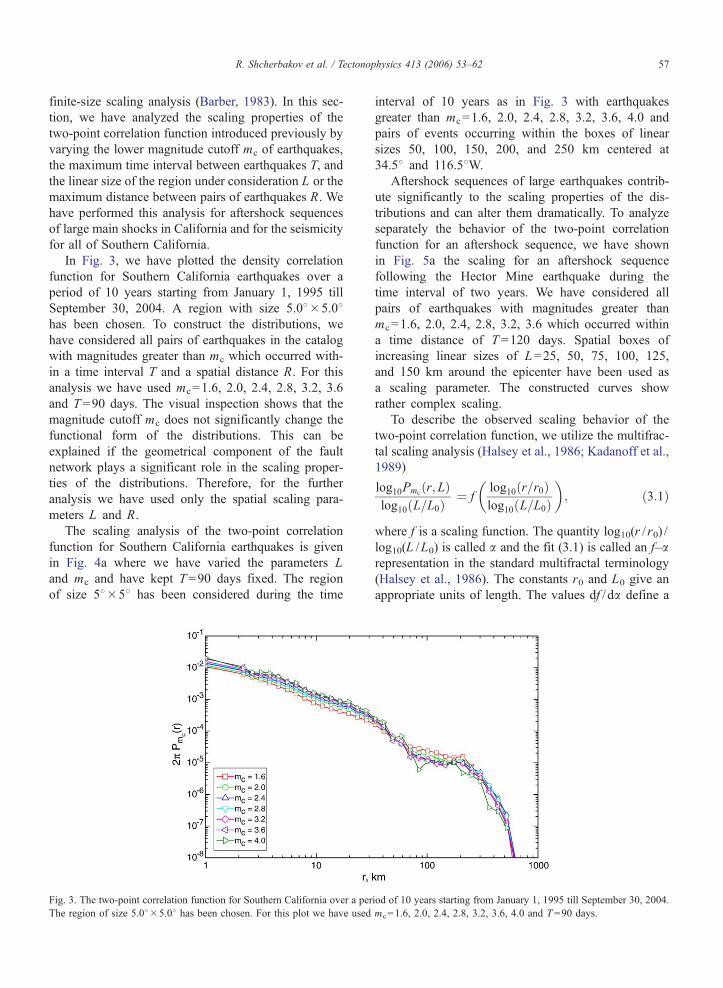
In Fig. 3, we have plotted the density correlation
function for Southern California earthquakes over a
period of 10 years starting from January 1, 1995 till
September 30, 2004. A region with size 5.08�5.08has been chosen. To construct the distributions, we
have considered all pairs of earthquakes in the catalog
with magnitudes greater than mc which occurred with-
in a time interval T and a spatial distance R. For this
analysis we have used mc=1.6, 2.0, 2.4, 2.8, 3.2, 3.6
and T=90 days. The visual inspection shows that the
magnitude cutoff mc does not significantly change the
functional form of the distributions. This can be
explained if the geometrical component of the fault
network plays a significant role in the scaling proper-
ties of the distributions. Therefore, for the further
analysis we have used only the spatial scaling para-
meters L and R.
The scaling analysis of the two-point correlation
function for Southern California earthquakes is given
in Fig. 4a where we have varied the parameters L
and mc and have kept T=90 days fixed. The region
of size 58�58 has been considered during the time
Fig. 3. The two-point correlation function for Southern California over a per
The region of size 5.08�5.08 has been chosen. For this plot we have used
interval of 10 years as in Fig. 3 with earthquakes
greater than mc=1.6, 2.0, 2.4, 2.8, 3.2, 3.6, 4.0 and
pairs of events occurring within the boxes of linear
sizes 50, 100, 150, 200, and 250 km centered at
34.58 and 116.58W.
Aftershock sequences of large earthquakes contrib-
ute significantly to the scaling properties of the dis-
tributions and can alter them dramatically. To analyze
separately the behavior of the two-point correlation
function for an aftershock sequence, we have shown
in Fig. 5a the scaling for an aftershock sequence
following the Hector Mine earthquake during the
time interval of two years. We have considered all
pairs of earthquakes with magnitudes greater than
mc=1.6, 2.0, 2.4, 2.8, 3.2, 3.6 which occurred within
a time distance of T=120 days. Spatial boxes of
increasing linear sizes of L=25, 50, 75, 100, 125,
and 150 km around the epicenter have been used as
a scaling parameter. The constructed curves show
rather complex scaling.
To describe the observed scaling behavior of the
two-point correlation function, we utilize the multifrac-
tal scaling analysis (Halsey et al., 1986; Kadanoff et al.,
1989)
log10Pmcr; Lð Þ
log10 L=L0ð Þ ¼ flog10 r=r0ð Þlog10 L=L0ð Þ
�;
�ð3:1Þ
where f is a scaling function. The quantity log10(r / r0) /
log10(L /L0) is called a and the fit (3.1) is called an f–arepresentation in the standard multifractal terminology
(Halsey et al., 1986). The constants r0 and L0 give an
appropriate units of length. The values df / da define a
iod of 10 years starting from January 1, 1995 till September 30, 2004.
mc=1.6, 2.0, 2.4, 2.8, 3.2, 3.6, 4.0 and T =90 days.
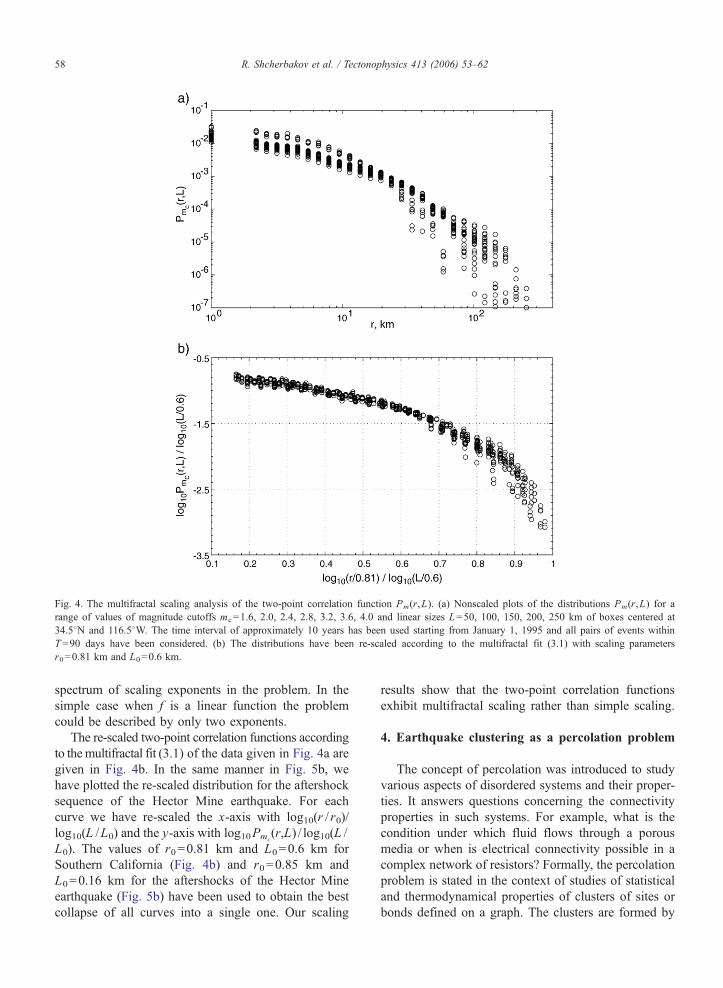
Fig. 4. The multifractal scaling analysis of the two-point correlation function Pm(r,L). (a) Nonscaled plots of the distributions Pm(r,L) for a
range of values of magnitude cutoffs mc=1.6, 2.0, 2.4, 2.8, 3.2, 3.6, 4.0 and linear sizes L=50, 100, 150, 200, 250 km of boxes centered at
34.58N and 116.58W. The time interval of approximately 10 years has been used starting from January 1, 1995 and all pairs of events within
T=90 days have been considered. (b) The distributions have been re-scaled according to the multifractal fit (3.1) with scaling parameters
r0=0.81 km and L0=0.6 km.
R. Shcherbakov et al. / Tectonophysics 413 (2006) 53–6258
spectrum of scaling exponents in the problem. In the
simple case when f is a linear function the problem
could be described by only two exponents.
The re-scaled two-point correlation functions according
to themultifractal fit (3.1) of the data given in Fig. 4a are
given in Fig. 4b. In the same manner in Fig. 5b, we
have plotted the re-scaled distribution for the aftershock
sequence of the Hector Mine earthquake. For each
curve we have re-scaled the x-axis with log10(r / r0)/
log10(L /L0) and the y-axis with log10Pmc(r,L) / log10(L /
L0). The values of r0=0.81 km and L0=0.6 km for
Southern California (Fig. 4b) and r0=0.85 km and
L0=0.16 km for the aftershocks of the Hector Mine
earthquake (Fig. 5b) have been used to obtain the best
collapse of all curves into a single one. Our scaling
results show that the two-point correlation functions
exhibit multifractal scaling rather than simple scaling.
4. Earthquake clustering as a percolation problem
The concept of percolation was introduced to study
various aspects of disordered systems and their proper-
ties. It answers questions concerning the connectivity
properties in such systems. For example, what is the
condition under which fluid flows through a porous
media or when is electrical connectivity possible in a
complex network of resistors? Formally, the percolation
problem is stated in the context of studies of statistical
and thermodynamical properties of clusters of sites or
bonds defined on a graph. The clusters are formed by
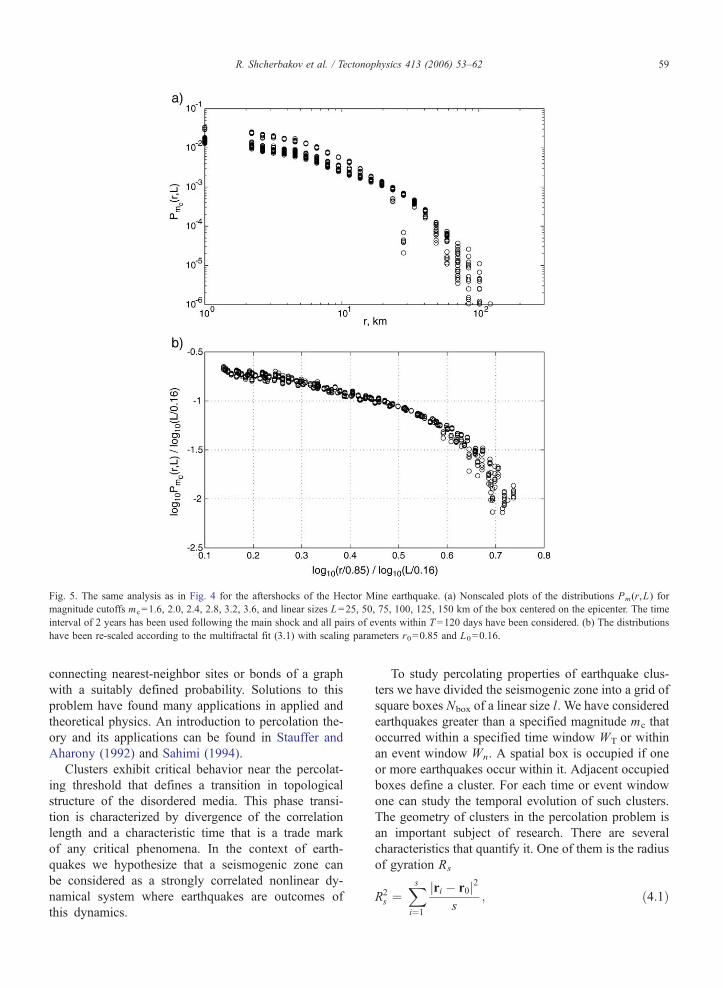
Fig. 5. The same analysis as in Fig. 4 for the aftershocks of the Hector Mine earthquake. (a) Nonscaled plots of the distributions Pm(r,L) for
magnitude cutoffs mc=1.6, 2.0, 2.4, 2.8, 3.2, 3.6, and linear sizes L=25, 50, 75, 100, 125, 150 km of the box centered on the epicenter. The time
interval of 2 years has been used following the main shock and all pairs of events within T=120 days have been considered. (b) The distributions
have been re-scaled according to the multifractal fit (3.1) with scaling parameters r0=0.85 and L0=0.16.
R. Shcherbakov et al. / Tectonophysics 413 (2006) 53–62 59
connecting nearest-neighbor sites or bonds of a graph
with a suitably defined probability. Solutions to this
problem have found many applications in applied and
theoretical physics. An introduction to percolation the-
ory and its applications can be found in Stauffer and
Aharony (1992) and Sahimi (1994).
Clusters exhibit critical behavior near the percolat-
ing threshold that defines a transition in topological
structure of the disordered media. This phase transi-
tion is characterized by divergence of the correlation
length and a characteristic time that is a trade mark
of any critical phenomena. In the context of earth-
quakes we hypothesize that a seismogenic zone can
be considered as a strongly correlated nonlinear dy-
namical system where earthquakes are outcomes of
this dynamics.
To study percolating properties of earthquake clus-
ters we have divided the seismogenic zone into a grid of
square boxes Nbox of a linear size l. We have considered
earthquakes greater than a specified magnitude mc that
occurred within a specified time window WT or within
an event window Wn. A spatial box is occupied if one
or more earthquakes occur within it. Adjacent occupied
boxes define a cluster. For each time or event window
one can study the temporal evolution of such clusters.
The geometry of clusters in the percolation problem is
an important subject of research. There are several
characteristics that quantify it. One of them is the radius
of gyration Rs
R2s ¼
Xsi¼1
jri � r0j2
s; ð4:1Þ
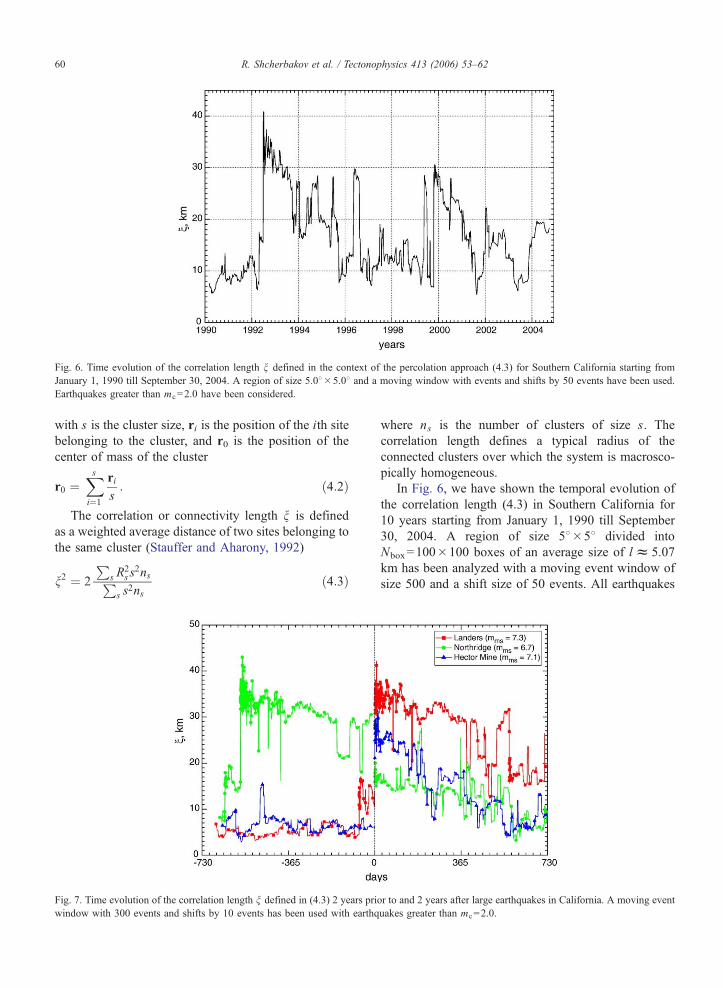
Fig. 6. Time evolution of the correlation length n defined in the context of the percolation approach (4.3) for Southern California starting from
January 1, 1990 till September 30, 2004. A region of size 5.08�5.08 and a moving window with events and shifts by 50 events have been used.
R. Shcherbakov et al. / Tectonophysics 413 (2006) 53–6260
with s is the cluster size, ri is the position of the ith site
belonging to the cluster, and r0 is the position of the
center of mass of the cluster
r0 ¼Xsi¼1
ri
s: ð4:2Þ
The correlation or connectivity length n is defined
as a weighted average distance of two sites belonging to
the same cluster (Stauffer and Aharony, 1992)
n2 ¼ 2
Ps R
2s s
2nsPs s
2nsð4:3Þ
Earthquakes greater than mc=2.0 have been considered.
Fig. 7. Time evolution of the correlation length n defined in (4.3) 2 years pri
window with 300 events and shifts by 10 events has been used with earthq
where ns is the number of clusters of size s. The
correlation length defines a typical radius of the
connected clusters over which the system is macrosco-
pically homogeneous.
In Fig. 6, we have shown the temporal evolution of
the correlation length (4.3) in Southern California for
10 years starting from January 1, 1990 till September
30, 2004. A region of size 58�58 divided into
Nbox=100�100 boxes of an average size of l65.07
km has been analyzed with a moving event window of
size 500 and a shift size of 50 events. All earthquakes
or to and 2 years after large earthquakes in California. A moving event
uakes greater than mc=2.0.
R. Shcherbakov et al. / Tectonophysics 413 (2006) 53–62 61
greater than mc=2.0 has been considered. We have also
plotted, in a manner similar to the analysis performed in
the section on the two-point correlation function, the
time evolution of the correlation length 2 years prior to
and 2 years after the major earthquakes in California.
This is shown in Fig. 7.
5. Concluding remarks
Clustering of earthquakes in space and time is a
well established observational fact. This effect is di-
rectly related to the space-time correlations between
events that play a critical role in earthquake processes.
One of the main aims of this work is to study such
effects through the time evolution of a correlation
length. This quantity is used as a measure of correla-
tions in the system and plays a fundamental role in
studies of critical phenomena. Changes in correlation
length can be used as a precursor to large earthquakes,
although this effect is not well observed and remains
controversial.
In this work, we have discussed the physical basis of
spatial correlations of earthquakes in the context of
critical phenomena. We have studied the temporal evo-
lution of the correlation length defined in the context of
the two-point correlation function and the percolation
problem. We have not found any pronounced temporal
changes in the correlation length prior to large earth-
quakes in California. We have also studied the scaling
properties of the two-point correlation function using
the multifractal analysis. The results obtained suggest
that on the global scale the two-point correlation func-
tion exhibits multifractal scaling with a spectrum of
correlation dimensions. Whereas, on small scales of
order of 25–50 km simple scaling is observed. This
suggests that the highly heterogeneous distribution of
seismicity occurring on the fractal network of faults
exhibits rather complex behavior.
Partial information on correlations is also present in
the Gutenberg–Richter frequency–magnitude statistics
(Gutenberg and Richter, 1954) which is reflected in the
change of the shape of the distribution constructed for
different time periods. Time correlations are well docu-
mented for aftershock sequences and described by the
modified Omori’s law. This law specifies a temporal
decay of aftershock rates and possesses a power-law
scaling. To describe the observed scaling of after-
shocks, Shcherbakov et al. (2004) introduced a gener-
alized formula for the scaling rate which incorporates
the three empirical laws, i.e., the Gutenberg–Richter
relation, the modified Omori’s law, and Bath’s law
(Shcherbakov and Turcotte, 2004).
Acknowledgment
This work has been supported by NASA/JPL Grant
1247848 and US DOE Grant DE-FG03-03ER15380.
References
Bak, P., Christensen, K., Danon, L., Scanlon, T., 2002. Unified scaling
law for earthquakes. Phys. Rev. Lett. 88 (Art. No. 178501).
Barber, M.N., 1983. In: Domb, C., Lebowitz, J.L. (Eds.), Finite-Size
Scaling in Phase Transitions and Critical Phenomena, vol. 8.
Academic Press, London.
Bowman, D.D., Ouillon, G., Sammis, C.G., Sornette, A., Sornette,
D., 1998. An observational test of the critical earthquake con-
cept. J. Geophys. Res. 103, 24,359–24,372.
Christensen, K., Danon, L., Scanlon, T., Bak, P., 2002. Unified
scaling law for earthquakes. Proc. Natl. Acad. Sci. U. S. A. 99,
2509–2513.
Corral, A., 2003. Local distributions and rate fluctuations in a unified
scaling law for earthquakes. Phys. Rev., E 68 (Art. No. 035102).
Corral, A., 2004. Long-term clustering, scaling, and universality in
the temporal occurrence of earthquakes. Phys. Rev. Lett. 92 (Art.
No. 108501).
Frohlich, C., Davis, S.D., 1990. Single-link cluster-analysis as a
method to evaluate spatial and temporal properties of earthquake
catalogs. Geophys. J. Int. 100, 19–32.
Grassberger, P., Procaccia, I., 1983. Characterization of strange attrac-
tors. Phys. Rev. Lett. 50, 346–349.
Guo, Z.Q., Ogata, Y., 1997. Statistical relations between the para-
meters of aftershocks in time, space, and magnitude. J. Geophys.
Res. 102, 2857–2873.
Gutenberg, B., Richter, C.F., 1954. Seismicity of the Earth and
Associated Phenomenon, 2nd ed. Princeton University Press,
Princeton.
Halsey, T.C., Jensen, M.H., Kadanoff, L.P., Procaccia, I., Shraiman,
B.I., 1986. Fractal measures and their singularitiesa the character-
ization of strange sets. Phys. Rev., A 33, 1141–1151.
Harris, R.A., 1998. Introduction to special section: stress triggers,
stress shadows, and implications for seismic hazard. J. Geophys.
Res. 103, 24,347–24,358.
Hohenberg, P.C., Halperin, B.I., 1977. Theory of dynamic critical
phenomena. Rev. Mod. Phys. 49, 435–479.
Jaume, S.C., Sykes, L.R., 1999. Evolving towards a critical point: a
review of accelerating seismic moment/energy release prior to
large and great earthquakes. Pure Appl. Geophys. 155, 279–305.
Kadanoff, L.P., Nagel, S.R., Wu, L., Zhou, S.M., 1989. Scaling and
universality in avalanches. Phys. Rev., A 39, 6524–6537.
Kagan, Y.Y., 1981. Spatial-distribution of earthquakes—the 3-point
moment function. Geophys. J. R. Astr. Soc. 67, 697–717.
Kagan, Y.Y., 1981. Spatial-distribution of earthquakes—the 4-point
moment function. Geophys. J. R. Astr. Soc. 67, 719–733.
Kagan, Y., Knopoff, L., 1976. Statistical search for nonrandom fea-
tures of seismicity of strong earthquakes. Phys. Earth Planet. Inter.
12, 291–318.
Kagan, Y.Y., Knopoff, L., 1980. Spatial-distribution of earthquakes—
the 2-point correlation-function. Geophys. J. R. Astr. Soc. 62,
303–320.
Keilis-Borok, V.I., Soloviev, A.A., 2003. Nonlinear Dynamics of the
Lithosphere. Springer-Verlag, Berlin.
Kosobokov, V.G., Mazhenkov, S.A., 1994. On similarity in the spatial
distribution of seismicity. Comp. Seism. Geodyn. 1, 6–15.
R. Shcherbakov et al. / Tectonophysics 413 (2006) 53–6262
Ma, S.-K., 1976. Modern Theory of Critical Phenomena. W.A. Ben-
jamin, Reading.
Nanjo, K., Nagahama, H., 2004. Fractal properties of spatial distribu-
tions of aftershocks and active faults. Chaos, Solitons Fractals 19,
387–397.
Reasenberg, P., 1985. Second-order moment of central California
seismicity, 1969–1982. J. Geophys. Res. 90, 5479–5495.
Robertson, M.C., Sammis, C.G., Sahimi, M., Martin, A.J., 1995.
Fractal analysis of 3-dimensional spatial distributions of earth-
quakes with a percolation interpretation. J. Geophys. Res. 100,
609–620.
Rundle, J.B., Gross, S., Klein, W., Ferguson, C., Turcotte, D.L.,
1997. The statistical mechanics of earthquakes. Tectonophysics
277, 147–164.
Rundle, J., Klein, W., Turcotte, D.L., Malamud, B.D., 2000. Precur-
sory seismic activation and critical-point phenomena. Pure Appl.
Geophys. 157, 2165–2182.
Rundle, J.B., Turcotte, D.L., Shcherbakov, R., Klein, W., Sammis,
C., 2003. Statistical physics approach to understanding the multi-
scale dynamics of earthquake fault systems. Rev. Geophys. 41
(art. No. 1019).
Sahimi, M., 1994. Applications of Percolation Theory. Taylor and
Francis, London.
Shcherbakov, R., Turcotte, D.L., 2004. A modified form of Bath’s
Law. Bull. Seismol. Soc. Am. 94, 1968–1975.
Shcherbakov, R., Turcotte, D.L., Rundle, J.B., 2004. A generalized
Omori’s Law for earthquake aftershock decay. Geophys. Res.
Lett. 31 (Art. No. L11613).
Sornette, D., Helmstetter, A., 2002. Occurrence of finite-time singu-
larities in epidemic models of rupture, earthquakes, and star-
quakes. Phys. Rev. Lett. 89 (Art. No. 158501).
Stauffer, D., Aharony, A., 1992. Introduction to Percolation Theory,
2nd ed. Taylor and Francis, London.
Zaliapin, I., Keilis-Borok, V., Ghil, M., 2003a. A Boolean delay
equation model of colliding cascades: Part I. Multiple seismic
regimes. J. Stat. Phys. 111, 815–837.
Zaliapin, I., Keilis-Borok, V., Ghil, M., 2003b. A Boolean delay
equation model of colliding cascades: Part II. Prediction of critical
transitions. J. Stat. Phys. 111, 839–861.
Zoller, G., Hainzl, S., 2002. A systematic spatiotemporal test of the
critical point hypothesis for large earthquakes. Geophys. Res.
Lett. 29 (Art. No. 1558).
Zoller, G., Hainzl, S., Kurths, J., 2001. Observation of growing
correlation length as an indicator for critical point behavior prior
to large earthquakes. J. Geophys. Res. 106, 2167–2175.