correlation techniques for catalogue build-up and
TRANSCRIPT

Correlation techniques for catalogue build-up and maintenance with radar and optical
survey measurements
Alejandro Pastor(1), Diego Escobar(1), Manuel Sanjurjo-Rivo(1), and Alberto Águeda(1)
(1) GMV, 11 Isaac Newton 11, Tres Cantos, 28670, Spain, [email protected], [email protected],
[email protected] (2) Universidad Carlos III de Madrid, 30 Av. de la Universidad, 28911 Leganés, Spain, [email protected]
ABSTRACT
The number of resident space objects (RSOs) is increasing year after year and therefore the sensing capabilities. Space
Surveillance and Tracking (SST) and Space Traffic Management (STM) systems are composed by sensors and on-
ground processing infrastructure devoted to generating a catalogue of RSOs: a robust automated database that contains
information of every detected object. The catalogue build-up process consists in detecting new objects to include them
in the catalogue without any previous information, while maintenance entails the update of existing objects
information.
Since 2007 GMV ha been developing and making use of methods to identify, track and catalogue RSOs. The SST
Catalogue Maintainer (catmai) and the companion simulator (catsim) are part of GMV’s SST software suite,
This paper focuses on the different correlation techniques for both radar and optical measurements implemented in
GMV’s cataloguing solution and their performances in terms of clear correlation metrics, such as true positives, false
positives and false negatives. The cataloguing chain, in charge of performing both build-up and maintenance of the
catalogue, takes into account the main sources of potential new objects detection, by order of decreasing frequency:
operational satellites maneuvers, satellites launches and break-up events. Techniques involved entail track-to-orbit
correlation: correlation of uncorrelated tracks (UCTs) with already catalogued objects, track-to-track correlation:
association of UCTs among them in order to identify new objects not previously catalogued and orbit-to-orbit
correlation: correlation of objects of the catalogue with those from external catalogues, as well as cross-correlation for
validation. All these methods rely on initial orbit determination and orbit determination methods, both batch and
sequential estimations.
1 INTRODUCTION
The catalogue of resident space objects RSOs is one of the main outcomes of the SST and STM activities. It is a robust
automated database containing information of every detected object. Large areas of the sky are scanned to obtain data
for both catalogue build-up and maintenance during surveillance activities, while specific RSO are followed during
tracking activities. However, both activities involve the catalogue of RSOs.
On the one hand, catalogue build-up consists in detecting new objects without any prior information. It is driven by
the capability to detect new objects from observations, packed as tracks, provided by the sensor network. A single
track is not usually enough to reliably estimate the orbit of an RSO [1], reason why track association is mandatory if
a robust and automated build-up is sought. This is an NP-hard (Non-deterministic Polynomial-time hard)
combinational optimization problem, i.e. the computational cost increases exponentially with the number of objects.
On the other hand, catalogue maintenance entails the update of existing estimations by means of considering more
and newest observations. Apart from the estimation of the state of the RSOs, required to make state predictions at
future times (necessary for sensor tasking, among others), the associated uncertainty plays an important role during
the maintenance itself and also the generation of SST and STM products [2]. As a matter of this fact, the Mahalanobis
distance [3] is one of the most widely extended figures of merit used for conjunction analysis [4].
The paper is organized as follows. First, we present the sequence we follow to perform catalogue build-up and
maintenance when a track is received, i.e. the cataloguing chain (see section 2). Second, we describe the correlation
techniques that are involved in the previous chain and provide representative results: track-to-orbit correlation (section
3), track-to-track correlation (section 4) and orbit-to-orbit correlation (section 5).
6098.pdfFirst Int'l. Orbital Debris Conf. (2019)

2 CATALOGUING CHAIN
The cataloguing chain is a sequential process to perform the build-up and maintenance of RSO catalogues whenever
a track is received by a sensor network. Before presenting the proposed cataloguing chain itself and to justify the order
of the different components, it is appropriate to review the frequency of the main sources of potential new RSO
detections:
- Operational satellites manoeuvres: more than 400 operational satellites only in GEO [5], each
performing orbit correction manoeuvres every week or two weeks.
- Satellites launches: more than 200 spacecraft launched per year [6], considering also small satellites and
microsatellites, growing in popularity in recent times.
- Break-up events: less than 10 break-up events are happening every year [7].
The most frequent source, maneuvers, result in RSOs state changes. Special actions are required to avoid generating
a new objects when observing them after maneuvers, otherwise the catalogue could be polluted with wrong new
detections and the pattern of life of RSOs could not be maintained.
Fig. 1 shows a simplified dataflow of the cataloguing chain including the main components from the correlation point
of view. For the sake of simplicity, maneuver and fragmentation detection, although necessary, are not included in the
dataflow. This rationale is implemented in GMV’s SST Catalogue Maintainer software (catmai) and the companion
simulator (catsim).
Fig. 1. SST Catalogue Maintainer Software (catmai) cataloguing chain simplified dataflow.
When a new track is received, the first step is to try to correlate it against the existing catalogue via track-to-orbit
correlation, i.e. correlation of tracks against orbits from already catalogued RSOs. This track correlation must cover
maneuver detection and estimation, since it is the most frequent source of potential new objects. Should this track
correlation succeed (the track is linked to an already catalogued RSO), the catalogued orbit estimation is updated by
considering new observations via orbit determination. If not, the track may belong to a new launch or break-up event
product, and thus it is associated with other uncorrelated tracks (UCTs). This track-to-track correlation may take
some time until enough tracks from the potential new RSO are received. In the case of a potential new object detection,
i.e. track associated with previous UCTs, two additional crosschecks are performed before adding the new object to
the catalogue: duplicated object identification and maneuver detection via orbit-to-orbit correlation. Although they
may seem redundant, they improve robustness to the whole chain and serve as backup processing for the previous
correlation algorithms.
Apart from the processing of new tracks obtained with the sensor network, external sources, such as Space-Track’s
TLE public catalogue [8], may be convenient for RSO denomination matching and quality assessment.
New Track
Correlation against catalogue
(track-to-orbit)
Success?
Not a new object
Update catalogued orbit via
Orbit Determination
Check duplicated objects
(orbit-to-orbit)
Track association(track-to-track)
Catalogue Build-upCatalogue Maintenance
Catalogue cross-correlation
(orbit-to-orbit)
External Catalogue
New object?
Duplicated?
New object
Yes
Yes
No
No
Uncorrelated tracks
No
Yes
6098.pdfFirst Int'l. Orbital Debris Conf. (2019)

Both real and simulated scenarios have been prepared to provide some insights on the three correlation techniques
above presented. The performance of the correlation algorithms has been evaluated in terms of the following metrics:
- Number of correct associations/pairs (true positives): validated associations/pairs containing tracks/orbits
that belong to the same object.
- Number of incorrect associations/pairs (false positives): validated associations/pairs containing
tracks/orbits that do not belong to the same object.
- Number of correctly not validated associations/pairs (true negatives): not validated associations/pairs
containing tracks/orbits that do not belong to the same object. They have been evaluated but not considered
as validated.
- Number of wrongly not validated associations/pairs (false negatives): not validated associations/pairs
containing tracks/orbits that belong to the same object. As well as true negatives, they have been evaluated
but not considered as validated.
- Number of missed objects: those objects that have not been detected. The corresponding associations/pairs
may have been considered but not validated, or not considered at all.
3 TRACK-TO-ORBIT CORRELATION
The track-to-orbit correlation entails the correlation of tracks against orbits from already catalogued RSOs. It is the
first correlation technique present in the cataloguing chain, since most of the tracks received by a consolidated sensor
network are expected to belong to already catalogued RSOs. It is required to update the orbit estimation with new
incoming observations. Hence, this family of correlation techniques is mostly focused on cataloguing maintenance.
Some approaches perform this correlation on the orbit domain, by directly inspecting differences between two state
vectors, the first estimated from the incoming track and the second propagated or interpolated from the catalogued
orbits (see [1], [9] and [10]). This orbital difference can be projected on the covariance ellipsoid of each estimation,
although this requires uncertainty realism, i.e. proper uncertainty modeling and characterization. The main drawback
of these approaches is that the estimated orbit from a single track is not reliable enough.
On the contrary, the correlation can be performed on the observation domain, by comparing synthetic measurements
(generated by using orbit predictions) to real ones provided by the sensor network, as shown in Fig. 2. Several
techniques can be applied to the correlation problem, such as quality thresholds (to evaluate the likelihood of the best
correlation with respect to the second-best one), intermediate thresholds, filters and corrections aimed at minimizing
miscorrelations. Preliminary pruning, synchronization, as well as task parallelization are desirable to evaluate only
feasible correlations and avoid generating synthetic tracking for the entire sensor network and catalogued RSOs.
Fig. 2. Distribution of the azimuth and elevation of synthetic and real tracks.
The proposed correlation solution has been proved to be efficient in terms of computation time and very effective for
correlation on the observation domain. One of the main caveats in the process of correlation is the appearance of false
Synthetic track
Real track
Ele
vat
ion
(ra
d)
Azimuth (rad)
6098.pdfFirst Int'l. Orbital Debris Conf. (2019)

positives, since they may lead to a pollution of the catalogue. The correlation performance has been analyzed by using
GMV’s implementation under a simulated radar scenario, RADAR-A (see Annex for details). As shown in Fig. 3, the
considered figure of merit is suitable to distinguish between true positives (green) and false positives (red) by filtering
the candidate pairs according to certain threshold, depicted as a black dotted line.
Fig. 3. Track-to-orbit standard method figure of merit distribution of the tracks in RADAR-A scenario.
In terms of correlation metrics, these results are summarized in Table 1. Most of the tracks are correctly correlated
(99.10%) with less than 0.14% of false positives. Miscorrelations only occur due to values close to the selected
correlation figure of merit threshold. Therefore, most could be easily avoided by reducing the threshold value at the
expense of a higher percentage of false negatives. In terms of computational resources, most of the computation time
is spent on synthetic tracking generation (up to half of the overall time).
Table 1. Track-to-orbit correlation metrics in RADAR-A scenario.
Correlation Metrics RADAR-A
Total tracks 43,337 100%
True Positives 42,946 99.10%
False Positives 59 0.14%
False Negatives 332 0.77%
4 TRACK-TO-TRACK CORRELATION
The track-to-track correlation involves the correlation among UCTs, also known as track association. The role of this
technique in the cataloguing chain is to create groups of tracks (associations) belonging to a common RSO. It is
required to add a new RSO in the catalogue without any prior knowledge. The association of tracks is essential for the
catalogue build-up since otherwise the accuracy of the estimated orbits would not be enough to allow posterior track-
to-orbit correlation when more tracks are received once the RSO has been detected.
Again, due to the single track orbit estimation reliability drawback, the correlation is performed on the observation
domain. The methodology proposed (detailed in [11] and [12]) consists in a multi-step sequential filter that makes use
of initial orbit determination and orbit estimation methods to evaluate associations relying on observations residuals.
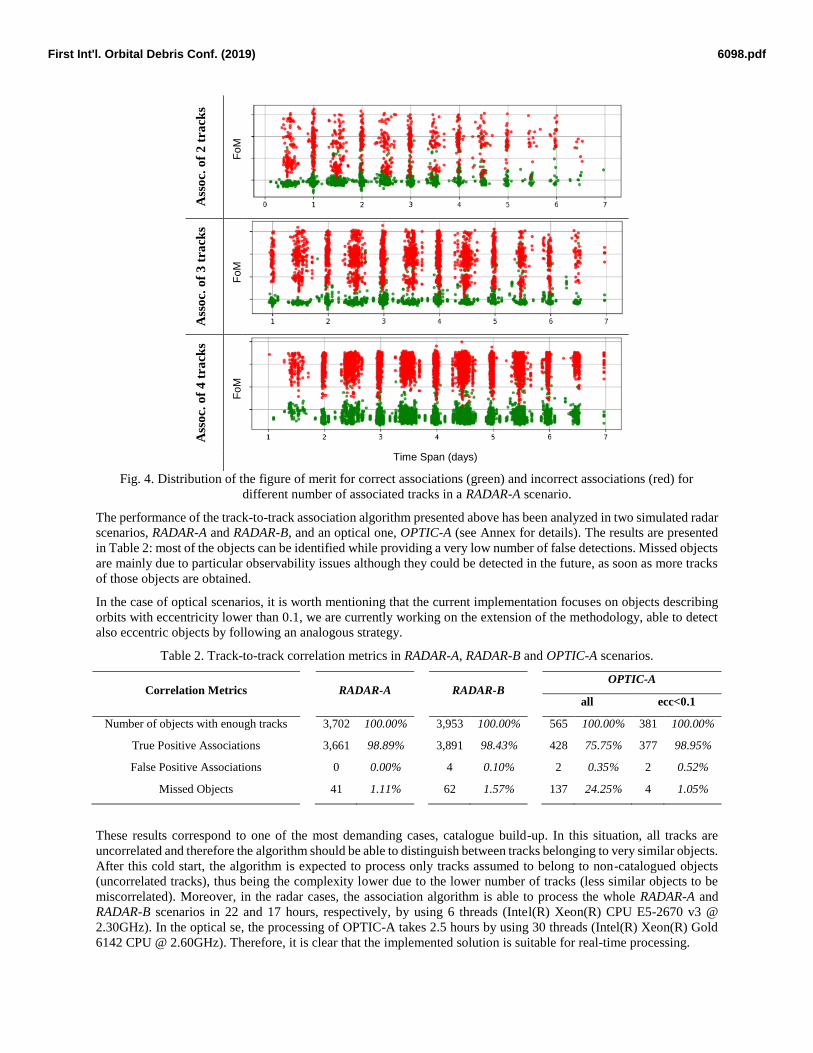
As a matter of the importance of the track association, Fig. 4 shows the distribution of the figure of merit (FoM) along
the time span between associated tracks for true (green) and false (red) associations, i.e. tracks belonging to the same
and different RSOs, respectively. In the case of associations of two tracks, there is not a clear separation between true
and false associations. By increasing the number of associated tracks, two isolated regions arise, allowing to identify
true associations, i.e. newly detected RSOs.
Nu
mb
er o
f tr
acks
Figure of merit
True positives
False positives
True negatives
False negatives
105
104
103
102
101
100
6098.pdfFirst Int'l. Orbital Debris Conf. (2019)
Ass
oc.
of
2 t
rack
s
Fo
M______
A
sso
c. o
f 3
tra
cks
Fo
M______
Ass
oc.
of
4 t
rack
s
Fo
M______
Time Span (days)
Fig. 4. Distribution of the figure of merit for correct associations (green) and incorrect associations (red) for
different number of associated tracks in a RADAR-A scenario.
The performance of the track-to-track association algorithm presented above has been analyzed in two simulated radar
scenarios, RADAR-A and RADAR-B, and an optical one, OPTIC-A (see Annex for details). The results are presented
in Table 2: most of the objects can be identified while providing a very low number of false detections. Missed objects
are mainly due to particular observability issues although they could be detected in the future, as soon as more tracks
of those objects are obtained.
In the case of optical scenarios, it is worth mentioning that the current implementation focuses on objects describing
orbits with eccentricity lower than 0.1, we are currently working on the extension of the methodology, able to detect
also eccentric objects by following an analogous strategy.
Table 2. Track-to-track correlation metrics in RADAR-A, RADAR-B and OPTIC-A scenarios.
Correlation Metrics
RADAR-A
RADAR-B OPTIC-A
all ecc<0.1
Number of objects with enough tracks 3,702 100.00% 3,953 100.00% 565 100.00% 381 100.00%
True Positive Associations 3,661 98.89% 3,891 98.43% 428 75.75% 377 98.95%
False Positive Associations 0 0.00% 4 0.10% 2 0.35% 2 0.52%
Missed Objects 41 1.11% 62 1.57% 137 24.25% 4 1.05%
These results correspond to one of the most demanding cases, catalogue build-up. In this situation, all tracks are
uncorrelated and therefore the algorithm should be able to distinguish between tracks belonging to very similar objects.
After this cold start, the algorithm is expected to process only tracks assumed to belong to non-catalogued objects
(uncorrelated tracks), thus being the complexity lower due to the lower number of tracks (less similar objects to be
miscorrelated). Moreover, in the radar cases, the association algorithm is able to process the whole RADAR-A and
RADAR-B scenarios in 22 and 17 hours, respectively, by using 6 threads (Intel(R) Xeon(R) CPU E5-2670 v3 @
2.30GHz). In the optical se, the processing of OPTIC-A takes 2.5 hours by using 30 threads (Intel(R) Xeon(R) Gold
6142 CPU @ 2.60GHz). Therefore, it is clear that the implemented solution is suitable for real-time processing.
6098.pdfFirst Int'l. Orbital Debris Conf. (2019)

5 ORBIT-TO-ORBIT CORRELATION
The orbit-to-orbit correlation consists in correlating orbits from two catalogues. A typical application of this
correlation technique is to assign designators, such as COSPAR or NORAD, to tag the objects of a catalogue. Besides,
it can be used for detecting duplicated objects (self-correlation) as well as for catalogue quality assessment.
In this case, the correlation is performed on the orbit space, since observations may not be available. Outliers are very
frequent, they may appear if a maneuver is only detected in one of the catalogues, or just as a consequence of
observation offsets between the two SST networks involved. Nevertheless, it is possible to filter them by maintaining
the history of the correlation process and using it to prune spurious correlations. Figure 5 illustrates the daily evolution
of a correlation scenario between two real catalogues of RSO during a whole month. The consideration of historic
correlation data improves the stability of the correlation: the number of true positive pairs (green) increases day after
day, while the number of false positive pairs (red) decreases, remaining only one wrong correlation corresponding to
the docking to SOYUZ MS-08 (NORAD ID: 43238) with ISS (NORAD ID: 25544).
Figure 5: Evolution of the orbit-to-orbit correlation metrics trough daily analyses.
The performance of the orbit-to-orbit correlation algorithm presented above has been analyzed with a software
application implemented by GMV in a scenario of two independent catalogues: the TLE catalogue and a high accuracy
one. Historic data has been considered during May 2018 (i.e. 31 analyses have been performed). In terms of relevant
correlation metrics, the results are presented in Table 3, which proves that the algorithm is able to provide excellent
results for the orbit correlation problem, since most of the orbits can be correctly correlated while providing a very
low number of false positives. Regarding the false negatives, they have been grouped into:
- Young: not enough history data to ensure correlation. Could be correlated in the future when confident
enough orbit pairs are available
- Missed: correlation not evaluated. Most of them related to TLE catalogue accuracy limitations
- Effective: enough history data but was not correlated. Most of them are operational satellites with high
manoeuvring frequencies not properly captured by the TLE catalogue
Table 3. Orbit-to-orbit correlation metrics at the end of the analysis.
Correlation Metrics Value
True Positives 16,013 99.91%
False Positives 1 0.01%
True Negatives 13,476 84.08%
False Negatives 709 4.42%
False Negatives: Young 696 4.34%
False Negatives: Missed 1 0.01%
False Negatives: Effective 12 0.07%
Reference 16,027 100.00%
6098.pdfFirst Int'l. Orbital Debris Conf. (2019)

As an example of outliers detection, Fig. 6 shows the evolution of the figure of merit of a GEO satellite, BRAZILSAT
B3 (NORAD ID: 25152), whose figure of merit evolution exhibits two clear outliers on days 8th and 24th. Despite of
the maneuvers, the orbits are correlated during the whole analysis thanks to correlation history. If it had not been
considered, then these orbits would have been left uncorrelated or wrongly correlated, in the worst case or even worse,
they would have been wrongly correlated.
Fig. 6. Evolution of the orbit-to-orbit figure of merit for BRAZILSAT B3 trough day analyses.
The runtime performance of the algorithm has been evaluated in terms of the CPU time usage. Results are presented
in (Intel(R) Xeon(R) CPU E5-2670 v3 @ 2.30GHz). Each analysis takes less than 40 minutes and it is performed on
its corresponding day.
6 CONCLUSIONS
This paper has presented the cataloguing chain and the role of the main correlation techniques involved in the build-
up and maintenance of a catalogue of RSOs. Different strategies and methodologies have been briefly discussed, as
well as the drivers and rationales behind main decisions taken.
The high success rates presented for the results on different scenarios show how our solutions are applicable to the
cataloguing chain. We are currently working on simulations of the whole cataloguing process with which evaluate the
performance of the complete process: from the reception of the tracks to the build-up and maintenance of the catalogue.
7 ACKNOWLEDGMENTS
This project has received funding from the “Comunidad de Madrid” under “Ayudas destinadas a la realización de
doctorados industriales” program (project IND2017/TIC7700).
Besides, the authors would like to acknowledge the contributions from Alfredo Miguel Antón Sánchez, Pablo García
Sánchez and Adrián Díez Martín from GMV for their support, review and advice.
8 REFERENCES
[1] K. Hill, C. Sabol and K. T. Alfriend, "Comparison of covariance based track association approaches using
simulated radar data," The Journal of the Astronautical Sciences, vol. 59, pp. 281-300, 6 2012.
[2] A. B. Poore, J. M. Aristoff, J. T. Horwood, R. Armellin, W. T. Cerven, Y. Cheng, C. M. Cox, R. S. Erwin, J. H.
Frisbee, M. D. Hejduk, B. A. Jones, P. Di Lizia, D. J. Scheeres, D. A. Vallado and R. M. Weisman, "Covariance
and Uncertainty Realism in Space Surveillance and Tracking," 2016.
[3] P. C. Mahalanobis, "On the generalised distance in statistics," in Proceedings of the National Institute of
Sciences of India, 1936.
[4] S. Alfano, "Conjunction analysis: a review of algorithms with an operational perspective," in AGI User
Exchange, 2007.
6098.pdfFirst Int'l. Orbital Debris Conf. (2019)

[5] E. Johnston, List of Satellites in Geostationary Orbit, 2018.
[6] C. Lafleur, Claude Lafleur's Spacecraft Encyclopedia, 2018.
[7] N. L. Johnson, E. Stansbery, D. O. Whitlock, K. J. Abercromby and D. Shoots, "History of on-orbit satellite
fragmentations (14th edition)," 2008.
[8] J. F. C. C. Space (JFCC SPACE), Space-Track, 2018.
[9] R. Domínguez-González, N. Sánchez-Ortiz, N. Guijarro-López, P. Quiles-Ibernón and J. Nomen-Torres,
"Cataloguing Space Objects from Observations: CORTO Cataloguing System," in 7th European Conference on
Space Debris, ESA/ESOC, Darmstadt, Germany, 2017.
[10] A. Vananti, T. Schildknecht, J. Siminski, B. Jilete and T. Flohrer, "Tracklet-tracklet correlation method for radar
and angle observations," in 7th European Conference on Space Debris, 2017.
[11] A. Pastor, D. Escobar, M. Sanjurjo-Rivo and A. Águeda, "Object detection methods for radar survey
measurements," in 69th International Astronautical Congress, 2018.
[12] A. Pastor, D. Escobar, M. Sanjurjo-Rivo and A. Águeda, "Object detection methods for optical survey
measurements," in 20th Advanced Maui Optical and Space Surveillance Technologies, 2019.
[13] K. Hill, C. Sabol and K. T. Alfriend, "Comparison of Covariance Based Track Association Approaches Using
Simulated Radar Data," The Journal of the Astronautical Sciences, vol. 59, pp. 281-300, 6 2012.
[14] J. M. Aristoff, J. T. Horwood, N. Singh, A. B. Poore, C. Sheaff and M. K. Jah, "Multiple Hypothesis Tracking
(MHT) for space surveillance: theoretical framework," in AAS/AIAA Astrodynamics Specialist Conference,
2013.
[15] P. C. Mahalanobis, "On the generalised distance in statistics," in Proceedings of the National Institute of
Sciences of India, 1936.
6098.pdfFirst Int'l. Orbital Debris Conf. (2019)
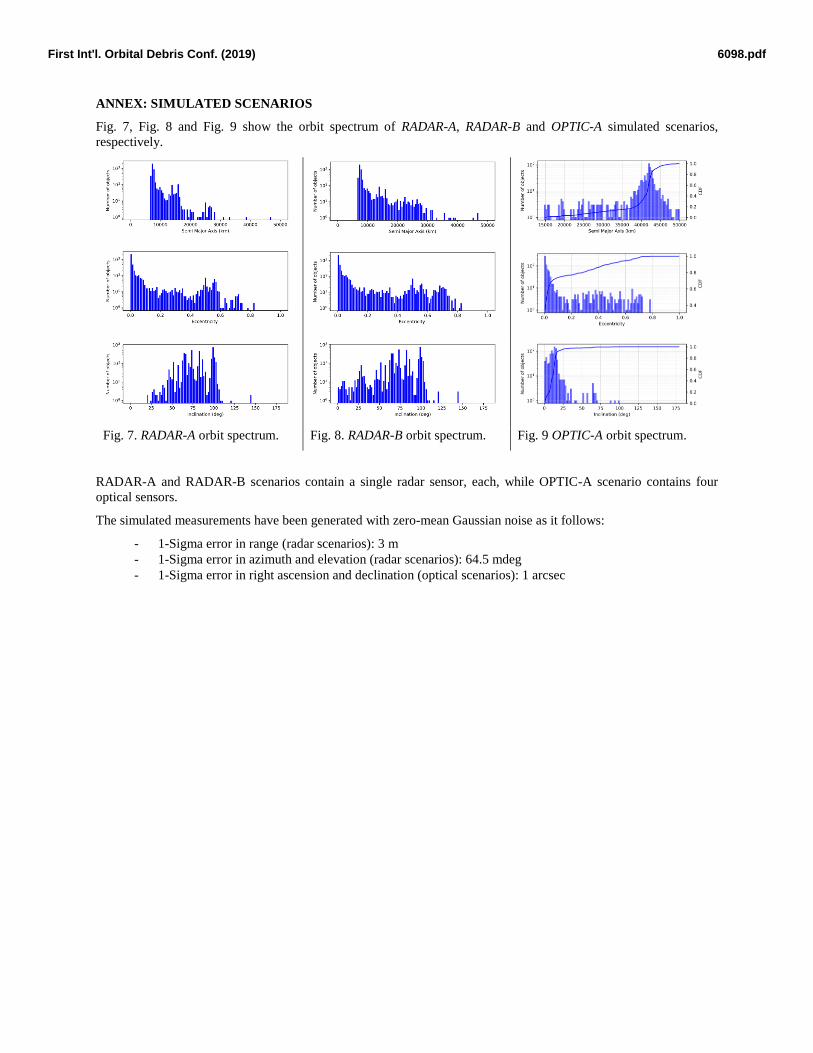
ANNEX: SIMULATED SCENARIOS
Fig. 7, Fig. 8 and Fig. 9 show the orbit spectrum of RADAR-A, RADAR-B and OPTIC-A simulated scenarios,
respectively.
Fig. 7. RADAR-A orbit spectrum. Fig. 8. RADAR-B orbit spectrum. Fig. 9 OPTIC-A orbit spectrum.
RADAR-A and RADAR-B scenarios contain a single radar sensor, each, while OPTIC-A scenario contains four
optical sensors.
The simulated measurements have been generated with zero-mean Gaussian noise as it follows:
- 1-Sigma error in range (radar scenarios): 3 m
- 1-Sigma error in azimuth and elevation (radar scenarios): 64.5 mdeg
- 1-Sigma error in right ascension and declination (optical scenarios): 1 arcsec
6098.pdfFirst Int'l. Orbital Debris Conf. (2019)