correlation of silver release and antimicrobial effect of ...310748/fulltext01.pdf · department of...
TRANSCRIPT

Department of Physics, Chemistry and Biology
Master thesis
Relation of silver release and antimicrobial effect
in-vitro of silver containing wound dressings
Carolin Jakobsen
Master thesis performed at Mölnlycke Health Care
2010-02-05
Linköping University, Department of Physics, Chemistry and Biology
581 83 Linköping

Abstract Silver was used for its antimicrobial effect by the ancient Greeks, long before the
existence of microorganisms were first suspected. Nowadays a wide range of
antimicrobial dressings containing silver, either incorporated within or applied on the
dressings, are available for clinical use. This type of dressings is designed to provide the
antimicrobial activity of silver in a more convenient application.
The aim with this master thesis was to evaluate if silver release and antimicrobial effect
of nine silver containing dressings are dependent on the test medium and if there is any
relation between silver release and antimicrobial effect.
Release of silver and antimicrobial effect was evaluated by using a 6-well co-culture
system, with inoculated test medium in the wells and dressing pieces in the culture well
inserts. Three different test media with increased complexity and nutrient value were
inoculated with either Pseudomonas aeruginosa or Staphylococcus aureus. Antimicrobial
effect and silver concentration were determined after incubation at 35°C for 24 hours by
plate count and atomic absorption spectroscopy, respectively.
Results show that release of silver depends on the test fluid used; for phosphate buffered
saline (PBS), the silver concentration was as most 1.2 ppm, but for a complex media
containing calf serum (SWF), it varied from 9 ppm to 134 ppm. The viable counts in PBS
were reduced by at least 3 log units for all dressings and bacteria, whereas in SWF there
were no reduction and instead growth was observed. In general, a high release resulted in
less bacterial growth. Results also indicated that kinetics of silver release affect the
antimicrobial effect. It is likely to assume that it is important for a dressing to release
silver quickly.
It has previously not been possible to correlate silver release of wound care dressings and
antimicrobial effect, since the two factors have been measured in different test systems
and in different media. Since both factors depend on test medium and method used, it is
shown in the present study that it is important to use relevant test medium for in-vitro
evaluation. When measuring silver release and antimicrobial effect in the same test
system, a relation is found.
Abbreviations
AAS Atom Absorption Spectroscopy
CFU Colony Forming Unit
cSWF Chemical Simulated Wound Fluid
MHC Mölnlycke Health Care
MIC Minimum Inhibition Concentration
PBS Phosphate Buffer Saline
ppm parts per million
PW Peptone Water
STS1 SodiumThioglycolate Solution nr. 1
STS2 SodiumThioglycolate Solution nr. 2
SWF Simulated wound fluid
TSA Tryptic Soy Agar
TSB Tryptic Soy Broth

Table of contents
1 INTRODUCTION ........................................................................................... 1
1.1 Background ..................................................................................................................................... 1
1.2 Aim .................................................................................................................................................. 1
2 THEORETICAL FRAMEWORK .................................................................... 2
2.1 The skin ........................................................................................................................................... 2
2.2 Wound healing ................................................................................................................................ 3 2.2.1 Chronic wounds, infections, and bacteria .................................................................................... 5
2.3 Silver in wound care ....................................................................................................................... 6
3 MATERIAL AND METHODS ......................................................................... 8
3.1 Material ........................................................................................................................................... 8 3.1.1 Silver containing dressings .......................................................................................................... 8 3.1.2 Media ........................................................................................................................................... 9 3.1.3 Bacteria.......................................................................................................................................10
3.2 Two-compartment method ...........................................................................................................10 3.2.1 Principle for two-compartment method ......................................................................................10 3.2.2 Pre-wetting of test pieces............................................................................................................11 3.2.3 Performance ...............................................................................................................................11 3.2.4 Determination of viable counts...................................................................................................12 3.2.5 Determination of silver release ...................................................................................................12
3.3 Experiments ...................................................................................................................................12 3.3.1 Antimicrobial effect and silver release in different media..........................................................12 3.3.2 Kinetics of silver release ............................................................................................................13 3.3.3 Which factors affects the release of silver? ................................................................................13
4 RESULTS .................................................................................................... 15
4.1 Antimicrobial effect and silver release in different media .........................................................15
4.2 Kinetics ...........................................................................................................................................20
4.3 Three factor experiment ...............................................................................................................20
5 DISCUSSION .............................................................................................. 24
6 CONCLUSIONS .......................................................................................... 27
FURTHER WORK .............................................................................................. 28

7 ACKNOWLEDGMENTS .............................................................................. 29
REFERENCES ................................................................................................... 30
APPENDIX A - RELATION BETWEEN SILVER RELEASE AND ANTIMICROBIAL EFFECT ................................................................................ 33
APPENDIX B - RELATION BETWEEN TOTAL CONTENT OF SILVER AND SILVER RELEASE ............................................................................................. 42
APPENDIX C - RELATION BETWEEN TOTAL CONTENT OF SILVER AND ANTIMICROBIAL EFFECT ................................................................................ 47
APPENDIX D - THREE FACTOR EXPERIMENT ............................................... 51

- 1 -
1
1 Introduction
1.1 Background
The normal process of wound healing ensures that most wounds heal quickly and without
complication. However, in clinical practice, assessment skills are often challenged by
patients with infected and chronic non-healing wounds. These wounds can affect the
quality of life of an individual. As lifestyle diseases, such as obesity, diabetes, and
cardiovascular diseases, increase it has been estimated that 1-2% of the population in the
developed countries will experience a chronic wound during their lifetime (Kirketerp-
Møller et al., 2008). Infection caused by bacteria is a common problem in chronic
wounds and is one of the key reasons why wound healing will stall (Landis, 2008). To
help in the healing process several wound dressings with antimicrobial effect has been
developed, among them silver containing dressings.
It is shown that different silver containing wound dressings have different antimicrobial
effect, dependent on which analys method that is used (Thomas & McCubbin, 2003). It is
also shown that antimicrobial effect is not necessarily correlated to total silver content
(Thomas & McCubbin, 2003) or release of antimicrobial substance (Parson et al., 2005).
In the latter study antimicrobial activity and silver release were measured in neither the
same test system nor within the same test fluid. Since Mölnlycke Health Care have
shown in vitro that silver release from silver dressings varies greatly dependent on which
test fluid that is used (Kristina Hamberg, personal communication), it is important to test
both release and antimicrobial activity with the same method and with the same test fluid.
Preferably, this test fluid should simulate the conditions in the wound (i.e. contain salts
and proteins).
If silver release and antimicrobial effect are measured under the same conditions, it may
be possible to see a relation between antimicrobial activity and amounts of released
silver.
1.2 Aim
The aim of this master thesis was to study the antimicrobial effect and silver release from
nine silver containing dressings in different test media. In particular how different media
affects the antimicrobial effect and release of silver and to see if there is any relation
between the amounts of silver released and the impact on bacteria.

- 2 -
2
2 Theoretical framework
2.1 The skin
The skin is the largest organ in the body, covering the entire external surface and forming
about 8% of the total body mass. Its surface area varies with the height and weight of a
person and the thickness of the skin vary from 1.5 to 4.0 mm and is dependent on skin
aging and body region (Chong et al., 2007). Functions and anatomy of the skin relate to
its role in providing the main interface between the body and the external environment
(Clancy & McVicar, 2002).
The skin provides an effective barrier against microbial invasion and has properties that
can protect against mechanical, chemical, osmotic, thermal, and photo damage. It is
capable of adsorption and excretion and is selectively permeable to certain chemical
substances (Chong et al., 2007). These properties are used to protect against loss of body
fluid and in the process of body temperature regulation (Clancy & McVicar, 2002).
The skin is divided in two main parts, epidermis and dermis, and below dermis lies a
subcutaneous layer.
Epidermis forms the outer part of the skin and consists of various layers. Stratum basale
is the basement layer, thus separating the epidermis from dermis. At the basale layer cells
are formed through mitosis and daughter cells ascend toward the surface of the skin and
form following layers (Clancy & McVicar, 2002). During this process cells accumulate a
fibrous and tough protein, keratin, a process called keratinization (Tortora & Grabowski,
2003). Since there are no blood vessels in epidermis, cells undergo apoptosis on their way
to the surface of the skin and the outer layer consists therefore of dead cells with a high
concentration of keratin. This layer gives the skin the toughness needed to provide the
barrier against external physical stress and environmental agents such as bacteria and
chemicals (Clancy & McVicar, 2002).
Dermis underlies epidermis and provides physical strength and flexibility to the skin, as
well as being the matrix that supports the extensive vasculature, lymphatic system and
nerve bundles. The dermis is relatively acellular, being composed predominantly of an
extra cellular matrix (ECM) of collagen fibrils. Fibroblasts, the major cell type in dermis,
produce and maintain most of the ECM (Chong et al., 2007). The spaces between the
fibers contain blood vessels, nerves, sensory receptors, and hair follicles. The upper
region of dermis is formed in a finger-like structure. These “fingers” contain touch-
sensitive receptors and loops of blood which support the cells in the basale layer in
epidermis (Clancy & McVicar, 2002).
The subcutaneous layer consists of loose connective tissue and adipose tissue (fat) that
cushions and insulates the body. This layer also contains sweat glands (Clancy &
McVicar, 2002).

- 3 -
3
2.2 Wound healing
Wound healing or wound repair is the complex process of the skin repairing itself after an
injury. This process is often divided into three or four overlapping phases (Figure 1);
haemostasis (not always considered a phase), inflammatory, proliferative, and remodeling
phase (Jeffcoate et al., 2004; Poole-Warren & May, 2006).
When a wound occurs the most critical homeostatic requirement is to halt bleeding.
Through the action of platelets (trombocytes) and the coagulation system, coupled with
vasoconstriction, bleeding is controlled in a process called haemostasis. Platelets circulate
in the blood as inactive disk-shaped particles. Stimulation makes the platelet "sticky"
which allow adhesion and aggregation (Poole-Warren & May, 2006). The aggregation of
platelets together with fibrin forms a haemostatic plug. Platelets also secrete growth
factors and cytokines which initiate healing by stimulating the inflammatory response
and inducing cell migration into the wound (Jeffcoate et al., 2004; Midwood et al., 2004).
In inflammatory phase wound cleaning is carried out by neutrophils, which solubilize
debris, and monocytes, which differentiate into macrophages and phagocytose debris
(Midwood et al., 2004). Macrophages also release the growth factors necessary to
stimulate fibroplasia and angiogenesis, and thereby regulate the formation of the
provisional extracellular matrix (ECM), which serves as a scaffold for dermal
regeneration and epidermal proliferation (Jeffcoate et al., 2004).
The goal of the proliferative phase is to fill in the wound defect with new tissue and
restore integrity of the skin (Sussman & Jensen, 2007). New blood vessels are formed, in
a process known as angiogenesis. These new blood vessels are necessary to meet the
nutritional needs of the wound healing process. Blood vessels together with fibroblasts
and macrophages replace the fibrin matrix with granulation tissue and keratinocytes
migrate over the newly formed tissue to epithelialise the wound.The keratinocytes that
are behind the leading edge proliferate and mature and, finally, restore the barrier
function of the epithelium. In the later part of this stage, fibroblasts are stimulated by
macrophages and differentiate into myofibroblasts. Myofibroblasts pull granulations
tissue together and minimize the amount of new epithelisation required for closer of the
wound (Gurtner et al., 2008).
In the last phase, remodeling, processes activated after injury wind down and cease
(Gurtner et al., 2008). Most endothelial cells, macrophages and myofibroblasts undergo
apoptosis or leave the wound, leaving a mass of collagen and other extracellular matrix
proteins with only a few cells (Gurtner et al., 2008). Collagen fibrils become organized
into thicker bundles, resulting in stronger, but more rigid, scar tissue (Jeffcoate et al.,
2004). However the tissue never regains the properties of uninjured skin (Gurtner et al.,
2008). The process of remodeling phase may continue for months after wound closure
(Jeffcoate et al., 2004).

- 4 -
4
Figure 1. Three stages of wound repair (a) Haemostasis/Inflammation (b) New tissue formation
(c) Remodeling (Image taken from Gurtner at al., 2008 with permission)

- 5 -
5
2.2.1 Chronic wounds, infections, and bacteria
Wounds that are slow or interrupted in their progress through the stages of wound healing
are referred as chronic wounds. They differ from acute wounds which heal in a timely
and orderly sequential manner (Fong & Wood, 2006).
It is hard to keep a wound sterile, as it is likely to be contaminated by the body's natural
skin flora (Figure 2). In some wounds, pathogens may be colonizing the wound. This
means that they have settled and are reproducing in the wound, but are not affecting the
host (Ayton, 1985). Critically colonization has occurred when colonization is increasing
and the bacteria are competing with the host for nutrients; it leads to the release of toxins
that begin to have a localized effect, demonstrated by delayed healing. Critical
colonization is considered to be detrimental to wound healing and can be treated with
topical antimicrobials (Kingsley, 2001). Wound infection is said to have occurred when
there is a systemic response to an invading pathogen that is multiplying (Ayton, 1985).
Wound infection is today treated with systematic antibiotics, sometimes in combination
with topical antimicrobials (Tong, 2009).
Figure 2. Schematic figure from contamination to infection in a wound.
If the inflammation causing agent cannot be eliminated, or if there is some interference
with the healing process, an acute inflammatory response may progress to the chronic
stage (Wound, Encyclopœdia Britannica, 2010). Infection is a common problem in
chronic wounds and is one of the key reasons why wound healing will stall (Landis,
2008). Within chronic wounds the healing and destructive process are out of balance.
Presence of bacteria most likely causes this imbalance (Kirketerp-Møller et al., 2008).
Chronic wounds seem to remain in a prolonged inflammation, with defective wound
matrix, and failure of reepithelialisation (Gjødsbøl et al., 2006). Signs of chronic wounds
are: presence of necrotic or nonviable tissue, lack of healthy granulations, recurrent
wound breakdown, increasing wound size, and a stasis in wound improvement (Fong &
Wood, 2006).
Chronic wounds have a complex microbial environment with mixed flora, which changes
over time. The longer a wound remains unhealed the more likely it will acquire multiple
Infection
Contamination Colonization
Critical colonization
- 6 -
6
aerobic organisms as well as anaerobic populations (Landis, 2008). In a Danish study the
most common bacteria found in patients with persisting venous leg ulcers were
Staphylococcus aureus (S. aureus), Enterococcus faecalis, Pseudomonas aeruginosa (P.
aeruginosa), coagulase-negative staphylococci, Proteus species, and anaerobic bacteria
(Gjødsbøl et al., 2006). Similar results have been reported from the UK where the most
frequent pathogens associated with wound infections were S. aureus, Streptococcus
species, P. aeruginosa, and anaerobes (White, 2009).
Since S. aureus and P. aeruginosa are common bacteria present in chronic wounds these
two are often used as model bacteria in-vitro. S. aureus is a facultative aerobic Gram
positive bacterium arranged in grape like clusters. The yellow pigmented bacterium is a
frequently part of the normal skin flora. P. aeruginosa is an aerobic, Gram negative
bacterium found everywhere but that primarily is a soil bacterium (Brock et al, 1994).
The bacteria exudates several virulence factors among them a green colored toxin,
pyocyanin, which has been shown to inhibit many cell functions and impair host defenses
through apoptosis (White & Cutting, 2006). Studies have shown that once P. aeruginosa
is present in a wound it likes to stay there and that the bacterium can cause enlargement
or delayed healing of chronic wounds (Gjødsbøl et al, 2006).
2.3 Silver in wound care
Silver has been used for its antimicrobial properties long before the existence of
microorganisms were first suspected. In the antique people learned that water stored in
silver vessels kept quality longer than water stored in other containers and American
settlers placed silver dollars in their wooden water barrels to make it last longer (Burrel,
2003). The biocidal properties of silver ions were first investigated in 1869 (Thomas &
McCubbin, 2003) and silver was found to be effective against a broad range of aerobic,
anaerobic, Gram-negative and Gram-positive bacteria, yeast, fungi, and viruses (Burrel,
2003).
Silver is biologically active in soluble form (Ag+
or Ag0 clusters) and free silver cations
have a powerful antimicrobial effect. It destroys microorganisms by blocking the cellular
respiration and disrupting the function of bacterial membranes. This occurs when silver
cations bind to surface proteins, causing structural changes in the cell membranes which
in turn cause cell death. Silver cations can also bind and denature the bacterial DNA and
RNA thus inhibiting cell replication (Fong & Wood, 2006).
The concentrations of silver needed to create a biological effect are dependent on the
local environment. In aqueous system concentrations as low as 0.01 µg/mL (0.01 ppm)
are effective in controlling bacteria, while in complex organic media, the minimum
inhibitory concentration (MIC) increases 1,000-folds to 5-40 µg/mL (5-40 ppm), which
still is a low concentration compared to other metal ions (Burrel, 2003; Parsons et al.,
2005).
The properties of silver led to usage of topical creams and solutions containing silver. It
has for a long time been used as a mainstay of wound management in burn patients who

- 7 -
7
are especially susceptible to infection. However, disadvantages to the use of creams and
solutions, include staining the skin and toxicity. In addition, the need of frequent removal
and reapplication of e.g. silver sulfadiazine due to the development of pseudoeschar is
both time consuming for professionals and painful for patients (Thomas & McCubbin,
2003).
A range of antimicrobial dressings containing silver either incorporated within or applied
on the dressing are now available for clinical use. The first silver containing dressing was
originally marketed as odor-absorbing dressings for malignant and infected wounds, but
early clinical experience suggested they have beneficial effects on infection, pressure
ulcer and leg ulcer healing rates (Thomas & McCubbin, 2003). This new class of
dressings is designed to provide the antimicrobial activity of topical silver in a more
convenient application (Parsons et al., 2005).
In a study made by Lo et al. (2008) silver dressings significantly improved wound
healing, reduced odor and pain-related symptoms, decreased wound exudates, and had a
prolonged dressing wear time when compared with alternative wound management
approached. Despite that this and other similar studies show good effect using silver,
more evidence to support silver dressings widespread clinical use is needed. There is still
much more to explore about silver and silver in wound dressings (Collier, 2009).
Different dressings differ considerably in the nature of their silver content and in their
physical and chemical properties (Parsons et al, 2005), and may therefore be hard to
compare.
Increased use of silver in wound care has created some concerns regarding the
development of bacterial resistance but, unlike antibiotics, resistance to antiseptics such
as silver (Ag+) is rare and sporadic. It remains to be seen whether resistance will increase.
However, it is important to note that bacteria has been exposed to silver in billions of
years and no widespread resistance has been evident, whereas widespread antibiotic
resistance has developed during the last 60 years (Percival et al, 2005).

- 8 -
8
3 Material and Methods
3.1 Material
3.1.1 Silver containing dressings
In this master thesis nine different dressings have been tested which differ in
characteristic compared to MHC’s own silver products. They differ in material, total
silver amount and silver compound in the dressing. They are all briefly described below,
using the information provided by the manufacturers. A summery of silver compound
and total amount of silver in each dressing are given in Table 1.
Dressing no. 1 consists of three layers; an absorbent inner core between two outer layers
of a nanocrystalline silver-coated polyethylene net.
Dressing no. 2 is a hydrocellular foam dressing containing silver sulphadiazine.
Dressing no. 3 compromises a fleece of sodium carboxymethylcellulose fibers containing
ionic silver. When absorbing wound exudate a gel is created.
Dressing no. 4 is an absorbent dressing impregnated with silver salts made up of three
layers; a lipido-colloid interfence with silver, a super-absorbent polyurethane foam pad
and a protective polyurethane backing.
Dressing no. 5 is a polyurethane foam dressing with an antimicrobial silver complex
homogeneously dispersed throughout the foam.
Dressing no. 6 is an antimicrobial alginate dressing containing an ionic silver complex.
Dressing no. 7 consists of a soft silicone layer and a absorbent polyurethane foam pad
containing silver sulfate and activated carbon. The backing consists of a vapor permeable
and waterproof film.
Dressing no. 8 is an antimicrobial, all-in-one self adherent silicone coated foam dressing,
with a foam pad containing silver sulfate and activated carbon.
Dressing no. 9 consists of a non-woven pad of high tensile strength alginate,
carboxymetylcellulose and silver coated nylon fibers.

- 9 -
9
3.1.2 Media
Three different media have been used in a system with bacteria and silver containing
dressings. Media listed here in decreasing nutrient value and decreasing complexity:
Simulated Wound Fluid (SWF; Fetal Calf Serum and peptone water mixed in
proportions 1:1). This test medium is a complex medium used to simulate
conditions in the wound. In addition to salt and proteins, it also contains
carbohydrates, amino acids, vitamins and other trace elements (Fax from
Invitrogen Eurotech, 9 Nov 2004) Since it contains Fetal Calf Serum, the exact
content of each substance is not known.
Chemical Simulated Wound Fluid (cSWF; 33.000 g Bovine Albumin, 5.8440 g
NaCl, 3.3604 g NaHCO3, 0.2982 g KCl, 0.2775 g CaCl2 mixed in 1 L deionised
water (May, 1982; Vandler et al., 1985)). This test medium is also used to
simulate wound like conditions since it contains both proteins and salts. However,
it is well defined, contains only one type of protein and does not contain any
carbohydrates.
Phosphate Buffered Saline (PBS; 0.036% NaH2PO4H2O, 0.137% Na2HPO4H2O,
0.85% NaCl). This test medium is a buffer solution commonly used in biological
research. The buffer helps to maintain a constant pH. The osmolarity and ion
concentrations of the solution usually match those of the human body (isotonic).
It does not contain any nutrients.
Other chemicals and substances that have been used are
Peptone water (PW; 0.85% NaCl with 0.1% peptone)
STS-inactivation solution number 1 for silver (STS1; 0.9% NaCl, 1% Tween 20,
0.1% sodiumthioglycolate), used for P. aeruginosa
STS-inactivation solution number 2 for silver (STS2; 6.0% NaCl, 1% Tween 20,
0.1% sodiumthioglycolate), used for S. aureus
Wound dressing Type of silver Silver content
(mg/cm2)
Dressing no. 1 Nanocrystalline
elemental silver
1.34 1
Dressing no. 2 Silver sulphadiazine 0.90 1
Dressing no. 3 Ionic silver 0.12 1
Dressing no. 4 Silver sulfate 0.35 1
Dressing no. 5 Ionic silver 0.95 1
Dressing no. 6 Silver sodium hydrogen
zirconium phosphate 0.077
2
Dressing no. 7 Silver sulfate 1.2 1
Dressing no. 8 Silver sulfate 1.2 3
Dressing no. 9 Metallic silver 1.11 1
Table 1. Summary of total silver content and silver compounds in dressings together with batch no. used in
experiments. 1
Anonymous (Product review), 2008, 2 Hamberg, 2008,
3 Personal communication, Kristina
Hamberg

- 10 -
10
Tryptic Soy Agar (TSA; 15 g Tryptone, 15 g Agar, 5 g Soya Peptone, 5 g Sodium
chloride mixed in 1 L deionised water)
Tryptic Soy Broth (TSB; 17 g Pancreatic digest of casein, 5 g Sodium chloride, 3
g Papaic digest of soybean meal, 2.5 g Dibasic potassium phosphate, 2.5 g
Glucose mixed in 1 L deionised water)
3.1.3 Bacteria
Two kinds of bacteria have been used in the experiments;
Pseudomonas aeruginosa (P. aeruginosa) PAO1
Staphylococcus aureus (S. aureus) ATCC 6538
They are both common wound pathogens and represent one Gram-positive bacterium (S.
aureus) and one Gram-negative bacterium (P. aeruginosa).
3.2 Two-compartment method
In order to investigate the pattern of silver release and antimicrobial effect of silver
containing dressings in different media, a method developed at MHC, called the two-
compartment model, was used. The inspiration to this method is taken from an
experiment made by Ågren and Mirastschijski, 2004. This method is still under
modification and therefore a few changes were made to suit the experiment and recreate a
more realistic wound-like environment.
3.2.1 Principle for two-compartment method
6-well plates with lids (Falcon 353046 multiwell) and inserts were used in which pieces
of product were placed (Figure 3). The inserts were then placed in the wells, into which
inoculated medium had been added. The 6-well plates were incubated without agitation
and samples were taken out after specified time. The numbers of viable counts of the test
organism were determined with standard surface plate count method and the amount of
silver released was analysed with atomic absorption spectroscopy (AAS).
Figure 3. Schematic figure of a well in the two compartment model.
Inserts used are Falcon 353493, and they were modified in the following way; the
existing membrane at the bottom of the insert was removed and a non-leachy plastic film
was added instead with glue, after some work with smoothing paper to make the plastic
film dog. The inserts were left to dry overnight and a hole with 12 mm in diameter was
Product
Insert
Plate well
Medium Plastic film

- 11 -
11
punched in the middle. By doing this, the dressing pieces were in direct contact with the
test fluid, as when the dressing is applied on a wound.
The inserts were used multiple times. Before use, inserts were sterilized by soaking them
in Desytol (70% ethanol) for at least 6 h and thereafter left to dry for 1 h in a laminar air
flow hood.
3.2.2 Pre-wetting of test pieces
Since all nine wound dressings differ in absorption
capacity, the test pieces were pre-wetted with
appropriate test fluid before placing them into the
inserts. The aim was to allow the test material to work
in a moist environment without floating around in an
excess of test medium. On the other hand it should be
enough of test medium so a gap between test piece and
medium is not formed. Another reason to the choice of
pre-wetting was to let all dressings work with the same
volume of bacterial suspension.
To find out the volume to add to each dressing three
dressing pieces (Ø18 mm) were weighed and then
placed in a small beaker with water. The pieces
were allowed to absorb water until saturation and
were then weighed again. The difference in weight was considered as the volume of
water absorbed (estimating 1 g of water is 1 mL). The same volume of appropriate test
fluid was added to the test piece prior to the testing (see Table 2).
3.2.3 Performance
One colony of the bacterial strain of interest (P. aeruginosa or S. aureus) was added to 3
mL TSB in a test tube and incubated overnight at 35±2 °C. After incubation
concentration of the bacterial suspension was estimated to 109 CFU/mL.
The overnight culture was diluted in two steps to 106 CFU/mL in selected test medium
(SWF, cSWF, PBS) and aliquots of 2.2 mL inoculated test medium were transferred into
the wells of a 6-well plate. Punched pieces of products (Ø18 mm) were saturated with
uninoculated test medium (see Table 2) and antiseptically placed in the inserts. Inserts
were then placed in the wells and each 6-well plate was placed in a sterile plastic bag, to
decrease evaporation of test medium (too much evaporation will give rise to a gap
between the test piece and the test medium, and silver cannot then be released into the
test fluid). Thereafter plates were incubated for 24 h at 35 °C without agitation.
After incubation inserts with products were removed and the plates were placed in an
ultrasonic bath (NDI 57X) for five minutes, in order to release silver and bacteria from
the surface of the wells. Control trials were performed to ensure that the ultrasonic
Wound dressing SWF (mL)
Dressing no. 1 0.300
Dressing no. 2 2.300
Dressing no. 3 0.500
Dressing no. 4 1.600
Dressing no. 5 2.000
Dressing no. 6 0.650
Dressing no. 7 1.900
Dressing no. 8 1.900
Dressing no. 9 0.700
Table 2. Volume medium added to each
dressing piece.

- 12 -
12
treatment did not inactivate the bacteria (data not shown). Thereafter aliquots of 0.1 mL
were taken out and mixed with 0.9 mL proper inactivation solution (STS1 or STS2) in
sterile test tubes. Tubes were left to react for at least ten minutes; meanwhile the
remainder suspension from each well was transferred to a labeled centrifuge tube with lid
and stored in 4 °C until analysis of silver content with AAS.
3.2.4 Determination of viable counts
The tubes with suspension and inactivation solution were further 10-fold serial diluted
with PW. Aliquots of 0.1 mL of appropriate dilutions were then spread on TSA plates
(duplicate plates for all dilutions) and plates were incubated over night at 35±2 °C for P.
aeruginosa and 2-3 days for S. aureus. After incubation the colonies on the agar plates
with appropriate number of colonies (30-300) were counted which represent the number
of colony forming units (CFU; one or more microorganisms which have multiplied and
formed a colony).
Since the silver in the samples needs to be inactivated prior to plating (done here by a 10-
fold dilution) and only 0.1 mL suspension is spread on the plate, the lowest detection
limit is 102 CFU/mL. Plates with no colonies were set to 10
2 CFU to be able to do further
calculations.
To make it easier and more manageable to represent data of antimicrobial effect all
values of viable counts were recalculated to logarithmic values (log10).
3.2.5 Determination of silver release
Silver concentrations were analysed with atom absorption spectroscopy (AAS; Perkin-
Elmer 1100) at Linköping University, Department of Thematic Studies in Linköping.
Analysis were made using a hollow cathode lamp with silver (λ=328.1 nm) and a flame
to atomize the sample. Merck IV, a multi standard was diluted into concentrations of 1.0
ppm, 2.5 ppm, 5.0 ppm and 10.0 ppm Ag and used to make a calibration curve; Millipore
water with 0.5% nitric acid was used as blank (zero).
Samples with SWF and cSWF were diluted five or fifty (in two steps) times to a
concentration between 0 and 10 ppm to correspond with the calibration of the instrument.
Samples with PBS could be analysed without dilution depending on their low
concentration of silver. Each sample was measured with three replicate and a mean value
was calculated.
3.3 Experiments
3.3.1 Antimicrobial effect and silver release in different media
To study the antimicrobial effect and silver release for the nine silver containing
dressings in different media (SWF, cSWF and PBS) and with different bacteria

- 13 -
13
(P. aeruginosa or S. aureus), the two compartment method were used for all dressings in
six combinations.
All experiments were repeated two or three times, with three replicates each time, for all
nine dressings and a control, consisting of selected test medium and bacteria (106
CFU/mL). Each well were analysed for both antimicrobial effect and concentration of
released silver.
Relations between silver release in dressings and antimicrobial effect were statistically
evaluated in Minitab (Minitab Inc), using one-way ANOVA (analysis of variance) and
Fisher (Appendix A).
Relations between silver release/antimicrobial effect and total content of silver were also
evaluated with the same method (Appendix B & C).
3.3.2 Kinetics of silver release
Since it previously has been shown that there is no correlation between antimicrobial
effect and silver release (Parson et al 2004), there was a theory at MHC that kinetics of
silver release could affect the relation. Amount of silver released at an earlier time point
might correlate with the antimicrobial effect at 24 h (Kristina Hamberg, personal
communication). Therefore, silver release measurements over time were started with the
two compartment model and placed in the incubator. Experiments were stopped after
specified times (1 h, 2 h, 4 h and 8 h) and the concentration of silver was analysed as
above. Measurements have thus not been done in the same well at all times, each time
had it’s own experiment since there need to be a certain volume of suspension when
measuring the amount of silver.
Four of the dressings (Dressing no. 3, Dressing no. 4, Dressing no. 6 and Dressing no. 8)
and two medium (SWF and cSWF) were tested in these experiments together with
P. aeruginosa.
In this experiment antimicrobial effect was not measured, the step with inactivation
solution was therefore excluded. All experiments were made once with six replicates.
3.3.3 Which factors affects the release of silver?
To understand what affects dressings to release silver, an experiment with three factors
on two levels were done (Figure 4). Experiments were made with Dressing no. 8 only and
factors evaluated in the experiment were
high and low incubator temperature, 37 °C/25 °C (=x)
with or without bacteria (=y)
with and without pre-wetting (=z)

- 14 -
14
The reason to why these factors have been chosen is that previous studies at MHC
indicated that they may affect the release of silver (Kristina Hamberg, personal
communication)
To analyse these factors, eight experiments (Table 3) were made with the two
compartment method, using SWF and P. aeruginosa. All experiments were made in six
replicate with an incubation time of 24 h. No antimicrobial effects were studied.
In experiments without pre-wetting, the pre-wetting volume (Table 2) was added to the
well together with the normal volume of 2.2mL medium.
Figure 4 & Table 3. Schematic figure and table over the three factor experiment. The table shows the eight
experiments that have been made. Plus means high temperature, with bacteria and with pre-wetting, minus
means low temperature, without bacteria and without pre-wetting.
Measured values were analysed as a complete three factor experiment with six
observations per cell in Minitab using a balanced ANOVA test. When affecting factors
and interactions between factors had been evaluated, a simplified model was used and
analysis were made with Stat-ANOVA-General, linear model-Comparisons (Appendix
D).
Experiment x y z
1 - - -
2 + - -
3 - + -
4 - - +
5 + + -
6 - + +
7 + - +
8 + + +
Table 3
x
y
z

- 15 -
15
4 Results
4.1 Antimicrobial effect and silver release in different media
The result of antimicrobial effect studies, viable counts log10 CFU/mL, for each dressing
in the media SWF, cSWF and PBS together with bacterial strain P. aeruginosa or S.
aureus are presented in Figure 5 and Figure 6. To differentiate experiments made with
different bacteria, P. aeruginosa are present in diagram with a yellow background and S.
aureus on a gray background.
Data indicates that antimicrobial effect differs with type of bacteria. Viable counts of S.
aureus are higher in SWF and lower in cSWF and PBS in comparison to P. aeruginosa.
Result of antimicrobial effect in SWF shows on an increase of viable counts (initial
concentration in SWF 6.09-6.28 log CFU/mL) for all dressings except for Dressing no. 8
that reduces P. aeruginosa with just more than one log unit and keep S. aureus on its
initial value. In cSWF most dressings reduce viable counts with about one log unit while
viable counts in PBS are reduced with three to four log units. In all experiments a high
antimicrobial effect gave a large scattering and vice versa.
The antimicrobial effect on bacteria also differs among wound dressings. This is
particularly clear in cSWF where Dressing no. 7 and Dressing no. 8 were able to reduce
viable counts of both bacteria with more than three log units whereas Dressing no. 4
barley reduce S. aureus and viable counts of P. aeruginosa increased.
Amount of silver released from each dressing in the media SWF, cSWF and PBS in the
presence of bacteria, P. aeruginosa or S. aureus, are presented in Figure 7 and Figure 8.
Results of released silver are presented in ppm (µg/mL) and shows that release in SWF
and cSWF are in the same range, with a slightly higher release in cSWF. In these media
great variations in amounts of silver released from different dressings are shown.
Dressing no. 7 and Dressing no. 8 release more than the double amount of silver than all
other dressings in SWF and in cSWF even more silver is released. In PBS the release of
silver is only 1/100 of the release in SWF and cSWF and with this medium variations
between dressings are smaller.

- 16 -
16
Viable counts of P. aeruginosa after treatment with silver containing dressings in 24h
0,00
1,00
2,00
3,00
4,00
5,00
6,00
7,00
8,00
9,00
10,00
Dressing no.
1
Dressing no.
2
Dressing no.
3
Dressing no.
4
Dressing no.
5
Dressing no.
6
Dressing no.
7
Dressing no.
8
Dressing no.
9
Control
Wound dressing
Via
ble
co
un
ts (
log
CF
U/m
L)
SWF
cSWF
PBS
Figure 5. Viable counts of P. aeruginosa after treatment with silver containing dressings in 24 h in the
media SWF, cSWF and PBS. Initial values (log CFU/ml) were 6.09 in SWF, 6.14 in cSWF and 5.67 in
PBS. Detection limit is 102 CFU/mL, samples with no detectable counts are therefore set to 10
2. Error bars
represent standard deviation. Results are mean of at least six replicate.
Viable counts of S.aureus after treatment with silver containing dressings in 24h
0
1
2
3
4
5
6
7
8
9
10
Dressing no.
1
Dressing no.
2
Dressing no.
3
Dressing no.
4
Dressing no.
5
Dressing no.
6
Dressing no.
7
Dressing no.
8
Dressing no.
9
Control
Wound dressing
Via
ble
co
un
ts (
Lo
g C
FU
/mL
)
SWF
cSWF
PBS
Figure 6. Viable counts of S. aureus after treatment with silver containing dressings in 24 h in the media
SWF, cSWF and PBS. Initial values (log CFU/ml) were 6.28 in SWF, 6.35 in cSWF and 6.32 in PBS.
Detection limit is 102 CFU/mL, samples with no detectable counts are therefore set to 10
2. Error bars
represent standard deviation. Results are mean of at least six replicate.

- 17 -
17
Release of silver after 24h in suspension with P. aeruginosa
0,00
50,00
100,00
150,00
200,00
250,00
300,00
Dressing no.
1
Dressing no.
2
Dressing no.
3
Dressing no.
4
Dressing no.
5
Dressing no.
6
Dressing no.
7
Dressing no.
8
Dressing no.
9
Control
Wound dressing
Sil
ver
rele
ase (
pp
m)
SWF
cSWF
PBS
Release of silver after 24h in suspension with P. aeruginosa
0,00
5,00
10,00
15,00
20,00
25,00
30,00
35,00
40,00
Dressing no.
1
Dressing no.
2
Dressing no.
3
Dressing no.
4
Dressing no.
5
Dressing no.
6
Dressing no.
7
Dressing no.
8
Dressing no.
9
Control
Wound dressing
Sil
ver
rele
ase (
pp
m)
SWF
cSWF
PBS
Figure 7 A. Release of silver in media SWF, cSWF and PBS together with P. aeruginosa after treatment in
24 h. Error bars represent standard deviation. Results are mean of at least six replicate. 7 B. The figure is a
zoom in from figure A, values for Dressing no. 7 and Dressing no. 8 in SWF and cSWF are therefore out of
range of this graph.

- 18 -
18
Release of silver after 24h in suspension with S. aureus
0,00
50,00
100,00
150,00
200,00
250,00
300,00
Dressing no.
1
Dressing no.
2
Dressing no.
3
Dressing no.
4
Dressing no.
5
Dressing no.
6
Dressing no.
7
Dressing no.
8
Dressing no.
9
Control
Wound dressing
Sil
ver
rele
ase (
pp
m)
SWF
cSWF
PBS
Release of silver after 24h in suspension with S. aureus
0,00
5,00
10,00
15,00
20,00
25,00
30,00
35,00
40,00
Dressing no.
1
Dressing no.
2
Dressing no.
3
Dressing no.
4
Dressing no.
5
Dressing no.
6
Dressing no.
7
Dressing no.
8
Dressing no.
9
Control
Wound dressing
Sil
ver
rele
ase (
pp
m)
SWF
cSWF
PBS
Figure 8 A. Release of silver in SWF, cSWF and PBS together with S. aureus after treatment in 24 h. Error
bars represent standard deviation. Results are mean of at least six replicate. 8 B. The figure is a zoom in
from figure A, values for Dressing no. 7 and Dressing no. 8 in SWF and cSWF are therefore out of range of
this graph.

- 19 -
19
When comparing results of silver released with total content of silver for each dressing
(see Table 4) it is evident that most of the silver is still left in the dressings. Highest ratio,
silver released divided by total silver content, is found for Dressing no. 8 in cSWF, where
around one third of total silver content in dressing are released. If seen to an average
value of all media, Dressing no. 6 is the dressing that releases most silver in regard to
total content and Dressing no. 9 the dressing that release the least. In PBS less than one
percent of total silver content is released in the dressing with highest ratio, most dressings
release as little as 0.05-0.10% of total content.
Silver release of total silver content (%) in
Total silver content
(mg/cm2)
Wound dressing SWF cSWF PBS
Dressing no. 1 2.28 2.07 0.04 1.34 1
Dressing no. 2 2.46 2.59 0.08 0.90 1
Dressing no. 3 16.50 19.17 0.53 0.12 1
Dressing no. 4 3.74 4.36 0.45 0.35 1
Dressing no. 5 2.65 3.10 0.07 0.95 1
Dressing no. 6 20.22 28.09 0.79 0.077 2
Dressing no. 7 14.70 21.65 0.05 1.2 1
Dressing no. 8 14.63 30.18 0.05 1.2 3
Dressing no. 9 1.01 1.63 0.05 1.11 1
Table 4. Silver released in percent of total silver content for each dressing and media. Values are mean
values between silver released together with P. aeruginosa and S. aureus. 1 Anonymous (Product review),
2008, 2 Hamberg, 2008,
3 Personal communication, Kristina Hamberg
There seems to be no relation between total content of silver and silver release in
dressings which is shown by statistical analysis (Appendix B). In these statistical analysis
dressings were grouped after total content of silver into three groups (0.08-0.12 g/cm2;
0.35 g/cm2; 0.90-1.34 g/cm
2). Calculations in Minitab showed no significant difference
(p< 0.05) in silver release between groups in the media SWF and cSWF. In PBS a
significant difference in silver release between the groups was found. Dressing with a
total content of 0.35 g/cm2 released most silver followed by dressings containing 0.90-
1.34 g/cm2 and least silver was released with dressings containing 0.08-0.12 g/cm
2.
Despite the difference between groups there is no relation between silver content and
release, that a greater silver content in dressings would release more silver.
Statistic analysis of relations between total content of silver and antimicrobial effect at 24
h (Appendix C) with the same grouping as above gave the same result and showed no
significant (p< 0.05) difference between groups. Silver amount in dressing is in other
words not in relation with antimicrobial effect.
However, statistical analysis of a relation between silver release and antimicrobial effect
at 24 h (Appendix A) shows that a higher silver release is more effective in reducing

- 20 -
20
bacteria. Grouping was done based on amount of silver released, into one group with high
release and one group with low release, calculations were also done versus the control. In
PBS where the release of silver was low, calculations were only done to compare control
versus experiments with silver release, to see if silver had a reducing effect on bacteria.
Calculations in all tests showed that silver do affect bacteria negatively, however, this
was not significant (p>0.05) for the group with lower release in SWF for any of the
bacteria. The group with higher amount of silver released showed on the other hand
significant (p<0.05 and simultaneous confidence level >83.25%) better antimicrobial
effect compared with the group of lower release. Because of the scattering in silver
release between dressings four groups in SWF together with S. aureus were compared
(control; 7-20 ppm; ~32 ppm; 84-92 ppm). Result of this test showed that a release of 32
ppm and a release of 84-92 ppm were significantly better in reducing bacteria then a
release of 7-20 ppm. Result also showed that release of 84-92 ppm gave a better
antimicrobial effect than release of 32 ppm, this difference was, however, not significant.
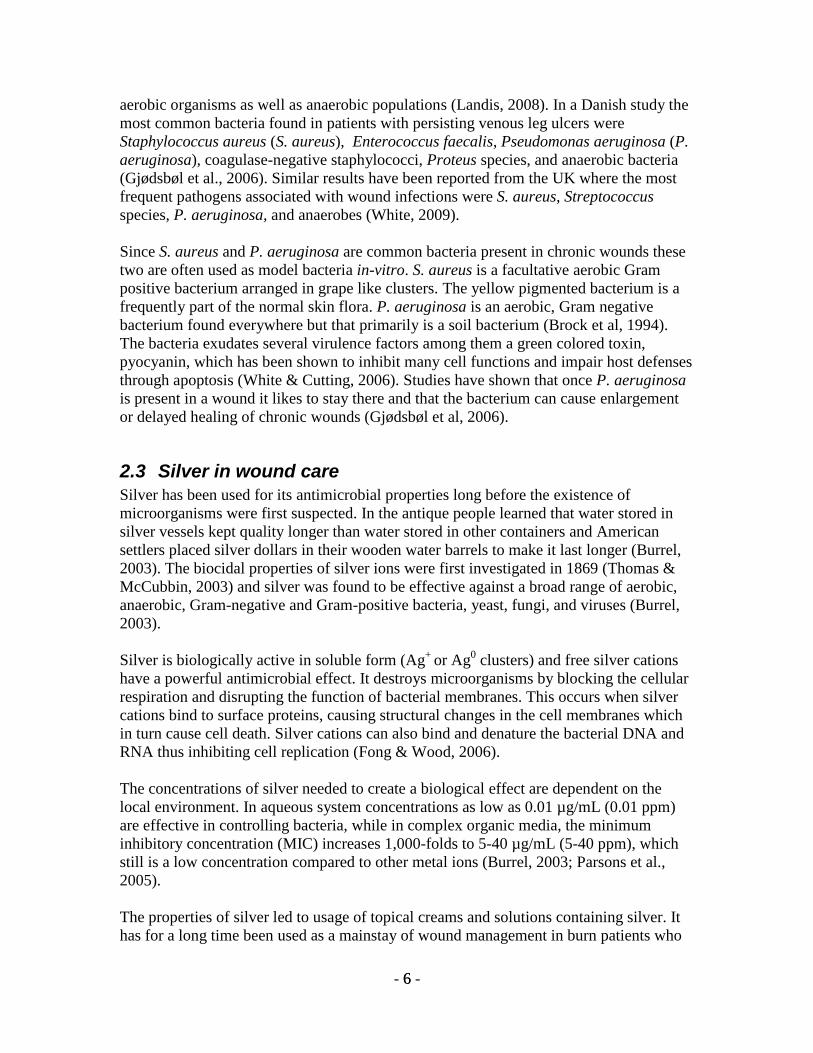
The relation between silver release and antimicrobial effect can also be seen in a diagram
where viable counts are plotted against amount of silver released (Figure 9 and Figure
10). The relation is most obvious in SWF and cSWF in presence of S. aureus. In PBS
with P. aeruginosa there seems to be no relation between silver release and antimicrobial
effect.
4.2 Kinetics
Results from experiments of kinetics of silver release over time (Figure 11) shows that
most dressings release most of the silver during the first couple of hours, following a
logarithmic release pattern. Graphs show on a steep slope during the first hours that
thereafter flatten out. One of the dressings, Dressing no. 4 seems to release the same
amount of silver over the whole time interval, i.e. the release pattern is linear.
Since the wide scattering of silver release made it impossible to correlate this data, no
calculations could be done on relations between silver release at different time points and
antimicrobial effect after 24h. The result of kinetics is instead further discussed in the
Discussion selection (Chapter 5).
4.3 Three factor experiment
Result of a balanced ANOVA test (Appendix D) showed that two factors (y=bacteria and
z=pre-wetting) and one interaction (xy=temperature and bacteria) of tested factors affect
the release of silver in Dressing no. 8, however only pre-wetting significantly (p<0.05
and simultaneous confidence level >80%) affect the release, with a higher release when
dressing was pre-wetted. Temperature alone does not seem to affect the release at all.
- 21 -
21
Silver release vs. Viable counts of P. aeruginosa after treatment in 24h
0,00
1,00
2,00
3,00
4,00
5,00
6,00
7,00
8,00
9,00
10,00
0,00 50,00 100,00 150,00 200,00 250,00
Silver release (ppm)
Via
ble
co
un
ts (
log
CF
U/m
L)
SWF
cSWF
PBS
Silver release vs. Viable counts of P. aeruginosa after treatment in 24h
0,00
0,50
1,00
1,50
2,00
2,50
3,00
3,50
4,00
4,50
0,00 0,20 0,40 0,60 0,80 1,00 1,20 1,40
Silver release (ppm)
Via
ble
co
un
ts (
log
CF
U/m
L)
PBS
Figure 9 A. Viable counts of P. aeruginosa plotted against the release of corresponding silver dressing in
SWF, cSWF and PBS. 9 B. This figure is a zoom in from figure A showing viable counts of P. aeruginosa
plotted against the release of corresponding silver dressing in PBS.

- 22 -
22
Silver release vs. Viable counts of S. aureus after treatment in 24h
0,00
1,00
2,00
3,00
4,00
5,00
6,00
7,00
8,00
9,00
10,00
0,00 50,00 100,00 150,00 200,00 250,00
Silver release (ppm)
Via
ble
co
un
ts (
log
CF
U/m
L)
SWF
cSWF
PBS
Silver release vs. Viable counts of S. aureus after treatment in 24h
0,00
0,50
1,00
1,50
2,00
2,50
3,00
3,50
0,00 0,10 0,20 0,30 0,40 0,50 0,60 0,70 0,80 0,90 1,00
Silver release (ppm)
Via
ble
co
un
ts (
log
CF
U/m
L)
PBS
Figure 10 A. Viable counts of S. aureus plotted against the release of corresponding silver dressing in
SWF, cSWF and PBS. 10 B. This figure is a zoom in from figure A showing viable counts of S. aureus
plotted against the release of corresponding silver dressing in PBS.

- 23 -
23
Silver release over time
0,00
50,00
100,00
150,00
200,00
250,00
0 5 10 15 20 25
Time (h)
Sil
ver
rele
ase (
pp
m) Dressing no. 3 SWF
Dressing no. 3 cSWF
Dressing no. 4 SWF
Dressing no. 4 cSWF
Dressing no. 6 SWF
Dressing no. 6 cSWF
Dressing no. 8 SWF
Dressing no. 8 cSWF
Silver release over time
0,00
5,00
10,00
15,00
20,00
25,00
0 5 10 15 20 25
Time (h)
Accu
mu
late
d s
ilver
rele
ase (
pp
m)
Dressing no. 3 SWF
Dressing no. 3 cSWF
Dressing no. 4 SWF
Dressing no. 4 cSWF
Dressing no. 6 SWF
Dressing no. 6 cSWF
Figure 11 A. Release of silver over time for four selected dressings in two different mediums. Results are
mean of six replicate. 11 B. This diagram is a close-up of figure A.
- 24 -
24
5 Discussion This study shows that the antimicrobial effect, viable counts, is affected both by type of
medium and bacterium. The release of silver is on the other hand only affected of type of
medium.
Results show that in a nutrient poor medium it is easier to reduce the amount of bacteria.
Both bacteria tested have the highest viable counts in SWF, with growth for most of the
dressings, thereafter in cSWF and lowest in PBS. In a medium poor in nutrition the
bacteria is already diminished and therefore more affected by the antimicrobial substance.
This is also shown by the fact that the control of S. aureus in PBS is reduced from its
initial value with almost one log unit. In SWF which is a medium with lots of nutrients,
bacteria can tolerate higher concentrations of silver, in accordance with the study by
Burrel (2003).
With most dressings it is harder to reduce S. aureus in SWF than P. aeruginosa. It is on
the other hand easier to reduce S. aureus than P. aeruginosa in cSWF and PBS. Since P.
aeruginosa is a bacterium with very simple nutritional requirements (Brock et al., 1994)
this bacterium probably handles the stress of the low nutrition better and is therefore less
affected of silver in these environments. In SWF where both bacteria are prosperous one
reason might be that S. aureus has the advantage of being a gram positive bacterium in
grape like clusters, where the bacteria protect each other, however, this is only
speculations.
Dressing no. 7 and Dressing no. 8 reduce bacteria below limit of detection together with
cSWF and PBS in some of the wells and therefore these dressings seem to have equal
effect in both media. Since all other dressings reduced bacteria significantly more in PBS
it is most likely that also these products reduce more bacteria in PBS only that this can
not be shown in this experiment because of limit of detection.
Type of bacteria does not seem to affect the silver release in dressings. There is no
significant difference in silver release comparing experiments with the two tested
bacteria, despite for experiments with Dressing no. 7 and Dressing no. 4 together with
SWF. In both cases less silver are released from the dressings when combined with S.
aureus than with P. aeruginosa. This is probably just a coincidence depending on
dressings wide spread of silver release. Analyses of three factor experiment also showed
that presence of bacteria did not significantly affect the silver release.
It is easy to see a big difference of silver release in different media. The highest amount
of silver is released in cSWF, in which several dressings show a significant higher
amount of released silver compared with silver released in SWF. All dressings have a
significant lower release in PBS, compared with both SWF and cSWF.
Chloride ions are well known to affect the availability of ionic silver (Percival et al.,
2005). Silver ions form in the presence of chloride ions the minimally soluble and
inactive salt silver chloride (solubility 89 µg/100 g water; Weast, 1973) and are therefore

- 25 -
25
thought to affect the release from wound care dressings. Since chloride ions are present in
all three media in approximately the same concentrations this should not be the reason to
the great variations of release between media.
The difference in release of silver could instead depend on the protein content and
presence of phosphate. SWF contains about 20 g protein per liter (Fax from Invitrogen
Eurotech, 9 Nov 2004) whereof about half is the protein albumin while cSWF contains
just over 30 g of the protein albumin which is the only present protein in cSWF. Silver
most likely bind to proteins in solution and experiments with albumin in earlier reports
(Schierholz et al., 1998) have shown that three mole of silver ions specifically can bind to
one mole of albumin. This means that in cSWF, which probably contains the triple
amount albumin and fifty percent more protein in total compared to SWF, more silver
ions bind to protein, equilibrium is disowned and more silver ions can be released. The
low release in PBS is harder to explain. Since both SWF and cSWF contain less
phosphate than PBS, the source in low release probably lies in the presence of phosphate
in solution. Phosphate may bind to silver in the dressing and create silver orthophosphate,
which is a poorly soluble salt (solubility 650 µg/100 g water; Weast, 1973). If this occurs
the salt seems to stay in the dressing.
It is important to remember that all tests of silver concentrations fail to distinguish in
which form the silver is, they only tell us total amount of silver in solutions. Most likely
some of the silver binds to protein (as described above) and to chloride ions present in the
media. It is not clear whether silver in this form affect bacteria or not. However, it seems
like more silver gives better effect (discussed below).
All dressings release quite small amounts of silver compared to total content in the
dressing. Since all dressings could be used for more than one day (3-7 days depending on
dressing) it is important that all silver is not released during the first day, but for some
dressing there is barley any release if seen to total content in dressing. In SWF, that best
simulates conditions in a wound, one of the dressings only releases 1% of total content
during 24 h and the dressing with the highest release compared to total content of silver
release 20%. Most of the silver stay in the dressing, of that reason it would be interesting
to study the release for a longer time.
Previous studies show that antimicrobial effect does not correlate to total silver content
(Thomas & McCubbin, 2003) nor to amount of silver released (Parson et al., 2005).
Statistical analysis on data present in this study show in agreement with previous studies
that no relation between antimicrobial effect and total content of silver could be found.
Neither could a relation between total content of silver and silver release from each
dressing be seen. However calculations between silver release and antimicrobial effect
indicate on a relation, which disagree with Parson et al. Here it is shown that a higher
silver release is more effective against bacteria. This is shown for both bacteria in SWF
and cSWF, in both statistical calculations and in diagram with viable counts plotted
against silver release. In PBS the relation is not that obvious, especially with P.
aeruginosa where no relation can be seen.

- 26 -
26
As a result of the great gap in silver release from around 30 ppm to 100 ppm data could
not be correlated. If there is a total correlation, it may imply that all silver that leaves the
dressing is effective. If there is no correlation, then not all silver that comes out of the
dressing is effective, which in turn might imply that different silver substances have
different effectiveness. In present study there seem to be a linear correlation for lower
silver concentrations, but the relation between viable counts (log CFU/ml) and silver
release (ppm) is probably not linear since three times as high silver release does not
results in a third viable counts reduction/inhibition of bacteria. The steep curves for low
concentrations of silver release most probably level off but at which concentration this
occur could not be determined because of the gap.
Due to the present results one question is whether PBS is a relevant test medium or not.
An in-vitro test should be in an environment as similar to the real situation as possibly, to
ensure that it would be efficient on patient. PBS does not contain any nutrition at all and
viable counts were reduced even without silver present (control with S. aureus). Even if it
is not relevant to test antimicrobial effect in PSB, the low silver release from dressings
shows on the importance to choose right media in silver release analysis. It is therefore
suggested that antimicrobial effect and silver release should be studied in the same test
systems, if data is compared with each other.
The experiment to study kinetics was done to see if there is a better relation between
amounts of silver released at any other time point than after 24 h but still to study
antimicrobial effect at 24 h. The release pattern for the dressing has most likely a big role
in reducing the bacteria. Although no calculations could be done on this data, it is likely
to think that it is important for dressings to release silver quickly. Dressing no. 6 and
Dressing no. 4 release the same amount of silver after 24 h, however Dressing no. 6
reduces bacteria far better than Dressing no. 4. In systems with a slow release of silver,
bacteria may get time to grow before silver concentrations are high enough to affect.
The three factor experiment was done to learn which factors that can have effect on the
release. The experiment showed that pre-wetting significantly affected the release of
silver in Dressing no. 8. The question then is whether it was right to use pre-wetting in
experiments or not. An alternative to pre-wetting could have been to add a greater
volume of medium in each well but with a greater volume some of the dressings would
have been floating around on the surface of the medium. It is hard to find a method that
entirely reflects the reality and most probably pre-wetting affected all dressings in the
same direction. If no pre-wetting was used, the antimicrobial effect would most probably
have been reduced, since this factor significantly affected the release. And in turn, an
initial quick release seems to affect the antimicrobial effect.
- 27 -
27
6 Conclusions Antimicrobial effect of wound care dressings varies with media and bacteria used while
amounts of released silver only vary with different media. Bacteria are more sensitive to
silver in a medium poor in nutrition. Since there are great differences in silver release and
antimicrobial effect depending on which media that is used it is important to study both
parameters in the same media to be able to compare data with each other.
In present study there is no relation between total silver content in dressing and silver
release or between total silver and antimicrobial effect, however there is a relation
between silver release and antimicrobial effect. A high silver release is better in reducing
bacteria than lower concentrations.

- 28 -
28
Further work To know more about the relation and correlation between silver release and antimicrobial
effect it would be interesting to find silver dressings that releases between 30-100 ppm
after 24 h in this test method, to fill in the gap and enable a correlation study. Since all
dressings could be left on a wound for more than one day it would also be interesting to
measure antimicrobial effect and silver release after two and three days or as long as the
manufactures says that the product can be used on a wound.
In order to strengthen the conclusions in this thesis it could be interesting to make the
same experiments with other methods to see if the result will still be the same. Other
methods that could be used are dynamic shake flask method, two compartment method
without pre-wetting and zone of inhibition. Dressings could also be tested on bacteria in
biofilm. This is a way to approach a more realistic situation.

- 29 -
29
7 Acknowledgments I would like to thank Mölnlycke Health Care for the opportunity to do this diploma work
and I would like to direct my great appreciation to my supervisor Kristina Hamberg for
excellent guidance and support through this interesting project. You have given me a lot
of inspiration.
My great gratitude also goes to people who helped me in different ways along the way;
Lena Jacobsson, Ewa Sköld and Farideh Taherinejad for all help and support with
my laboratory practice.
Maria Werthén, Magnus Persson, and other persons at Mölnlycke Health Care
that in one way or another helped me complete this job and made me feel very
welcome.
Lena Lundman for helping out with my silver analysis in Linköping.
Eva Enqvist for all time that you spent on studying my results and helping me to
analyse my data with a better method. I really appreciate your help.
Fredrik Björefors my examiner.
Kristian Nygren my opponent.
Ylva Odelberg for helping me with my presentation.
Finally I would like to thank my family for always being there with a helping hand when
I need you.

- 30 -
30
References Anonymous (2008) Product review, Journal of wound technology, 2: 34-55
Ayton M. (1985) Wound care: wounds that won’t heal, Nursing Times, 81: 16-19
Broch T., Madigan M., Martinko J., Parker J. (1994) Biology of Microorganisms, 7th
Edition, Prentice-Hall International Inc., New Jersey
Burrel R.E. (2003) A Scientific Perspective on the Use of Topical Silver Preparations,
OsmomyWound Management, 49: 19-24
Chong E.J., Phan T.T., Lim I.J., Zhang Y.Z., Bay B.H., Ramakrishna S., Lim C.T. (2007)
Evaluation of electospun PCL/gelatin nanofibrous scaffold for wound healing and layered
dermal reconstitution, Acta Biomaterialia 3, 321-330
Clancy J., McVicar A.J. (2002) Physiology & Anatomy – a homeostatic approach, 2nd
Edition, Arnold publishers, Malta
Collier M. (2009) Silver dressings: more evidence is needed to support their widespread
clinical use, Journal of Wound Care, 18: 77-78
Fong J., Woods F. (2006) Nanocrystalline silver dressings in wound management: a
review, International journal of Nanomedicine, 1: 441-449
Gjødsbøl K., Christensen J.J., Karlsmark T., Jørgensen B., Klein B, Krogfelt K. (2006)
Multiple bacterial species reside in chronic wounds: a longitudinal study, International
Wound Journal, 3: 225-231.
Gurtner G., Werner S., Barrandon Y., Longaker M. (2008) Wound repair and
regeneration, Nature, 453: 314-321
Hamberg K., (2008) Internal document: 2008-0252, Mölnlycke Health Care
Jeffcoate W., Price H., Harding K. (2004) Wound healing and treatments for people with
diabetic foot ulcers, Diabetes Metab Res Rev, 20: 78-89
Kingsley A. (2001) A proactive approach to wound infection, Nursing Standard, 15: 50-
58
Kirketerp-Møller K., Jensen P., Fazli M., Madsen K., Pedersen J., Moser C., Tolker-
Nielsen T., Høiby N., Giskov M., Bjarnsholt T. (2008) Distribution, Organization, and
Ecology of Bacteria in Chronic, Wounds Journal of Clinical Microbiology, 46: 2717-
2722
- 31 -
31
Landis S. (2008) Chronic Wound Infection and Antimicrobial Use, Wound Care Journal,
21: 531-540
Lo S-F., Chang C-J., Hu W-Y., Hayter M., Chang Y-T. (2009) The effectiveness of
silver-releasing dressings in the management of non-healing chronic wounds: a meta-
analysis, Journal of Clinical Nursing, 18: 716-728
May R. (1982) Physiological activity from an occlusive wound dressing. Proceedings of
a Symposium at the Queen Elizabeth Post Graduate Centre Birmingham, Medicine
Publishing Foundation, Oxford
Midwood K., Valenick Williams L., Schwarzbauer J. (2004) Tissue repair and the
dynamics of the extracellular matrix, The international Journal of Biochemistry & Cell
Biology, 36: 1031-1037
Parsons D., Bowler P., Myles V., Jones S. (2005) Silver Antimicrobial Dressings in
Wound Management: A Comparison of Antibacterial, Physical, and Chemical
Characteristics, Wounds, 17: 222-232
Percival S.L., Bowler P.G., Russel D. (2005) Bacterial resistance to silver in wound care,
Journal of Hospital Infection, 60: 1-7
Poole-Warren L., May L. Wound Healing Wiley Encyclopedia of Biomedical
Engineering. Ed. Metin Akay. Vol6. Hoboken, NJ: Wiley, 2006, 3862-3870. Gale Virtual
Reference Library. Gale. Linkopings Universitetsbibliotek. 23 Dec. 1009
http://go.galegroup.com/ps/start.do?p=GVLR&u=link.
Schierholz J.M., Wachol-Drewek Z., Lucas L., Pulverer G. (1998) Activity of Silver Ions
in different Media, Zentralblatt für Bakteriologie 287: 411-420
Sussman C., Jensen B. (2007) Wound Care – A collaborative Practice Manual for Health
Professionals, 3:d Edition, Lippinocott Williams & Wilkins, Philadelphia
Thomas S., McCubbin P. (2003) A comparison of the antimicrobial effects on four silver-
containing dressings on three organisms, Journal of Woundcare, 12: 101-107
Thomas S., McCubbin P. (2003) An in vitro analysis of the antimicrobial properties of 10
silver-containing dressings, Journal of Woundcare, 12: 305-308
Tong J., (2009) Case reports on the use of antimicrobial (silver impregnated) soft silicone
foam dressing on infected diabetic foot ulcers, International Wound Journal, 6: 275-284
Tortora G.J., Grabowski S.R. (2003) Principles of Anatomy and Physiology, 10th
Edition,
J Wiley & Sons, New York

- 32 -
32
Vandler A., Sherman J., Luciano D. (1985) Human Physiology – The mechanism of body
functions, 4th
edition, York Graphic Services Inc, New Caledonia
Weast R. (1973) Handbook of Chemistry and Physics, 54th
edition, CRC press1973
Cleveland, Ohio
White RJ. (2009) Wound infection-associated pain, Journal of Wound Care, 18: 245-249
White RJ., Cutting KF. (2006) Critical colonization-the concept under scrutiny, Ostomy
Wound Manage, 52: 50-56
Wound (2010) In Encyclopœdia Britannica, Retrieved January 7, 2010 from
Encyclopœdia Britannica online : http://search.eb.com/eb/article-8005
Ågren M.S., Mirastschijski U. (2004) The release of zink ion from cytocompability of
two zink oxide dressings Journal of Wound Care, 13: 367-369
Personal communication
Kristina Hamberg, Senior Scientist, R&D Wound Care at Mölnlycke Healthcare
Fax
9 Nov 2004 13:00, Biochemical and Hormone Profile for Serum, Invitrogen Eurotech
- 33 -
33
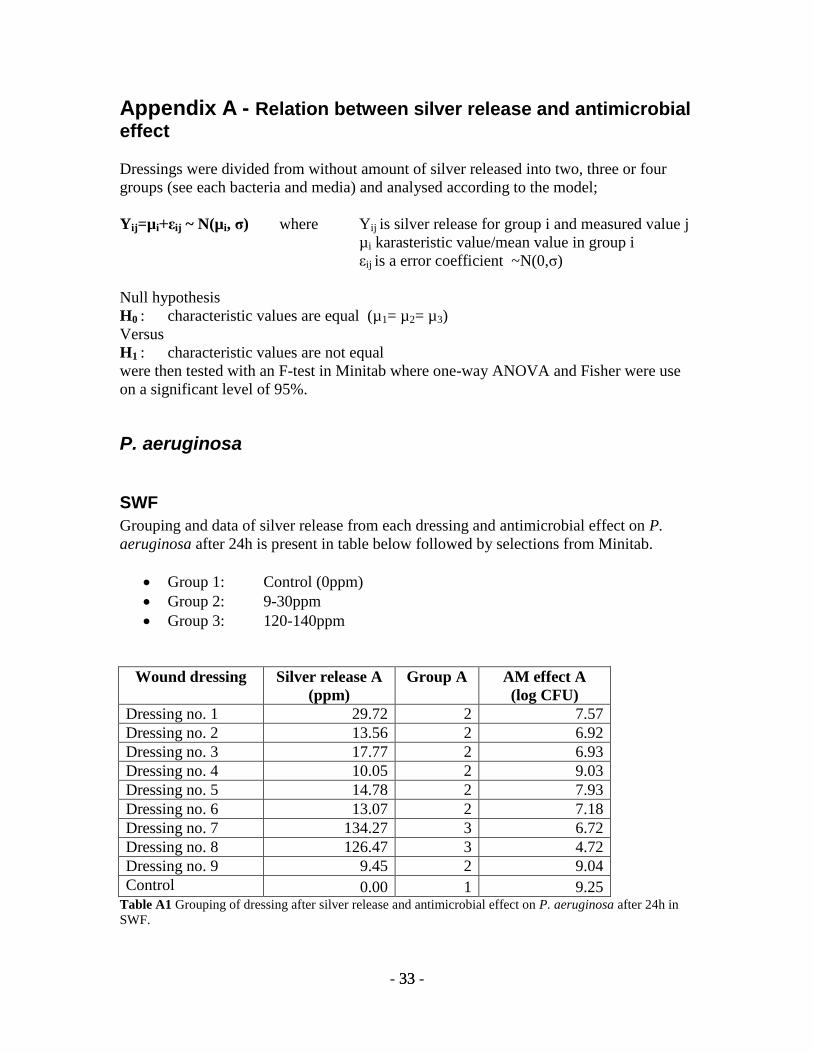
Appendix A - Relation between silver release and antimicrobial
effect
Dressings were divided from without amount of silver released into two, three or four
groups (see each bacteria and media) and analysed according to the model;
Yij=µi+εij ~ N(µi, σ) where Yij is silver release for group i and measured value j
µi karasteristic value/mean value in group i
εij is a error coefficient ~N(0,σ)
Null hypothesis
H0 : characteristic values are equal (µ1= µ2= µ3)
Versus
H1 : characteristic values are not equal
were then tested with an F-test in Minitab where one-way ANOVA and Fisher were use
on a significant level of 95%.
P. aeruginosa
SWF
Grouping and data of silver release from each dressing and antimicrobial effect on P.
aeruginosa after 24h is present in table below followed by selections from Minitab.
Group 1: Control (0ppm)
Group 2: 9-30ppm
Group 3: 120-140ppm
Wound dressing Silver release A
(ppm)
Group A
AM effect A
(log CFU)
Dressing no. 1 29.72 2 7.57
Dressing no. 2 13.56 2 6.92
Dressing no. 3 17.77 2 6.93
Dressing no. 4 10.05 2 9.03
Dressing no. 5 14.78 2 7.93
Dressing no. 6 13.07 2 7.18
Dressing no. 7 134.27 3 6.72
Dressing no. 8 126.47 3 4.72
Dressing no. 9 9.45 2 9.04
Control 0.00 1 9.25 Table A1 Grouping of dressing after silver release and antimicrobial effect on P. aeruginosa after 24h in
SWF.

- 34 -
34
MTB > Oneway 'Am effect A' 'Group A';
SUBC> Fisher 5.
One-way ANOVA: Am effect A versus Group A Source DF SS MS F P
Group A 2 10,02 5,01 5,00 0,045
Error 7 7,02 1,00
Total 9 17,04
S = 1,001 R-Sq = 58,80% R-Sq(adj) = 47,03%
Individual 95% CIs For Mean Based on Pooled StDev
Level N Mean StDev +---------+---------+---------+---------
1 1 9,253 * (-----------*-----------)
2 7 7,799 0,914 (---*---)
3 2 5,721 1,416 (--------*-------)
+---------+---------+---------+---------
4,0 6,0 8,0 10,0
Pooled StDev = 1,001
Fisher 95% Individual Confidence Intervals
All Pairwise Comparisons among Levels of Group A
Simultaneous confidence level = 88,90%
Group A = 1 subtracted from:
Group A Lower Center Upper -+---------+---------+---------+--------
2 -3,986 -1,455 1,077 (-------*--------)
3 -6,433 -3,532 -0,632 (--------*---------)
-+---------+---------+---------+--------
-6,0 -3,0 0,0 3,0
Group A = 2 subtracted from:
Group A Lower Center Upper -+---------+---------+---------+--------
3 -3,976 -2,078 -0,179 (-----*-----)
-+---------+---------+---------+--------
-6,0 -3,0 0,0 3,0
cSWF
Grouping and data of silver release from each dressing and antimicrobial effect on P.
aeruginosa after 24h is present in table below followed by selections from Minitab.
Group 1: Control (0ppm)
Group 2: 11-31ppm
Group 3: 180-240ppm

- 35 -
35
Wound dressing Silver release B
(ppm)
Group B
AM effect B
(log CFU)
Dressing no. 1 30.53 2 5.22
Dressing no. 2 13.11 2 5.29
Dressing no. 3 21.72 2 5.21
Dressing no. 4 11.41 2 6.80
Dressing no. 5 17.60 2 5.75
Dressing no. 6 18.74 2 5.64
Dressing no. 7 186.07 3 2.76
Dressing no. 8 233.27 3 2.83
Dressing no. 9 15.77 2 5.85
Control 0.00 1 7.22 Table A2 Grouping of dressing after silver release and antimicrobial effect on P. aeruginosa after 24h in
cSWF.
MTB > Oneway 'Am effect B' 'Group B';
SUBC> Fisher 5.
One-way ANOVA: Am effect B versus Group B Source DF SS MS F P
Group B 2 17,236 8,618 32,01 0,000
Error 7 1,884 0,269
Total 9 19,120
S = 0,5188 R-Sq = 90,14% R-Sq(adj) = 87,33%
Individual 95% CIs For Mean Based on Pooled StDev
Level N Mean StDev +---------+---------+---------+---------
1 1 7,2203 * (-----*-----)
2 7 5,6799 0,5601 (-*--)
3 2 2,7943 0,0492 (---*---)
+---------+---------+---------+---------
2,0 4,0 6,0 8,0
Pooled StDev = 0,5188
Fisher 95% Individual Confidence Intervals
All Pairwise Comparisons among Levels of Group B
Simultaneous confidence level = 88,90%
Group B = 1 subtracted from:
Group B Lower Center Upper ----+---------+---------+---------+-----
2 -2,8520 -1,5404 -0,2288 (----*----)
3 -5,9286 -4,4260 -2,9234 (-----*-----)
----+---------+---------+---------+-----
-5,0 -2,5 0,0 2,5
Group B = 2 subtracted from:

- 36 -
36
Group B Lower Center Upper ----+---------+---------+---------+-----
3 -3,8692 -2,8856 -1,9019 (--*---)
----+---------+---------+---------+-----
-5,0 -2,5 0,0 2,5
PBS
Grouping and data of silver release from each dressing and antimicrobial effect on P.
aeruginosa after 24h is present in table below followed by selections from Minitab.
Group 1: Control (0ppm)
Group 2: 0,35-1,21ppm
Wound dressing Silver release C
(ppm)
Group C
AM effect C
(log CFU)
Dressing no. 1 0.58 2 2.82
Dressing no. 2 0.46 2 2.46
Dressing no. 3 0.52 2 2.00
Dressing no. 4 1.21 2 2.90
Dressing no. 5 0.36 2 4.04
Dressing no. 6 0.50 2 2.64
Dressing no. 7 0.41 2 2.98
Dressing no. 8 0.35 2 2.78
Dressing no. 9 0.56 2 2.03
Control 0.00 1 6.57 Table A3 Grouping of dressing after silver release and antimicrobial effect on P. aeruginosa after 24h in
PBS.
MTB > Oneway 'Am effect C' 'Group C';
SUBC> Fisher 5.
One-way ANOVA: Am effect C versus Group C Source DF SS MS F P
Group C 1 13,206 13,206 36,34 0,000
Error 8 2,907 0,363
Total 9 16,113
S = 0,6028 R-Sq = 81,96% R-Sq(adj) = 79,70%
Individual 95% CIs For Mean Based on
Pooled StDev
Level N Mean StDev -----+---------+---------+---------+----
1 1 6,5679 * (--------*--------)
2 9 2,7374 0,6028 (--*--)
-----+---------+---------+---------+----
3,0 4,5 6,0 7,5
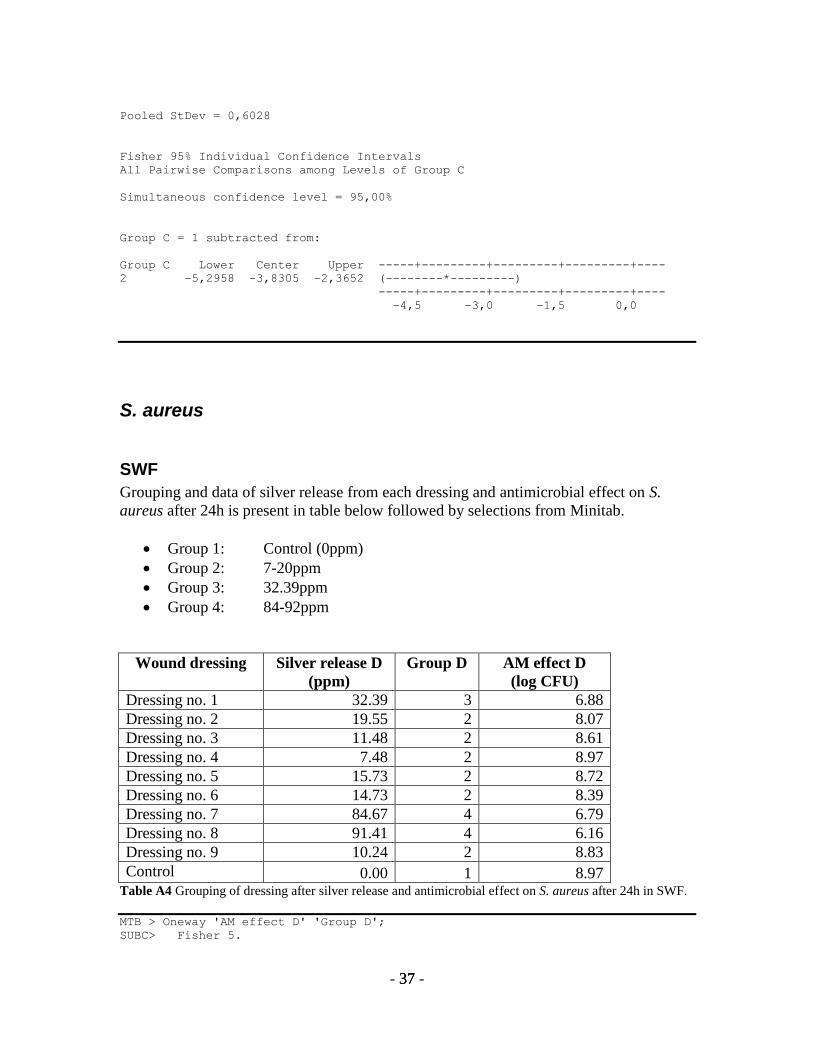
- 37 -
37
Pooled StDev = 0,6028
Fisher 95% Individual Confidence Intervals
All Pairwise Comparisons among Levels of Group C
Simultaneous confidence level = 95,00%
Group C = 1 subtracted from:
Group C Lower Center Upper -----+---------+---------+---------+----
2 -5,2958 -3,8305 -2,3652 (--------*---------)
-----+---------+---------+---------+----
-4,5 -3,0 -1,5 0,0
S. aureus
SWF
Grouping and data of silver release from each dressing and antimicrobial effect on S.
aureus after 24h is present in table below followed by selections from Minitab.
Group 1: Control (0ppm)
Group 2: 7-20ppm
Group 3: 32.39ppm
Group 4: 84-92ppm
Wound dressing Silver release D
(ppm)
Group D
AM effect D
(log CFU)
Dressing no. 1 32.39 3 6.88
Dressing no. 2 19.55 2 8.07
Dressing no. 3 11.48 2 8.61
Dressing no. 4 7.48 2 8.97
Dressing no. 5 15.73 2 8.72
Dressing no. 6 14.73 2 8.39
Dressing no. 7 84.67 4 6.79
Dressing no. 8 91.41 4 6.16
Dressing no. 9 10.24 2 8.83
Control 0.00 1 8.97 Table A4 Grouping of dressing after silver release and antimicrobial effect on S. aureus after 24h in SWF.
MTB > Oneway 'AM effect D' 'Group D';
SUBC> Fisher 5.
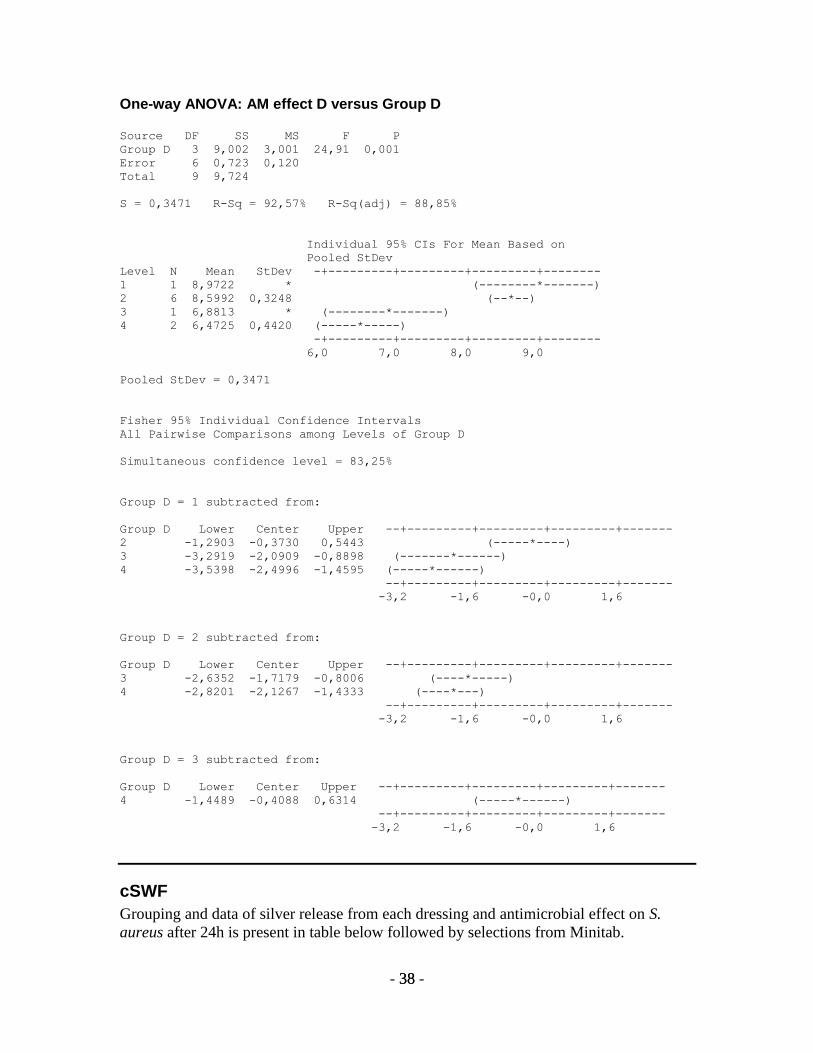
- 38 -
38
One-way ANOVA: AM effect D versus Group D Source DF SS MS F P
Group D 3 9,002 3,001 24,91 0,001
Error 6 0,723 0,120
Total 9 9,724
S = 0,3471 R-Sq = 92,57% R-Sq(adj) = 88,85%
Individual 95% CIs For Mean Based on
Pooled StDev
Level N Mean StDev -+---------+---------+---------+--------
1 1 8,9722 * (--------*-------)
2 6 8,5992 0,3248 (--*--)
3 1 6,8813 * (--------*-------)
4 2 6,4725 0,4420 (-----*-----)
-+---------+---------+---------+--------
6,0 7,0 8,0 9,0
Pooled StDev = 0,3471
Fisher 95% Individual Confidence Intervals
All Pairwise Comparisons among Levels of Group D
Simultaneous confidence level = 83,25%
Group D = 1 subtracted from:
Group D Lower Center Upper --+---------+---------+---------+-------
2 -1,2903 -0,3730 0,5443 (-----*----)
3 -3,2919 -2,0909 -0,8898 (-------*------)
4 -3,5398 -2,4996 -1,4595 (-----*------)
--+---------+---------+---------+-------
-3,2 -1,6 -0,0 1,6
Group D = 2 subtracted from:
Group D Lower Center Upper --+---------+---------+---------+-------
3 -2,6352 -1,7179 -0,8006 (----*-----)
4 -2,8201 -2,1267 -1,4333 (----*---)
--+---------+---------+---------+-------
-3,2 -1,6 -0,0 1,6
Group D = 3 subtracted from:
Group D Lower Center Upper --+---------+---------+---------+-------
4 -1,4489 -0,4088 0,6314 (-----*------)
--+---------+---------+---------+-------
-3,2 -1,6 -0,0 1,6
cSWF
Grouping and data of silver release from each dressing and antimicrobial effect on S.
aureus after 24h is present in table below followed by selections from Minitab.

- 39 -
39
Group 1: Control (0ppm)
Group 2: 9-26ppm
Group 3: 130-220ppm
Wound dressing Silver release E
(ppm)
Group E
AM effect E
(log CFU)
Dressing no. 1 25.99 2 4.65
Dressing no. 2 21.64 2 4.54
Dressing no. 3 13.24 2 5.49
Dressing no. 4 9.03 2 5.94
Dressing no. 5 18.08 2 5.16
Dressing no. 6 19.88 2 4.76
Dressing no. 7 136.50 3 2.29
Dressing no. 8 216.25 3 2.00
Dressing no. 9 16.03 2 5.19
Control 0.01 1 5.90 Table A5 Grouping of dressing after silver release and antimicrobial effect on S. aureus after 24h in cSWF.
MTB > Oneway 'AM effect E' 'Group E';
SUBC> Fisher 5.
One-way ANOVA: AM effect E versus Group E Source DF SS MS F P
Group E 2 15,511 7,756 35,36 0,000
Error 7 1,535 0,219
Total 9 17,046
S = 0,4683 R-Sq = 90,99% R-Sq(adj) = 88,42%
Individual 95% CIs For Mean Based on
Pooled StDev
Level N Mean StDev -+---------+---------+---------+--------
1 1 5,8963 * (------*-------)
2 7 5,1035 0,4989 (--*--)
3 2 2,1447 0,2046 (----*-----)
-+---------+---------+---------+--------
1,5 3,0 4,5 6,0
Pooled StDev = 0,4683
Fisher 95% Individual Confidence Intervals
All Pairwise Comparisons among Levels of Group E
Simultaneous confidence level = 88,90%
Group E = 1 subtracted from:

- 40 -
40
Group E Lower Center Upper +---------+---------+---------+---------
2 -1,9768 -0,7928 0,3911 (----*----)
3 -5,1080 -3,7516 -2,3953 (----*----)
+---------+---------+---------+---------
-5,0 -2,5 0,0 2,5
Group E = 2 subtracted from:
Group E Lower Center Upper +---------+---------+---------+---------
3 -3,8467 -2,9588 -2,0708 (--*---)
+---------+---------+---------+---------
-5,0 -2,5 0,0 2,5
PBS
Grouping and data of silver release from each dressing and antimicrobial effect on S.
aureus after 24h is present in table below followed by selections from Minitab.
Group 1: Control (0ppm)
Group 2: 0.40-0.90ppm
Wound dressing Silver release F
(ppm)
Group F
AM effect F
(log CFU)
Dressing no. 1 0.49 2 2.24
Dressing no. 2 0.69 2 2.03
Dressing no. 3 0.40 2 2.86
Dressing no. 4 0.89 2 2.03
Dressing no. 5 0.42 2 2.23
Dressing no. 6 0.59 2 2.37
Dressing no. 7 0.40 2 2.50
Dressing no. 8 0.44 2 2.68
Dressing no. 9 0.50 2 2.43
Control 0.01 1 4.96 Table A6 Grouping of dressing after silver release and antimicrobial effect on S. aureus after 24h in PBS.
MTB > Oneway 'Am effect F' 'Group F';
SUBC> Fisher 5.
One-way ANOVA: Am effect F versus Group F Source DF SS MS F P
Group F 1 6,0181 6,0181 76,50 0,000
Error 8 0,6293 0,0787
Total 9 6,6474

- 41 -
41
S = 0,2805 R-Sq = 90,53% R-Sq(adj) = 89,35%
Individual 95% CIs For Mean Based on
Pooled StDev
Level N Mean StDev --------+---------+---------+---------+-
1 1 4,9599 * (------*-----)
2 9 2,3740 0,2805 (-*-)
--------+---------+---------+---------+-
3,0 4,0 5,0 6,0
Pooled StDev = 0,2805
Fisher 95% Individual Confidence Intervals
All Pairwise Comparisons among Levels of Group F
Simultaneous confidence level = 95,00%
Group F = 1 subtracted from:
Group F Lower Center Upper ---+---------+---------+---------+------
2 -3,2676 -2,5859 -1,9041 (------*------)
---+---------+---------+---------+------
-3,0 -2,0 -1,0 0,0

- 42 -
42
Appendix B - Relation between total content of silver and
silver release
Dressings were divided from without total content of silver into three groups:
Group 1: 0.08-0.12 g/cm2
Group 2: 0.35 g/cm2
Group 3: 0.90-1.34 g/cm2
and analysed according to the model;
Yij=µi+εij ~ N(µi, σ) where Yij is silver release for group i and measured value j
µi karasteristic value/mean value in group i
εij is a error coefficient ~N(0,σ)
Null hypothesis
H0 : characteristic values are equal (µ1= µ2= µ3)
Versus
H1 : characteristic values are not equal
was tested with an F-test in Minitab where one-way ANOVA and Fisher were use on a
significant level of 95%.
P. aeruginosa
Grouping and data of total silver content in each dressing and silver release with P.
aeruginosa at 24h is present in table below followed by selections from Minitab.
Wound dressing Total
(g/cm2)
Group
SWF
(ppm)
cSWF
(ppm)
PBS
(ppm)
Dressing no. 1 1.34 3.00 29.72 30.53 0.58
Dressing no. 2 0.90 3.00 13.56 13.11 0.46
Dressing no. 3 0.12 1.00 17.77 21.72 0.52
Dressing no. 4 0.35 2.00 10.05 11.41 1.21
Dressing no. 5 0.95 3.00 14.78 17.60 0.36
Dressing no. 6 0.08 1.00 13.07 18.74 0.50
Dressing no. 7 1.20 3.00 134.27 186.07 0.41
Dressing no. 8 1.20 3.00 126.47 233.27 0.35
Dressing no. 9 1.11 3.00 9.45 15.77 0.56 Table B1 Grouping of dressing after total content of silver and silver release in experiments after 24h in
different media together with P. aeruginosa.
MTB > Oneway 'SWF' 'Group';
One-way ANOVA: SWF versus Group

- 43 -
43
Source DF SS MS F P
Interval 2 3394 1697 0,58 0,587
Error 6 17450 2908
Total 8 20844
S = 53,93 R-Sq = 16,28% R-Sq(adj) = 0,00%
Individual 95% CIs For Mean Based on
Pooled StDev
Level N Mean StDev -------+---------+---------+---------+--
1 2 15,42 3,32 (------------*-------------)
2 1 10,05 * (-----------------*------------------)
3 6 54,71 59,06 (-------*-------)
-------+---------+---------+---------+--
-70 0 70 140
Pooled StDev = 53,93
MTB > Oneway 'cSWF' 'Group';
One-way ANOVA: cSWF versus Group Source DF SS MS F P
Interval 2 8615 4308 0,52 0,619
Error 6 49643 8274
Total 8 58258
S = 90,96 R-Sq = 14,79% R-Sq(adj) = 0,00%
Individual 95% CIs For Mean Based on
Pooled StDev
Level N Mean StDev --------+---------+---------+---------+-
1 2 20,23 2,11 (------------*------------)
2 1 11,41 * (------------------*-----------------)
3 6 82,72 99,64 (-------*------)
--------+---------+---------+---------+-
-120 0 120 240
Pooled StDev = 90,96
MTB > Oneway 'PBS' 'Group';
SUBC> Fisher 5.
One-way ANOVA: PBS versus Group Source DF SS MS F P
Interval 2 0,49489 0,24745 30,39 0,001
Error 6 0,04885 0,00814
Total 8 0,54375
S = 0,09024 R-Sq = 91,02% R-Sq(adj) = 88,02%
Individual 95% CIs For Mean Based on

- 44 -
44
Pooled StDev
Level N Mean StDev --------+---------+---------+---------+-
1 2 0,5055 0,0134 (----*----)
2 1 1,2080 * (------*-------)
3 6 0,4517 0,0987 (--*--)
--------+---------+---------+---------+-
0,60 0,90 1,20 1,50
Pooled StDev = 0,0902
Fisher 95% Individual Confidence Intervals
All Pairwise Comparisons among Levels of Interval
Simultaneous confidence level = 89,08%
Interval = 1 subtracted from:
Interval Lower Center Upper +---------+---------+---------+---------
2 0,4321 0,7025 0,9729 (----*----)
3 -0,2341 -0,0538 0,1264 (---*---)
+---------+---------+---------+---------
-1,00 -0,50 0,00 0,50
Interval = 2 subtracted from:
Interval Lower Center Upper
3 -0,9948 -0,7563 -0,5178
Interval +---------+---------+---------+---------
3 (----*----)
+---------+---------+---------+---------
-1,00 -0,50 0,00 0,50
MTB >
S. Aureus
Grouping and data of total silver content in each dressing and silver release with S.
aureus at 24h is present in table below followed by selections from Minitab.
Wound dressing Total
(g/cm2)
Group
SWF
(ppm)
cSWF
(ppm)
PBS
(ppm)
Dressing no. 1 1.34 3.00 32.39 25.99 0.49
Dressing no. 2 0.90 3.00 11.48 13.24 0.40
Dressing no. 3 0.12 1.00 19.55 21.64 0.69
Dressing no. 4 0.35 2.00 7.48 9.03 0.89
Dressing no. 5 0.95 3.00 15.73 18.08 0.42
Dressing no. 6 0.08 1.00 14.73 19.88 0.59
Dressing no. 7 1.20 3.00 84.67 136.50 0.40
Dressing no. 8 1.20 3.00 91.41 216.25 0.44
Dressing no. 9 1.11 3.00 10.24 16.03 0.50
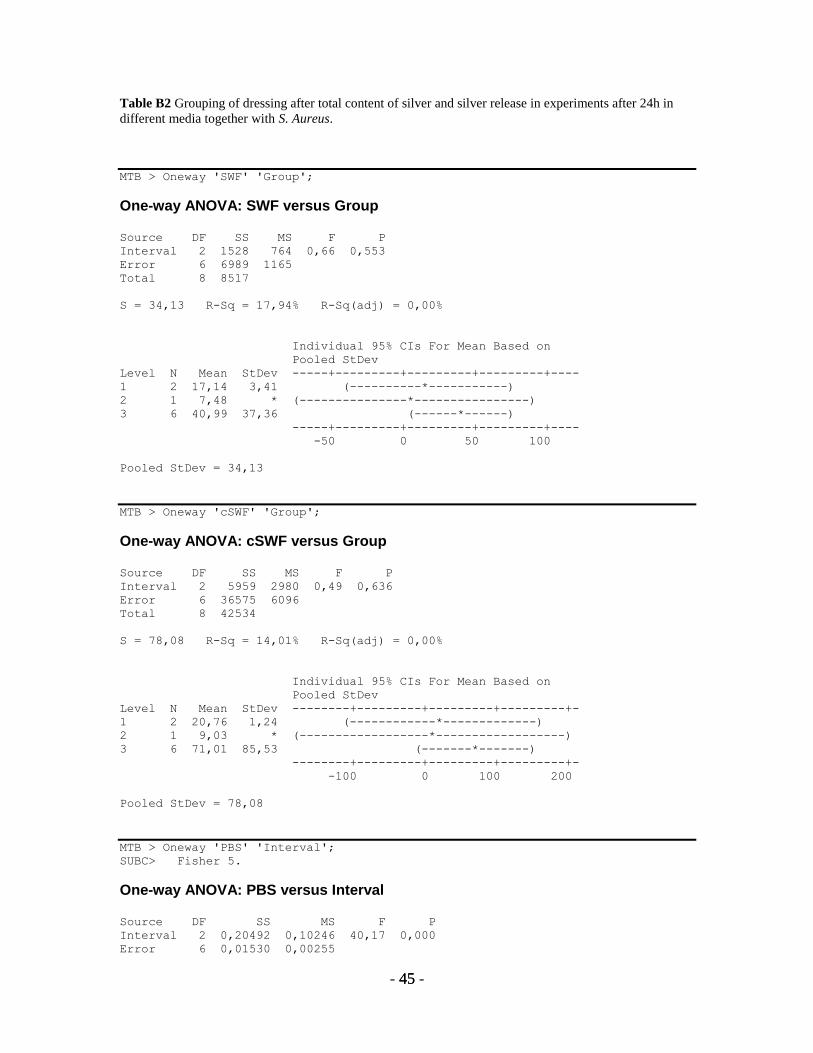
- 45 -
45
Table B2 Grouping of dressing after total content of silver and silver release in experiments after 24h in
different media together with S. Aureus.
MTB > Oneway 'SWF' 'Group';
One-way ANOVA: SWF versus Group Source DF SS MS F P
Interval 2 1528 764 0,66 0,553
Error 6 6989 1165
Total 8 8517
S = 34,13 R-Sq = 17,94% R-Sq(adj) = 0,00%
Individual 95% CIs For Mean Based on
Pooled StDev
Level N Mean StDev -----+---------+---------+---------+----
1 2 17,14 3,41 (----------*-----------)
2 1 7,48 * (---------------*----------------)
3 6 40,99 37,36 (------*------)
-----+---------+---------+---------+----
-50 0 50 100
Pooled StDev = 34,13
MTB > Oneway 'cSWF' 'Group';
One-way ANOVA: cSWF versus Group Source DF SS MS F P
Interval 2 5959 2980 0,49 0,636
Error 6 36575 6096
Total 8 42534
S = 78,08 R-Sq = 14,01% R-Sq(adj) = 0,00%
Individual 95% CIs For Mean Based on
Pooled StDev
Level N Mean StDev --------+---------+---------+---------+-
1 2 20,76 1,24 (------------*-------------)
2 1 9,03 * (------------------*------------------)
3 6 71,01 85,53 (-------*-------)
--------+---------+---------+---------+-
-100 0 100 200
Pooled StDev = 78,08
MTB > Oneway 'PBS' 'Interval';
SUBC> Fisher 5.
One-way ANOVA: PBS versus Interval Source DF SS MS F P
Interval 2 0,20492 0,10246 40,17 0,000
Error 6 0,01530 0,00255

- 46 -
46
Total 8 0,22022
S = 0,05050 R-Sq = 93,05% R-Sq(adj) = 90,74%
Individual 95% CIs For Mean Based on
Pooled StDev
Level N Mean StDev ------+---------+---------+---------+---
1 2 0,6400 0,0754 (----*----)
2 1 0,8933 * (-------*-------)
3 6 0,4397 0,0438 (--*---)
------+---------+---------+---------+---
0,48 0,64 0,80 0,96
Pooled StDev = 0,0505
Fisher 95% Individual Confidence Intervals
All Pairwise Comparisons among Levels of Interval
Simultaneous confidence level = 89,08%
Interval = 1 subtracted from:
Interval Lower Center Upper
2 0,10199 0,25333 0,40468
3 -0,30117 -0,20028 -0,09938
Interval +---------+---------+---------+---------
2 (----*----)
3 (--*---)
+---------+---------+---------+---------
-0,60 -0,30 0,00 0,30
Interval = 2 subtracted from:
Interval Lower Center Upper
3 -0,58708 -0,45361 -0,32014
Interval +---------+---------+---------+---------
3 (----*---)
+---------+---------+---------+---------
-0,60 -0,30 0,00 0,30

- 47 -
47
Appendix C - Relation between total content of silver and
antimicrobial effect
Dressings were divided from without total content of silver into three groups:
Group 1: 0.08-0.12 g/cm2
Group 2: 0.35 g/cm2
Group 3: 0.90-1.34 g/cm2
and analysed according to the model;
Yij=µi+εij ~ N(µi, σ) where Yij is silver release for group i and measured value j
µi karasteristic value/mean value in group i
εij is a error coefficient ~N(0,σ)
Null hypothesis
H0 : characteristic values are equal (µ1= µ2= µ3)
Versus
H1 : characteristic values are not equal
was tested with an F-test in Minitab where one-way ANOVA and Fisher were use on a
significant level of 95%.
P. aeruginosa
Grouping and data of total silver content in each dressing and antimicrobial effect on P.
aeruginosa at 24h is present in table below followed by selections from Minitab.
Wound dressing Total (g/cm2)
Group
SWF (ppm)
cSWF (ppm)
PBS (ppm)
Dressing no. 1 1.34 3.00 7.57 5.22 2.82 Dressing no. 2 0.90 3.00 6.92 5.29 2.46
Dressing no. 3 0.12 1.00 6.93 5.21 2.00 Dressing no. 4 0.35 2.00 9.03 6.80 2.90 Dressing no. 5 0.95 3.00 7.93 5.75 4.04 Dressing no. 6 0.08 1.00 7.18 5.64 2.64
Dressing no. 7 1.20 3.00 6.72 2.76 2.98 Dressing no. 8 1.20 3.00 4.72 2.83 2.78
Dressing no. 9 1.11 3.00 9.04 5.85 2.03 Table C1 Grouping of dressing after total content of silver and antimicrobial effect in experiments after
24h in different media together with P. aeruginosa.

- 48 -
48
MTB > Oneway 'SWF' 'Group';
One-way ANOVA: SWF versus Group Source DF SS MS F P
Interval 2 3,23 1,62 0,92 0,447
Error 6 10,50 1,75
Total 8 13,74
S = 1,323 R-Sq = 23,52% R-Sq(adj) = 0,00%
Individual 95% CIs For Mean Based on
Pooled StDev
Level N Mean StDev ------+---------+---------+---------+---
1 2 7,057 0,180 (----------*-----------)
2 1 9,028 * (---------------*---------------)
3 6 7,148 1,447 (------*-----)
------+---------+---------+---------+---
6,0 8,0 10,0 12,0
Pooled StDev = 1,323
MTB > Oneway 'cSWF' 'Group';
One-way ANOVA: cSWF versus Group Source DF SS MS F P
Interval 2 4,48 2,24 1,30 0,340
Error 6 10,36 1,73
Total 8 14,84
S = 1,314 R-Sq = 30,19% R-Sq(adj) = 6,92%
Individual 95% CIs For Mean Based on
Pooled StDev
Level N Mean StDev ----+---------+---------+---------+-----
1 2 5,425 0,304 (----------*----------)
2 1 6,802 * (---------------*---------------)
3 6 4,616 1,433 (-----*------)
----+---------+---------+---------+-----
4,0 6,0 8,0 10,0
Pooled StDev = 1,314
MTB > Oneway 'PBS' 'Group';
One-way ANOVA: PBS versus Group Source DF SS MS F P
Interval 2 0,447 0,223 0,54 0,606
Error 6 2,460 0,410
Total 8 2,907
S = 0,6404 R-Sq = 15,37% R-Sq(adj) = 0,00%

- 49 -
49
Individual 95% CIs For Mean Based on
Pooled StDev
Level N Mean StDev --------+---------+---------+---------+-
1 2 2,3214 0,4545 (----------*----------)
2 1 2,8957 * (---------------*---------------)
3 6 2,8496 0,6714 (-----*------)
--------+---------+---------+---------+-
2,0 3,0 4,0 5,0
Pooled StDev = 0,6404
S. Aureus
Grouping and data of total silver content in each dressing and antimicrobial effect on S.
aureus at 24h is present in table below followed by selections from Minitab.
Wound dressing Total (g/cm2)
Group
SWF (ppm)
cSWF (ppm)
PBS (ppm)
Dressing no. 1 1.34 3.00 6.79 2.29 2.50 Dressing no. 2 0.90 3.00 6.16 2.00 2.68 Dressing no. 3 0.12 1.00 8.39 4.76 2.37 Dressing no. 4 0.35 2.00 8.07 4.54 2.03 Dressing no. 5 0.95 3.00 8.97 5.94 2.03
Dressing no. 6 0.08 1.00 8.61 5.49 2.86 Dressing no. 7 1.20 3.00 8.83 5.19 2.43 Dressing no. 8 1.20 3.00 8.72 5.16 2.23 Dressing no. 9 1.11 3.00 6.88 4.65 2.24
Table C2 Grouping of dressing after total content of silver and antimicrobial effect in experiments after
24h in different media together with S. aureus.
MTB > Oneway 'SWF' 'Group';
One-way ANOVA: SWF versus Group Source DF SS MS F P
Interval 2 0,92 0,46 0,35 0,717
Error 6 7,84 1,31
Total 8 8,76
S = 1,143 R-Sq = 10,50% R-Sq(adj) = 0,00%
Individual 95% CIs For Mean Based on
Pooled StDev
Level N Mean StDev -----+---------+---------+---------+----
1 2 8,499 0,153 (-------------*------------)
2 1 8,072 * (------------------*-----------------)
3 6 7,725 1,250 (-------*------)
-----+---------+---------+---------+----
6,0 7,5 9,0 10,5

- 50 -
50
Pooled StDev = 1,143
MTB > Oneway 'cSWF' 'Group';
One-way ANOVA: cSWF versus Group Source DF SS MS F P
Interval 2 1,28 0,64 0,28 0,767
Error 6 13,87 2,31
Total 8 15,15
S = 1,520 R-Sq = 8,48% R-Sq(adj) = 0,00%
Individual 95% CIs For Mean Based on
Pooled StDev
Level N Mean StDev ------+---------+---------+---------+---
1 2 5,125 0,513 (-------------*------------)
2 1 4,541 * (------------------*-----------------)
3 6 4,204 1,650 (-------*-------)
------+---------+---------+---------+---
2,0 4,0 6,0 8,0
Pooled StDev = 1,520
MTB > Oneway 'PBS' 'Group';
One-way ANOVA: PBS versus Group Source DF SS MS F P
Interval 2 0,2374 0,1187 1,82 0,242
Error 6 0,3919 0,0653
Total 8 0,6293
S = 0,2556 R-Sq = 37,72% R-Sq(adj) = 16,97%
Individual 95% CIs For Mean Based on
Pooled StDev
Level N Mean StDev --+---------+---------+---------+-------
1 2 2,6143 0,3524 (--------*--------)
2 1 2,0293 * (------------*-----------)
3 6 2,3513 0,2314 (----*----)
--+---------+---------+---------+-------
1,50 2,00 2,50 3,00
Pooled StDev = 0,2556

- 51 -
51
Appendix D - Three factor experiment
Measured values were analysed as a complete thee factor experiment with six
observations per cell. Affecting factors were evaluated and a simplified model was used
and pair wise compared (see selections from Minitab below).
MTB > print Release
Data Display Release
93,0 123,5 83,0 94,5 97,0 108,0 80,5 75,0 77,5
79,5 80,5 79,0 98,5 64,5 76,0 75,0 64,0 91,5
96,0 86,0 92,0 85,0 88,5 84,5 169,0 137,6 108,0
174,5 94,5 142,0 146,5 122,0 144,5 103,5 129,0 132,5
127,0 133,5 132,5 100,5 101,5 113,0 101,0 116,5 81,0
98,0 163,0 168,0
MTB > set x
DATA> 4(1 2)6
DATA> end.
MTB > set y
DATA> 2(1 2)12
DATA> end.
MTB > set z
DATA> (1 2)24
DATA> end.
ANOVA: Release versus x; y; z Factor Type Levels Values
x fixed 2 1; 2
y fixed 2 1; 2
z fixed 2 1; 2
Analysis of Variance for Release
Source DF SS MS F P
x 1 178,6 178,6 0,44 0,509
y 1 1176,1 1176,1 2,92 0,095
z 1 19464,9 19464,9 48,29 0,000
x*y 1 1371,7 1371,7 3,40 0,072
x*z 1 27,6 27,6 0,07 0,795
y*z 1 202,5 202,5 0,50 0,483
x*y*z 1 312,1 312,1 0,77 0,384
Error 40 16124,8 403,1
Total 47 38858,5
S = 20,0778 R-Sq = 58,50% R-Sq(adj) = 51,24%
Means
x N Release

- 52 -
52
1 24 108,42
2 24 104,56
y N Release
1 24 111,44
2 24 101,54
z N Release
1 24 86,35
2 24 126,63
x y N Release
1 1 12 118,72
1 2 12 98,13
2 1 12 104,17
2 2 12 104,96
x z N Release
1 1 12 89,04
1 2 12 127,80
2 1 12 83,67
2 2 12 125,46
y z N Release
1 1 12 89,25
1 2 12 133,63
2 1 12 83,46
2 2 12 119,63
x y z N Release
1 1 1 6 99,83
1 1 2 6 137,60
1 2 1 6 78,25
1 2 2 6 118,00
2 1 1 6 78,67
2 1 2 6 129,67
2 2 1 6 88,67
2 2 2 6 121,25
ANOVA: Release versus x; y; z Factor Type Levels Values
x fixed 2 1; 2
y fixed 2 1; 2
z fixed 2 1; 2
Analysis of Variance for Release
Source DF SS MS F P
x 1 178,6 178,6 0,46 0,501
y 1 1176,1 1176,1 3,03 0,089
x*y 1 1371,7 1371,7 3,54 0,067
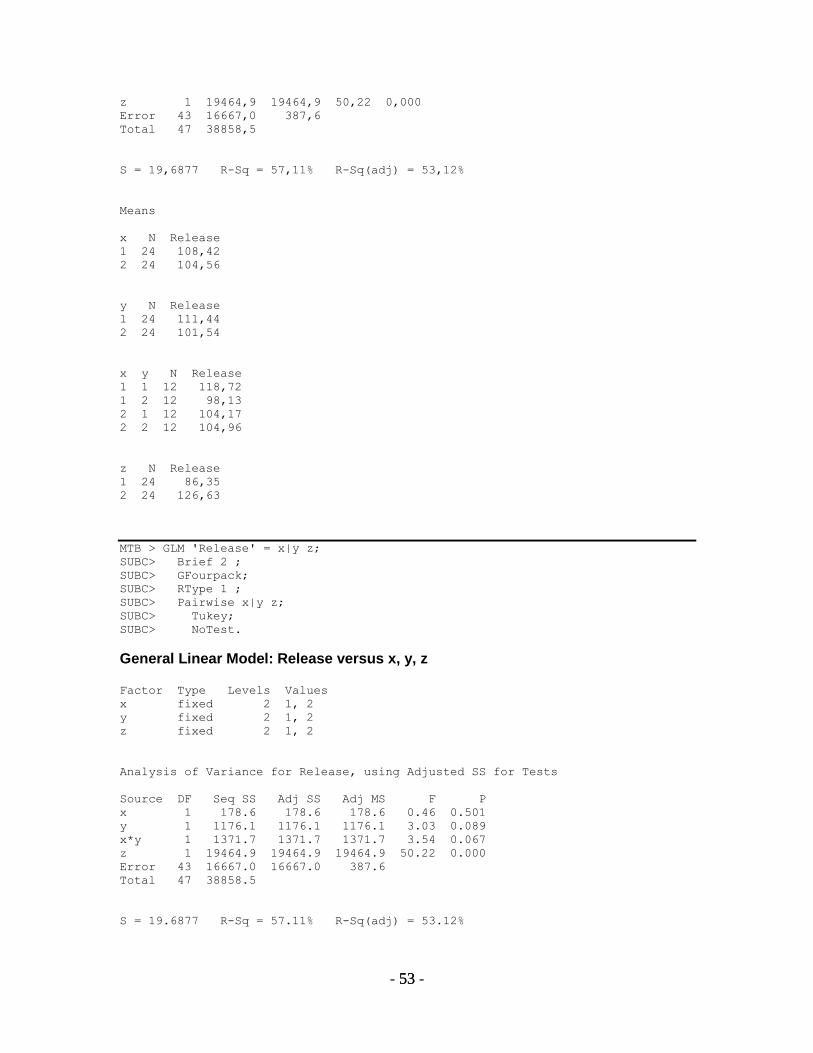
- 53 -
53
z 1 19464,9 19464,9 50,22 0,000
Error 43 16667,0 387,6
Total 47 38858,5
S = 19,6877 R-Sq = 57,11% R-Sq(adj) = 53,12%
Means
x N Release
1 24 108,42
2 24 104,56
y N Release
1 24 111,44
2 24 101,54
x y N Release
1 1 12 118,72
1 2 12 98,13
2 1 12 104,17
2 2 12 104,96
z N Release
1 24 86,35
2 24 126,63
MTB > GLM 'Release' = x|y z;
SUBC> Brief 2 ;
SUBC> GFourpack;
SUBC> RType 1 ;
SUBC> Pairwise x|y z;
SUBC> Tukey;
SUBC> NoTest.
General Linear Model: Release versus x, y, z Factor Type Levels Values
x fixed 2 1, 2
y fixed 2 1, 2
z fixed 2 1, 2
Analysis of Variance for Release, using Adjusted SS for Tests
Source DF Seq SS Adj SS Adj MS F P
x 1 178.6 178.6 178.6 0.46 0.501
y 1 1176.1 1176.1 1176.1 3.03 0.089
x*y 1 1371.7 1371.7 1371.7 3.54 0.067
z 1 19464.9 19464.9 19464.9 50.22 0.000
Error 43 16667.0 16667.0 387.6
Total 47 38858.5
S = 19.6877 R-Sq = 57.11% R-Sq(adj) = 53.12%
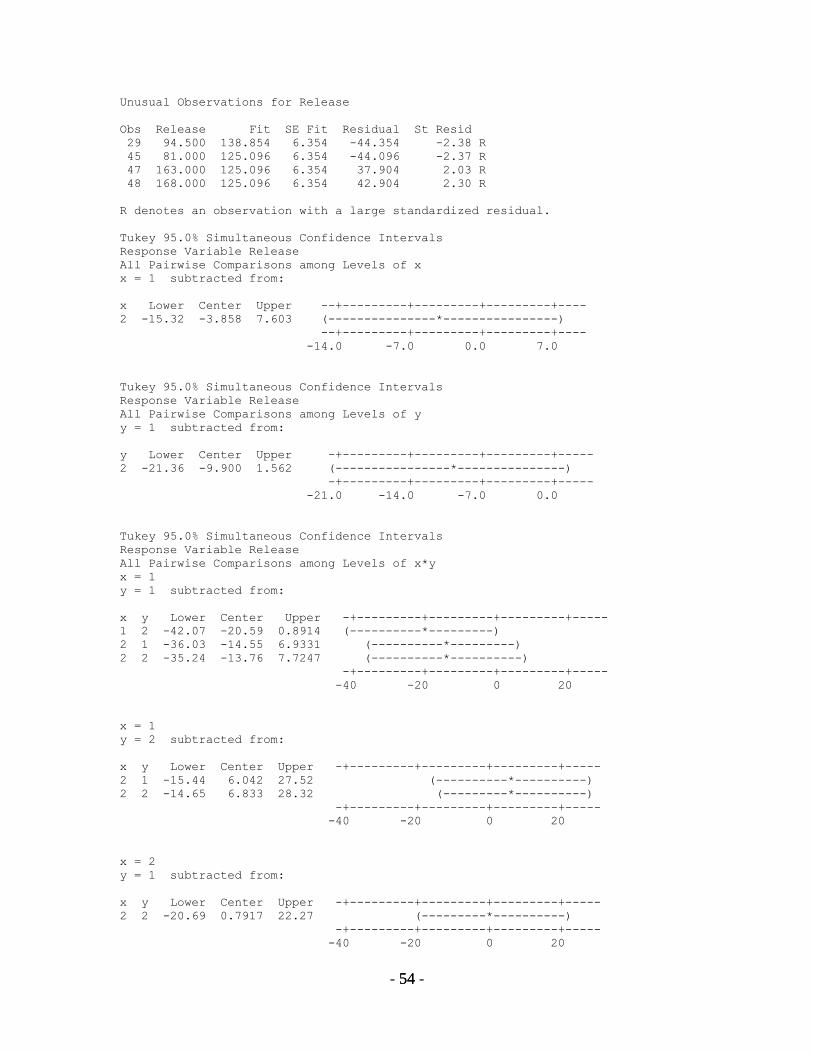
- 54 -
54
Unusual Observations for Release
Obs Release Fit SE Fit Residual St Resid
29 94.500 138.854 6.354 -44.354 -2.38 R
45 81.000 125.096 6.354 -44.096 -2.37 R
47 163.000 125.096 6.354 37.904 2.03 R
48 168.000 125.096 6.354 42.904 2.30 R
R denotes an observation with a large standardized residual.
Tukey 95.0% Simultaneous Confidence Intervals
Response Variable Release
All Pairwise Comparisons among Levels of x
x = 1 subtracted from:
x Lower Center Upper --+---------+---------+---------+----
2 -15.32 -3.858 7.603 (---------------*----------------)
--+---------+---------+---------+----
-14.0 -7.0 0.0 7.0
Tukey 95.0% Simultaneous Confidence Intervals
Response Variable Release
All Pairwise Comparisons among Levels of y
y = 1 subtracted from:
y Lower Center Upper -+---------+---------+---------+-----
2 -21.36 -9.900 1.562 (----------------*---------------)
-+---------+---------+---------+-----
-21.0 -14.0 -7.0 0.0
Tukey 95.0% Simultaneous Confidence Intervals
Response Variable Release
All Pairwise Comparisons among Levels of x*y
x = 1
y = 1 subtracted from:
x y Lower Center Upper -+---------+---------+---------+-----
1 2 -42.07 -20.59 0.8914 (----------*---------)
2 1 -36.03 -14.55 6.9331 (----------*---------)
2 2 -35.24 -13.76 7.7247 (----------*----------)
-+---------+---------+---------+-----
-40 -20 0 20
x = 1
y = 2 subtracted from:
x y Lower Center Upper -+---------+---------+---------+-----
2 1 -15.44 6.042 27.52 (----------*----------)
2 2 -14.65 6.833 28.32 (---------*----------)
-+---------+---------+---------+-----
-40 -20 0 20
x = 2
y = 1 subtracted from:
x y Lower Center Upper -+---------+---------+---------+-----
2 2 -20.69 0.7917 22.27 (---------*----------)
-+---------+---------+---------+-----
-40 -20 0 20
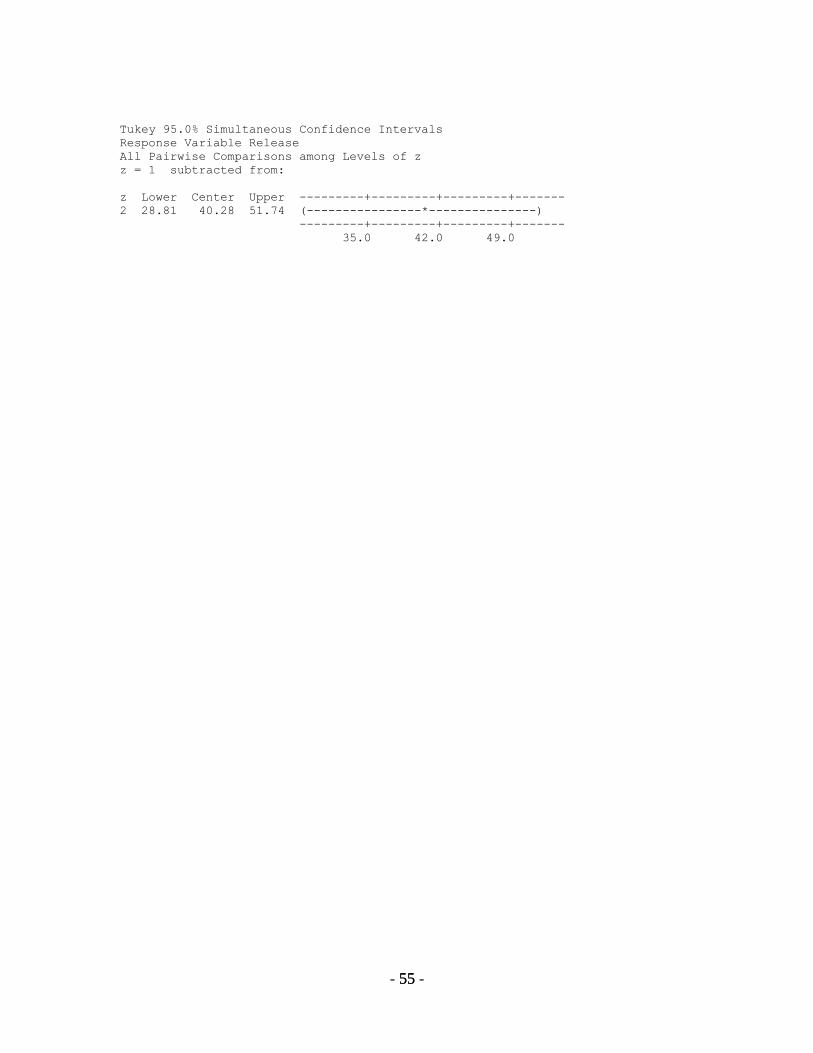
- 55 -
55
Tukey 95.0% Simultaneous Confidence Intervals
Response Variable Release
All Pairwise Comparisons among Levels of z
z = 1 subtracted from:
z Lower Center Upper ---------+---------+---------+-------
2 28.81 40.28 51.74 (----------------*---------------)
---------+---------+---------+-------
35.0 42.0 49.0