correlation of domestic stoker colvbustion...
TRANSCRIPT

STATE O F ILLINOIS
D W I G H T H. GREEN, Governor
D E P A R T M E N T O F REGISTRATION AND EDUCATION
F R A N K G. T H O M P S O N , Director
DIVISION O F T H E
S T A T E G E O L O G I C A L S U R V E Y M. M. LEIGHTON, Chief
URBANA
REPORT OF ISVESTIGATIONS- NO. 120 --
CORRELATION OF DOMESTIC STOKER COLVBUSTION W71'I'H LABORATORY TESTS AND TYPES OF FUELS
11. COMBUSTION TESTS AND PREPARATION STUDIES OF REPRESENTATIVE ILLINOIS COALS
P R I N T E D BY AUTHORITY O F T H E STATE O F ILLINOIS
URBANA, ILLINOIS
1946

ORGANIZATION
STATE OF ILLINOIS HON. DWIGHT H. GREEN, Governor
DEPARTMENT OF REGISTRATION AND EDUCArION HON. FRANK G. THOMPSON, Director
BOARD OF NATURAL RESOURCES AND CONSERVATION HON. FRANK G. THOMPSON, Chairman
NORMAN L. BOWEN, Ph.D., D.Sc., LL.D., Geology
ROGER ADAMS, PH.D., D.Sc., Chemistry
LOUIS R. HOWSON, C.E., Engineering
CARL G. HARTMAN, PH.D., Biology
EZRA JACOB KRAUS, PH.D., D.Sc., Forestry
GEORGE D. STODDARD, PR D., LITS D , LL D , L H D. President of the University of Illinois
GICOLOGICAL SURVEY DIVISION M. M. LEIGHTON, Chief

SCIENTIFIC AND TECHNICAL STAFF OF T H E
STATE GEOLOGICAL SURVEY DIVISION 100 Natural Resources Building, Urbana
M. M. LEIGHTON, PH.D., Chief ENID TOWNLEY, M.S., Assistant to the Chief VELDA A. MILLARD, Junior Asst. to the Chief
GEOLOGICAL RESOURCES RALPH E . GRIM, PH.D., Petrographer and
Principal Geologist i n Charge
G. H. CADY, PH.D., Senior Geologist and Head R J HELFINSTII';E M.S. Mech Engineer C;I.&LES C. BOLE;, M.S(., A ~ ~ O C . Mzning Eng. ROBERT M. KOSANKE, M.A., Asst. Geologist ROBERT W . ELLINGWOOD, B.S., Asst. Geologist JACK A. SIMON, B.A., Asst . Geologist ARNOLD EDDISGS, B .A., Asst. Geologist JOHN A. HARRISON, B.S., Asst. Geologist RAYMOND SIEVER, B.S., Research Assislant MARY E. BARNES, B.S., Research Assistant MARGARET PARKER, B.S., Research Assistant WALTER E. COOPER, Technical Assistant
Oil and Gas A. H. BELL, PH.D., Geologist and Head FREDERICK SQUIRES, B.S., Petroleum Engineer DAVID H . SWANN, PH.D., Assoc. Geologist VIRGINIA KLINE, PH.D., Assoc. Geologist PAUL G. LUCKHARDT, M.S., Asst. Geologist WAYNE F. MEENTS, Asst. Geologist RICHARD J. CASSIN, B .S., Research Assistant SUE R . ANDERSON, B.S., Research Assistanl
[ndus~rial Minerals J. E. LAMAR, B.S., Geologist and Head ROBERT M. GROGAN, PH.D., Assoc. Geologist MARY R. HILL, B.S., Research Assistant
Clay Resources and Clay iMineral Technology RALPH E. GRIM, PH.D., Petrographer and Head HENRY M. PUTMAN, B.A.Sc., Asst. Geologist WILLIAM A. WHITE, B.S., Research Assistant
Groundwa~er Geology and Geophysical Exploralion CARL A. BAYS, PII.D., Geologist and Engineer, and
Head ROBERT R. STORM, A.B., Assoc. Geologist ARNOLD C. MASON, B.S., ASSOC. Geologist
(on leave) MERLYN B. BUIILE, M.S., ASSOC. Geologist M. W . PULLEY, JR., M.S., Asst. Geologist GORDON W. PRESCOTT, B.S., Asst. Geologist MARGARET J. CASTLE, Asst. Geologic Draftsman ROBERT hr. M . URASH, B.S., Research Assistant GEORGE H . DAVIS, B.S., Resea~ch Assistanl
Engineering Geology and Topographic Mapping GEORGE E. EKBLAW, PH.D., Geologist and Head R 1 ~ 1 1 . 4 ~ ~ F. FISHER, M.S., Asst. Geologist
Areal Geology and Paleontology H. B. WILLMAN, PH.D., Geologist and Head C H A L M ~ R L. COOPER, PH.D., Geologist C. LELAND HORBERG, PH.D., Assoc. Geologist HEINZ A. LOWENSTAM, PI-I.D., ASSOC. Geologist
Subsurface Geology L. E. WORKMAN, M.S., Geologist and Head ELWOOD ATHERTON, PI-I.D., Asst. Geologist PAUL HERBERT, JR., B.S., Asst. Geologist MARVIN P. MEYER, B.S., Asst. Geologist ELIZABETH PRETZER, MS. , Asst. Geologist
Physics R. J. PIERSOL, PH.D., Physicist
Secretary lo the Chief Geological Assistant
Mineral Resources Records VIVIAN GORDON, Head RUTH R. WARDEN, B.S., Research Assistant
GEOCHElZlISTRY FRANK H. REED, PH.D., Chief Chemist CAROL J . ADAMS, B.S., Research Assistunl
Coal G. R. YOHE, PH.D., Chemist and Head EVA 0 . BLODGETT, B.S., Research Assistant
[ndustrial Minerals J. S. MACHIN, PH.D., Chemist and Head TIN BOO YEE, M.S., Research Assistant
Fluorspar G. C. FINGER, PH.D., Chemist and Head OREN F. WILLIAMS, B.ENGR., Asst. Chemisl
Chemical Engineering H. W. JACKMAN, M.S.E., Chemical Engineer and Read P. W . HENLINE, MS. , ASSOC. Chemical Engineer JAMES C. MCCULLOUGH, Research Associate JAMES H . HANES, B.S., Research Assistant (on leave) LEROY S. MILLER, B.S., Research Assistant (on leavej EARL C. NOBLE, Technical Assistant
X-ray and Spectrography W. F. BRADLEY, PH.D., Chemist and IIead
Analytical Chemistry 0. W. REES, PH.D., Chemist and Head L. D. MCVICKER, B.S., Chemist HOWARD S. CLARK, A.B., Assoc. Chemist LEWIS E. MONCRIEF, B.S., Research Assirtant EMILE D. PIERRON, B.S., Research Assistant JOHN C. GOGLEY, B.S., Research Assistant ELIZABETH BARTZ, A.B., Research Assistant ALBERTINE KROHN, B.S., Research Assistant PHYLLIS K. BROWN, B.A., Research Assistant
MINERAL ECONOMICS W. 13. VOSKUIL, PH.D., Mineral Economist DOUGLAS F. STEVENS, M.E., Research Asso~.iate NINA HAMRICK, A.B., Research Assistant ETHEL M. KING, Research Assistant
EDUCATIONAL EXTENSION GILBERT 0. RAASCH, PH.D., Assoc. Geologist
LIBRARY REGINA YOAST, B.A., B.L.S., Librarian RUBY D. PRISON, Technical Assistant
PUBLICATIONS DOROTHY E. ROSE. B.S.. Technical Editor MEREDITH M. C A ~ K I N S , ' G ~ O ! O ~ ~ C Draftsman BEULAH F. HOPPER, B.F.A., Asst. Geologic
Draftsman WILLIS L. BUSCH, Principal Technical Assistant LESLIE D. VAUGHAN, Asst. Photographer
Consultants: Ceramics, CULLEN W . PARMELEE, M.S., D.Sc., and RALPH K. HURSH, B.S., University of Illinois Mechanical Engineering, SEICHI KONZO, M.S., Universzfy of Illznozs
Topographic Mapping in Cooperation with the United States Geological Survey. This report is a contribution of the Coal Division.
Aug. 1,'1946

CONTENTS
PAGE
Introduction . . . . . . . . . . . . . . . . . . . . . . . . . . . . . . . . . . . . . . . . . . . . . . . . . . . . . . . . . . . . . . . . . . . . . . . . . . . 7 Acknowledgments . . . . . . . ... . . . . . . . . . . . . . . . . . . . . . . . . . . . . . . . . . . . . . . . . . . . . . . . . . . . . . . . 7
Objectives . . . . . . . . . . . . . . . . . . . . . . . . . . . . . . . . . . . . . . . . . . . . . . . . . . . . . . . . . . . . . . . . . . . . . . . . . . . . . 7 Scope . . . . . . . . . . . . . . . . . . . . . . . . . . . . . . . . . . . . . . . . . . . . . . . . . . . . . . . . . . . . . . . . . . . . . . . . . . . . . . . . . 7 Equipment . . . . . . . . . . . . . . . . . . . . . . . . . . . . . . . . . . . . . . . . . . . . . . . . . . . . . . . . . . . . . . . . . . . . . . . . . . . . 8
Combustion . . . . . . . . . . . . . . . . . . . . . . . . . . . . . . . . . . . . . . . . . . . . . . . . . . . . . . . . . . . . . . . . . . . . . 8 Preparation . . . . . . . . . . . . . . . . . . . . . . . . . . . . . . . . . . . . . . . . . . . . . . . . . . . . . . . . . . . . . . . . . . . . . . . . 10
. . . . . . . . . . . . . . . . . . . . . . . . . . . . . . . . . . . . . . . . . . . . . . . . . . . . . . . . . . . . . . . . . . . . . . . . . . . . . . Procedure 12 Source of samples . . . . . . . . . . . . . . . . . . . . . . . . . . . . . . . . . . . . . . . . . . . . . . . . . . . . . . . . . . . . . . . . . . . 12 Preparation . . . . . . . . . . . . . . . . . . . . . . . . . . . . . . . . . . . . . . . . . . . . . . . . . . . . . . . . . . . . . . . . . . . . . . . . 13
. . . . . . . . . . . . . . . . . . . . . . . . . . . . . . . . . . . . . . . . . . . . . . . . . . . . . . . . . . . . . . . . . . . Chemical analysis 14 Petrographic analysis . . . . . . . . . . . . . . . . . . . . . . . . . . . . . . . . . . . . . . . . . . . . . . . . . . . . . . . . . . . . . . . . 14 Combustion testing schedule . . . . . . . . . . . . . . . . . . . . . . . . . . . . . . . . . . . . . . . . . . . . . . . . . . . . . . . . . 14
Combustion rating factors . . . . . . . . . . . . . . . . . . . . . . . . . . . . . . . . . . . . . . . . . . . . . . . . . . . . . . . . . . . . . . 15 Cost of heat . . . . . . . . . . . . . . . . . . . . . . . . . . . . . . . . . . . . . . . . . . . . . . . . . . . . . . . . . . . . . . . . . . . . . . . I5 Attention required . . . . . . . . . . . . . . . . . . . . . . . . . . . . . . . . . . . . . . . . . . . . . . . . . . . . . . . . . . . . . . . . . . 16 Ability to maintain desired temperature in the home . . . . . . . . . . . . . . . . . . . . . . . . . . . . . . . . . . . . 16 Smoke emitted . . . . . . . . . . . . . . . . . . . . . . . . . . . . . . . . . . . . . . . . . . . . . . . . . . . . . . . . . . . . . . . . . . . . . 18 Ability to maintain fire a t low rates of operation . . . . . . . . . . . . . . . . . . . . . . . . . . . . . . . . . . . . . . . 18 Appearance of fuel bed and fire . . . . . . . . . . . . . . . . . . . . . . . . . . . . . . . . . . . . . . . . . . . . . . . . . . . . . 18
Iiesults . . . . . . . . . . . . . . . . . . . . . . . . . . . . . . . . . . . . . . . . . . . . . . . . . . . . . . . . . . . . . . . . . . . . . . . . . . . . . . . . 19 Correlation of combustion results with chemical and petrographic analyses . . . . . . . . . . . . . . . . 19
. . . . . . . . . . . . . . . . . . . . . . . . . . . . . . . . . . . . . . . . . . . . . . . . . . . . . . . . . . . . . . . . . . Heatobtained 19 Uniformity of combustion . .. . . . . . . . . . . . . . . . . . . . . . . . . . . . . . . . . . . . . . . . . . . . . . . . . . . . 25 Responsiveness . . . . . . . . . . . . . . . . . . . . . . . . . . . . . . . . . . . . . . . . . . . . . . . . . . . . . . . . . . . . . . . . . 30 Pickup . . . . . . . . . . . . . . . . . . . . . . . . . . . . . . . . . . . . . . . . . . . . . . . . . . . . . . . . . . . . . . . . . . . . . . 32 Overrun . . . . . . . . . . . . . . . . . . . . . . . . . . . . . . . . . . . . . . . . . . . . . . . . . . . . . . . . . . . . . . . . . . . . . . 32 Clinker rating . . . . . . .. . . . . . .. . . . . .. . . . . . . . . . . . . . . . . . . . . . . . . . . . . . . . . . . . . . . 32 . .
Correlations between combustion character~st~cs . . . . . . . . . . . . . . . . . . . . . . . . . . . . . . . . . . . 35 Ranking of coals . . . . . . . . . . . . . . . . . . . . . . . . . . . . . . . . . . . . . . . . . . . . . . . . . . . . . . . . . . . . . . . . . 35 Effect of cleaning upon quality of coal . . . . . . . . . . . . . . . . . . . . . . . . . . . . . . . . . . . . . . . . . . . . . . . . . . . . 36
Effect upon chemical characteristics . . . . . . . . . . . . . . . . . . . . . . . . . . . . . . . . . . . . . . . . . . . . . . . . . . 39 Effect upon petrographic constitution . . . . . . . . . . . . . . . . . . . . . . . . . . . . . . . . . . . . . . . . . . . . . . . 46 Effect upon combustion characteristics . . . . . . . . . . . . . . . . . . . . . . . . . . . . . . . . . . . . . . . . . . . . . . . 47
Conclusions . . . . . . . . . . . . . . . . . . . . . . . . . . . . . . . . . . . . . . . . . . . . . . . . . . . . . . . . . . . . . . . . . . . . . . . . . . 52 Appendix-Complete data on all test coals . . . . . . . . . . . . . . . . . . . . . . . . . . . . . . . . . . . . . . . . . . . . . . . 53
TABLES
TABLE PAGE 1 . Source and descri.ption af.samples. . . . . . . . . . . . . . . . . . . . . . . . . . . . . . . . . . . . . . . . . . . . . . . . . . . . 12 2 . Relationship between cost of heat, heating value of coal, and cost of coal . . . . . . . . . . . . . . . . . . 24 3 . Sumerical ranking of combustion and chemical properties of coals tested . . . . . . . . . . . . . . . . .36, 37
. . . . . 4 . Changes in heating value, mineral matter. ash. sulfur and pyritic sulfur due to cleaning 40 5 . Change in quality, classified by methods of cleaning . . . . . . . . . . . . . . . . . . . . . . . . . . . . . . . . . . . . 41 6 . Changes in vitrain caused by cleaning . . . . . . . . . . . . . . . . . . . . . . . . . . . . . . . . . . . . . . . . . . . . . . . . 66 7 . Summary of changes in vitrain content caused by cleaning . . . . . . . . . . . . . . . . . . . . . . . . . . . . . . 47 8 . Percentages of the banded ingredients in the test coals . . . . . . . . . . . . . . . . . . . . . . . . . . . . . . . . . . 48 9 . Changes in combustion characteristics caused by cleaning . . . . . . . . . . . . . . . . . . . . . . . . . . . . . . . 50
10 . Summary of changes in combustion characteristics caused by cleaning . . . . . . . . . . . . . . . . . . . . 51

ILLUSTRATIONS
FIGURE PAGE . . . . . . . . . . . . . . . . . . . . . . . . . . . . . . . . . . . . . . . . . . . . . . . . . . . . . . . . . . . . . . . . . . 1 . Stoker-boiler unit 9
. . . . . . . . . . . . . . . . . . . . . . . . . . . . . . . . . . . . . . . . . . . . . . . . . . . 2 . Concentrating table and auxiliaries 10 . . . . . . . . . . . . . . . . . . . . . . . . . . . . . . . . . . . 3 . 1.ocation of mines from whi:h samples were obtained 13
4 . Heat output during continuous stoker operation with a coal which burned non-uniformly . . . 16 5 . Heat output during continuous stoker operation with a coal which burned uniformly . . . . . . . 17
. . . . . . . . . . . . . . . . . . . . . . . . . . . . . . . . . . . . . . . . . . . . . . . . . . . . . . 6 . Heat obtained vs . heatin2 value 1.9 . . . . . . . . . . . . . . . . . . . . . . . . . . . . . . . . . . . . . . . . . . . . . . . . . . . . . . . . . . 7a . Efficiency vs . heating value 20
. . . . . . . . . . . . . . . . . . . . . . . . . . . . . . . . . . . . . . . . . . . . . . . . . . . . . . . . . . . . . . . . . . 7b . Efficiencyvs.ash 20 . . . . . . . . . . . . . . . . . . . . . . . . . . . . . . . . . . . . . . . . . . . . . . . . . . . . . . . . . 7c . Efficiency vs . volatile matter 20
. . . . . . . . . . . . . . . . . . . . . . . . . . . . . . . . . . . . . . . . . . . . . . . . . . . . . . . 8 . Heat obtained vs . carbon .. 21 . . . . . . . . . . . . . . . . . . . . . . . . . . . . . . . . . . . . . . . . . . . . . . . . . . . . . . . 9 . Heat obtained vs . fixed carbon 22
. . . . . . . . . . . . . . . . . . . . . . . . . . . . . . . . . . . . . . . . . . . . . . . . . . . . . . . . . . . . . . . 10 . Heat obtained vs . ash 22 . . . . . . . . . . . . . . . . . . . . . . . . . . . . . . . . . 11 . Heat obtained vs . 0.713 heating value - 0.8 ash - 1000 22
. . . . . . . . . . . . . . . . . . . . . . . . . . . . . . . . . . . . . . . . 123 . Heat obtained vs . fixed carbon X heating value 23 . . . . . . . . . . . . . . . . . . . . . . . . . . . . . . . . . . . . . . . . . . . 12b . Heat obtained vs . carbon / (oxygen + ash) 23 . . . . . . . . . . . . . . . . . . . . . . . . . . . . . . . . . . . . . . . . . . . 12c . Heat obtained vs . ash + oxygen + nitrogen 23
13 . Relative cost of heat, as affected by heating value and cost of coal . . . . . . . . . . . . . . . . . . . . . . . 25 . . . . . . . . . . . . . . . . . . . . . . . . . . . . . . . . . . . . . . . . . . . . . . . . . . . . . . . . . . . . . . . . . 14 . Uniformity vs . ash 26
. . . . . . . . . . . . . . . . . . . . . . . . . . . . . . . . . . . . . . . . . . . . . . . . . . . . . . . 15 . Uniformity vs . mineral matter 26 . . . . . . . . . . . . . . . . . . . . . . . . . . . . . . . . . . . . . . . . . . . . . . . . . . . . . . . . . . . . . . . 16 . Uniformity vs . sulfur 26
. . . . . . . . . . . . . . . . . . . . . . . . . . . . . . . . . . . . . . . . . . 17 . View of fuel bed with large amount of clinker 27 . . . . . . . . . . . . . . . . . . . . . . . . . . 18 . View of fuel bed with considerable amounts of coke and clinker 27
. . . . . . . . . . . . . . . . . . . . . . . . . . . . . . . . . . . . . . . . . . . . . . . . . 19 . Uniformity vs . British swelling index 28 . . . . . . . . . . . . . . . . . . . . . . . . . . . . . . . . . . . . . . . . . . . . . . . . . . . . . . . . . . . . . . 20 . Mineral matter vs . ash 28
21 . Uniformity vs . vitrain . . . . . . . . . . . . . . . . . . . . . . . . . . . . . . . . . . . . . . . . . . . . . . . . . . . . . . . . . . . . . . 29 . . . . . . . . . . . . . . . . . . . . . . . . . . . . . . . . . . . . . . . . . . . . . . . . . . . . . . . . . . . . . . 22 . Responsivenessvs.ash 30
. . . . . . . . . . . . . . . . . . . . . . . . . . . . . . . . . . . . . . . . . . . . . . . . . . . . 23 . Responsiveness vs . volatile matter 30 24 . Pickupvs.ash . . . . . . . . . . . . . . . . . . . . . . . . . . . . . . . . . . . . . . . . . . . . . . . . . . . . . . . . . 31 25 . Pickupvs.A1203in ash . . . . . . . . . . . . . . . . . . . . . . . . . . . . . . . . . . . . . . . . . . . . . . . . . . . . . . . . . . . . 31
. . . . . . . . . . . . . . . . . . . . . . . . . . . . . . . . . . . . . . . . . . . . . . . . . . . . . . . . 26 . Pickup vs . volatile matter .. 31 . . . . . . . . . . . . . . . . . . . . . . . . . . . . . . . . . . . . . . . . . . . . . . . . . . . . . . . . . . . . . . . 27 . Overrun vs . ash .. 33
. . . . . . . . . . . . . . . . . . . . . . . . . . . . . . . . . . . . . . . . . . . . . . . . . . . . . . . . . . . 28 . Overrun vs . heating value 33 . . . . . . . . . . . . . . . . . . . . . . . . . . . . . . . . . . . . . . . . . . . . . . . . . . . . . . . . . . . . . . . 29 . Clinkerrat ingvs.ash 33
. . . . . . . . . . . . . . . . . . . . . . . . . . . . . . . . . . . . . . . . . . . . . . . . . . . . . . . . 30 . Heat obtainedvs . uniformity 34 . . . . . . . . . . . . . . . . . . . . . . . . . . . . . . . . . . . . . . . . . . . . . . . . . . . . . 31 . Heat obtained vs . responsiveness 34
. . . . . . . . . . . . . . . . . . . . . . . . . . . . . . . . . . . . . . . . . . . . . . . . . . . . . . . . . . . 32 . Responsiveness vs . pickup 34 . . . . . . . . . . . . . . . . . . . . . . . . . . . . . . . . . . . . . . . . . . . . . . . . . . 33 . Uniformity vs . pickup . . . . . . .... 38
. . . . . . . . . . . . . . . . . . . . . . . . . . . . . . . . . . . . . . . . . . . . . . . . . . . . . . . . . . . . . 34 . Uniformity vs . overrun 38 . . . . . . . . . . . . . . . . . . . . . . . . . . . . . . . . . . . . . . . . . . . . . . . . . . . . . . . . . . . . . . . . . . 35 . Overrun vs . pickup 38
. . . . . . . . . . . . . . . . . . . . . . . . . . . . . . . . . . 36 . Uniformity vs . minimum/average rates of heat release 39 37 . Changes in heating value, mineral matter, ash, sulfur, and pyritic sulfur caused by cleaning.42, 43


CORRELATION OF DOMESTIC STOKER COMBUSTION WITH LABORATORY TESTS AND TYPES OF FUELS
11. COMBUSTION TESTS AND PREPARATION STUDIES OF REPRESENTATIVE ILLINOIS COALS
BY
Roy jJ. T ~ E L I . ' I N S ' T ~ N E A N D CHARLES C. BOLEI'
I N T R O D U C T I O N
N 1942 the lllinois State Geological Survey issued the first report1 of a series
on stoker combustion studies designed to explore the influence of coal on the perform- ance of typical domestic stokers. T h e first investigation, which was carried out in coop- eration with the University of Illinois Engi- neering Experiment Station, described the testing of six Illinois and two West Vir- ginia coals. Performance characteristics, as determined primarily from the observed formation of coke in the fuel bed, the smoke emission, and the nature of the clinker, appeared to have some correlation with rank, petrographic constitution, and British swell- ing index number.
T h e present report, the second of the series, describes the results of more compre- hensive work along the same lines.
This investigation was made under the supervision of Gilbert H. Cady, Head of the *Coal Division, for whose continuing interest and many helpful suggestions the n~ri ters are indebted.
Grateful acknowledgment is extended to 0. W. Rees, Geochemical Section, who directed the many routine and specialized chemical tests, to B. C. Parks, Coal Divi- sion, who was responsible for the petro- graphic analyses, and to S. Konzo of the University of Illinois Engineering Experi- ment Station for assistance and advice throughout the investigation.
McCabe, L. C., IConzo, S., and Rees, 0. W., CorreIa- tion of domestic stoker combustion with laboratory tests and types of fuels. I. Preliminary studies: Ill inois Geol. S u ~ v e y , Rept . Inv. 78, 20 pp., 1942.
Most of the coal samples were contrib- uted by the coal companies whose coopera- tion a t all times is sincerely appreciated.
O B J E C T I V E S
T h e primary objective of the tests de- scribed in this report was to determine the degree of correlation existing between the combustion characteristics of Illinois coal in domestic stokers and their chemical prop- erties and petrographic composition. A n essential preliminary objective was the de- velopment of suitable criteria by which the relative combustion behavior of coal could be evaluated.
As a study of the entire range of Illinois coal quality was desired, several methods of cleaning the coal were employed. T h e action and effectiveness of these methods formed a secondary objective.
SCOPE
The re are many factors that govern the suitability of coals for domestic stokers. Included are : 1 ) cost of heat ; 2 ) attention required by the heating plant, including related cleanliness; 3 ) the ability to main- tain the desired temperature in the home; 4 ) the smoke emitted during combustion; 5 ) the ability to maintain fire at low rates of operation; 6) the appearance of the fuel bed and fire; '7) the odors given off by clinkers during their removal ; and 8) the quietness of operation. These factors vary in relative importance, depending upon the heating system being used and also upon personal preferences of the operator.
Some indicators of all the factors listed (except the odors given off by the clinker

8 D O M E S T I C S T O K E R COJ4BUSTION
and the quietness of operation) were de- vised and are included in this report. T h e rating factors are discussed in a separate section (pp. 15-18). As the present project was concerned only with factors influenced by the combustion properties of the fuel, the appearance and cleanliness of the coal before firing were not considered.
Forty-three Illinois coals, prepared from fifteen major samples, were tested. Chemi- cal tests of each coal included the proxi- mate analysis, the ultimate analysis, heating value, ash fusion temperatures, British swelling index, and some measure of plastic- ity. Additional determinations were made for the varieties of sulfur for 20 of the 43 coals, the chemical constituents of the ash for 22 coals, a measure of ignitibilitp for 21 coals, and chemical fusain for 16 coals.
Analysis for petrographic constitution involved a determination of the percentages of vitrain, clarain, durain, and fusain,%nd of non-coal material, defined as material exceeding 1.5 in specific gravity.
Quantitative correlations of combustion characteristics and the data on chemical nature and petrographic composition were sought and are presented, together with an analysis of the effects of the cleaning pro- cesses on the quality and quantity of the coals. I n addition, a basic fund of informa- tion regarding the combustion behavior of a group of Illinois coals has been obtained.
E Q U I P M E N T
All the tests included in this report were made in a stoker-fired cast-iron boiler, rated at 570 sq. ft . of equivalent direct radiation (136,800 B.t.u. per hour ) . A maximum feeding rate of 28 pounds per hour was also indicated by the boiler manufacturer, T h e unit was operated as a conventional forced- circulation hot-water boiler. T h e boiler inlet water was ~naintained at approximately 160" I?. by automatic control of the cluan-
' Cady, Gilbert H., Nomer~clature o i the megascopic de- scriptio~i of Illinois coals: Econ. Geol. vol. 34, No. 5 , pp. 175-91, 1939; Illi~iois Geol. Survey Cir. 46, 20 pp., 1939.
titp of cooling water to a heat exchanger in the boiler-water circuit.
T h e entire stoker-boiler unit, including the heat exchanger, was mounted on a scale with dial graduations of fi pound. All external connections were made highly flex- ible; in fact a 2-ounce weight placed on the unit would cause an observable movement of the scale pointer. A photograph of the test unit is shown in figure I .
A two-pen mercury-actuated recording thermometer provided a continuous record of the temperatures of the water entering and leaving the boiler. Th i s recorder had 12-inch round charts, with a temperature range of 80-220" 5'. and 1 " scale divisions. A check indicated the accuracy of the instru- ment to be about t go 1;. Thi s instru- ment error would be proportionately large during tests with low rates of operation if the maximum temperature difference be- tween the inlet and outlet water were lim- ited to 20' or 30" F., which is common practice in home installations. Therefore the maximum difference between the inlet and outlet boiler-water temperature was allowed to exceed 20' on many occasions.
T h e quantity of water flowing in the boiler-water circuit was indicated by a hot- water meter. T h e rneter was checked by occasionally weighing the quantity of water passing through, although no appreciable variation was ever found.
T h e rate of water flow was kept constant during the tests, irrespective of the opera- tion of the stoker. Th i s is contrary to usual home practice, but seemed to be neces- sary if the measurements were to be accu- rate. Intermittent flow would result in increased errors of flow measurement, re- quiring knowledge of the instantaneous rate of flow and the difference between inlet and outlet boiler-water temperatures a t cor- responding times. Such coordination would be extremely difficult. Therefore the water was circulated at a constant rate and as the same procedure m7as used for all tests, com- parable results were obtained.
T h e temperatures of the air entering the stoker fan and of the stack gas were recorded by means of a multipoint potentiometer (0 to +O millivolt range) and thermocouples.

FIG. 1. Stoker-boiler unit.
A chemical-type meter, which was fre- quently checked with a hand-operated Orsat analyzer, recorded the percentage of CO, in the stack gas. T h e static pressure in the stoker air duct was recorded by a pressure gage. A wattmeter, to show the power required by the stoker, and inclined tube manonieters, to show the draft in the stack and combustion chamber, were provided.
T h e multipoint potentiometer also re- corded the opacity of the stack gases. T h i s was done by projecting a beam of light across the smoke pipe upon a photoelectric cell. T h e current generated, which is approximately proportional to the illumina- tion on the face of the photoelectric cell, was passed through a fixed resistance. T h e voltage drop across this resistance was re- corded by the potentiometer. Since the illu- rnination falling upon the photoelectric cell is governed by the "density" of the smoke
in the stack, the desired record was made by the potentiometer.
A 16-mm. motion picture camera was used for taking pictures of the fuel bed by one arrangement and of the scale dial by another. A special timer allowed the pic- tures of the fuel bed to be taken at any interval from to 6 seconds per frame. O n e frame every 2$4 seconds was adopted as standard for the tests to date. W h e n not being used for taking pictures of the fuel bed, the camera was mounted and controlled in such a manner that it automatically took single frame pictures of the scale dial and a clock at appropriate regular intervals, thereby furnishing a record of the loss in weight of the unit without continuous atten- tion. T h e weight a t the indicated time could be determined rapidly and conveni- ently by viewing the film through a low- power microscope.

10 D OMESTPC S T O K E R COlWBUSTPON
PREPARATION dimensions of the deck were 8 feet 8 inches
T h e coal washing unit selected for the b ~ T 4 feet
investigation was a laboratory-size concen- T h e action of the concentrating table, in trating table, equipped with a diagonal lino- common with most coal washing processes, leurn-covered deck and wooden riffles. T h e takes advantage of the fact that the specific

EQUIPMENT
gravity of clean coal is appreciably less than the specific gravity of any solid inert mate- rial associated with the coal. T h u s any separation based upon specific gravity will also produce a relatively low-ash fraction and a relatively high-ash fraction.
T h e concentrating table utilizes specific gravity differences by balancing two tenden- cies that are simultaneously brought to bear on the coal particles. T h e head motion imparts a non-symmetric reciprocation of the table along its long axis, in such a way that particles on it tend to move toward one end. A t the same time a sheet of water flows across the table, tending to carry par- ticles toward one side. T h e coal to be cleaned is introduced at one corner, where the separation process begins. Particles of low specific gravity are affected more by the wash of water and less by the reciprocation of the deck and thus tend to be carried to the side, while the net tendency of motion for particles of higher specific gravity is toward the end.
Tt is evident that the angles of cross-wise and longitudinal slope are important in their effect. T h e concentrating table is built with provision for adjusting the cross- wise slope during operation; in these tests the table tvas modified to permit prompt adjustment of longitudinal slope also.
Special provision tvas also made to change the speed of reciprocation of the table, nor- mally of the order of 270 strokes per min- ute. Length of stroke could be adjusted during operation up to a maximum of about 1 ~ inches.
Coal from a bin of about 3500-pound capacity was fed to the table by a vibrating feeder controlled by a variable voltage auto- transformer. Wa te r flow was metered, and a modified type of manometer was provided to indicate rate of flow.
Because relatively small quantities of coal were available for the entire procedure of establishing equilibrium, beginning with an e~npty table and producing a t least 1500 pounds of coal under stable conditions, a recirculating system was developed, which consisted of a flight conveyor, a bucket ele- vator, and appropriate launders and chutes.
I t was then possible to draw off a relatively small (200 to 300 pounds) quantity of coal from the feed bin and to experiment at length, without further loss of coal, in order to establish desired washing conditions. During this period, coal particles were sep- arated on the table, recombined by launders, and dropped into relatively quiet water in a large tank where they settled into the trough of the flight conveyor. They were then carried up a de-watering section and dropped into the boot of a bucket elevator. which lifted them to a point that permitted chuting them back to the feedbox of the table. A photograph of the table and auxil- iary equipment is shown in figure 2.
W h e n the desired washing conditions were established, a simple redisposition of a launder and a deflector permitted the withdrawal of the separated products. A t the same time, of course, the feeder from the main feed bins was cut in, and the recir- culation phase of the washing operation gave way to the production phase, which continued steadily as long as necessary.
Sampling boxes were available for snap zone samples of the table products and for rapid estimation of percentage of rejcct being produced at any time.
Variations of size also affect the direc- tion and rate of travel of particles across the deck of a concentrating table, so that separation is not solely based on differences in specific gravity. For separation on a true specific gravity basis, a bath of high-density liquid in which particles are free to sink or to float may be used. I n this investigation, water solutions of zinc chloride were used, contained in 55-gallon barrels. Coal was lcwered into the solution in a close-fitting wire-mesh basket, and after stratification had taken place, a "float" basket with a spe- cial damper-type bottom was lowered through the floating coal. B y closing the" bottom and raising the float basket, practi- cally all of the floating coal was removed a t once, leaving only scattered particles to
-
remove with a dipper. Sink material was of course left in the larger basket. A small tank filled with water to wash the zinc chloride solution from the coal, and an over-

12 D O M E S T I C S T O K E R C O M B U S T I O N
-
Mining County Rank, High volatile Description bed districta 1 g',, ., or 1 of' cod
1 Franklin. . . . . . . Herrjn NO. 6 . . . . .Franklin- Williamson. . . . Washed stoker, 7/16" by
10 mesh
Raw 1%" stoker
1%" screenings, dedusted
1%" screenings
1%" screenings
. . . . . . . . 2 LaSalle . . . . . . . . . LaSalle No. 2 . . . . . LaSalle
. . . . . . . . . . . . . . 3 Vermilion. Grape Creek. . D a n d l e . .
5 Macoupin. . . . . . Herrin No. 6 . . . . . . Central Illinois.
. 6 Peoria. . . . . . . . . Springfield No. 5 . . Fulton-Peoria.
. . '7 Gallatin. . . . . . . .Harrisburg No. 5 . . Eagle Valley.
. . . 8 Wabash . . . . . . . . Friendsville. . . . . . . Mt. Carmel.
Mine run
Largely 2" or 3" screen- ings with some lump
. . . . . 9 St. Clair. . . . . . . . Herrin No. 6 . . . . . . Belleville. Mine run. Considerable fine coal included
Stoker, 1%" by 10 mesh . . . . . . . 10 Saline.. . . . . . . . .Harrisburg No. 5 . . Saline..
. . . . . . 11 Vermilion . . . . . . Danville No. 7 . . . . Danville.
. . . 12 Sangamon. . . . . .Springfield No. 5 . .Springfield..
Small stoker, 1" by 8 mesh
Largely stoker, 1" by 5/16", with some 5/16" by 0
. . . . . 13 Randolph. Herrin No. 6. . . . . . Southwestern Illinois. . . . . Crushed 1%" by x"
1% " screenings 14 Christian . . . . . .Herrin No. 6 . . . . . .Central Illinois
. . . . 15 Williamson. Herrin No. 6. . . . . .Franklin- Williamson . 1%" dedusted screenings
16 Knox. . . . . . . . . . Kock Island No. 1. Northwestern lllinois. . . . . Stoker, 1 " by "
a Designation of mining clistlicts approximately as user1 i n : Bemcnt A., I l l i l~ois coal: Ill inois Ceol. Sulvey Bull. q6, p. 23 , 1929.
1' Average h e a ~ i n g value, cspressed in hundreds of I3.t.u. per po1111tl on n moist inineral-nlatter-frcc h:~sis, for Lace samplcs reported u p l o October, 1931. Scc: Cady, G i l b e r ~ If . , Classification a d selection oI lll inois coals: Ill inois Geol. Survey Bull. 62, 3 5 1 pp., 1935.
head track, trolley, and chain hoist simpli- fied the hoisting and moving operations.
A three-surface vibrating screen, accorn- modating wire-mesh screens 17 by 32 inches in size, was used for the screening operations, and a small jaw crusher and a 12 by 10-inch smooth surf ace double-roll crusher were used for crushing,
and petrographic analyses, so that a mass of data relating to the combustion, chemical, and petrographic characteristics of all the test coals was built up.
Salient details of the source of the sam- ples, methods of preparation, and nature of chemical and petrographic analyses are given below.
PROCEDURE
Fifteen shaft mines throughout the State of Illinois, producing coal from all commer- cially important seams and in all major mining districts (excluding strip mines), were selected (table 1 and fig. 3 ) .
T h e county average of rank i n d e x h f the coals tested ranged from 121 to 145, as
I n brief, the flow of work involved obtaining a truck-load of coal from a selected mine, sizing the coal, pseparing from it two lots of improved quality (seduced mineral matter content), and testing a lot of sized but otherwise untreated coal and the two improved lots with standardized tests in a stoker-boiler unit. A t the same time, sam- ples were obtained for subsequent chemical
-1e:lting ra lue , moist mineral-mattcr-free basis, ex- pressed i n hundl-eds of B. t .u . per pound.

PROCEDURE 13
FIG. 3 . Location of mines from which samples w e r e obtained.
noted in table 1. T h i s represents nearly the complete range of rank index variation for Illinois coal, extending from 112 to 145. I 7
1 he only coal available with rank index lower than 121 is strip-mine coal, which was avoided throughout because of possible effects due to weathering.
A fixed size range of one-half inch square hole by S mesh was selected and used throughout the tests. A study of the effect of size on combustion is the objective of a separate investigation. T h e selected size was well adapted to the concentrating table, and discrepancies due to sampling and seg- regation in handling were minimized by the small absolute size and the narrow size range.
W i t h the exception of test coal l A , all sizing was done with the vibrating screen. T h e nominal size of coal 1 A as obtained was 7/16-inch by 10 mesh, and it received no fur ther preparation. T h e other test coals. were passed over a one-half inch screen, and the oversize was crushed and passed over the screen a second time, this being repeated if necessary. Minus 8-mesh particles were sampled, weighed, and dis- carded.
1 7 1 he concentrating table was used to pro- duce a coal of reduced mineral matter con- tent (identified by the suffix letter B ) from the raw coal (identified by the suffix letter A ) . T h i s operation was carried out in such a way that there was a commercially rea- sonable recovery, usually of the order of SO to 90 percent.
T h e adjustments of the concentrating table were varied during an initial trial period as appeared to be necessary for the coal being prepared. T h e recirculation equipment (p. 11 ) permitted experimenta- tion for any desired length of time. W h e n a visually satisfactory separation was ob- tained, with approximately the desired amount of recovery, preparation of the test coal was begun and carried through with- out further change in the adjustments.
In most cases a coal of still lower min- eral matter content (identified by the suf- fix letter C) was then prepared, using the table or the zinc chloride solution, or both. T h i s operation was carried out without regard to the maintenance of a commer- cially reasonable percentage of recovery ; the major intent was to produce, from the quantity available, a coal with the greatest possible change in characteristics from the original. T h e only limitation was the need for approximately 1500 pounds for sam- pling and combustion testing.
Each washed coal was surface dried, with- out heat, in an effort to produce a washed coal having a moisture content similar to that of the corresponding raw coal. Coals 5B and 5B1 were exceptions; they were dried in a gas-fired oven, with resulting moisture contents less than half of that of coal 5A.

14 DOMESTIC STOKER COi"I4BUSTIOAT
Coals 5B1 and 6B1 were substantial duplicates of coals 5 B and 6B, respectively, with regard to preparation procedure and to resulting ash content.
Coal 12A1 was prepared by adding to coal 12C crushed and sized clinker produced in burning coal 12B in an amount calculated to bring the resulting ash content up to that of the raw coal, 12A.
A sample of from 100 to 150 pounds from each of the 43 coals was crushed and rifled to a portion of about two pounds for the chemical tests, which were conducted under the direction of 0. W. Rees, Head of the Analytical Chemistry Division of the Illinois Geological Survey. Standard meth- ods of the American Society for Testing M a t e r i a l s h e r e used for the proximate and ultimate analyses, and for the determi- nation of heating values and ash fusion temperatures. Varieties of sulfur were determined according to Powell and Parr." For the property of plasticity, the Gieseler test" was used for the majority of the coals. Fo r ignitibility, the procedure developed by the Coal Research Laboratory of Carnegie Institute of Technology7 was used. Chem- ical fusain was determined by a method suggested by Fuchs and his associate^.^
T h e petrographic work, in which the per- centages of vitrain, clarain, durain, and fusain were estimated, was conducted by B. C. Parks. T h e method used involved a microscopic examination of each of a number of clos"e1y sized fractions prepared
V t a n d a r d methods of laboratory sampling and analysis of coal and coke : A.S.T.M. Designation D271-44.
6Pomell, A. R . , with Parr, S. W., A study of the forms in which sulfur occurs in coal: Univ. of Ill. Eng. Exp. Sta. Bull. 111, 66 pp., April 1919. .. .
Brewer, R. E., Plastic and swelling properties of bitu- minous coking coals: U. S. Bur. Mines Bull. 445, VP. , - - lo!-111, 19G.
I Sebastian, J. J. S., and Mayers. M . A., Coke reactivity determination by a modified ignition point method: Ind. Eng. Chem.. vol. 29, v . 1118, October 1937.
X ~ ~ ~ l ~ ~ , Walter, auger, A. W., Hsaio, C. C., and Wright, C. C., The chemistl-y of the petrographic constitw ents of bituminous coals. Pa r t I , Studies on Fusain: Pa. State College, Min. Ind. E m . Sta. Bull. 23 , 43 pp.. 1938. - .
!' Parks, Bryan C., studies in the petrographic- analysis of broken coal by the particleacount method: Illinois Geol. Surv., Rept. Inv . I n preparation.
f rom a sample of the coal to be analyzed. A thorough review of the subject and de- scription of the technique has been prepared for separate publication."
T h e combustion testing schedule included tests with the stoker operating 60, 45, 30, and 15 minutes out of each hour. Approx- imately 300 pounds of coal were burned during each of these tests. T h e intermit- tent test with the stoker operating 15 min- utes out of each hour was followed by a hold-fire test of two days with the stoker operating about three minutes out of each one and three-fourths hours, and then a two-hour test with continuous stoker oper- ation.
T h e test with the stoker operating contin- uously was started on a clean hearth. Only the clinker was removed before all tests with intermittent stoker operation. All coal, clinker, and ash were removed a t the end of the series of tests with a given coal. About 50 pounds of coal were burned be- fore starting the actual test after changing the stoker operation rate and removing the clinker. Moving pictures of the combus- tion chamber were taken for approximately one-half hour at a definite time during each test with a given operation rate.
T h e chronological test schedule follows :
Tuesday Start fire on clean hearth. Cause stoker to operate continuously. Beginning of test period for continuous stoker operation. Star t taking motion pictures of fuel bed. Stop taking motion pictures of fuel bed. End of test period with continuous stoker operation. Remove clinker, fill hopper and change stoker operating rate to 45 minutes on and 15 minutes off. Beginning of test period with stoker operating 45 minutes out of each hour.
Wednesday Start taking motion pictures of fuel bed. Stop taking motion pictures of fuel bed. Star t taking motion pictures of fuel bed. Stop taking motion pictures of fuel bed.

COMBUSTION RA TIWG FACTORS 15
End of test period with stoker oper- ating 45 min. out of each hour. Re- move clinker, fill hopper and change stoker operating rate to 30 minutes on and 30 minutes off. Beginning of test period with stoker operating 30 minutes out of each hour.
Thursday Start taking motion pictures of fuel bed. Stop taking motion pictures of fuel bed. Star t taking motion pictures of fuel bed. Stop taking motion pictures of fuel bed. End of test period with stoker oper- ating 30 minutes out of each hour. Re- move clinker, fill hopper and change stoker operating rate to 15 minutes on and 45 minutes off. Beginning of test period with stoker operating 15 minutes out of each hour.
Friday Start taking motion pictures of fuel bed. Stop taking motion pictures of fuel bed. Star t taking motion pictures of fuel bed. Stop taking motion pictures of fuel bed.
Saturday End of test period with stoker oper- ating 15 minutes out of each hour. Remove clinker and change stoker operating rate to hold-fire (3 minutes out of each 1 M hours).
Monday Start stoker operating continuously. Stop stoker. Quench fire, remove clinker and ash from hearth, and fly ash from boiler passages. Remove coal from hopper, worm, and retort.
T h e weights of all coal placed in the hop- per, and of the coal, clinker, fly ash, and refuse removed were recorded. T h e refuse .it-as sampled and analyzed for percentage of ash. This information enabled the cal- culation of the average relationship between the loss in weight of the stoker-boiler unit and the coal burned.'"
T h e average difierence between the inlet and outlet bailes-water temperature was determined for 20-minute intervals for the test with continuous stoker operation, and for each hour for the three tests with inter- mittent stoker operation. Overall averages of these temperature differences for each operation rate were determined. Overall averages for each operation rate were also obtained for "density" of smoke, pressure in the stoker windbox, temperature of the --
coal ied-(clinkec ~ c m o \ e d + ash in ~ e f u s e + fly
R,ltio= . ~ i h 111 boller pas\<igei)
~ 0 3 1 fcd i n t c combuqt~on clia~nber
room, temperature of the stack gases dur- ing stoker operation, percentage of CO, in stack gases during stoker operation, rate of water flow through the boiler, boiler out- put, and coal burning rate.
C O I M B U S T I O N RATING
F A C T O R S
*As stated in the discussion of the scope of the investigation, some indicators were devised for all listed performance charac- teristics (p . 7 ) , except odor given off by the clinker and quietness of operation. 'P'hese indicators were all based upon objec- tive measurements, with the exception of clinker characteristics. A brief description of these indicators follows.
T h e cost of heat can be readily computed if the amount of heat that can be obtained from a pound of coal and the cost of the coal are known. T h e former can be deter- mined by fairly standard laboratory proce- dures, 1%-hich were followed for all reported tests. W i t h these standard tests, the heat output of the boiler, which is called "heat obtained" in this report, is the product of the difference in temperature between the inlet and outlet water and the quantity of water flowing through the boiler.
I t should be recognized that the actual quantity of heat obtained per pound of coal will be dependent upon the heating plant used for the tests. Therefore the values for heat obtained should be considered as relative, and are given in absolute terms only as a convenience. I n fact, the figures do not represent the total amount of heat that would be given up to the house with the unit because of radiation from the heat- ing plant, including the chimney. A discus- sion of these losses is given in University of Illinois Experiment Station Bulletin No. 1 89.11
l1 Willard, Ar thur C., I h a t z , Alonzo P., a n d D a y , Vin- cent S., rnvestigation of \ r a m air furl~:tces and healing systems, Pni-t I V : Univ . 111. Eng. Eup. Sta . Bull. 189, pp. 46-55, 1929.

T h e attention required by a stoker-fired heating plant depends upon many things. One major item is the frequency of required cleaning periods, which is generally related to the quantity of ash. Another is the quantity of clinker to be removed, ~ h i c h is equal to the quantity of ash, if it is a good stoker coal. T h u s the percentage of ash in a coal is one index of the amount of atten- tion required.
Other factors include the characteristics of the clinker. I t is generally considered desirable for clinkers to have a high density ( to minimize volume removed) and to be tough ( to enable removal~without shatter- ing) , However, the clinker should not be so hard that it is difficult to break i t into pieces that are easy to handle. T h e clinker should not stick to the hearth or combustion cham- ber walls, nor tend to form within the stoker retort. A major requirement is that the ash fuse into a clinker so that none must be removed in loose form.
I t is evident that judgment concerning clinkering characteristics is largely based upon personal opinions and that such char- acteristics do not readily lend themselves to objective tests. A subjective ranking vary- ing from 0 (unsatisfactory) to 5 (ideal) was made at the time of clinker removal. I n common with all subjective rankings, its value is limited.
ABILITY TO MAINTAIN DESIRED TEMPERA-
TURE IN THE HOME
T h e ability of a heating plant to maintain the desired temperature within a home is generally thought to be governed by the heating plant and its controls. Neverthe- less, the fuel burned may exert a influence. For example, if the coal does not burn uniformly it is possible that too little heat will be supplied during a period of poor combustion to maintain the desired tempera- ture, even though the stoker operates con- tinuously.
T h e magnitude of the variation of the instantaneous rate of heat release is fre- quently not realized. Figure 4 S ~ O T ' V S this variation in rate of heat release with one of the coals tested that did not burn uni- formly. T h e stoker was operating continu- ously throughout the period illustrated. Even the most uniformly burning coal varied somewhat in rate of heat ele ease, as shown by figure 5.
An indicator of the magnitude of this variation is the ratio of minimum rate of heat release to the average rate of heat release. Therefore the heat release for each 20-minute interval of the test with continu- ous stoker operation was determined, and the minimum value was divided by the aver- age to give the required ratio. T h e ratio of the minimum to average rates of heat release was also determined for the tests
Hours a f t e r f i r e was s t a r t e d
FIG. 4. Variat ion in heat output d u r i n g continuous stoker operation .with coal 9A, a rela- tively non-uniformly burning coal.

COMBUSTIOAT RA T I N G FACTORS
FIG. 5 . Variation in heat output during continuous stoker operation with coal 15C, a rela- tively uniformly burning coal.
27 5
250
2 225
L :zoo
175 t
with 45, 30, and 15 minutes of stoker oper- ation per hour. T h e cycle of operation for these tests was considered to be 60 minutes. I t is recognized that the determination of absolute minimum value requires tests of infinite length. However, each test had a sufficient number of cycles to furnish a fairly reliable indicator of this combustion characteristic.
T h e ability of a heating plant to main- tain uniform temperatures will probably be influenced by the constancy of the heat re- lease at any one operation rate. Th i s char- acteristic was expressed as the average per- centage variation of the rate of heat release, for relatively short intervals of time, from the average rate of heat release for the test. T h e intervals arbitrasilp selected were 20 minutes for the test with continuous stoker operation, and 60 minutes for the other three rates.
T h e responsiveness of the fire is an impor- tant factor when quick heat is desired after a prolonged hold-fire period, such as occurs when the house temperature is reduced dur- ing the night. "Responsiveness" in the present report is the average rate of heat release from the boiler for the first 30 min- utes of stoker operation following the 50- hour hold-fire period. Only one test u7as made for each coal, because the time required
150 I ,125 t 2
,P 100 3
O 7 5 U - Z 5 0 m
25
0
for duplicate tests was not thought to be warranted. T h e values indicated should not be considered as representative, but as single examples. Another factor closely connected with the responsiveness of the fire after a prolonged "off" period is the respon- siveness after a shorter "off" period, such as caused by thermostatic control during normal operation. Th i s factor was meas- ured by determining the amount of heat released during the first five minutes of stoker operation following a 45-minute "off" period, and was classified as "pick- up." T h e values given are averages of 40 cycles.
Some stoker-fired heating systems occa- sionally release sufficient heat after the stoker is shut off (by thermostatic or other type of control) to cause the temperature to rise above that desired. If so, the home owner would favor a coal furnishing the least amount of heat after the stoker shuts off. A measure of this tendency was made by determining the amount of heat released during the first five minutes after the stoker is shut off during the test period with 15 minutes of stoker operation per hour. T h e value given is the average fo r 40 cycles, and is called "overrun." Overrun is also an indicator of the responsiveness of the fire to control.
.
-
.
I
4
Hours o f t e r flre was s t o r t e d
5 6 7 8 9 10 I I 12 13

18 DOMESTIC S T O K E R COMBUSTION
SMOKE EMITTED
I t is difficult to measure the quantity of smoke that passes out the stack during com- bustion. However, a record of the opacity of the stack gases can be made fairly con- veniently with the apparatus described (p. 9 ) . I t should be recognized that the rec- ord obtained does not give a quantitative measure of "smoke" for several reasons. Included is the fact that the velocity of the smoke particles through the beam of light is not constant. For example, with other factors constant, a drop in stack tempera- ture from 100O0 F. to 635O F. results in a 25-percent decrease in velocity of the stack gas. If the velocity of the s~noke particle is considered equal to that of the gas, only three-fourths the amount of smoke ~ o u l d pass out the stack at the lower temperature for the same reading of the smoke density indicator. T h i s range in stack temperature could readily occur when testing poor coals.
W i t h intermittent stoker operation, the possible variation between smoke densitj- and weight of the solid particles can be even greater, for the stack temperature not onl~7 drops a greater amount when the stoker shuts off, but the actual flow by weight of stack gas is reduced to a very small amount. T h u s the volume of gas passing out the stack is extremely low, and a rather limited amount of "smoke" by weight passing out the stack per unit of time ill result in a relatively opaque gas. T h i s fact should always be remembered when records show that with a domestic stoker, the smoke density is greatest just after the stoker stops. T h i s does not necessarily mean that the rate of the "smoke" emission during this off period is greater than during opera- tion.
I n any event the smoke produced when using a properly adjusted domestic stoker is not a serious problem, so elaborate equip- ment and highly accurate rneasurements m7ere not considered w$rranted.
A satisfactory stoker coal must provide a responsive fire without giving off an appreciable quantity of heat. T h e most desirable coal in this respect would be the one that maintained the most responsive fire with the lowest combustion rate. As the length of time required to determine the lowest operation rate for each coal would be prohibitive, it 11-as arbitrarily decided that any coal that would maintain a respon- sive fire with the stoker operating approxi- mately 3 minutes out of each 1% hours would be considered excellent in this respect. All coals were thus checked.
APPEARANCE OF F U E L BED AND F I R E
Some householders may judge the suita- bility of a coal for domestic stokers by the appearance of the fuel bed and fire. T h i s is rather unfortunate since the appearance may be very misleading. A level fuel bed, burning uniforn~ly across the hearth, so often pictured, seldom exists in practice.
Although visual inspection alone is not an adequate basis for judging stoker coal performance, it may aid in assigning the cause for non-uniform combustion. T h u s , motion pictures of the fuel bed furnish a useful record. Such pictures are not amen- able to presentation in a written report ex- cept for enlargement of isolated frames.

RESULTS 19
. R E S U L T S
Before discussing the results of the tests, it seems desirable to point out that the exact duplication of any single test can not be expected for several reasons. Included among these is the fact that coal is not a homogeneous substance, and no two loads, or even pieces of coal, are exactly alike. Consequently different results may be well expected, with the amount of variation dependent upon the uniformity of the coal. Errors of measurement also, prevent the exact duplication of results. These error, are quite small with the present equipment. but still exist. T h e results of a few dupli- cate tests indicate that 200 or 300 B.t.u. per pound is the least variation in heat obtained that should be considered signifi- cant. T h e least significant variations for the other combustion rating factors are probably two percentage figures for uni- formity, 3,000 B.t.u. per hour for respon- siveness, 2,000 B.t.u. per hour for pickup, and 3,000 I3.t.u. per hour for overrun.
T h e results discussed are all based upon tests of Illinois coals Although the range
in characteristics is quite large, the coals are limited to the high volatile bituminous group. T h e conclusions reached are meant to apply to Illinois coals, and no extrapola- tion of results to out-of-state coals has been attempted. T h e data reported were obtained from the tests on the stoker-boiler unit Qre- viously described. However, it is thought that the coals would exhibit the same rela- tive performance characteristics in other domestic heating units of this general type. Several tests on duplicate coals with a stoker-furnace unit that was available sup- ported this conclusion.
Reference in the following discussion to degree of correlation existing between vari- ous items is based upon judgment of the usefulness of the graphs from the stand- point of estimation of one item from knowl- edge of another. T h e use of statistical methods to evaluate degree of correlation, while possible, did not appear to be war- ranted. T h e data are presented in full in the appendix.
1. H E A T OBTAINED
T h e amount of heat that was obtained from each coal was very nearly directly pro- portional to the heating value of the fuel, on the as-fired basis, as determined in a cal-
-. - 9 4 0 0 10,200 11,000 11,800 12,600
1 13,400
Heat~nq value, as - f i r e d basis, F3.t.u. per Ib.
FIG. 6. Relationship of heat obtained per pound of coal to heat ing value, on the as-fired basis.

D O M E S T I C S T O K E R COMBUSTIOLV
~ e o t i n g v a l u e , a s - f i red b a s i s , B.t u p e r Ib.
A s h , a s - f i r e d basis , p e r c e n t
2 3 3 1 3 3 35 3 7 3 9 41
Vola t i l e matter, a s - f i r e a b a s i s , p e r c e n t
FIG. 7. Relationship of efficiency of stoker-boiler to ( a ) heat ing value, ( b ) ash, and ( c ) volatile mat ter , on the as-fired basis.
ol-imeter (fig. 6 ) . T h e solid line appears N o evidence of unusual test or sampling to be the best single line to represent the errors could be found that would account points shown. All points falling within the for the variations exceeding 5 percent. T h u s dotted lines are within 5 percent of the while the heat that will be obtained from value indicated by the solid line. I t will be Illinois coals can generally be closely pre- observed that most of the points plotted are dicted from knowledge of the heating value, within the t 5-percent lines. exceptions are quite roba able.

RESULTS 21
Attention should be directed to the fact that the line indicated as the best for the points plotted is not an exact proportional- ity, owing to a slight increase in efficiency1' of the heating plant with an increase in the heating value of the coal, as indicated by figure 7a. T h e increase in efficiency for the range of heating value represented was about 5 percent, although the coal with the lowest heating value (coal 8A) actually burned with a higher efficiency than did the coal with the greatest heating value (coal 7 C ) . '17his emphasizes the risk in making all-inclusive generalizations.
Figuses 7b and 7c also show the relation- ships between efficiency and the percentages of ash and vol2tile matter as determined by chemical analysis. No marked trends are indicated.
1 1 0
10 0
I t might be well to emphasize that as far as cost of heating is concerned, the product of efficiency and heating value, which is called "heat obtained" in this report, is the governing factor. I n addition, the term efficiency has several meanings, which often
d -9.0
w a
2 8 0 m
q 7 0 73 P) C
o 6.0 5 t
E5.0 5
4 .O
3 0 53 55 5 7 59 61 6 3 6 5 6 7 69 7 1 7 3 75
Carbon, 0s-fired basis, percent
FIG. 8. Relationship of heat obtained per pound of coal to percentage of carbon, on the as-fired hasis.
-
lead to misunderstandings, so its use is min- imized in this report.
8
l 'The term efficiency 2s used i n this repot-t is the ratio of the heat absorbed by the boiler \I-ater to the heat of complete combustion, per u n i t weight of fuel burned.
T h e heat obtained from the coals tested was also nearly directly proportional to the percentage of ultimate carbon, on the as- fired basis (fig. 8 ) . T h e r e were actually fewer points outside the +- 5-percent lines with the carbon curve than with the heating value curve. However, this correlation with carbon is not as useful as that with heating value, because the former is more difficult to determine by present methods used in the chemical laboratory.
Hea t obtained also exhibited a strong correlation with fixed carbon (fig. 9 ) although not quite as good as with heating value (fig. 6 ) or ultimate carbon (fig. 8 ) . 'The correlation of heat obtained with the percentage of ash should probably be con- sidered as only fair, but it is a useful one because it is easily determined in the labo- ratory. Figure 10 shows that most of the values obtained fall within the +- 10-per- cent lines.
Some of the chernical items that furnished relatively poor correlations with heat ob- tained may be of interest. Although graphs are not shown in this report, little or no useful correlation was found to exist be- tween the heat obtained and the British snrelling index, volatile matter, moisture or vitrain.

~ i x e a carbon, as-fired basis, perceni
0.713 Heat ing value -0.8 ash - 1000
FIG. 9 ( T o p ) . Relationship of heat obtained per pound of coal to percentage of fixed carbon, on the as-fired basis.
FIG. 10 (Middle ) . Relationship of heat obtained per pound of coal to percentage of ash, on the as-fired basis.
FIG. 11 (Bottom). Relationship of heat obtained per pound of coal to the best fitting linear expression involving heating value and ash, on the as-fired basis.

RESULTS 2 3
Combinations of a few items given by provements in correlation over that obtained chemical analysis were selected and the best with heating value alone are very slight. co-efficients for a linear equation (equated to Figure 11 is a graph of one of the combina- heat obtained) were calculated. T h e im- tions calculated. Three other combinations
Fixed carbon X heat ing value
1.4 1.8 2.2 2.6 3.0 3.4 3.8 4.2 4.6
O x y ~ ~ ~ b ~ ~ s b 9 as-fired basis
17 19 21 2 3 25 27 29 31 33 35 37 3 9 A s h + oxygen + ni t rogen, 0 s - f i r e d b a s i s , percent
FIG. 12. Relationship of heat obtained pe r pound of coal to ( a ) fixed carbon X heating va lue ; ( b ) ratio of carbon to oxygen plus a s h ; ( c ) percentage of ash + oxygen + nitrogen; all on the as-fired basis.

COMBUSTION RRTILVG FACTORS
Table 2.-RELATIONSHIP BETWEEN COST O F HEAT, HEATING VALUE O F COAL., AND COST O F COAL
! . -
Heating value of coal. B.t.u. per lb . CostOf~oal . 9600 10000 1 10400 10800 1 11200 11600 12000 1 12400 12800 1 13200
dollars per ton
I Relative cost of heat obtained
which also give good correlation with heat obtained are : 1 ) the product of fixed car- bon and of heating value (fig . 12a) ; 2 ) the ratio of carbon to oxygen-plus-ash (fig . 12b) ; and 3) ash plus oxygen plus nitro- gen (fig . 12c) . T h e product of fixed car- bon and heating value will probably prove to be the most useful of this group .
T h e home owner is not primarily inter- ested in the actual amount of heat that can be obtained from a pound of coal . His prob- lem is one of relative costs . T h e relative cost of heat can be fairly readily calculated, if the cost of the coals and the amount of heat that is obtained per pound are known.
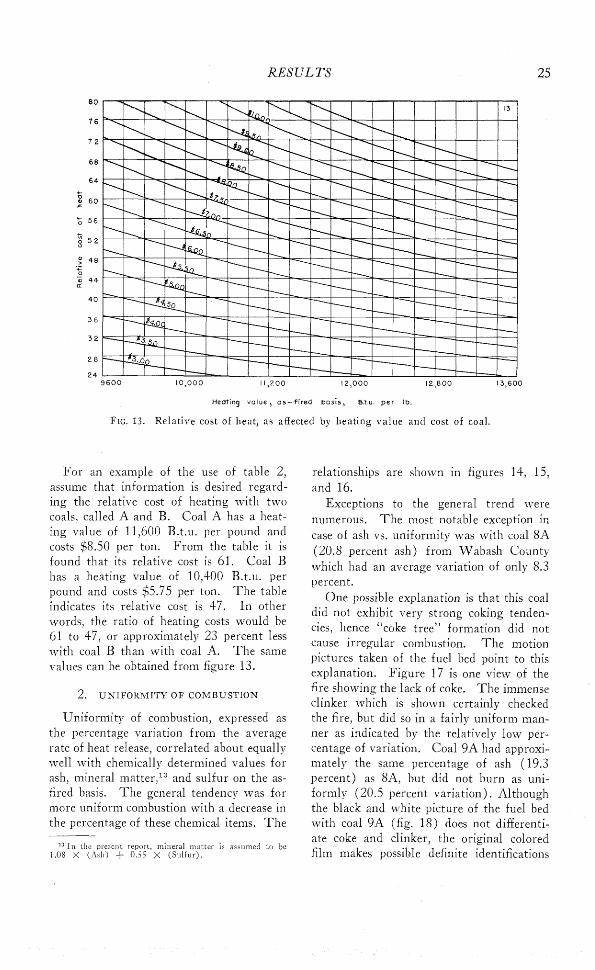
As the heat that can be obtained from a pound of coal can be closely predicted as indicated by figure 6. it is possible to approximate the cost of heat directly from knowledge of the heating value . Such cal- culations are given in table 2 . T h e base cost of heat given in the table is that obtained with coal of 9600 B.t.u. per pound. on the as-received basis. and costing $1 1.00 per ton. which is assigned a value of 100 . T h e figures for all other heating values and coal cost give the cost of heat relative to this arbitrarily selected base coal . T h e same general information contained in table 2 is given in figure 13 .
RESULTS
9600 10,000 11,200 12,000 12,800 13,600
Heating v a l u e , as- f i red basis, B.t.u, per Ib.
FIG. 13. Relati-ve cost of heat, as affected by heat ing va lue and cost of coal.
For an example of the use of table 2, assume that information is desired regard- ing the relative cost of heating with two coals, called A and B. Coal A has a heat- ing value of 11,600 R.t.u. per pound and costs $8.50 per ton. From the table it is iound that its relative cost is 61. Coal R has a heating value of 10,400 B.t.u. per pound and costs $5.75 per ton. T h e table indicates its relative cost is 17. I n other words, the ratio of heating costs would be 61 to 1 7 , or approximately 23 percent less with coal B than with coal A. T h e same values can be obtained from figure 13.
2. UNIFORMITY O F COMBUSTION
Uniformity of combustion, expressed as the percentage variation from the average rate of heat release, correlated about equally well with chemically determined values for ash, mineral matter," and sulfur on the as- fired basis. T h e general tendency was for more uniform combustion with a decsease in the percentage of these chemical items. T h e --
l V n the picaent report, mineral ~ ~ ~ . t i t e r i a assumed to be I .OS X (.M) + 0.5; x ( S u l l u l ) .
relationships are shown in figures 11, 15, and 16.
Exceptions to the general trend were numerous. T h e most notable exception in case of ash vs. uniformity was with coal 8A (20.8 percent ash) from Wabash County which had an average variation of only 8.3 percent.
One possible explanation is that this coal did not exhibit very strong coking tenden- cies, hence "coke tree" formation did not cause irregular combustion. T h e motion pictures taken of the fuel bed point to this explanation. Figure 17 is one view of the fire showing the lack of coke. T h e immense clinker which is shown certainly checked the fire, but did so in a fairly uniform man- ner as indicated by the relatively low per- centage of variation. Coal 9A had approxi- mately the same percentage of ash (19.3 percent) as $A, but did not burn as uni- formly (20.5 percent variation) . Although the black and white picture of the fuel bed with coal 9A (fig. IS ) does not differenti- ate coke and clinker, the original colored film makes possible definite identifications

26 DOMESTIC S T O K E R COMBUSTION
0 2 4 6 8 10 12 14 1 E 18 20 22
Ash, as- f i red basis , percent
~ i n e r a l matter, as- f i red basis. percent
0.6 1.0 1.4 1.8 2.2 2.6 3.0 3.4 3.8 4.2 4.6 5.0 5.4
Su l fu r , a s - f i r e d b a s i s , percent
FIG. 14 ( T o p ) . Relationship of uniformity of combustion to percentage of ash, on the as-fired basis.
FIG. 15 ( M i d d l e ) . Relationship of uniformity of combustion to percentage of mineral matter, on the as-fired basis.
FIG. 16 (Bottom). Relationship of uniformity of combustion to percentage of sulfur, on the as-fired basis.

FIG. 17. View of fuel bed with large amount of clinker.
FIG. 18. View of fuel bed with considerable amounts of coke and clinker.

DOMESTIC S T O K E R COMBUSTION
0 I 2 3 4 5 6 7 8 9
B r i t i sh s w e l l i n g index
FIG. 19. Relationship of uniformity of combustion to British swelling index.
of the large solid mass in the foreground as clinker, and the two spires at the top of the picture as coke. T h e lower portions of the pieces of coke are hidden by the clinker. I t is obvious that the amounts of both coke and clinker would influence the uniformity of combustion. Hence the more uniform combustion with coal 8A than with coal 9X might be attributed to the difference in coking tendencies, since their percentages of ash are comparable.
T h e British swelling index is commonly considered to be an indicator of coking tendency, and so an attempt n7as made to combine the percentage of ash and this swell- ing index inCa manner that would give a. use- ful correlation with uniformity of heat release. However, no systematic relation- ship could be found.
T h e correlation of uniformity of combus- tion and British swelling index alone is very poor, as indicated by figure 19. This figure
0 2 4 6 8 10 12 14 16 I8 2 0 22
A s h , as-fired bas i s , percerrt
FIG. 20. Relationship of percentage of mineral matter to percentage of ash in coals tested, on the as-fired basis.

RESULTS 29
also indicates that the great majority of
Illinois coals have a British swelling index
in the 3 to 5 range, which is indicative of
intermediate to weak coking tendency.
T h e uniformity vs. mineral matter graph
(fig. 15) exhibits very nearly the same
characteristics as the uniformity vs. ash
graph, with coals 8A, 3A, 8B, 2A, 16A, 8C,
1 l B , 1 IC, and 7 C still exhibiting the great-
est variation from the curve drawn. Th i s
might be expected, because the percentages
of ash and mineral matter in the Illinois
coals tested exhibit a strong correlation as
shown in figure 20.
When the percentages of sulfur were
plotted against uniformity (fig. 1 6 ) , it ' was
found that the Wabash County coals (8 series) followed the indicated trend quite
closely. Coals ZA, 16A, 1 1 C, 1 1 B, and 7C varied considerably from the general trend,
as they did on the uniformity vs. ash graph,
and also coals 11A and 9A.
T h e uniformity of combustion correlated fairly well with the percentage of vitrain (fig. 21 ) with the exception of the Wabash County coals. However, the maximum per- centage of vitrain reported for any coal burned was less than 30 percent. Within the range of coals tested, those with the higher percentages of vitrain tended to burn more uniformly.
Numerous other single chemical items were plotted against the uniformity of com- bustion. Included were ultimate carbon, fixed carbon, moisture, Gieseler plasticity, heating value, oxygen, volatile matter, ini- tial deformation temperature of the ash, softening temperature of the ash, and fluid temperature of the ash. T h e correlations were considered to be poor or non-existent in every case.
Several combinations including ash and sulfur ; ash, sulfur and carbon-hydrogen ratio ; and ash and ash-softening tempera- ture were tried. Little or no improvement in correlation over that found with ash alone was evident.
itr rain, as -fired basis, percent
FIG. 21. Relationship of uniformity of combustion to percentage of vi t ra in .

DOMESTIC S T O K E R COMBUSTION
3. RESPONSIVENESS measure of ignitibilit~. However, the igni-
T h e responsiveness of the fire after a prolonged hold-fire period correlated fairly well with the percentage of ash in the coals (fig. 22). No definite reason could be found to explain the wide deviation of the group of six coals with approximately 9 per- cent ash that released heat to the boiler at a rate well above the apparent trend.
As coal was fed into the combustion chamber faster than it burned during the period when the responsiveness of the coal was measured, it would seem that there might be a useful correlation with some
tion temperatures reported were very nearly constant, and no correlation was evident.
T h e volatile matter is driven off rapidly af ter the coal comes into the combustion chamber, so that correlation between respon- siveness and volatile matter seemed possi- ble. However, the data (fig. 23) did not reveal such a correlation.
T h e value given as an index to respon- siveness is not a measure of the amount of heat released by the coal, but of the rate of heat absorption by the boiler water. Be- cause the clinker, ash, and fuel in the com-
L
Ash, as - f i r ed bas is , percenl
vo la t i le ma t te r , as - f i r e d bas i s , p e r c e n t
FIG. 22 ( T o p ) . Relationship of responsiveness of the fire after a prolonged hold-fire period to percentage of ash, on the as-fired basis.
FIG. 23 (Bottom). Relationship of responsiveness of the fire af ter a prolonged hold-fire period to percentage of volatile matter, on the as-fired basis.

RESULTS
0 2 4 6 8 10 12 14 16 18 20 22 Ash, as-fired basis, percent
volatile mutter, as-fired basis, percent
FIG. 24 ( T o p ) . Relationship of pickup ra te after a 45-minute "off" period to percentage o f ash, on the as-fired basis.
FIG. 25 (Midd le ) . Relationship of pickup rate after a 45-minute "off" period to percentage of AlsO: in the ash.
FIG. 26 (Bottom). Relationship of pickup ra te af ter a 45-minute "off" period to percentage of volatile matter, on the as-fired basis.

32 D O M E S T I C S T O K E R C O f V B U S T I O N
bustion chamber are relatively cool after a prolonged hold-fire period, they will absorb heat during the early part of the operation period. T h e quantity of heat absorbed will be partially dependent upon the amount of clinker, ash, and fuel in the combustion chamber. I t is therefore obvious that even if the rate of heat release were the same for all coals, the rate of heat absorption by the boiler would be less for the high-ash coals.
Wi th the exception of mineral matter, all the other chemical items tried furnished either poor or no correlation with the re- sponsiveness. Included were British ssvell- ing index, ultimate carbon, Gieseler plastic- ity, heating value, oxygen, sulfur, moisture, initial deformation temperature of the ash, softening temperature of the ash, and fluid temperature of the ash. .Li t t le o r no corre- lation was evident between the percentage of vitrain and responsiveness.
3. P I C K U P
One of the better indicators of pickup (defined on p. 17) was the percentage of ash on the as-fired basis, shown in figure 24. Numerous points fall outside the i: 10-per- cent lines. I t is evident that the correlation is far from excellent.
Coal 8A again gave better performance than would be expected in view of its high ash content. I n fact, its rate of pickup was greater than that of coal 16C which had less than 5 percent ash. Thus , while the pickup rate did generally increase with a decrease in ash, the performance of individ- ual coals can not be predicted.
T h e heating value, sulfur, mineral mat- ter, and carbon, on the as-fired basis, fur- nish about the same degree of correlation with pickup as the percentage of ash. A graph of the percentage of aluminum oxide in the ash vs. pickup rate indicates a fair correlation, as shown by figure 25, with a general increase in pickup accompanying an increase in A 1 0 . Coals 3C and IA, which furnished the greatest rate of pickup, were not included among the 22 coals for which the composition of the ash was determined. Unless these coals had more than 26 per- cent A1203 in their ash, which would not be
expected, their high rate of pickup must be assigned to other causes.
Although during the pickup period the coal is fed into the combustion chamber faster than it is burned, the volatile matter is probably released as fast as the coal is fed. 'I'hus, the volatile matter might be expected to serve as an indicator of pickup rate. How- ever, figure 26 indicates that there is little or no correlation.
Other chemical and petrographic items that gave poor or no correlation with pickup rate were British swelling index, fixed car- bon, moisture, ash fusion characteristics, Gieseler plasticity, and vitrain.
5. O V E R R U N
T h e percentage of ash and the heating value of the coal, on the as-fired basis, give the best correlations with overrun (defined on p. 17) of those plotted. Neither is very good (figs. 27 and 28 ) . T h e range in over- run for equal ash or heating value is quite large. T h e correlation of mineral matter, sulfur, and carbon, on the as-fired basis, with overrun rate was of the same general order as the correlations of overrun with ash and with heating value. T h e correla- tions between overrun rate and British swelling index, Gieseler plasticity, oxygen, volatile matter, ash fusion characteristics, and vitrain were either poor or non-existent.
It is recognized that the subjective ratings of the clinker may not be strictly compara- ble because more than two pears elapsed be- tween removing the first and last clinker for the series of tests reported, and the suc- cessive ratings were probably biased in each case by comparison with the clinker last seen. I n other words, the tendency would be to give the clinker a higher rating than proper if the clinkers recently removed had been very poor, and a lower rating if the previous ones had been excellent.
Some correlation is evident between the subjective clinker rating and percentage of ash (fig. 29), but the points are widely scat- tered from the general trend. One coal

RESULTS
0 2 4 6 8 10 I2 14 16 18 20 22 Ash. as-fired basis, percent
H e a t ~ n g value, 0s-fired basis , B t u per Ib.
0 L 2 4 6 8 10 12 14 16 18 2 0 22
AS^, 0s-bred basis, percent
FIG. 27 ( T o p ) . Relationship of overrun rate af ter a 15-minute "on" period to percentage , of ash, on the as-fired basis.
FIG. 28 (Midd le ) . lielationship of overrun rate after a 15-minute "onJJ period to heating value, on the as-fired basis.
FIG. 29 (Bottom). Relationship of subjective clinker ra t ing to percentage of ash, on the as-fired basis.

34 D O M E S T I C S T O K E R C O M B U S T I O N
0 2 4 6 8 10 12 14 16 18 20 22 Uniformity, percent variation from average heat r e l e a s e
4 4
4 0 s
3 6 Q
1 3 2 m
1 28 "7
24 !z 0 > ', 20 c 0
$ 16 aJ a
1 2
8 I 5 5 5 9 6.3 6.7 7.1 7.5 7.9 8.3 8.7
Heat obto;ned, M B.b. per Ib.
FIG. 30 ( T o p ) . Relationship of heat obtained per pound of coal to uniformity of combustion.
FIG. 31 ( M i d d l e ) . Relationship of heat obtained per pound of coal to responsiveness of the fire after a prolonged hold-fire period.
FIG. 32 (Bottom). Relationship of responsiveness of the fire after a prolonged hold-fire period to pickup rate after a 45-minute "oft"' period.

with a clinker rating of four had an ash numerical order from good to poor. content approximately equal to another with Although the coals from southern Illinois a rating of one. This overlapping is even are generally superior in most of the char- more evident in intervening ratings. acteristics listed, frequently the prepared
T h e clinker rating FT;as also plotted coals from other fields, and occasionally a
against the initial deformation, softening, raw coal from the northern districts, are
and fluid temperatures of the ash. Little included with the superior coals.
or no correlation was evident. Coal 15C furnished the greatest amount of heat per pound of coal of any tested. This
CORRELATIONS BETWEEN COMBUSTION was float coal in a of
CHARACTERISTICS approximately 1.3 specific gravity, and rep- Little if any apparent definite relation- resented the lightest 44 percent of coal 15A.
ship exists between the heat obtained from a Th i s low recovery, although not commer- coal and the uniformity with which it burns cially practical, was of laboratory interest (fig. 30 ) . Only one coal furnished more in an endeavor to secure an extreme heat than the Gallatin County coals ( 7 improvement. I t may be noted that the series), but they were among the poorer softening temperature of the ash was 250" coals in respect to uniformity. Several coals F'. less than with coal 15B. Nevertheless, that furnished very low quantities of heat some improvement over 15B occurred in burned quite uniformly. However, the nearly all the combustion characteristics. Franklin, Saline, and Williamson County Th i s was not true with coal from Knos coals ranked high in both categories. County (16 series). T h e lightest fraction
T h e responsiveness of the fire to heat did not in general perform more satisfac- demand after a prolonged hold-fire period appeared to have only a slight correlation with the heat obtained as shown in figure 31. A slightly better corselation is shown in figure 32 between responsiveness and pickup. Figures 33 and 34 show that there is little correlation between uniformity of combustion and pickup or overrun. How- ever, an increase in pickup is generally ac- companied by an increase in overrun, as indi- cated by figure 35. Figure 36 shows that there is a very good correlation between the uniformity of combustion and the minimum rate of heat release divided by the average rate of heat release.
torily than the first upgrade, although its lower ash would be desirable.
T h e coals from L a Salle County ( 2 series) ranked rather poorly from the stand- point of heat obtained, but remarkably high in uniformity of combustion.
T h e chief point of interest about the Gal- latin County coals ( 7 series) was the lack of improvement resulting from the cleaning operations. Although all three of the series ranked high as far as heat obtained per pound was concerned, they were in the lower ranks for most of the other combus- tion characteristics. T h e moisture content of these coals is quite low in comparison with other Illinois coals.
RANKING OF C O A L S Care needs to be exercised when using
As has been stated, the coals can be ranked according to individual characteristics, but these individual characteristics can not be combined into a single overall rating, be- cause their relative importance is not con- stant.
Table 3 lists some of the combustion and che~nical properties of the coals tested in
table 3 for a comparison of coals. For example, one of the poorer performing coals ( 6 A ) has the lowest percentage of volatile matter. This is a result of a high percent- age of inerts, and the relative position of this coal would be shifted considerably if the volatile matter ranking were made on a moisture-and-ash-free basis.

D O M E S T I C S T O K E R C O M B U S T I O N
TABLE 3.-COMBUSTION A N D CHEMICAL PROPERTIES O F COALS TESTED.
Heat obtained
Coal M No. B.t.u
per lb.
Uniformity
:oal Vari- No. atior
per cent
Responsive- ness
:oal M No. B.t.u
Per hr .
Pickup
:oal M No. B.t.u
Per hr .
Overrun
>oal M No. B.t.u
Per hr .
Ash
:oal Per No. cent
Volatile matter
:oal Per No. ceni
Fixed carbon
2oal Per No. cent
EFFECT OF CLEANING U P O N Q U A L I T Y OF COAL
T h e production of coals &th character- istics appreciably different from those of the raw coals was the primary purpose of the coal cleaning work. T h e examination o i the degree of change in quality resulting from the cleaning operation was an objec- tive of secondary importance.
I t was not considered advisable nor with- in the scope of the investigation to stand- ardize on some one element of the cleaning
operation, such as percentage of reject, per- centage of reduction in mineral matter, per- centage of final mineral matter, or, in the case of the concentrating table, the setting of the various operating variables. Such a selection and its numerical value would have been arbitrary, and no single choice could be expected to be applicable to all Illi- nois coals.
T h e criterion for the tabling which pro- duced the "B" coals was the establishment of an optimum degree of separation of coal


D O M E S T I C S T O K E R C O M B U S T I O A T
U n i f o r m i t y , p e r c e n t v a r i a t i o n f r o m a v e r a g e h e a t re lease
U n i f o r m i t y , p e r c e n t v a r i a t i o n f r o m a v e r a g e h e o t re lease
4 0 4 4 4 8
Average p lcKup r a t e , M E3.t.u. p e r hr.
FIG. 33 ( T o p ) . Kelationship of uniformity of combustion to the pickup rate after a 45-minute "off" period.
FIG. 34 ( M i d d l e ) . Relationship of uniformity of combustion to the overrun rate after T,
15-minute "on" period.
FIG. 35 (Bot tom) . Kelationship of overrun rate after a 15-minute "on" period to pickup ra te after a 15-minute "off" period.

E F F E C T Ob' C L E A N I N G
FIG. 36. Relationship of uniformity of combustion to the minimum rate of heat release divided by the average rate of hea t release for all stoker operation
rates except
of coal remaining on the table and in the conveying equipment at the end of the clean- ing run.
T h e changes in quality characteristics resulting from the coal cleaning work in this investigation are discussed in the fol- lowing sections. T h e summaries apply only to the coals actually cleaned and should not be considered as necessarily representative of all cleaned and all ramT Illinois coal.
EFFECT UPON CHEMICAL CHARACTERISTICS
Tables 4 and 5 summarize the data re- lating to type of cleaning, amount of reject, and extent of improvement in quality in the 25 coals cleaned in the course of the pres- ent investigatio~i, as reflected in changes in mineral matter, ash, sulfur, and heating value. Figure 37 illustrates certain of the data shown in table 4. Unless otherwise stated, all data are reported on the dry basis and in terms of raw coal.
a) . Minel-nl n ~ a l t e r content. - ' rhe major purpose and effect of any coal clean- ing process is reduction of mineral matter, defined for the purposes of the present re- port as 1.08 X (Ash) + 0.55 X ( S u l f u r ) . I n table 5 the changes in mineral rnatter are summarized and classified by method of cleaning. T h e majority of coals were pre-
hold-fire.
pared by tabling, with the operating adjust- ments such that no more than a commer- cially reasonable amount of raw coal was rejected. T h i s was arbitrarily taken as a rnaxirnum of 25 percent, although for any given coal and process, the percentage of reject most financially attractive depends upon a variety of market considerations. I n lllinois cleaning plants, the proportion of reject averages about 1 6 percent of raw coal,I4 and in at least one plant it is under- stood to be about 25 percent.
Fur the 17 coals cleaned by the use of the table alone, so operated that less than 25 percent of raw coal was rejected, mineral matter was reduced an average of 33.9 per- cent, varying fsorn 13.5 to 47.7 percent (table 5, column 1 ) . O n the basis of per- centage points the average reduction was 7.2, varying from 1.3 to 11.7.
Variations in degree of improvement in the up-grading of coals are due primarily to differences in specific gravity distribu- tion. A ran- coal containing a relatively large proportion of particles composed of both high- and low-gravity material bound together is much more difficult to separate sharply on the basis of specific gravity than .-
1AYoung, \Ti. H.. Axle~-son. R. L.. a n d Isaac, L. 'I., Bitrlrnirlouj coal and lignite; table 52 . U. S. Bus. Mines Minerals Yearbook, 1913.

Coal
. . . . . . . . . . . . . . . . . . . Tabling . . . . . . . . . . . . . . . . . . Tabling.
Tabling. . . . . . . . . . . . . . . . . . . . . . . . . . . . . . . . . . . . . Tabling.
. . . . . . . . . . . . . . . . . . Tabling. Tabling. . . . . . . . . . . . . . . . . . .
. . . . . . . . . . . . . . . . . . . Tabling Tabling-. . . . . . . . . . . . . . . . . . . r 7 I abling. . . . . . . . . . . . . . . . . . . Tabling. . . . . . . . . . . . . . . . . . .
Tabling. . . . . . . . . . . . . . . . . . . Tabling. . . . . . . . . . . . . . . . . . .
. . . . . . . . . . . . . . . . . . Tabling. . . . . . . . . . . . . Float and sink.
. . . . . . . . . . . . . . . . . . Tabling. Retabling". . . . . . . . . . . . . . . . ? 7 i abling . . . . . . . . . . . . . . . . . . . Retabling". . . . . . . . . . . . . . . . .
Tabling. . . . . . . . . . . . . . . . . . . Retabling". . . . . . . . . . . . . . . . .
Tabling. . . . . . . . . . . . . . . . . . . . . . . . . . . . . . . . . . . Retabling".
. . . . . . . . . . . . . . . . . . Tabling. Retnblingk . . . . . . . . . . . . . . . .
. . . . . . . . . . . . . . . . . . Tabling. . Tabling and float and s ink . .
Tabling. . . . . . . . . . . . . . . . . . . Tabling and float and s ink . .
TABLE 4.-CHANGES I N HEATING VALUE, MINERAL MATTER, ASH, TOTAL SULFUR, A N D PYRITIC SUI.FUR CAUSED BY C L E A N I N G ~ --
a All d a t a are reported on d r y basis. Percentages are referred t o raw cod,.
--
" Second tnhling of previously tabled coal.
- --
Decrease in pyritic sulfur
Type of cleaning percent- age pts.
Loss in cleaning, percent
Percent
Increase in heating value
--
Percentage increase in coal
substance (100 minus
mineral matter) B.t.u-/lb.
Decrease in mineral matter
Percent
--
Decrease in ash
percent- age pts.
percent- age pts.
-
Decrease in sulfur
Percent Percellt percent- age pts. Percent
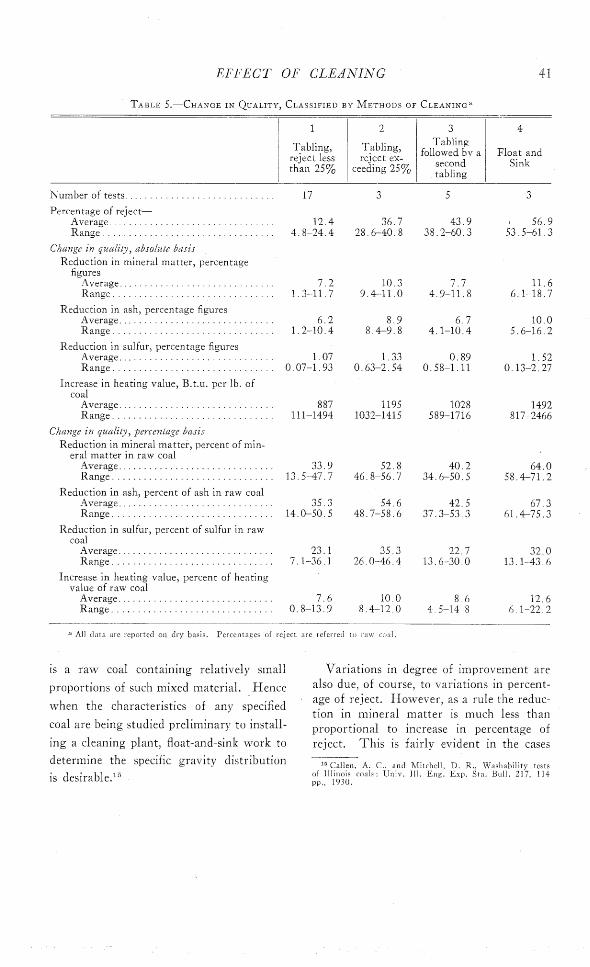

4-2 DO-MESTIC S T O K E R COIWBUSTIOX
M E T H O D OF CLEANING AND AMOUNT OF REJECT - TABLING
0 RETABLING - FLOAT AND SINK
FIG. 37n. Changes in heating value, mineral matter, ash, sulfur, and pyritic sulfur, on the d r y basis, caused by cleaning.
of coals 2, 3, 7 , and 8 (table 4 and fig. 3 7 ) , Efforts were made to further increase the the second tabling of which (a t substan- quality of coal by : 1 ) special tabling to tia1l.y larger percentages of reject) produced insure a percentage of reject exceeding 25 additional but not proportionately large percent (table 5, column 2 ) ; 2) retabling reductions in mineral matter. the first cleaning products, also with high

E F F E C T OF CLEANIhTG 43
CRITERION AND PERCENTAGE O F IMPROVEMENT (DRY BASIS) - INCREASE IN HEATING VALUE
WZSZ INCREASE IN COAL SUBSTANCE (UNIT COAL)
DECREASE IN M I N E R A L MATTER
I DECREASE IN ASH
DECREASE I N PYRITIC SULFUR
DECREASE I N TOTAL SULFUR
n
IOB IOC l l B I IC 12B 12C 138 13C 148 14C 158 15C 16B 16C
FIG. 57b. Changes in heating value, mineral mhtter, ash, sulfur, a n d pyritic suifur, on the d r y basis, caused by cleaning.
per-centages of reject referred to the raw tcr of 52.8 percent and an average reject coal (table 5, column 3 ) ; and 3 ) float-and- of 36.7 percent. For the five coals produced sink procedures (table 5, column 4 ) . Three by the second method, the reduction in min- coals were produced by the first method, eral matter averaged 40.2 percent, with an with an average reduction of mineral mat- average reject of 43.9 percent Three coals

44 DOMESTIC STOKER COr'CIBUSTION
were produced by the third method, using zinc chloride solutions of such low specific gravities (of the order of 1.30) that rejects of over 50 percent were produced in each case. T h e average reduction in ~n inera l matter was 64.0 percent. However, no single coal was cleaned by more than one of the three methods, so a direct compari- son of the methods is not possible.
b) . Ash coutent.--Quantity of ash is more easily determined and hence more commonly used than quantity of mineral matter in evaluating quality of coal, even though it is less exact theoretically. Ash, or inert material in its burned state, is gener- ally about fifteen percent less than mineral matter, which approximates inert material (dry basis) in its unburned state. KOW- ever, the relative reductions of ash and of mineral matter from raw to cleaned coal are of similar magnitude, and the foregoing comments on the effect of cleaning on min- eral matter apply very closely to the effect of cleaning on ash. Tables 4 and 5 and figure 37 set forth the data.
c ) . Sulfur conten t.-Reduction of sul- phur on a moisture-free basis is not usually as high, on a percentage basis, as reduction in mineral matter and ash (tables 4 and 5, fig. 3 7 ) . For the 17 tabled coals prepared at the expense of less than 25 percent reject, the average reduction in sulfur was about 1 percentage point, or 23 percent. For the coals prepared at the expense of higher per- centages of reject, the reductions averaged 1.2 percentage points, or 29 percent.
Sulfur occurs in three distinct forms ill
coal, but only pyrite (iron disulfide) , with a specific gravity of about 5.0, is reduced in percentage by a cleaning process that de- pends upon differences in specific gravity. Neither sulfur organically combined with the caal substance nor that occurring as a sulfate compound is appreciably affected by such a process.
D a t a on the percentage reduction in pyritic sulfur are presented for thirteen cleaned coals (table 4, fig. 3 7 ) . T h e y tend to be some~vhat higher than the percentagc reduction in minerd matter, ranging from 36.1 to 65.1 percent.
d). Heating e,alue.-For the 17 coals cleaned by the use of the table alone, so operated that less than 25 percent of raw coal was rejected (table 5, column I ) , heat- ing values were increased an average of 887 I3.t.u. per pound, varying from 11 1 to 149-1- I3.t.u. per pound. T h e average percentage increase in heating value was 7.6 with a range from 0.8 to 13.9.
For the eleven coals cleaned by means of the table o r float-and-sink methods, or both, with percentages of reject more than 25 percent (table 5, columns 2, 3, 4, and 5 ) , the increases in heating value were some- what greater. They had an average of 1200 B.t.u. per pound and ranged from 589 to 2466 B.t.u. per pound. O n a percentage basis, the average increase in heating value was 10.1, with a range from 4.5 to 22.2.
T h e heating value of a given coal may be considered approximately proportional to the percentage of heat-producing material, with inert or non-heat-producing material acting as a diluent. F o r purposes of com- putation, satisfactory accuracy may usually be obtained by defining inert material (dry basis) simply as ash. T h i s leads to t he familiar dry ash-free heating value as a basis for computing heating value for any cleaned product, the ash content of which is known. T h e heating values of the 28 cleaned coals, so computed, have an average variation from the heating values, as deter- mined in a calorimeter, of 84 B.t.u. per pound.
&lore complex definitions of inert mate- rial have been proposed, one being mineral matter, previously defined as ( 1.08 X Ash + 0.55 X Sul fur ) , and another a modifi- cation of this (1.1 X Ash + 0.1 X Sul- f u r ) . These do not always yield better results in computing heating value. As a matter of fact, for the 28 cleaned coals, the average difference between computed and determined heating values is 147 E3.t.u. per pound using ( 1.1 X Ash + 0.1 X Sulfur) as the diluent, or 204 B.t.u. per pound using (1.08 )< Ash + 0.55 X Sulfur) as the diluent. Correcting for the heat of combustion of sulfur, as recommended by

EFFECT O F C L E A N I N G
Parr , lG reduces the latter average difference to 127 B,t.u. per pound.
D r y mineral-matter-free heating value with corsection for sulfur (uni t heating value) is a concept widely accepted as an estimate of the heating value of the pure coal substance. For the present data, unit heating value averages 153 J3.t.u. per pound lower in the cleaned coal than in the raw coal, a value larger than can be accounted for by sampling fluctuations. T h e cleaning process thus appears to have reduced the heating value of the coal substance, insofar as this is given by unit heating value, by approximately 1.0 percent. Possible expla- nations are: 1 ) accelerated oxidation of the coal due to the wetting and drying cycle suffered in the washing process; or 2 ) a
selective action in the washing process whereby particles of a prevailingly loiver unit heating value concentrate in the cleaned-coal product.
e). Volatile ~ t ~ a t l ~ ~ . atld fixed ca?-t)o~i.- O n an; comparable moisture basis the re- duction of ash in a coal by a known amount obviously increases by an equal amount the percentage of coal mater id represented by the sum of volatile matter and fixed carbon. Ordinarily, but not a1it.a: s, both volatile matter and fixed carbon share in this in- crease. For the 27 cleaned coals for ivhich data are available, the average increase in volatile matter was 2.3 percentage figures, and in fixed carbon, 4.7 percentage figures, on the dry basis. I n three cases the entire increase due to reduction in ash was absorbed by fixed carbon and in one case by volatile matter.
T h e possibility of selective action in the cleaning process, whereby particles having prevailingly higher or lower fixed carbon are concentrated in the clean coal, may be investigated by cornpasing the ratio of fixed carbon to volatile matter before and aftes cleaning. These satios are, respectively, 1.25 and 1.30 on the average for the data of this report. I n other words, the average
lP 'Pa r l , S. W.. T i e c ~ ~ I ~ . I ~ c ~ ~ L ~ u I ~ of coal: Univ. 111. Eng. lr7xp. Sta . Bull. 180, 59 pp., 1928.
raw coal had a fixed carbon content 25 per- cent greater than volatile matter, while the average cleaned coal had a fixed carbon content 30 percent greater than volatile matter. T h i s difference is greater than could be attributed to sampling fluctuations, and it may be inferred that a slight selective action existed in the cleaning processes, pos- sibly due to low-ash particles having a pre- vailingly higher ratio of fixed carbon tc volatile matter than high-ash particles in most of the coals tested.
f ) . Items of the ultiniate analysis.-- Reduction of non-combustible material re- sults in a ccrresponding increase in the coal substance and hence usually in increases in the pel-centages of carbon, hydrogen, oxygen, and nitrogen. However, the increases in these elementary components are rarely pro- portionately alike, the tendency being toward apprec'ably higher oxygen in the cleaned coals than might be expected. O n the mois- ture-and-&-free basis, the average cleaned coal has 1.4 percentage figure more oxygen than the average raT,v coal. a difference greater than may be attributed to sampling fluctuations. O n the same basis the differ- ences in carbon, hjdrogen, and nitrogen appear to be insignificant. Sulfur, of course, is reduced, as has been discussed previously.
9 ) . . ish f usiox I r m f i ~ r n t ul-es.-The aver- age diflerence in ash softening temperature between the raw coals and the cleaned coals was an increase of 30' F. Although this is less than the usual laboratory tolerance of 54' F. between duplicate samples, the trend exceeds reasonable sampling fluctuations, and a tendency toward slightly higher ash s ~ f t e n i n g temperature in the washed coals prepared in the present investigation seems evident.
N o significant change in either initial cleformation temperature or fluid tempera- ture is apparent.
11). O ~ h e ? - CILPI!IZ'~CII t ~ s t s . - Washing appeared to reduce chemical fusain, but changes were small in absolute amount.
N o significant effects due to washing on British swelling index, Gieseler plasticity, or ignition temperature appear to be dem- onstrated.

16 DOMESTIC S T O K E R COLWBUSTION
Franklin-No . 6 . . . . . . . . . . . . . . . . . . .
Vermilion-Grape Creek . . . . . . . . . . . . . . . . . . . . . . . . . .
Vermilion-Grape . . . . . . Creek . . . . . . . . . . . . .Tabling
Vermilion-Grape . . . . . . Creek . . . . . . . . . . . . .Tabling
Macoupin-No . 6 . . . . . . . . . . . . . . . . . . . . . . . Macoupin-No . 6 . . . .Tabling . . . . . . Macoupin-No . 6 . . . .Tabling
Peoria-No . 5 . . . . . . . . . . . . . . . . . . . . . . . . . . . . . . . . . . Peoria-No 5 .Tabling.
. . . . . . . . . . . . . . Peoria-No 5 .Tabling
Gallatin-No . 5 . . . . . . . . . . . . . . . . . . . . . . . . . Gallatin-No . 5 . . . . . .Tabling . . . . . . Gallatin-No . 5 . . . . . .Tabling
. . . . . . . . . . . . . . W abash-Friendsville . . . . . . . Wabash-Friendsville Tabling . . . . . . . W abash-Friendsville Tabling
S t . Clair-No . 6 . . . . . . . . . . . . . . . . . . . . . . . . . St . Clair-No . 6 . . . . . .Tabling
S t . Clair-No . 6 . . . . . . Float-and-sink
Saline-No . 5 . . . . . . . . . . . . . . . . . . . . . . . . . . . Saline-No . 5 . . . . . . . .Tabling
Saline-No . 5 . . . . . . . . Retabling . . . .
Vermilion-No. 7 . . . . . . . . . . . . . . . . . . . . . . . . Vermilion-YTo . 7 . . . . .Tabling
. . . . Vermilion-.No . 7 . . . . . Retabling
Sangamon-No . 5 . . . . . . . . . . . . . . . . . . . . . . . Sangamon-No . 5 . . . . Tabling
. . . . Sangamon-No . 5 . . . . Retabling
Randolph-No . 6 . . . . . . . . . . . . . . . . . . . . . . . . Randolph-hTo . 6 . . . . . Tabling
. . . . Randolph-No . 6 . . . . . Retnbling
Christian-No . 6 . . . . . . . . . . . . . . . . . . . . . . . . Christian-No . 6 . . . . .Tabling
Christian-No . 6 . . . . . Retabling . . . .
Williamson-No . 6 . . . . . . . . . . . . . . . . Williamson-No . 6 . . .Tabling . . . . . . ~l'illiamson-No . 6 . . . Float-and-sink
Knox-No . 1 . . . . . . . . . . . . . . . . . . . . . Knox-No. 1 . . . . . . . .Tabling . . . . . . Knox-No . 1 . . . . . . . . Float-and-sink
Coal
EFFECT UPON PETROGRAPHIC port indicate a minor trend in that direction . COXSTITUTION Table 6 sets forth the percentages of vitrain
n ) . Vitraiii c o n t c ? , t . - ~ ~ i ~ ~ to its lolr and dry ash for 40 test coals. of which 14 ash content and loIT7 specific gravity. vitrain n-ere ram and 26 were cleaned coals . T h e is ordinarily considered to concentrate in ;I percentage change in vitrain and the per- washed coal . T h e data of the present re- centage of raw coal rejected in the cleaning
County and coal bed :I":,": :if iSsh
content (dry).
percent
Loss in cleaning. percent
Vitrain. percent
1 Vitrain.
vitrain. percentage
figure change
Percentage change in cleaned coal re- ferred to raw coal

EFFECT OF CLEANILVG 4 7
process are also listed. Petrographic data on the coal from L a Salle County ( 2 series) were not obtained.
I t will be observed that of the 16 tabled coals prepared at the expense of less than 25 percent reject, 12 showed an increase, threr showed a slight decrease, and one showed no change. T h e average change was an in- crease of 1.4 percentage figures or 15 per- cent (table 7 ) .
Less than 25 percent . . . . . 16 1 . 4 15
Exceeding 25 percent. . . . 10 3 .0 33
,411 coals. . . . . . 26 2 . 0 2 1
I n the ten coals cleaned by tabling, reta- bling, or float-and-sink methods, with per- centages of reject exceeding 25 percent, the increases in vitrain mere somewhat greater, averaging 3.0 percentage figures or 33 per- cent.
T h e average increase in vitrain for the entire 26 cleaned coals was 21 percent or 2.0 percentage figures (table 7 ) . A por- tion of this increase is attributable, of course, to the upward adjustment of the vitrain percentages of the raw coal due to clecrease in 1.5 sink material, considered for petrographic purposes to be non-coal. T h e effect of washing (exclusive of this effect) is given by a comparison of the percentage of vitrain on a 1.5-float basis, as reported in table 8. From this it d l be seen that of the 26 prepared coals for which data are available, 15 show an increase, 4 show a decrease, and 7 show no change, whei-e a change of 1.0 percentage figure is regarded as the minimum for significance. T h e aver- age change n7as an increase of 1.0 percentage figure on a 1.5-float basis.
Although tests on coals containing 70 percent or nlcre of vitrain were described both in the first report of this series and in
an earlier exploratory study,17 none of the coals tested during this phase of the general investigation was reported to approach that quantity of vitrain. All but one contained less than 20 percent, despite preparation procedures which were expected to increase vitrain markedly. T h e coal richest in vitrain was a cleaned 7/16-inch by 10-mesh coal from Franklin County, with a vitrain content of only 26.5 percent. T h e reason for the wide discrepancy between this figure and the 70-percent figure obtained in a sim- ilar coal in the earlier work is not known. Certain possible explanations are being investigated.
) Clrzrnin content. - Percentage of clarain (table 8 ) for the coals reported varied between 67 and 89 percent, on the 2s-fired basis, with a rather distinct trend in the direction of increased clarain con- tent in the cleaned coals. T h e average increase was 8.3 percentage iigures. Hotv- ever, this is primarily due to an adjustment in the percentage figure resulting from a decrease in 1.5-sink material rather than to a selective concentration of clarain. T h e percentages of clarain on a 1.5-float basis show no consistent trends associated with washing.
c ) . L) urain a ~ z d f usain co ~z~etlt.-Tlle percentages of both durain and fusain (table 8) were uniformly low, ranging from zero to 3.0 percent for the former, and from 0.1 to 1.4 percent for the latter, as-fired basis. I n each case the trend was toward reduction with washing, but changes were small in absolute amount.
a ) . H ~ n r obtclined pcr pound o/ conl- Of the 27 cleaned coals for which compa- rable data were obtained, 23 showed in- creases in heat obtained per pound and four showed no change (table 9 ) , where a differ- ence of 200 B.t.u. per pound was estab- lished as the minimum to be regarded as significant. T h e average increase was 810
li IbIcCabe. L. C., Ill inois coals-constitution impor tant 11-it11 reierence t o their u t i l iza t ion: hlcch. Eng. , vol. 60, N o . 3 , pp. 217-21, March 1938.

-
Con!
--P.-~- I -
1 A. . . . . . . . . . . . 26.5 27.7 66.8 69.7 1 . 2 1 . 3 1 . 3 1 . 3 4 . 2
3A. . . . . . . . . . . . 12.8 15.5 66.9 SO. 8 2.0 2 . 4 1 . 1 1 . 3 17 .2 3B . . . . . . . . . . . . . 16.3 17 .2 75.2 79 .5 1 . 9 2 .0 1 . 2 1 . 3 5 . 4 3C . . . . . . . . . . . . . 14 2 14.6 81.1 83.1 1 . 3 1 . 3 1 . 0 1 .0 2 . 4 5 A . . . . . . . . . . . . . 9 8 10 .4 80.5 86 .2 1 . 7 , 1 . 9 1 . 4 1 . 5 6 .6 5B. . . . . . . . . 12 3 12.7 81.3 84 .3 1 . 9 2 . 0 0 . 9 1 . 0 3 .6 5 B 1 . . . . . . . . . . 12 2 13.9 79.5 83.7 1 . 5 1 . 6 0 . 7 0 . 8 5 .0 6A. . . . . . . 10 8 12.8 71.2 81.4 1 . 6 1 . 9 0 . 7 0 . 9 15.7 hB . . . . . . . 1 2 4 12.9 82.5 85.7 0 . 9 1 . 0 0 . 4 0 . 4 3 .8 h l j i . . . . 12 4 14 .0 80.7 84.4 0 . 9 1 . 0 0 . 6 0 . 7 4 .4 7,4. . . . . . . . . . . 5 7 6 . 6 79.7 92.3 0 . 5 0 . 6 0 . 5 0 . 6 - 13.6 7B. . . . . . . . . . . 5 2 5 . 5 87.2 93.0 0 . 9 0 . 9 0 . 5 0 . 5 6 .2 7 C . . . . . . . . . . . . . 5 . 1 5 . 4 89.0 93.7 0 . 3 0 . 4 0 ..,6 0 . 6 5 .0
8A. . . . . . . . . . . . 1 5 1 . 9 75.3 95.7 1 . 7 2 .2 0 . 2 0 . 2 21.3 8 B . . . . . . . . . . . . . 1 . 7 1 . 9 84.7 96.8 1 . 1 1 . 2 0 . 1 0 . 1 12.5 8 C . . . . . . . . . . . . . 1 . 9 2 . 0 87.3 94.9 2 .7 2 .9 0 .1 0 . 1 8 . 0
9A . . . . . . . . . . . . 7 . 2 9 . 2 69.5 88.8 1 . 0 1 . 3 0 . 5 0 . 7 21.7 9 B . . . . . . . . . . . . . 6 .8 7 . 6 82.2 91 .2 0 . 7 0 . 8 0 . 4 0 . 5 9 . 9 9 C . . . . . . . . . . . . . 12.3 12 .4 86.6 86.9 0 . 4 0 . 4 0 . 3 0 . 3 0 . 3
. 10A.. . . . . . . . . . . . 14.5 15.5 74.4 79.8 3 . 0 3 . 2 1 . 4 1 .5 6 .7 1 0 8 . . . . . . . . . . . . . 17.7 15.3 76.7 79.5 1 .2 1 . 2 0 . 9 1 . 0 3 . 5
. . . . . . . . . . 1OC.. 17.9 18.1 78.9 79.6 1 . 3 1 . 4 0 . 9 0 . 9 1 . 0
11A. . . . . . . . . . . . 7 . 4 9 . 3 70.0 88.9 0 . 7 0 . 9 0 . 7 0 . 9 21.2 11%. . . . . . . . . . . 10.7 11.6 80.0 86.5 1 .1 1 . 1 0 .7 0 . 8 7 . 5 11C. . . . . . . . . . . . . 9 . 4 9 . 7 86.0 89 .0 0 . 5 0 .6 0 . 7 0 . 7 3 . 4
12A. . . . . . . . . . . . . 7 . 9 9 . 1 76.7 88.9 1 . 0 1 . 2 0 . 7 0 . S 13.7 12B. . . . . . . . . . . . . 8 . 2 S. 9 83.0 89.3 0 . 9 1 . 0 0 . 7 0 . 8 7 . 2 12C . . . . . . . . . . . . 10.2 10 .6 84.5 87.7 0 . 8 0 . 9 0 . 8 0 . 8 3 .7 1 2A1 . . . . . . . . . . 9 . 6 10.6 79.5 87.7 0 . 8 0 . 9 0 . 7 0 . 8 9 .4
13A . . . . . . . . . . . . 8.6 10 .4 72.3 57.5 1 .1 1 . 3 0 . 6 0 . 8 17 .4 13B. . . . . . . . . . . . 8 .6 9 . 5 80.1 88.2 1 . 6 1 . 8 0 . 4 0 . 5 9 . 3 13C. . . . . . . . . . . 11.4 11.9 81.9 85.9 1 . 4 1 . 5 0.7 0 . 7 4 . 6
VITRAIN
as-fired basis,
percent
1.5-float basis,
percent
-- -.
CLARATN
as-fired basis,
percent
-
DURAIN
1.5-float basis,
percent
FUSATN
as-fired 1.5-float basis, basis,
percent percent
3s-fi red basis,
percent
1.5-sink material, as-fired basis,
percent
1.5-float basis,
percent

Averages (exclusive of Nos. 1A and 124l):
Raw. . . . . . . . . . . . 9 . 2 10.6
. . . . . . . . . Cleaned 11.2 11.6

DOMESTIC S T O K E R COfiICUSTION
TABLE 9.-CHANGES I N COMBUSTION CHARACTERISTICS CAUSED BY CLEANING
Coal No .
Reject. percent
Averages . . . . . . . . . . . . . . .
Averages for all cleaned coal . . . . . . . . . . . . . . . . .
Heat Obtained.
M B.t.u./lb.
Reject Reject <25% >25%
Uniformity. percentage
figures
Reject Rejeci <25% >25%
Responsive- ness.
M B.t.u./hr.
Reject Rejeci <25% >25%
Pickup. M B.t.u./hr.
Reject Rejec <25% >25%
Overrun. M B.t.u./hr
Reject Reject <25% >25%
Not obtained .
II3.t.u. per pound on the as-fired basis (table 10) . Improvement due to washing is to be expected, inasmuch as washing increased the heating value and carbon and decreased the ash and sulfur. both types of change having been shown to exert a positive influ- ence on the heat obtained .
T h e decreasing advantage of cleaning with heavy reject losses is illustrated by com- paring the results obtained with smaller and
with larger reject . For the 17 coals cleaned at the expense of less than 25 percent reject. the average increase in heating value was 760 B.t.u. per pound and the average reject was 12.4 percent (table 1 0 ) . For the 10 coals cleaned at the expense of reject ex- ceeding 25 percent, the average increase in heating value u7as 890 B.t.u. per pound and the average reject was 46.2 percent . Hence, a further gain of only 130 B.t.u. per pound

TABLE 10.-SUMMARY O F CHANGES I N COMBUSTION CHARACTERISTICS CAUSED BY CLEANING - ---
Reject loss Number Average loss Heat Uniformity, Responsive- in e n i n g tests in cleaning, obtained, percentage ! pickup Overrun,
coal percent MB.t.u./lb. figures M$:s::,hr. MB.t.u./hr. MB.t.u./hr.
Less than 25% . . . . 17 12 .4 $0. 76 -4.0 +8 .9 $3.6 $9
More than 2 5 7 0 . . . . . 10 46.2 $0.89 -4 .6 $7.6" $3.8" $3"
All cleaned coals. . . . . 27 24.9 $0.81 -4 .2 + 8 . 4 +3 .7 $7
" Nine con~pai-isoris only.
was obtained a t the expense of a reject loss nearly four times as great.
T h e heat obtained per pound from the stoker combustion tests for a cleaned coal map be fairly closely computed from the heat obtained from the raw coal by correct- ing for the change in the amount of heat producing material per pound. Values so computed for the cleaned coals, using whole coal minus the moisture and ash as the equiv- alent of heat producing material, have an average difference from stoker test results of 130 B.t.u. per pound, a diffesence charge- able to sampling fluctuations.
b). Uniformity. - T h e cleaned coals tended to burn more uniformly than the raw coals, as measured by the average vari- ation from the mean burning rate of each coal (p. 17 ) . Of the 27 cleaned coals for which comparable data were obtained, 21 showed decreases in average variation and six showed no change (table 9 ) , where a change of at least two percentage figures was arbitrarily selected as the minimum to be considered. T h e average change was 1 .2 (table 10) and the maximum 12.6 percent- age figures, the latter representing a reduc- tion in variation of 61 percent referred to the raw coal.
Comparing coals cleaned at the expense of more than and of less than 25 percent reject, the average improvements in uni- formity were 1.6 and 4.0 percentage points respectively (table 1 0 ) ) a difference which is not regarded as significant.
c). Responsive~~ess.-The cleaned coals tended to be more responsive than the raw
coals, as measured by the average rate of heat release during the first 30 minutes of operation after a prolonged hold-fire period (p. I ? ) . O f the 26 cleaned coals for which comparable data were obtained, 22 showed increases in responsiveness and four showed no change (table 9 ) ) where a change of a t least 3000 B.t.u. per hour was arbi- trarily selected as the minimum to be con- sidered. T h e average change was 8400 B.t.u. per hour (table 10 ) and the maxi- mum 23,300 B.t.u. per hour. Although a trend toward greater responsiveness might be expected, due to the increased heating values of the cleaned coals, the observed increase was generally much more than could be attributed to this factor. Refer- ring to the raw coal in each case, the aver- age percentage increase in responsiveness was 57 percent, while the average increase in heating value, as-fired basis, was only 11 percent for the same 26 cleaned coals.
T h e coals cleaned a t the expense ot greater percentages of reject (table 10) had a slightly smaller average increase ir, responsiveness than coals cleaned at the expense of lesser percentages of reject. T h e respective figures are 7600 and 8900 I3.t.u. per hour.
d). Pickup.-The cleaned coals showed a pronounced trend toward increased pick- up over the corresponding raw coals, where pickup is based upon the average rate of heat release during the first five minutes of operation following an "off" period of 45 minutes (p. 1 7 ) . O f 26 cleaned coals for which comparable data were obtained, 18

5 2 DOMEST.TC S T O K E R C O M B U S T I O N
sho-tved an increase, one showed a decrease, and seven showed no change (table 9)) where a change of at least 2000 B.t.u. per hour was arbitrarily taken as the minimum to be considered. T h e average increase was 3700 B.t.u. per hour (table 1 0 ) . T h e aver- age improvements in pickup for the coals cleaned at the expense of greater and of' lesser percentages of reject were practically the same, the respective figures being 3800 and 3600 B.t.u. per hour (table 1 0 ) .
P). Ozw-run.-The cleaned coals tended toward increased overrun over the corre- sponding saw coals, where overrun is based upon the average rate of heat release dur- ing the first five minutes of an "off" period following an "on" period of 15 minutes (p. 1 7 ) . Of 26 cleaned coals for which com- parable data were obtained, 17 showed an increase, four showed a decrease, and five showed no change (table 9), where a change of at least 3000 I3.t.u. per hour was arbitrarily taken as the minimum to be con- sidered. T h e average increase was 7000 B.t.u. per hour (table 1 0 ) . T h e average change in overrun for the coals cleaned at the expense of greater percentages of reject was considerably less than that for those with smaller percentages of reject, the re- spective figures being 3000 and 9000 I3.t.u. per hour (table 1 0 ) . However, because of the wide variations in the individual coals, the difference is not regarded as significant.
f). O tlwr c?-iiteria.-Both hold-fire abil- ity and smoke-producing tendency were a t satisfactory levels for all coals, whether ram7 or cleaned.
C O N C L U S I O N S
1 ) . 'The heat obtained from the coals tested was very nearly directly proportional to the heating value and to percentage of u l t i~na te carbon, on as-fired basis.
2 ) . A slight increase in efficiency of about 1 ~ 2 percent for each 1000 13.t.u. per pound increase in heating value was obtained from the tests. However, exceptions to this general tendency were numerous.
3 ) . A general improvement in all per- formance characteristics measured, except
overrun, accompanied a reduction in the per- centage of ash.
4 ) . A n increase in vitrain was generally accompanied by more uniform combustion.
5 ) . None of the following chemical characteristics furnished useful correlations with any of the measured performance char- acteristics of the coal : British swelling in- dex ; Gieseler plasticity ; volatile ~ n a t t e r ; initial deformation, softening, or fluid tem- peratures of the ash.
6 ) . T h e southern Illinois coals tested are generally superior in most of the per- formance characteristics measured. Several of the cleaned coals and a few of the raw coals from the central and northern fields are also included in some of the superior groupings.
7 ) . By the use of the concentrating table so adjusted as to produce a commercially reasonable percentage of reject, not to ex- ceed 25 percent, a reduction of roughly one- third in mineral matter and in ash was obtained for most of the raw coals. Reduc- tion in total sulfur was generally somewhat less, whereas heating value was increased an average of 7.6 percent. T h e percentages of both vitrain and clarain were increased for most coals. Performance characteris- tics were generally i~nproved, excepting for overrun.
8 ) . Cleaning by tabling 01- float-and-sink procedures in such ways that percentages of reject in excess of 25 percent were produced resulted in further reductions in mineral matter, ash, and total sulfur, and slight further increases in heating value. For most coals, the percentages of vitrain and clarain were also slightly increased. Per- formance characteristics were not appreci- ably different from those of coals produced a t the expense of lower percentages of reject.
9 ) . Quality changes not caused directly by seduction in mineral matter, observed in most of the cleaned coals, were increases in the ratio of fixed carbon to volatile mat- ter, in oxygen (dry ash-free basis), and in vitrain ( 1.50-float basis) ; and a decrease in heating value (unit-coal basis). Each of these mas minor in magnitude.

APPENDIX
APPENDIX
COMPLETE DATA O N ALE TEST COALS
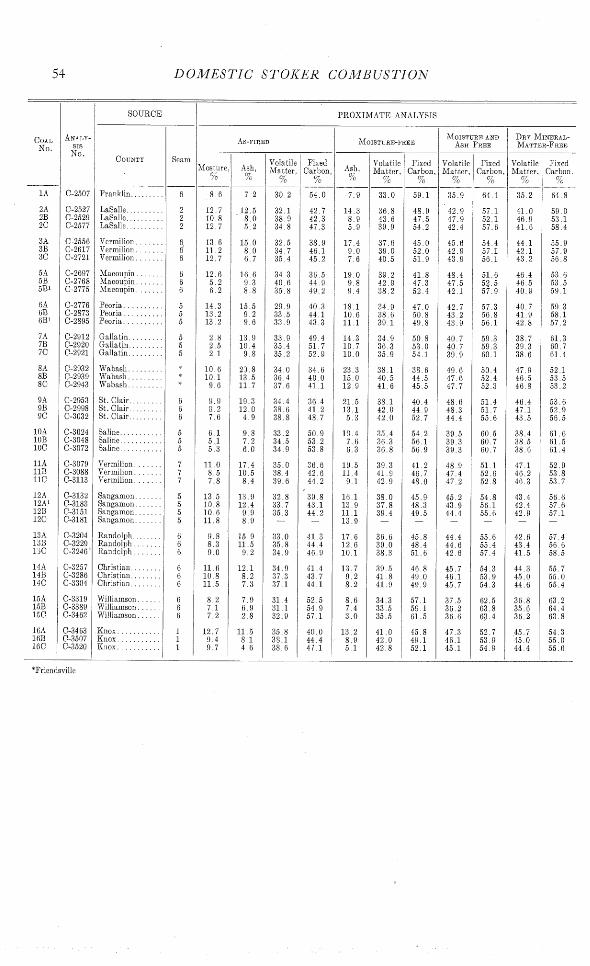
54 DOIMESTIC S T O K E R C O M B U S T I O N
"Fricndsvillc
SOURCE PROXIMATE ANALYSIS
AS-FIRED MoISTcRE-FREE I MOISTURE AND DRY M I N P ~ R ~ L - ASH FREE MATTER-FREE
C O T ~ X T Y Seam Volatile Fixed
. . . . . . . . . Franklin 6 8 . 6 7 2 30.2 54.0 7 . 9 33.0 59 .1 35.9 64.1 35.2 64.8
LaSalle . . . . . . . . . . 2 12.7 . 1 2 . 5 32 .1 42.7 14.3 36.8 48.9 42.9 57 .1 41.0 59.0 LaSalle . . . . . . . . . . 2 10.8 8 .0 38.9 42.3 8 . 9 43.6 47.5 47.9 52 .1 46.9 53.1 LaSalle . . . . . . . . . . 2 12 .7 5 . 2 34.8 47.3 5 . 9 39.9 54.2 42.4 57.6 41.6 58.4
. . . . . . . . Vermilion 6 13 6 15 .0 32.5 38.9 17 .4 ! 37.6 45.0 45.6 54.4 44 1 55.9
. . . . . . . Vermilion 6 1 1 . 2 8 . 0 34.7 46.1 9 . 0 39 0 52 .0 42.9 57.1 42.1 57.9 . . . . . Vermilion . . 6 1 2 . 7 6 . 7 35.4 45.2 7 . 6 40.5 51.9 43.9 56 .1 43.2 56.8
. . . . . . Maooupin 12 .6 I 16 .6 34.3 3 6 5 1 9 . 0 39.2 11 8 48.4 51 6 46.4 1 53.6 Macoupin . . . . . . . 5 . 2 9 . 3 40.6 44.9 9 . 8 42.9 47.3 1 47.5 52 .5 46.5 53.5
. . . . . . a p n 6 .2 8 . 8 3 5 8 49.2 9 . 4 3 8 . 1 52.4 4 2 1 57.9 40.9 5 9 . 1
Peoria . . . . . . . . . . 5 1 4 . 3 15.5 29.9 40 .3 1 8 . 1 24.y 47.0 42.7 57.3 40.7 59.3 Peoria . . . . . . . . . . 5 1 3 . 2 9 . 2 3 3 44 .1 10 6 28.6 50.8 43 2 56 .8 41.9 58 .1 Peoria . . . . . . . . . . 5 1 3 . 2 9 . 6 33.9 43.3 11.1 39 .1 49.8 43.9 56 .1 42.8 57 .2
Gallatin . . . . . . . . . 5 2 8 13 .9 33.9 49 .4 14 .3 34.9 50 8 40.7 59.3 38.7 61.3 Gallatin . . . . . . . . . 5 2 . 5 10 .4 35.4 51 .7 10 .7 36.3 53.0 40.7 . 59.3 39.3 60.7 Gallatin . . . . . . . . . 5 2 . 1 9 .8 35.2 52.9 1 0 . 0 35.9 54.1 39.9 60.1 38.6 61.4
Wabash . . . . . . . . . 10 .6 23.8 34.0 34.6 23.3 3 8 . 1 33.6 49.6 50.4 47.9 52 .1 :
Wabash . . . . . . . . . I 1 0 . 1 13 .5 36.4 40.0 1 5 . 0 40.5 44.5 47.6 52.4 46 .5 53.5 " Wabash . . . . . . . . . 9 . 6 11 7 37 .6 41.1 12.9 41.6 45.5 47.7 52 .3 46 .8 , 53.2 *
St . Clair . . . . . . . . . 6 9 .9 19.3 34.4 36.4 21.5 33 .1 40.4 48.6 51.4 46.4 53.6 . . . . . . . . St . Clair 6 3 2 12.0 28.6 41 .2 1 3 . 1 42.0 44 9 48.3 51.7 47.1 52.9
St . Clair . . . . . . . . . 6 7 .6 4 . 9 38.8 45.7 5 . 3 42.0 52 .7 44.4 55.6 43.5 56.5
Saline . . . . . . . . . . . 5 6 1 9 . 8 33.2 50.9 10.4 35 .4 54.2 39.5 60.5 38.4 61.6 Saljne . . . . . . . . . . . 5 5 . 1 7 . 2 34.5 5 3 . 2 7 .6 36.3 5 6 . 1 39.3 60.7 38.5 61.5 Saline . . . . . . . . . . . 5 5 . 3 6 . 0 34.9 53 .8 6 .3 36.8 56.9 39.3 60.7 38 6 61.4
. . . . . . . Vermilion 7 11 .0 17.4 35.0 26 .ti 1 9 . 5 39.3 41 2 48.9 51 1 47.1 52.9
. . . . . . . Vermilion 7 8 . 5 10 .5 38.4 42.6 11 .4 41.9 46.7 47.4 52.6 46.2 53.8
. . . . . . . Vermilion 7 7 .8 8 . 4 39.6 44 .2 9 . 1 42.9 48.0 47.2 52.8 46.3 53.7
Sangamon . . . . . . . 5 13 5 13 .0 32 .8 39.8 1f j . l 38 .0 45.9 45.2 54.8 43.4 56.6 . . . . . . . Sangamon 5 1 0 . 8 12.4 3 3 . 7 43.1 13 .9 37.8 48.3 43.9 56.1 42.4 57.6 . . . . . . . Sangamon 5 10 .6 9 . 9 35.3 44.2 11.1 39 .4 49.5 44.4 55.6 42.9 57 .1
Sangamon . . . . . . . 5 11 .8 8 .0 - - 13.9 - - - - - -
. . . . . . . llandolph 6 9 .8 15.9 33.0 41.3 17 .6 36.6 45.8 44.4 55.6 42.6 57.4
. . . . . . . Randolph 6 8 . 3 U . 5 35.8 44.4 1 2 . 6 39.0 48.4 44.6 55.4 43.4 56.6
. . . . . . . Randclph 6 9 . 0 9 . 2 34.9 46.9 10 .2 38.3 51.6 42 6 57.4 41.5 58.5
Christian . . . . . . . . 6 11 .6 1 2 . 1 34.9 41.4 13 .7 39.5 46.8 45.7 54.3 44.3 55.7 . . . . . . . Christian 1 0 . 8 8 . 2 37 .3 43.7 9 . 2 41.8 49.0 46.1 53.9 45.0 55.0
Christian . . . . . . . 11 .5 7 . 3 37.1 44.1 8 .2 41.9 49.9 45.7 54.3 44.6 55.4
. . . . . . Williamson 8 . 2 7.9 31.4 52 .5 8 . 6 34.3 57 .1 37.5 62.5 36.8 63.2
. . . . . . Williamson 7 1 6 . 9 31 .1 54.9 7 .4 33.5 59 .1 36.2 63.8 35.6 64.4
. . . . . . M1illiamson 7 . 2 2 . 8 32.9 5 7 . 1 3 . 0 35.5 61.5 36.6 63.4 36 .2 63.8
. . . . . . . . . . . Xnox 12 .7 11 .5 35.8 40.0 1 3 . 2 41.0 45.8 47.3 52.7 .4 5 .7 54.3
. . . . . . . . . . . 9.4 8 . 1 38.1 44.4 8 . 9 42.0 49.1 46.1 53.9 45.0 55.0 9 7 4 .6 38.6 I ' 5 1 42.8 52 .1 45.1 54 .9 44.4 55.6

APPENDIX
- -
COAL No.
PROXIMATE ANALYSIS
Initial leform.
OF
Soften- ing, O F
Mois- lure,
c- / C ----
9 . 4
1 5 1 1 2 1 l a 7
1 6 . 5 1 2 4 1 3 8
1 5 . 9 5 . 9 7 0
1 7 6 1 4 . 9 1 5 0
3 4 2 9 2 4
1 3 . 9 1 2 0 11 1
1 3 . 0 9 . 6 8 . 2
6 . 9 5 6 5 . 7
1 3 . 9 9 . 8 8 . 7
1 6 . 3 1 2 . 8 1 2 . 2 -
1 2 1 9 . 7
1 0 . 2
1.3.7 32 1 1 2 . 7
KO 7 . 7 7 . 5
1 4 . 9 1 0 . 5 1 0 . 4
iolatile Matter,
%
Fixed :arbon,
'%
AS- fired,
0-
.80
4 .77 3 .32 2 . 5 6
2 . 0 3 1 . 5 9 1 . 4 1
4 . 7 9 3 . 7 6 3 . 6 8
3 . 5 4 2 .93 2 .98
5 . 2 1 3 . 4 6 3 . 3 5
2 77 2 .12 2 .10
4 .97 3.C2 3 . 0 9
2 . 4 7 1 . 9 5 1 . 7 4
3 . 8 8 3 . 2 3 3 . 0 0
4 . 3 7 3 . 5 5 4 .01 3 . 6 7
3.60 2 .93 2 . 7 2
3 . 7 7 3 .48 3 .26
. 9 1
.85
.79
4 . 5 5 3 . 4 0 2 .65
Mois- ture frcc, %
.87
5 . 4 7 3 . 7 2 2 . 9 3
2 .42 1 - 7 9 1 . 6 1
5 . 4 7 3 .97 3 .02
4 - 1 3 3 .37 3 .44
5 .35 3 . 5 4 3 . 4 2
3 .09 2 .36 2.33
5 .52 3 . 6 2 3 .35
2 .63 2 .06 1 . 8 4
4.36 3 .53 3 . 2 5
5 .06 3 .98 4 .49 4 .16
4 . 0 8 3 . 2 0 2 .99
4 . 2 6 3 .OO 3 . 6 8
.99
.92
.86
5 . 2 1 3 .75 2.94
Mois- ure anr ish-free
70 --
9 5
6 . 3 8 4 . 0 9 3 . 1 2
2 . 9 2 1 . 9 7 1 . 7 5
6 . 7 6 4 . 4 0 4.:3
5 . 0 5 3 . 7 i 3 . 8 i
6 . 2 5 3 .97 3 . 8 0
4 . 0 3 2 . 7 8 2 . 6 7
7 .03 4 . 1 6 3 . 5 4
2.93 2 .23 1 . 9 7
5 . 4 2 3 . 9 8 3 .57
6 .02 4 . 6 3 5 . 0 5 4 . 6 3
4 . 9 6 3 . 6 6 3 . 3 2
4 . 0 4 4 . 3 0 4 . 0 1
1 . 0 9 .99 .88
6.00 4.12 3.10
Moisture free
B.t.u./lb.
13 ,306
12 ,309 13 ,035 1 3 , 3 4 1
1 1 , 7 4 8 12 ,886 13 ,163
11 ,387 12 ,594 12 ,618
11 ,776 12 ,763 12 ,552
12 ,649 13 ,408 13 ,505
10 ,794 11 ,953 12 ,290
ll,OF)O 1 2 , 3 6 2 13 ,556
13 ,136 13 ,573 13 ,725
11 ,574 12 ,925 13 ,290
11 ,970 12 ,236 12 ,659 1 2 , 5 5 1
11 ,644 12 ,360 1 2 , 7 5 3
1 2 , 1 5 2 12 ,816 12 ,978
13 ,296 13 ,407 14 ,113
12 ,501 13 ,123 13 ,693
Moisture and
Ash-free, B.t.u./lb.
Mineral-]
Dry, B.t.u./lb.
~tter-free
Moist, B.t.u./lb.
Fluid,
O F

D O M E S T I C S T O K E R C O M B U S T I O N
- -
ULTIMATE ANALYSIS
COAL No.
Iydroger cr /o
Carbon, %
Nitrogen %
Sulfur, %
Ash, %
Carbon, %
76.20
67.94 72.62 74.06
66.02 72.99 74.17
62.64 69.83 69.82
55 10.88 70.11
70.82 74.82 74.80
60.87 67.08 68.62
60.70 68.23 74.66
73.26 76.00 77.10
64-11 70.85 73 .00
66.57 67.09 68.90
63.90 68.38 70.61
66.32 70.00 71.28
75.08 76.10 79.05
67.76 71.66 75.16
Nitrogen, %
Sulfur, 0,7 / o
.87
5 .47 3.72 2.93
2.42 1 .79 1 . 6 1
5 .47 3 .97 3 .92
4 .13 3 .37 3.44
5 .35 3.54 3.42
3.00 2.36 2.33
5 .52 3 .62 3 .35
2.63 2.06 1 .84
4 .36 3 .53 3.25
5.06 3.98 4.49
4.08 3.20 2.99
4 .26 3.90 3.68
. 91)
.92 8 6
5 .21 3 .75 2.94
Ash, %

,4 P P E N D I S 57
-- -. -. .-
CLTIMATE ANALYSIS 1 COAL No.
Hydrogen Lio
-
5 .24
5 .54 5 .69 5 74
5.53 5 .66 5 54
5 .76 5 66 5 . 6 2
5.73 ij. '30 9.73
5 , 7 0 5 . 8 3 5 60
5 8 1 5 .7U 5 . ii (i
.i. 74 5 . 6 5 5 ($8
5 .50 .5 .53 5.. 57
5 . 9 1 5.83 5 .80
5.44 5 .54 5. G3
5 . 6 0 5.66 5 . 6 1
5.45 5.53 5 .59
5.27 5 .30 5.54
5.92 (i.06 5 .88
Carbon, 75
Nitrogen, %
Sulfur,
% -
.95
6 .38 4 .09 3 . 1 2
2 . 9 2 1. 97 1 . 7 5
6 .76 4 . 4 0 4.33
5 .05 3 .77 3.87
6.25 3 .97 3 .80
4.03 2 . 7 8 2 .67
7 . 0 3 4 .16 3 .54
2.93 2.23 1 . 9 7
5 .42 3.98 3.57
6 .02 4.63 5.05
4 .96 3.66 3.32
4.94 4 .30 4 .01
1 .09 9 9 .88
6 - 0 0 4.12 3.10
I Ignition loss, -i

D O M E S T I C S T O K E R C O M B I I S T I O N
VARIETIES OF SULFUR
COAL No.
Sulfate, %
Pyritic, %
Organic, %
Total, %
Sulfate, %
Pyritic, %
Organic, %
Total, %
Sulfate, %
Pyritic, %
Organic, %
Total, %

APPENDIX
Fusion, C
daximun Fluidity,
OC
* - - 4
-
L 408 3 70 377
408 392 388
415 421 415
375 387 390
404 407 406
417 422 425
400 -1 I-
t i- 'I- -
t t 410
-1.
T 425 420 -t
t
Solidifi- cation,
OC
vfaximur fluidit, y, divisions per min.
Chemical fusain,
moisture and ash
free, %
2 .4
2 .2 1 . 9 1 . 1
4 .2 2 .1 2 . 1
3 . 1 1 . 7 1 . 9
2 .7 1 . 9 2 .1
3 .9 - -
- - 3 . 8
2 . 7 - -
- - -
- - -
- - -
- - -
- - -
- - -
- - -
British swelling index
Mineral matter,
%
Carbon -
m i i . H
20.2
17 .1 17.6 1 8 . 1
18 .6 18.4 19 .1
16 6 18 .2 18.4
16 .8 16 .9 17 .6
15 .7 16.0 1 7 . 1
16.9 18 .1 18.4
16.5 18 .0 18.5
17.9 18.2 17.9
16 .1 16.9 16.7
17.8 18.3 17.8 -
18.0 18.2 18.6
19 .1 18.9 18 .7
20.1 18.2 19.2
16 .1 16.3 17.3
Fixed Carbon -
~ o ~ i t i l e matter
Fixed Carbon
X heating value
" Plasticity characteristics of this coal were tested by other mc~hocla, later concluded to be less useful than the Gieseler method. Data not reported. ; Test inconclusive; rabble arms stirred through powdered coal.
Recovery of washed
coal, referred to raw coal, %
- -
COAL No.
1 A
2 8 2B 2C
3A 3B 3C
5A 5B 5b1
6A 6B 6b1
7 8 7B 7C
8A 8B 8C
9 8 9B 9C
1 0A LOB LOC
11a LIB 11c
12a 12a1 12b 12c
138 13b 13C
14a 14b 14B
15a 15b 15c
16A 16b !6C

DOMESTIC S T O K E R COMBUSTION
OVERRUN
COAL No.
PICKUP UNIFORMITY RESPONSIVENESS
First 30 min.,
M B.t.u./hr.
First hr., M
B.t.u./hr.
114.9
57.8 68.1 -
92.6 77.4
103.2
63.5 87.6 97.3
68.0 -
113.2
34.2 70.0 81.7
78.1 65.8
101.0
32.8 102.5 86.4
80.2 90.5 86.6
23.0 56.4 74.9
62.9 65.5 75.9
83.5 106.2 112.6
61.5 94.1 97.5
100.8 -
99.5
59.8 77.4 89.2
Minimum - average
Average dariation,
% Ratiot Ratiot --
.28
.28
.29 -
.29
.30
.32
.25
.23
.26
.22
.25
.25
.24
.23
.26
.27
.27
.25
.23
.24
.22
.24
. 21
.21
.23
.23
. 21
.23
.22
.21
.22
.23
.24
.27
.22
.23
.24
.24
.26
.24
.26
.24
Ratiot
.24
.23
.24 -
.21
.21
.24
.13
.16
.16
.12
.15
.16
.12
.18
.18
.20
.20
.16
.16
.19
.15
.18
.16
. I 7
.18
.18
.18
.18
.15
.17
.16
.17
.19
.21
.17
.18
.17
.18
.23
.21
.20
.20
Ratiot
" Average of a11 operation rates except h o l d - h e . -1 R a t i o of ra te of heat release dur ing pickup or overrun period t o the average ra te with continuous stoker operation.

mm
a
ma
n
..
.
a 0
IO
t-mm
. .
. e
-d
h
*m
m
. . .
wc
m
mn
o
..
.
a
mm
m
ma
w
oa
+
mm
~a
am
m
o+
a
dm
o
md
m
mm
m
t-o
m
ao
t-
cm
m
mo
m
ha
m
L
mw
a
ma
m
ma
a +
a*
mm
m
oa
m
t-d
m
om
m
at-+
n
zz
j m
mm
a
oa
at-t-
mm
a
-i d
dd
,-id4
dd
+
++
d
dd
+
dd
d
d
dd
d
, +
d
d
dd
d
d+
+
Ad
N
nm
m
mh
m
om
m
mw
c
md
o
+a
m
aa
d
nm
m d
aa
n
mm
b
mt-
om
o
mm
o
dm
m
2
0222 222
zs
4 Z.n$
K'c'z
24: 4
22
2
22
22% zszl
2:s -+
+I;
cmmz u332
N
mo
o
N0
o
ma
a
am
m o
na
m
+o
m
dt-
ww
m
dn
m
ma
+
mm
d
do
m
om
h
mm
m
m*
a
am
a
am
m
mm
m
wm
m
*.a,?
q
a,?
n
?~
a
,*?
?
a.
1~
1
+a
+
7a
.n
ye??
mm
a
. .
..
.
,,
,
,,
.
..
.
..
. .
. .
..
3
am
m
m
m
e-m
m
oo
m
bnrn
lm
os
m
mm
m
mm
m
mm
d
Na
m
t-+O
c
mm
l
mm
a
t--
?
~t;?
m
.1-?
o
yy
??-,
??
? ?GO,?
??
?
~:C
CJ
?
oom
?c
ay
]
nn
n
mm
m
mm
m
t-a
m
d
..
.
..
.
..
.
..
.
d
d
dd
d
d
+
N
dn
t-
m
om
d
am
w
au
a
mm
m
mm
d
md
m
mm
d a
-N
a
t-o
a
m,+
d
t-m
m
t-m
n
sm
o
mo
a
ma
y
r~
m,?
nt-a
d
do
a
t--
dm
a
TO
O O
F?
o
ym
1 m
+m
+
om
o
ya
5
~0
,t; .
..
.
..
.
..
.
.
..
.
..
,
. . .
, .
. .
. m
a
bt
~
ma
t-
mt-I-
ma
a
mm
m
ma
w
ab
t~
t-
mm
w
mt-
w
wa
m
bt-
mr-t-
m
mm
at-1
.
m
mm
m
mm
o
t-m
o
t-w
m
mm
d
mm
o
bm
m
mm
d
wo
n
ma
m
aa
m o
at-
at-w
m
mm
m
a
ad
m
olm
+
ma
m
ba
?
yo
)
v+
m
yy
q
7-w
orno
?w?
1 m
mm
m
~d
q
m.?
m
mm
.
..
.
..
.
..
.
..
.
, .
..
.
. .
..
.
. .
. .
m
mh
m
am
m
mt-I-
ma
w
mt-m
,a
ha
at-1
. t-m
b
aw
l. m
mm
at-t-
at-t-
mm
m
t-mi?
a
oo
m
ma
d ar-a
1.mm
am
lm
mt-
m
ao
t-
=m
a
aa
m
mn
m
mm
a
mm
m
do
a
mv
e
o
on
m
ma
m b
aa
o
t:
~ y
mo
o
t-y
?"y
?
om
o
y?
o
yw
1 "y
o?
~91
oo
n
I;?? .
..
.
..
,
..
.
m
am
e-
mat.
mb
e-
ma
w
mm
m
om
m
at-t-
t-m
b
aw
b
-m
a
at-t-
mo
b
mm
m
at-+
a
ma
m
ma
w
mm
a
mm
m
mm
m
mo
d
dm
*
mm
m
nm
t-
a+
m
mm
m
ms
m
da
m q
aa
GO,
o~
m,
"
~7
"a
.?
ma
t-
mm
o
ma
"
=o
a
am
o o
ad
m
-u?
y I
mo
m
on
m
m+
m
+m
e-
..
.
,.
,
,.
.
,.
.
,,
,
..
.
,.
.
..
.
.,
.
..
t-
a-a
t. a
wt-
mt-t-
L9
aa
t.m
m
,ma
w
Qh
t. h
e-m
m
at-
La
wm
a
t-t-
wa
r-
t-mm
*c
3be-
-
4
1.a
~
mo
m
t-d
m
om
m
-d
o
ao
a
t-b
m
mo
w
ad
m
t-d
m
am
-a
d
ao
m
mm
t-
~a
a
m
?o
y
fly"
ym
m
..
ab
t-
..
. ?
no
yy
y
oy
w
am
4 +
+a
f
l~
r~
j
oq
m,
mo
m
mm
t-
t-mt-
..
.
..
.
t<
at-m
m
at-
at-r-
>m
ay
, m
mm
m
om
a
t-t-
t-m
m
wa
r-
ma
r-
ot-h
&
&<
<
&m
G
<<

DOMESTIC S T O K E R COMBUSTION
COAL No.
Id
211 2B 2C
3.4 3B 3 C
5A 5B 5B1
6 8 6B 6B1
7 8 7B 7C
8A 813 8C
9 d 9B 9C
10A 10B 10C
llii 1113 l l C
12A 12A1 12H
1311 13B 13C
148 14B 14C
15A 15B 15C
16A 16B 1BC
RESULTS OBTAINED WITH CONTINUOUS STOKER OPERrlTION
HEAT BALANCE Stack
Tempera- ture,
O F STACK Loss