correlation in european union labor-market policies
TRANSCRIPT

Correlation in European Union Labor-Market Policies: Interdependence or Common Stimuli?*
Robert J. Franzese, Jr.
Associate Professor of Political Science The University of Michigan, Ann Arbor
Jude C. Hays Assistant Professor of Political Science
University of Illinois at Urbana-Champaign [email protected]
August 21, 2007
Prepared for the 103rd APSA Annual Meeting, August 30th -September 2nd, Chicago, IL.
European Consortium for Political Research, Panel 2: The Politics of European Labor Markets.
ABSTRACT: Even casual observation reveals obvious spatial patterns (i.e., correlation, not necessarily always positive) in labor-market outcomes, institutions, and policies across Europe, and in the European Union particularly. Labor-market policies entail significant cross-border spillovers, both positive and negative, political and economic, so the strategic interdependence of member countries might explain these patterns. However, European countries also faced common or at least very similar exogenous-external conditions, as well as common or very similar internal trends, which would also naturally suggest spatial patterns in the domestic responses thereto, even without any significant interdependence. Likewise, membership in the European Union itself presents both a series of common external stimuli and a set of strategic interdependencies in common and individual-country labor-market-relevant actions. We have discussed elsewhere the severe empirical-methodological challenges in distinguishing these possible sources of spatial correlation; this paper extends and applies those analyses in an attempt to disentangle the effects of general interdependence, correlated external and internal stimuli, and EU membership in shaping labor-market policies across Europe in recent years. To the extent that there is significant strategic policy interdependence among member states, greater EU-level coordination may be justified. *This research was supported in part by NSF grant #0318045. We thank Jakob de Haan, Thomas Pluemper, Neal Beck, Jake Bowers, Xiaobo Lu, Ken Scheve, and the participants at the Groningen workshop on “Partisan Politics, Political Autonomy and Policy Harmonization across Europe”, 19-20 May 2005 for helpful comments on an earlier and related paper. We would also like to thank Chris Achen, James Alt, Kenichi Ariga, Kerwin Charles, Bryce Corrigan, Thomas Cusack, David Darmofal, John Dinardo, Zachary Elkins, John Freeman, Fabrizio Gilardi, Kristian Gleditsch, Mark Hallerberg, John Jackson, Aya Kachi, Jonathan Katz, Mark Kayser, Achim Kemmerling, Gary King, Hasan Kirmanoglu, James Kuklinski, Tse-Min Lin, Walter Mebane, Covadonga Meseguer, Michael Peress, Dennis Quinn, Megan Reif, Frances Rosenbluth, Phil Schrodt, Beth Simmons, Duane Swank, Wendy Tam-Cho, Craig Volden, Michael Ward, and Gregory J. Wawro for comments on our broader spatial-econometric agenda from which this paper is a product.

1
In March, 2000, at the Lisbon Summit, the EU committed to becoming “the most
competitive and dynamic knowledge-based economy in the world by 2010,” (European Council
2000: 1). Active labor market (ALM) policies are a critical part of the plan designed to achieve this
objective, the European Employment Strategy (EES). ALM programs are supposed to improve job
seekers’ prospects of finding employment and increase the productivity and earning potential of
workers. They include spending on public employment, job search assistance, labor market training,
and other policies intended to promote employment among the unemployed. While ALM policies—
particularly training and education programs—seem almost inherently necessary to create the kind of
workforce and economy EU leaders envisage, coordinating these policies through an EES system
that relies heavily on the principle of subsidiarity, may be problematic. Subsidiarity in the EES
implies that member states create their own programs and implement them on a mostly voluntary
basis, yet individualistic voluntarism leaves policy susceptible to positive-externality induced
underinvestment. Has this theoretically possible negative interdependence of European ALM
policies actually arisen empirically? If so, are these spillovers and the detrimental interdependence
they induce sufficiently sizable to warrant concern and redress?
Building on earlier work (Franzese and Hays 2006), we argue and present evidence that
ALM policies do indeed entail significant externalities that spill across national boundaries and that,
apparently, these spillovers are sufficiently sizable to generate appreciable political and economic
incentives for European governments to free ride off the efforts of their neighbors. That is, we
provide empirical evidence that the national best-response functions for ALM spending are
statistically significantly and mostly substantively appreciably downward-sloping: an increase in
expenditures in one country decreases equilibrium expenditures in most of its neighbors. This leads
us to conclude that current levels of ALM expenditures may indeed be too low and that, apparently,

2
the limited (although increasing) coordination of the EES framework is insufficient to internalize
positive ALM policy externalities noticeably. Stronger enforcement procedures would seem to be
necessary if the European Union is to achieve its EES objectives.
The paper structures these explorations as follows. In the first section, we briefly review the
history of the EES starting with the Luxembourg Jobs Summit. We cover the generic theory of
strategic policy complementarity and substitutability (positive and negative externalities,
respectively) in section two. Section three contains our empirical analysis, and sections four and five
discuss the results and offer our conclusions, respectively.
Historical Overview of the European Employment Strategy
The key elements of the European Employment Strategy (EES), adopted by EU governments
in November 1997 at the Luxembourg Jobs Summit, are contained within the Amsterdam Treaty’s
Title on Employment (see Goetschy, 1999). This section of the treaty, among other things, makes
unemployment a common European concern, places job creation alongside macroeconomic stability
as one of the EU’s primary objectives, and creates an EU-level institutional mechanism for the
oversight and evaluation of member states’ employment policies. Since the Luxembourg Summit,
the objectives and coordination procedures of the EES have been refined at several European
Councils.
For our interests in subsidiarity and policy coordination, some of the most important changes
came at the Berlin Council in 1999 where EU member states decided to use Structural Funds to
finance EES programs aimed at developing human resources.1 Regulation (EC) No 1260/1999, in
1 The management of EU Structural Funds is guided by the principle of 'concentration' which holds
that assistance should be focused on achieving a few core objectives. At Berlin the number of

3
addition to incorporating this change and setting new objectives, created a system of ex-ante, mid-
term, and ex-post program evaluations combined with performance rewards and punishments (i.e.
performance reserve-allocations). As a result of this new regulation, the EU budget and employment
promotion processes became entwined under “Objective 3” (i.e. human resource development)
funding. It also established a limited system of centralized enforcement with respect to employment
policy coordination.
The (annual) coordination cycle of the EES follows four steps. Each year the European
Council adopts a set of guidelines—developed by the European Commission—for EU member
states’ employment policies. These guidelines are intended to be instrumental in achieving full
employment, improved quality and productivity at work, and labor market inclusiveness. National
governments respond by writing action plans to describe how these guidelines are being (or will be)
implemented domestically. The Commission and Council then review these plans and publish a joint
economic report. If necessary, the Council makes country-specific recommendations.
In 2004, for example, the Council promulgated the following guidelines for national
employment policies: they should increase the adaptability of workers to changing conditions, attract
more people into the labor market, and promote investment in human capital. Community-wide and
country-specific recommendations that stressed the importance of labor-market training-programs
were issued (European Commission, 2004). In fact, the Council encouraged each of the original
fifteen members to increase participation in such programs.
Since 1988 the Council has set a multi-annual EU budget in its ‘Fiscal Perspectives’ report.
The previous budget agreement (the 'Agenda 2000' plan), which covered spending from 2000 to
objectives was cut from seven to three: 1) support for the poorest regions, 2) conversion of regions
facing structural difficulties, and 3) human resource development (European Commission, 1999).

4
2006, was the first governed by Regulation (EC) No 1260/1999. Midterm reviews, including reviews
of programs financed under “Objective 3”, were conducted by member states in 2003 and submitted
to the Commission by 31 December. On the basis of these reviews, the Commission allocated the
performance reserves on 23 March 2004.
Despite the ostensible strengthening of the EES framework over time, employment policies
(ALM programs in particular) remain primarily the prerogative of national governments. The
Council sets guidelines, but member countries choose their own response and, with the minor
exceptions of country performance reports and performance reserve allocations, no enforcement
mechanism is in place should they fail to follow through. Thus, the situation post-Luxembourg is not
fundamentally different from the one existing prior to the 1997 Council meeting.
How have EU member governments fared in the provision of ALM policies? The evidence is
somewhat mixed. From a longer historical perspective, the trends look positive. On average,
aggregate active labor market expenditures have increased among the EU member states, and, at the
same time, the standardized variance (i.e., the coefficient of variation) in spending across countries
has decreased (see Figure 1). In 1980, the average total spending on ALM programs among EU
member states was a little over $54 (2000, PPP$) per capita. By 2003, average spending was almost
$253, an increase of roughly 370%.2 The coefficient of variation (standard deviation) in spending on
ALM programs dropped (rose) from .80 (43.5) to .47 (120.1) over the same period. One might see a
“race-to-the-top” in these trends and be tempted to infer that EU employment policy coordination
has been relatively successful. On the other hand, outside of Scandinavia, the consensus seems to be
that EU member governments are behind in designing and implementing policies to upgrade the
2 In the shorter, post-Lisbon period (1997-2003), average annual per capita ALM spending increased
$30.44 (2000, PPP$).

5
skills of their workers.3 According to this view, despite the trends in Figure 1, spending could and
should be much higher. If ALM program spending among EU member states is, in fact, suboptimal,
strategic interdependence in the making of active labor market policies could explain why. Two
kinds of interactions in particular, race-to-the-bottom dynamics and policy free-riding, would induce
suboptimal expenditures on employment policies.
<Figure 1 About Here>
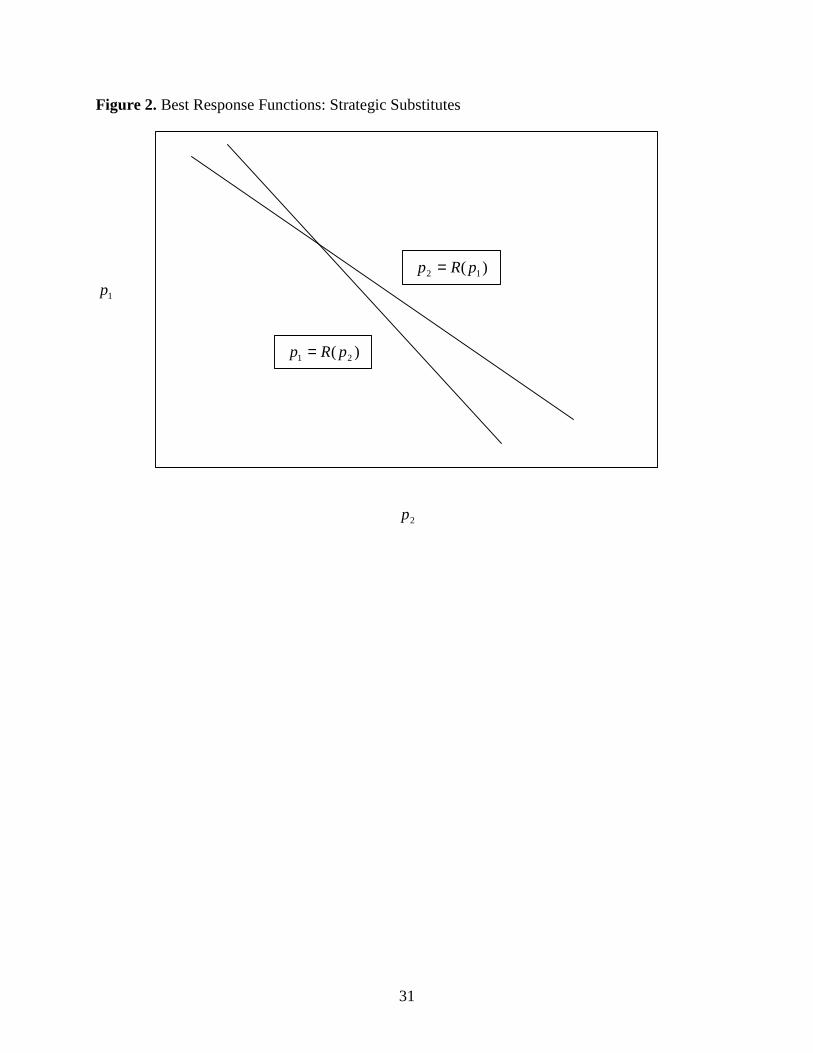
Race-to-the-Bottom Dynamics and Policy Free Riding
In theory, race-to-the-bottom (RTB) dynamics occur when policies are strategic complements
across jurisdictions—that is, when policy changes adopted in one jurisdiction create incentives for
other jurisdictions to adopt similar changes. The RTB argument has been applied inter alia to capital
taxation, environment regulations, and labor standards. Cuts in taxes and the elimination of
regulations and standards in one jurisdiction increase the costs to others of maintaining high taxes,
regulations, and standards causing the effected jurisdictions to follow suit in their own policies. By
contrast, free riding occurs when policies are strategic substitutes—that is, when policy changes in
one jurisdiction create incentives for governments in others to adopt change in the opposite direction.
For example, an increase in defense expenditures in one country might lower the marginal security
benefit from defense spending in its military allies, creating an incentive for them to free ride (see
3 The 2004 Joint Economic Report asked six of the original fifteen members to strengthen their ALM
policies. Five of the six later received a C-grade for their response (partial and limited). One received
a B (in progress). The Council asked every member country to improve its investment in human
capital in one or more ways. The modal response of member governments to these recommendations
was “partial and limited” (European Commission, 2005). See Murray and Wanlin (2005) for another
disappointing report card.

6
Redoano, 2003).
More formally, consider a two-country world (i,j), each with homogenous populations and
domestic welfare that, due to externalities, are a function of government policy in both countries:
),(;),( ijjj
jiii ppWWppWW ≡≡ (1).
When the government in country i chooses its policy, pi, to maximize its own social welfare,
this affects the optimal policy-choice in country j, and vice versa. We can express such strategic
interdependence between countries i and j with a pair of best-response functions, giving optimal
policies of i, pi*, as a function of the policy chosen in j, and vice versa:
i j
* *p pArgmax ( , ) ( ) ; Argmax ( , ) ( )i j
i i j j j j i ip W p p R p p W p p R p≡ ≡ ≡ ≡ (2).
Explicitly, country i’s optimum policy is obtained by maximizing ),( jii ppW with respect to pi,
taking pj as given (fixed); i.e. setting the first derivative of the welfare function with respect to pi
equal to zero and solving for pi* as a function of pj (and then verifying that the second derivative is
negative). Equation (2) expresses the result as the best-response function )(*ji pRp = . The slopes of
these best-response functions, the signs of which determine whether RTB or free-riding dynamics
will occur, depend on the following ratios of second cross-partial derivatives:
jjijiiji ppj
ppj
i
jpp
ipp
i
j
i WWp
pWW
p
p/;/
**
−=∂∂
−=∂∂
(3).
If the government is welfare maximizing, the second order condition guarantees the denominator in
(3) is negative. Therefore, the slopes will depend directly on the signs of the second cross-partial
derivatives (i.e. the numerator). If 0, >ji
jpipW , i.e. if policies are strategic complements, we see from
(3) that policy reaction-functions will slope upward. If 0, <ji
jpipW , policies are strategic substitutes,
and the reaction functions slope downward. If the second cross-partial derivative is zero, strategic

7
interdependence does not materialize and the best-response functions are flat (Brueckner, 2003).
Notice that positive externalities induce strategic-substitute policy-interdependence and
negative externalities induce strategic-complement policy-interdependence (and lack of externalities
yields policy-independence). In the national-defense example discussed above, spending in one
country induces free riding in others due to the positive security externalities (among allies) and
diminishing returns of military expenditures. If ALM expenditures create positive employment
externalities and exhibit diminishing returns, the same problem could arise in this context. In other
words, if reducing unemployment requires increasing amounts of spending—$1000 per worker to
reduce unemployment from 6% to 5%, $2000 to reduce from 5% to 4%, $4000 to reduce from 4% to
3%, etc.—and ALM spending in one country, i, helps reduce unemployment in another, j, an
increase in expenditures in country i will reduce the marginal benefit to j’s of its (marginal increment
of) spending, inducing lower equilibrium spending in j. Figure 1 illustrates this situation graphically.
This strategic context also creates a first-mover disadvantage—the country that spends first will bear
a larger portion of the cost of reducing unemployment—and the potential for war-of-attrition
dynamics that would push the equilibrium ALM spending of both countries is even lower.
<Figure 2 About Here>
Do cross-border positive employment externalities of ALM policies exist among European
countries; and if so are they sufficient to induce this kind of fiscal free-riding in ALM policy? On
balance, the evidence suggests that ALM policies may have increased employment in Europe and
other OECD countries (see, e.g., Martin, 2000; Martin and Grubb 2001; and European Commission,
2005). There seems to be a consensus, based on the micro-level research, that ALM program
participants benefit from an increased probability of employment. Using the language of this
literature, the average treatment effect among the treated is a positive increase in the probability of

8
employment (Heckman et al. 1999). The problem with the micro-level research is that it tells us
nothing about the effects of ALM programs on non-participants, and so it is impossible to say
anything based on these studies about the net employment consequences. Net effects can only be
discerned from aggregate data, and there is much less agreement among scholars about the macro-
level employment effects of ALM programs implemented on a large scale. Several studies find
sizeable displacement rates, particularly for subsidized employment programs (e.g., Forslund and
Krueger 1997, Calmfors et al., 2001, Dahlberg and Forslund 2005), while others find much more
positive direct employment effects (Kraft 1998, Estevao 2003). Perhaps the strongest evidence in
favor of ALM policies is found in the mediating influence these programs have on negative
macroeconomic shocks. In their seminal paper on the interaction of shocks and institutions in
determining employment outcomes, Blanchard and Wolfers (2000) estimate that a negative 1%
employment shock at the mean sample level of ALM program expenditures reduces employment by
just 0.2% at the maximum level of ALM spending.
That ALM spending would exhibit diminishing returns also seems reasonable. For instance,
if labor-market training-programs increase employment by raising workers’ marginal productivity,
then, in any given macroeconomic conditions, some workers will just miss being employed because
their marginal productivity was just below a threshold beyond which firms find hiring them
profitable and some whose productivity was far below this threshold. In this case, a little spending
might get the first group of workers hired, but much more spending per worker would be required to
get members of the less-productive second group employed. If unemployed low- and high-
productivity workers are spatially concentrated in regions that span national boundaries, this could
create incentives for fiscal free riding. Below, we describe several other mechanisms by which such
cross-border spillovers may arise.

9
A large literature examines the regional patterns of unemployment in Europe (see, e.g.,
Elhorst, 2003; Puga, 2002; and Overman and Puga, 2002). This research shows that, in many cases,
differences in employment between bordering regions are much smaller, even if the regions lie in
different countries, than the differences between more distant regions within countries. In other
words, geographic proximity is more important than nationality in understanding spatial patterns of
unemployment in Europe. Labor-market performance in Languedoc-Roussillion in southern France
on the Mediterranean, for example, is likely to resemble much more closely that in Cataluna in
northeastern Spain than that in Paris. Similarly, employment outcomes in Nord-Pas-de-Calais on the
French border with Belgium correlate highly with those in Region Wallonne across the border than
with employment patterns in the center of France.4
Consider the implications of (effective) French ALM spending for Belgium, for example.
Effective French ALM policies enhance Belgian workers’ abilities to obtain training in France, and
return, more employable, to work in Belgium. Effective French ALM policies also enhance Belgian
workers’ abilities to find work in France. Effective French ALM policies also enhance the pool of
workers (quantity, quality, and diversity) available to employers along the Belgian border, thereby
luring employers to both sides of the border. Finally, effective French ALM policies stimulate the
French economy, which, through trade, has positive effects on Belgium’s economy. These and other
agglomeration effects all yield positive externalities of (effective) French ALM policies to Belgian
4 Overman and Puga (2002) attribute the growing importance of spatial proximity to changes in the
demand for labor. They identify, test, and find empirical support for three sources of demand change
over the period 1986-1996: the regional concentration of skilled and unskilled labor, the spatial
clustering of industries, and what they call agglomeration effects (all of which are illustrated in the
examples given next in the text).

10
workers (and citizens more generally). Of course, Belgians cannot provide political support to
French policymakers in response to these spillover effects, so French policymakers ignore these
spillover benefits in determining French ALM spending. Accordingly, ALM spending by national
policymakers will exhibit negative interdependence, reflecting the positive externalities.
Given what we know about spatial patterns of unemployment in Europe and the employment
effects of ALM policies, fiscal free-riding seems plausible. In the next section, we examine the
empirical record to gauge the evidence of its existence and magnitude.
Empirical Analysis
Our sample of data includes observations on both EU and non-EU countries so that we can
separate the effects of spatial interdependence that are unique to EU member states from more
general types of interdependence. More specifically, our sample includes annual data from 1980-
2003 for 21 OECD countries among which there 14 EU member states: Australia, Austria, Belgium,
Canada, Denmark, Germany, Greece, Finland, France, Ireland, Italy, Japan, Netherlands, New
Zealand, Norway, Portugal, Spain, Sweden, Switzerland, the United Kingdom, and United States.5
The OECD ALM program expenditures dataset is subdivided into five categories: public
employment services and administration, labor market training, youth measures, subsidized
employment, and measures for the disabled. Figure 3 plots the over time variation in average
5 On the temporal dimension, our sample is mostly limited to the period before the Amsterdam
Treaty entered into force. This should not affect our theoretical conclusions qualitatively since the
lack of EES enforcement leaves the pre-Amsterdam strategic incentives largely unchanged.
Empirically, the post-Amsterdam behavior of EU member states with respect to employment policy
seems to have changed little.

11
spending on each program type by OECD countries. Subsidized employment and labor market
training are the two largest components of ALM spending over the entire sample period, accounting
for 26.9% and 26.7% total expenditures.
Table 1, which gives the programmatic breakdown in expenditures for each country in the
sample, reveals significant variation across countries. The big spenders on ALM programs per
capita were Sweden ($360.88) and Denmark ($287.20) while the United States ($43.72) and Greece
($34.97) spent the least. This variation is not random. Spatial clustering is evident in the Table 1
data. For example, all four Scandinavian countries spent significantly more than the OECD average.
The difference between Portugal and Spain in per capita ALM program spending over the twenty-
three year period was less than $1 (2000, PPP$). Both Australia and New Zealand and Canada and
the United States spent well below the OECD average. What explains the spatial patterns we
observe? Are they caused by strategic policy interdependence, common shocks, or spatially
correlated domestic factors?
<Figures 3 and Table 1 About Here>
To answer these questions, we estimate a linear multiparametric spatio-temporal autoregressive
(STAR) lag model.6 The model, in matrix notation, is
1
R
r rr
ρ φ=
= + + + ∑y W y Vy Xβ ε , (4)
where y , the dependent variable, active labor market expenditures, is an 1NT × vector of cross
6 Case et al. (1993), Brueckner and Saavedra (2001), Fredriksson and Millimet (2002), Redoano
(2003), and Allers and Elhorst (2005) among others have used spatial lag models to evaluate
hypotheses about strategic policy interdependence, but none of these models have multiple spatial
lags.

12
sections stacked by periods (i.e., the N first-period observations, then the N second-period ones, and
so on to the N in the last period, T).7 The parameterrρ is the rth spatial autoregressive coefficient
and rW is an ×NT NT block-diagonal spatial-weighting matrix. We can express anyW matrix as the
Kronecker product of a ×T T identity matrix and an ×N N weights matrix ( )T N⊗I W . Each rW
contains a unique combination of elements rijw that reflect a particular type of interdependence (e.g.,
geographic proximity, common membership in groups, and economic interdependence). rW y is thus
the rth spatial lag; i.e., for each observation ity , rW y gives a weighted sum of thejty , with
weights, rijw , given by the relative connectivity from j to i. Notice howWy thus directly and
straightforwardly reflects the dependence of each unit i’s policy dependence on unit j’s policy,
exactly as in the formal model and theoretical arguments reviewed above. The parameterφ is the
temporal autoregressive coefficient, andV is an ×NT NT matrix with ones on the minor diagonal, i.e.,
at coordinates ( +1,1)N , ( +2,2)N , …,( , - )NT NT N , and zeros elsewhere, so Vy is the (first-order)
temporal lag. The matrix X contains ×NT k observations onk independent variables, andβ is
a ×1k vector of coefficients on them. The final term in equation (4), ε , is an ×1NT vector of
disturbances, assumed to be independent and identically distributed.8
The conditional likelihood for the multiparametric STAR lag model is a straightforward
extension of this spatial-lag likelihood. Written in ( ×1N ) vector notation, the STAR-model
7 With some work, nonrectangular panels and/or missing data are manageable, and in our empirical
analysis we have missing data, but we assume rectangularity and completeness for simplicity of
exposition.
8 Alternative distributions of ε are possible but add complication without illumination.

13
conditional-likelihood is mostly conveniently separable into parts, as seen here:
( ) ( ) ( )1 2 1
2, ,..., 2
1 2
1 1Log 1 log 2 1 log
2 2t t
R T
r r t tr t
f N T Tπσ ρσ−
= =
′= − − + − − −∑ ∑y y y y I W ε ε (5)
where 11
R
t t r r N t N t tr
ρ φ −=
= − − −∑ε y W y I y X β .
The unconditional (exact) likelihood function, the one that retains the first time-period observations
as non-predetermined, is more complicated (Elhorst 2001, 2003, 2005; Franzese and Hays 2007b).
When T is small, the first observation contributes greatly to the overall likelihood, and the
unconditional likelihood should be used to estimate the model. In our case, however, T is large
enough that the more compact conditional likelihood is acceptable for estimation purposes.
In our regression analysis we focus on aggregate ALM program expenditures and the two
largest components of ALM spending, labor market-training (LMT) expenditures and subsidized
employment (SEMP) expenditures. Our dependent variables are measured per capita (2000, PPP$),
and the key independent variables, which allow us to evaluate the nature of the spatial
interdependence among the countries in our sample, are the spatial lags of ALM spending.
We calculated our spatial lags,Wy , using three different weights matrices (R = 3). The first
is a standardized binary contiguity-weights matrix which begins by coding wij=1 for countries i and j
that share a border and wij=0 for countries that do not border. As exceptions, we code France,
Belgium, and the Netherlands as contiguous with Britain, Denmark as contiguous with Sweden, and
New Zealand as contiguous with Australia. The second W is a common EU membership weights
matrix where wij=1 if both country i and country j are members of the EU and wij=0 otherwise. The
final W has weights that reflect the historical trade (imports plus exports) shares between sample
countries. More specifically, wij is the historical value (1980-2003) of trade between countries i and j
as a proportion of the total value of country i’s trade over the same period. For estimation, we row-

14
standardize (as commonly done in spatial-econometrics research) all three matrices by dividing each
cell in a row by that row’s sum.
We also include a number of domestic-level variables in the analysis. We control for a
country’s macroeconomic performance by adding real GDP growth and the unemployment rate to
the regressions. As their economies grow, governments might provide more public goods and
services (Wagner’s Law of Increasing State Activity). If so, we would expect a positive coefficient
estimate for the GDP per capita variable. Some alternative theories, such as Baumol’s Disease,
which refers to an argued decreasing relative productivity in service sectors rendering financing of
public services increasingly difficult as economies develop and shift toward heavier service-sector
employment, would suggest a negative relationship between GDP per capita and ALM expenditures.
We would expect a positive coefficient on the unemployment rate, if rising unemployment increases
the political demand for ALM expenditures.
Next we control for a number of structural features of a country’s economy related to its
labor markets and exposure to external shocks. The labor-market variables are union density and
Iversen and Cusak’s (2000) measure of deindustrialization. Because higher union density increases
the influence of organized labor, we would expect it to go hand in hand with greater ALM spending.
With respect to deindustrialization, Iversen and Cusak (2000) argued that workers cross significant
skill barriers when they move out of manufacturing and agricultural and into services. Thus, we
would expect deindustrialization to induce higher levels of LMT expenditures also. Many scholars
have argued that exposure to the international economy leads to increased government spending,
especially on programs that help workers adjust to external shocks (e.g. Ruggie, 1982; Cameron,
1978; Katzenstein, 1985; Rodrik, 1997; Hays et al., 2005). Others argue that increased international
exposure produces competitive pressures that lead to smaller governments. We use trade openness

15
as our measures of exposure.
We also consider several political variables: the working age population as a percentage of
the total population, the percentage of cabinet seats held by left and Christian Democratic parties, the
percentage of general-election votes won by left-libertarian parties. Working-age voters are the
natural constituency for ALM programs. For retired voters, the benefits are indirect at best.
Therefore, the political pressure for ALM programs should be higher when the percentage of
working age individuals is high. Social Democratic, Christian Democratic, and Left-Libertarian
parties have all been identified as key supporters of active social-policies, albeit of different precise
natures (see, e.g., Garrett, 1998; Swank, 2002; and Kitschelt, 1994). It is also possible that the more
traditional left- right ideological dimension is important when it comes to ALM programs.
Table 2 presents our results. We estimate two regressions, one spatial and the other non-
spatial, for each of the three dependent variables in our dataset. The first and second columns of
results provide estimates for our non-spatial and spatial ALM models respectively, which include
time-lags of the dependent variable plus country and year dummies to account for temporal
dependence and unit- and period-heterogeneity. The period dummies provide a flexible way to
model common OECD-wide trends and/or common (random) shocks in ALM expenditures. As we
show elsewhere (Franzese and Hays, 2005), by far the most important issue methodologically in
obtaining good estimates of the strength of interdependence, i.e. of ρ, is to model well any
alternative mechanisms by which the outcomes might correlate spatially, such as common
exogenous shocks (e.g., global economic conditions) or correlated domestic factors. From that
perspective, the country and year dummies serve as a powerfully conservative way to account for
almost any sort of outside shock or spatially correlated domestic factor. Failure to account for such
alternative mechanisms will bias spatial-lag coefficient estimates, usually in a positive direction

16
(Franzese and Hays, 2007a).
<Table 2 About Here>
The first two columns of estimates suggest very different explanations for the spatio-
temporal patterns in total ALM program expenditures. The non-spatial model points to domestic
labor market structures, union density and deindustrialization, while the spatial model indicates that
domestic macroeconomic conditions, exposure to international trade, and percentage of the
population between ages 15-64 are important factors. From the two likelihoods it is clear that there
is significant spatial interdependence in the ALM data, and, consequently, the coefficient estimates
in the non-spatial model almost certainly suffer from omitted variable bias (Franzese and Hays
2007a). Therefore, we focus on the spatial regression. In this model, the estimated GDP coefficient is
positive and statistically significant, favoring Wagner over Baumol. The unemployment-rate
coefficient is also positively signed and statistically significant supporting the demand-spurring more
than the cost-constraint argument. The coefficient on trade is negative, which supports the argument
that competitive pressures lead to less government spending. The coefficient on working age
population is positive as expected. With respect to the interdependence variables, each of the
coefficients on the spatial lags is statistically significant. The coefficient on the borders lag is
positive while the coefficients on the EU membership and trade shares lags are negative. While it is
difficult to interpret the nature of the interdependence implied by these estimates without calculating
the multipliers, which we do below, these results seem to support the externalities argument—
economies that are highly interdependent through trade exhibit more negative spatial
interdependence in ALM program expenditures—and the negative coefficient on the EU spatial lag
is likely inconsistent with the idea that the EU is facilitating employment policy coordination.
The coefficients on the domestic-level variables in the LMT and SEMP models are much

17
more stable across the spatial and non-spatial specifications than is the case for the ALM model,
although the variables that matter most for LMT expenditures are very different from the variables
that matter for SEMP expenditures. This suggests that it may be inappropriate to use the highly
aggregated total ALM program expenditures as a dependent variable. The causal relationships may
differ too much across subcategories for the pooled analysis to be very illuminating. With respect to
LMT expenditures the demand spurring arguments about high unemployment and working age
populations seem to be true. Partisan politics seems to matter in the more traditional way. Left
governments spend more on LMT expenditures while more centrist or center-right Christian
Democratic governments spend less. As for SEMP spending, union density is the single most
important domestic factor. Higher union density leads to higher levels of subsidized employment.
With respect to the interdependence variables, in both the LMT and SEMP models, all three
coefficients on the spatial lags are statistically significant and have the same signs as previously.
We are satisfied, then, that EU members’ ALM policymaking exhibits statistically significant
interdependence, but what do these statistically significant results tell us of the sign and substantive
magnitude of this interdependence, i.e. of the effects individual EU countries’ ALM policies have on
their neighbors’ policymakers? To answer this question we need to calculate the so-called spatial
multiplier, which is given in the following reduced form of equation (4):
( )( ) ( )
11
1 1
1
1 1
...
...
R
r rr
R
R
ρ φ
ρ ρ φ
ρ ρ φ
−=
−
−−
= + + + ⇒
− − = + + ⇒
= − − + +
∑t t t t t
t N 1 R t t t
t N 1 R t t t
y W y y X β ε
y I W W y X β ε
y I W W y X β ε
(6)
The spatial multiplier, ( ) 1
1 ... Rρ ρ −− −N 1 RI W W , captures the feedback from, say, Belgium on France
and other countries, and back from France and those others on Belgium, and so on recursively. The

18
immediate time-t effect on the vector of policy-outcomes in the 21 countries, ty , including that
recursive feedback, can now be calculated with this spatial multiplier by considering certain counter-
factual shocks to the rest of the right-hand side of (6). To find the long-run, steady-state, equilibrium
(cumulative) level of y , simply set 1t−y equal to ty in (6) and solve. This gives the steady-state
effect, assuming stationarity and that the exogenous RHS terms, X and ε , remain permanently fixed
to their counterfactual levels:
( ) ( )( )
1
1 ... Rρ ρ φ −= − − − +
= × +t N 1 R N t t
t t
y I W W I X β ε
S X β ε (7)
To get standard-error estimates for these steady-state estimates, we use the delta method. I.e., give a
first-order Taylor-series linear-approximation to nonlinear (7) around the estimated parameter-values
and determine the asymptotic variance of that linear approximation. To do this, begin by denoting
the ith column of S as is and its estimate asˆis . The steady-state spatial effects of a one-unit increase
in explanatory variable k in country i are then i kβs giving delta-method standard-errors of
( )�
( )�ˆ ˆˆ ˆˆ ˆˆ
ˆ ˆi k i k
i k
β ββ′ ∂ ∂=
∂ ∂
s sV s V θ
θ θ (8),
where 1ˆ ˆ ˆˆ ˆR kρ ρ φ β = θ ⋯ ,
1
ˆ ˆ ˆ ˆˆ ˆ ˆ ˆˆ
ˆ ˆˆ ˆi k i k i k i k
iR
β β β βρ ρ φ
∂ ∂ ∂ ∂≡ ∂ ∂∂ ∂
s s s ss
θ⋯ , and the vectors
ˆˆ
ˆi k
r
βρ
∂ ∂
s and
ˆˆˆ
i kβφ
∂
∂
s are the ith columns of ˆ ˆ ˆ
k rβ SW S and ˆ ˆ ˆkβ SS respectively.
Table 3 illustrates calculations of (7) and (8) for the EU member countries in our sample
using the column (4) estimates from Table 2. The first number in each cell is the steady-steady effect
of a one percent increase in the column country’s unemployment rate on the row country’s logged

19
LMT expenditures ( )100× . The number in parentheses is the standard error of this spatial-effect. So,
for example, a permanent 1% increase in the German unemployment rate increases German per
capita spending on LMT by an estimate 23.8% in the long run, and a permanent increase in
Germany’s unemployment rate reduces per capita LMT expenditures in Austria by 5.2% and
increases LMT expenditures in Denmark by 1.4%. Again, this effect assumes a permanent increase
in the German unemployment rate and would take many years to materialize. In this sense, the
calculation likely represents an upper bound for our spatial effects.
<Table 3 About Here>
Discussion
In Franzese and Hays (2006), we estimated single lag STAR models using binary contiguity
(borders) weights matrices and a sample of European countries over the period 1987-1998. Our
estimated coefficients on the spatial lags in those regressions were negatively signed and statistically
significant, and we argued that these results suggested that there was ALM policy free-riding in the
European Union. At first glance, those results might seem inconsistent with the empirical analysis in
this paper, given that our estimated coefficients on the borders spatial lags in Table 2 are positive.
However, in the earlier research, territorial contiguity was a proxy, a particularly good one given our
sample of European countries, for the kinds of economic interdependence—labor and capital
mobility and trade in goods and services—that generate ALM policy externalities. In this paper, we
measure this interdependence much more directly and accurately using trade-shares and EU-
weighted spatial lags, and with our new expanded sample, territorial contiguity is not as good a
proxy for the types of economic interdependence that matter for policy externalities. The positive
relationship between ALM expenditures and the borders spatial lag probably reflect regional shocks,

20
but it could be explained by policy learning or emulation (Simmons and Elkins 2004). In the end,
our conclusion is largely the same as before: there is evidence of policy free-riding, and, as a result,
the EU is likely underspending on ALM programs.
Our empirical model is not equipped to estimate the extent to which EU member states are
misallocating resources when it comes to ALM program expenditures, but we believe a
counterfactual comparison can highlight the potential significance of the problem. Based on the
estimates from column (4), in a counterfactual autarkic world, the long-run response to a permanent
1% increase in the unemployment rate is to increase per capita LMT expenditures by about 22.6%
.072.226 22.6%
1 .681 = ≈ −
. This is the effect of unemployment net of any spatial feedback. Looking
at the numbers along the diagonal of Table 3, which are calculated using the spatio-temporal
multiplier in (7), one sees that the country responses, under interdependence, to the same shock are
not much higher than that.
Take Germany, for example. Under interdependence, the German response to a permanent
1% increase in the unemployment rate is to increase per capita LMT expenditures by about 23.8%,
which is only 1.2% higher than what we estimate Germany would do under autarky. In response to
Germany’s increase in LMT expenditures, however, most of the EU member states decrease theirs
(see the 6th column, marked DEU, of Table 3), which is quite different from what they would do in
isolation (i.e., they would not respond). For example, France, Italy, Spain, and the UK decrease their
expenditures by 1.7%, 4.5%, 2.8%, and 2.3% respectively. A small increase in German LMT
expenditures seems to generate large benefits around the EU, which, in turn, leads other member
states to cut their expenditures. From an EU perspective, the optimal German response to a 1%
increase in Germany’s unemployment rate would be to increase LMT expenditures to the point
where the marginal benefit to all EU member states is equal to the marginal cost. Without making
21
very strong assumptions about the optimality of policymaking at the country-level, we cannot say
anything definite about the aggregate welfare consequences of these responses, but it seems unlikely
that the modest increase in German LMT expenditures under interdependence compared with
autarky, especially given the relatively large reactions of the other EU member states, equates the
marginal costs of these programs with the marginal benefit to the EU as a whole.
What are the policy implications? We believe the EU may have to play a stronger role
enforcing the coordination of its member states’ employment policies if it is to achieve its EES
objectives. Offering precise and definitive recommendations about what should be done is beyond
this paper’s scope, but the results here do demand one option receive serious consideration:
strengthening the performance-review system. What most clearly distinguishes EU efforts to
coordinate on policies affecting macroeconomic stability (The Stability and Growth Pact) from those
affecting employment (The European Employment Strategy) is that the latter efforts lack an effective
enforcement mechanism to encourage governments to implement the policies they commit to in their
National Action Plans. We suspect this contributes to the under-provision of ALM policies.
Under the Performance Reserve System adopted in Regulation (EC) No 1260/1999, 4% of
the structural funds allocated to member states are kept in reserve. The Commission monitors
program implementation and performance and then disperses the reserves after a successful midterm
review. While the enforcement-mechanism design seems reasonable, its magnitude, the proportion
of funds, is far too small to alter significantly the behavior of member states. One obvious reform to
strengthen the system would be to increase both the percentages held in reserve and the number of
installments paid to recipient countries, say, annual reviews and payments. This would make the
mechanism more similar to the IMF system of credit tranches based on conditionality and phasing.
Additionally, the allocation of performance reserves, which are currently project specific,

22
could be linked to general compliance with EES commitments. In other words, the Commission
could withhold reserve funds from successful EES/Structural Fund projects for the failure of other
EES programs or commitments that are not financed with EU Structural Funds. These changes might
be politically unpopular and would undoubtedly make Commission evaluations and decisions much
more controversial than they are today, but they would increase the incentives countries have to
follow through on their action plans.
Conclusion
A large and growing literature on regional patterns of unemployment in Europe suggests
labor-market outcomes are spatially clustered across the continent without tremendous regard for
national borders. The unemployment rate in one region affects unemployment rates in its (regional)
neighbors, and whether these regions are separated by national boundaries does not matter much for
the degree to which these labor-market experiences are shared. Moreover, on balance, the available
evidence shows that ALM programs are effective at lowering unemployment or, at least, reducing
the employment effects of negative macroeconomic shocks. In theory, these conditions create
strategic incentives for national governments to free ride on the ALM policies of neighboring states.
We provide evidence via estimation of multiparametric STAR lag models that such strategic
interaction among European governments in ALM policymaking does in fact exist, that these
national best-response functions are mostly downward sloping, and that these effects are of
substantively appreciable magnitude. Thus, we conclude that the EU should play a more active role
in enforcing the policy commitments governments make throughout the EES process.

23
References
Allers, Maarten and J. Paul Elhorst (2005) ‘Tax Mimicking and Yardstick Competition among Local
Governments in the Netherlands’, Mimeo, University of Groningen.
Blanchard, Olivier and Justin Wolfers (2000) ‘The Role of Shocks and Institutions in the Rise of Euopean
Unemployment: The Aggregate Evidience’, The Economic Journal 110(March):C1-C33.
Brueckner, Jan K (2003) ‘Strategic Interaction Among Governments: An Overview of Empirical Studies’,
International Regional Science Review 26(2):175-188.
Brueckner, Jan K and Luz A. Saavedra (2001) ‘Do Local Governments Engage in Strategic Property-Tax
Competition?’, National Tax Journal 54(2):203-229.
Calmfors, Lars, Anders Forslund, and Maria Hemstrom (2001) ‘Does Active Labour Market Policy Work?
Lessons from the Swedish Experiences’, Swedish Economic Policy Review 8(2):61-124.
Cameron, David R (1978) ‘The Expansion of the Public Economy: A Comparative Analysis’, American
Political Science Review 72(4):1243-61.
Case, Anne C., Harvey S. Rosen, and James R. Hines, Jr. (1993) ‘Budget Spillovers and Fiscal Policy
Interdependence: Evidence from the States’, Journal of Public Economics 52(3):285-307.
Elhorst, J. Paul (2003) ‘The Mystery of Regional Unemployment Differentials: Theoretical and Empirical
Explanations’, Journal of Economic Surveys 17(5):709-748.
Estevao, Marcello (2003) ‘Do Active Labor Market Policies Increase Employment?’, IMF Working Paper
WP/03/234.
European Commission (1999) Agenda 2000: Strengthening and Widening the Union.
European Commission (2005) Employment in Europe2005.
European Commission Communication (2004) 239 final of 7 April 2004 (Strengthening the
Implementation of the European Employment Strategy).

24
European Commission Communication (2005) 13 final of 27 January 2005 (Draft Joint Employment
Report 2004/2005 and Addendum to the Joint Economic Report, Annex 2).
European Council (2000) ‘Presidency Conclusions—Lisbon European Council’, 23 and 24 March 2000
Brussels: Council of Ministers.
Forslund, Anders and Alan Krueger (1997) ‘An Evaluation of the Swedish Active Labor Market Policy:
New and Received Wisdom’, In The Welfare State in Transition: Reforming the Swedish Model,
Richard Freeman, R. Topel, and B Swedenborg, Eds. Chicago: University of Chicago.
Dahlberg, Matz and Anders Forslund (2005) ‘Direct Displacement Effects of Labour Markt Programmes’,
Scandinavian Journal of Economics, 107(3): 475-494.
Franzese, Robert J. and Jude C. Hays (2004) ‘Empirical Modeling Strategies for Spatial Interdependence’,
Paper presented at the 2004 summer meeting of the Society for Political Methodology, Palo Alto,
CA.
Franzese, Robert J. and Jude C. Hays (2005) ‘Empirical Models of Capital Taxation in Open Economies:
Specifying and Estimating the Spatial Interdependence in Tax Policy’, Mimeo, University of
Michigan.
Franzese, Robert J. and Jude C. Hays (2006) ‘Strategic Interaction among EU Governments in Active-
Labor-Market Policymaking: Subsidiarity and Policy Coordination under the European Employment
Strategy’, European Union Politics 7(2):167-189.
Franzese, Robert J. and Jude C. Hays (2007a) ‘Spatial-Econometric Models of Cross-Sectional
Interdependence in Political-Science Panel and TSCS Data’, Political Analysis 15(2):140-164.
Franzese, Robert J. and Jude C. Hays (2007b) ‘Empirical Models of Spatial Interdependence’ In Oxford
Handbook of Political Methodology, Eds. Janet Box-Steffensmeier, Henry Brady, and David Collier,
Oxford U.K.: Oxford University Press, Forthcoming

25
.Fredriksson, Per G. and Daniel L. Millimet (2002) ‘Strategic Interaction and the Determination of
Environmental Policy across U.S. States’, Journal of Urban Economics 51(1):101-122.
Garrett, Geoffrey (1998) Partisan Politics in the Global Economy. New York: Cambridge University
Press.
Goetschy, Janine (1999) ‘The European Employment Strategy: Genesis and Development’, European
Journal of Industrial Relations 5(2):117-137.
Hays, Jude C., Sean Ehrlich, and Clint Peinhardt (2005) ‘Government Spending and Public Support for
Trade in the OECD: An Empirical Test of the Embedded Liberalism Thesis’, International
Organization 59(2):473-494.
Heckman, James J., Robert J. LaLonde, and Jeffrey A. Smith (1999) ‘The Economics and Econometrics of
Active Labor Market Programs’, In Handbook of Labor Economics, Orley Ashenfelter and David
Card, Eds. Volume 3a. Amsterdam: Elsevier, pp. 1865-2097.
Iversen, Torben and Thomas R. Cusack (2000) ‘The Causes of Welfare State Expansion:
Deindustrialization or Globalization?’, World Politics 52(3):313-49.
Katzenstein, Peter (1985) Small States in World Markets Ithaca, N.Y.: Cornell University Press.
Kitschelt, Herbert (1994) The Transformation of European Social Democracy. Cambridge, U.K.:
Cambridge University Press.
Kraft, Kornelius (1998) ‘An Evaluation of Active and Passive Labour Market Policy’, Applied Economics
30:783-793.
Martin, John P. (2000) ‘What Works Among Active Labour Market Policies: Evidence from OECD
Countries’ Experiences’, OECD Economic Studies No. 30, 2000(1):79-113.
Martin, John P. and David Grubb (2001) ‘What works and for whom: a review of OECD countries'
experiences with active labour market policies’, Working Paper Series 2001:14, IFAU - Institute for

26
Labour Market Policy Evaluation.
Murray, Alasdair and Aurore Wanlin (2005) The Lisbon Scorecard V: Can Europe Compete? London:
Centre for European Reform.
Overman, Henry G. and Diego Puga (2002) ‘Regional Unemployment Clusters: Nearness Matters Within
and Across Europe’s Borders’, Economic Policy 17(34):117-147.
Puga, Diego (2002) ‘European Regional Policies in Light of Recent Location Theories’, Journal of
Economic Geography 2(4):373-406.
Redoano, Michela (2003) ‘Fiscal Interactions Among European Countries’, Warwick Economic Research
Papers No. 680.
Rodrik, Dani (1997) Has Globalization Gone Too Far? Washington D.C.: Institute for International
Economics.
Ruggie, John G. (1982) ‘International Regimes, Transactions, and Change: Embedded Liberalism in the
Postwar Economic Order’, International Organization 36(2):195-231.
Simmons, Beth and Zachary Elkins (2004) ‘The Globalization of Liberalization: Policy Diffusion in the
International Political Economy’, American Political Science Review 98(1): 171-190.
Swank, Duane (2002) Global Capital, Political Institutions, and Policy Change in Developed Welfare
States Cambridge, U.K.: Cambridge University Press.

27
Table 1. Disaggregated Active Labor Market Expenditures per Capita (2000 PPP$) AUS AUT BEL CAN DEN FIN FRA DEU GRE IRE ITA
28.85 33.06 41.35 38.44 20.48 22.47 25.98 46.59 10.77 32.36 0 Employment service and administration
(37.54) (29.68) (15.69) (39.1) (7.13) (10.46) (14.39) (19.12) (30.8) (15.19) (0)
10.05 41.58 43.99 46.18 117.32 67 49.74 71.61 7.84 43.26 7.14 Labour market training
(13.08) (37.32) (16.69) (46.98) (40.85) (31.19) (27.56) (29.38) (22.41) (20.3) (8.02)
8.36 4.63 3.41 3.92 24.57 17.65 42.47 12.83 6.8 37.11 31.47 Youth measures
(10.88) (4.16) (1.29) (3.99) (8.55) (8.22) (23.53) (5.26) (19.45) (17.42) (35.38)
21.51 18.62 146.9 7.07 69.26 87.79 49.75 65.7 8.28 87.35 24.68 Subsidized employment
(27.98) (16.71) (55.73) (7.19) (24.12) (40.87) (27.56) (26.96) (23.67) (41) (27.74)
8.08 13.51 27.94 2.7 55.58 19.12 12.56 46.95 1.28 13 0 Employment measures for disabled
(10.52) (12.13) (10.6) (2.75) (19.35) (8.9) (6.96) (19.27) (3.67) (6.1) (0)
Total ALMP 76.87 111.41 263.61 98.3 287.2 214.81 180.51 243.72 34.97 213.08 88.97 JPN NTH NWZ NOR PRT ESP SWE CHE GBR USA OECD
47.65 24.48 17.46 33.36 14.93 12.97 44.98 20.81 36.4 12.1 26.76 Employment service and administration
(68.44) (11.58) (15.85) (15.91) (17.04) (14.69) (12.46) (22.57) (37.71) (27.67) (17.34)
7.48 48.72 39.62 36.28 26.47 19.23 101.86 17.01 15.5 13.48 41.12 Labour market training
(10.75) (23.04) (35.96) (17.31) (30.22) (21.78) (28.22) (18.45) (16.06) (30.82) (26.65)
0.24 11.01 10.44 11.53 26.48 7.73 14.32 0.55 28.34 6.68 14.84 Youth measures
(0.34) (5.21) (9.48) (5.5) (30.23) (8.76) (3.97) (0.59) (29.36) (15.29) (9.61)
12.73 16.69 34.73 23.87 14.77 45.7 91.75 20.05 11.68 2.24 41.44 Subsidized employment
(18.28) (7.89) (31.53) (11.39) (16.86) (51.77) (25.42) (21.74) (12.1) (5.13) (26.86)
1.53 110.57 7.91 104.59 4.95 2.64 107.98 33.79 4.61 9.22 29.29 Employment measures for disabled
(2.19) (52.28) (7.18) (49.89) (5.65) (2.99) (29.92) (36.65) (4.77) (21.09) (18.98)
Total ALMP 69.62 211.47 110.15 209.63 87.59 88.28 360.88 92.22 96.52 43.72 154.3 Note: Parentheses contain spending as a percentage of total spending on active labor market programs.

28
Table 2. Active Labor Market Program Expenditures in OECD Countries, 1981-2002 Total ALM LMT SEMP (1) (2) (3) (4) (5) (6) Temporal Lag 0.796***
(.030) 0.717***
(.027) 0.701***
(.030) 0.681***
(.030) 0.799***
(.035) 0.753***
(.031) Year 0.016**
(.008) 0.114***
(.007) 0.025** (.011)
0.043*** (.011)
-.020 (.013)
0.056*** (.011)
Real GDP Growth Rate 0.008 (.01)
0.021** (.009)
0.008 (.014)
0.012 (.014)
0.007 (.018)
0.018 (.016)
Standardized Unem. Rate -0.000 (.011)
0.022** (.010)
0.071*** (.015)
0.072*** (.014)
-0.001 (.019)
-0.001 (.010)
Union Density 0.007* (.004)
0.005 (.003)
0.000 (.005)
0.006 (.005)
0.014** (.007)
0.019*** (.006)
Deindustrialization 0.019* (.011)
0.006 (.010)
-0.019 (.015)
-0.024* (.014)
0.028 (.011)
0.016 (.017)
Trade Openness -0.001 (.003)
-0.007*** (.003)
-0.005 (.004)
-0.006* (.004)
-0.001 (.005)
-0.007 (.004)
Working Age Population 0.003 (.022)
0.080*** (.020)
0.174*** (.032)
0.190*** (.028)
0.014 (.022)
0.049 (.033)
Left Cabinet Seats -0.000 (.001)
0.000 (.000)
0.002** (.001)
0.002** (.001)
0.001 (.001)
0.001 (.001)
Christian Dem. Cabinet Seats -0.000 (.001)
-0.003 (.001)
-0.007*** (.002)
-0.007*** (.002)
0.000 (.002)
-0.002 (.002)
Left Libertarian Vote -0.009 (.009)
-0.000 (.008)
0.002 (.012)
0.007 (.011)
0.010 (.015)
0.012 (.013)
Spatial Weights: Borders 0.010***
(.000) 0.0132***
(.008) 0.179***
(.008) European Union Membership -0.03***
(.000) -0.046***
(.001) -0.075***
(.014) Trade Shares -0.743***
(.000) -0.223***
(.022) -0.908***
(.003) σ 0.281 0.249
(0.009) 0.391 0.352
(0.013) 0.486 0.425
(0.016) Log-Likelihood -28.612 -10.016 -150.396 -139.986 -230.819 -210.954 Note: The dependent variable is expenditures per capita measured in constant 2000 PPP$. All regressions include fixed period and unit effects; those coefficient estimates suppressed to conserve space. All the spatial weights matrices are row-standardized. The parentheses contain standard errors. *** Significant at the .01 level; ** Significant at the .05 level; * Significant at the .10 level.

29
Table 3. Steady-State Spatio-Temporal Effects of Unemployment on Logged Training Expenditures per Capita in the EU (2000, PPP$)
AUT BEL DEN FIN FRA DEU GRE IRE ITA NTH PRT ESP SWE GBR AUT 23.1
(4.46) -0.8 (0.2)
-0.6 (0.18)
-0.3 (0.07)
-0.7 (0.13)
-5.2 (1.56)
-0.2 (0.05)
-0.2 (0.05)
2 (0.57)
-0.7 (0.18)
-0.3 (0.07)
-0.5 (0.12)
-0.5 (0.11)
-0.6 (0.15)
BEL -0.5 (0.12)
23 (4.42)
-0.4 (0.09)
-0.4 (0.09)
-0.7 (0.31)
-0.7 (0.27)
-0.2 (0.06)
-0.4 (0.1)
-0.9 (0.22)
-0.4 (0.3)
-0.4 (0.11)
-0.7 (0.18)
-0.6 (0.15)
0.8 (0.27)
DEN -0.4 (0.11)
-0.8 (0.2)
23.2 (4.47)
-0.7 (0.19)
-1.2 (0.28)
1.4 (0.5)
-0.3 (0.06)
-0.5 (0.12)
-0.8 (0.2)
-1.2 (0.29)
-0.4 (0.09)
-0.5 (0.13)
2.3 (0.64)
-2 (0.52)
FIN -0.6 (0.15)
-1 (0.28)
-0.9 (0.26)
24.1 (4.71)
-1.3 (0.33)
-3.1 (0.79)
-0.2 (0.05)
-0.4 (0.12)
-0.6 (0.12)
-1.3 (0.34)
-0.3 (0.08)
-0.5 (0.11)
2.9 (0.89)
-2.7 (0.76)
FRA -0.4 (0.09)
-0.3 (0.17)
-0.4 (0.11)
-0.4 (0.09)
23.2 (4.47)
-1.7 (0.46)
-0.3 (0.06)
-0.4 (0.08)
-0.4 (0.19)
-1.1 (0.26)
-0.4 (0.09)
0.1 (0.12)
-0.5 (0.13)
-0.1 (0.11)
DEU 0.3 (0.15)
0.1 (0.12)
1.1 (0.29)
-0.5 (0.14)
-1 (0.31)
23.8 (4.65)
-0.3 (0.07)
-0.5 (0.12)
-1.6 (0.41)
-0.2 (0.16)
-0.5 (0.13)
-0.9 (0.23)
-0.6 (0.14)
-1.6 (0.41)
GRE -0.8 (0.22)
-0.7 (0.16)
-0.5 (0.11)
-0.2 (0.05)
-1.5 (0.36)
-2.7 (0.62)
22.9 (4.41)
-0.2 (0.04)
-2.9 (0.74)
-1 (0.23)
-0.2 (0.04)
-0.5 (0.09)
-0.3 (0.07)
-1 (0.21)
IRE -0.4 (0.11)
-0.7 (0.18)
-0.5 (0.13)
-0.4 (0.11)
-1 (0.23)
-1.6 (0.38)
-0.2 (0.06)
23.1 (4.45)
-0.6 (0.14)
-0.6 (0.16)
-0.4 (0.1)
-0.6 (0.16)
-0.6 (0.16)
4.3 (1.29)
ITA 2.7 (0.72)
-1.2 (0.31)
-0.6 (0.17)
-0.3 (0.06)
0.4 (0.28)
-4.5 (1.24)
-0.4 (0.1)
-0.3 (0.08)
23.8 (4.64)
-1.1 (0.28)
-0.5 (0.13)
-1.1 (0.28)
-0.4 (0.1)
-1.3 (0.32)
NTH -0.6 (0.15)
0.8 (0.36)
-0.5 (0.13)
-0.5 (0.12)
-1.7 (0.43)
-1.2 (0.48)
-0.3 (0.06)
-0.2 (0.05)
-0.9 (0.23)
23.2 (4.47)
-0.4 (0.11)
-0.7 (0.18)
-0.7 (0.19)
1.7 (0.49)
PRT -0.6 (0.18)
-1.1 (0.3)
-0.5 (0.14)
-0.3 (0.08)
-2 (0.53)
-3 (0.74)
-0.2 (0.04)
-0.4 (0.09)
-1.5 (0.4)
-1.1 (0.28)
23.9 (4.67)
6.5 (1.75)
-0.5 (0.13)
-2 (0.52)
ESP -0.7 (0.21)
-1 (0.26)
-0.5 (0.12)
-0.3 (0.08)
0.9 (0.42)
-2.8 (0.68)
-0.3 (0.06)
-0.4 (0.11)
-2 (0.52)
-1 (0.26)
3.8 (1)
24.1 (4.72)
-0.5 (0.11)
-1.8 (0.47)
SWE -0.6 (0.15)
-1.2 (0.32)
1.5 (0.41)
2.4 (0.7)
-1.2 (0.31)
-2.6 (0.65)
-0.2 (0.05)
-0.5 (0.12)
-0.6 (0.12)
-1.4 (0.37)
-0.3 (0.08)
-0.5 (0.11)
23.7 (4.6)
-2.5 (0.68)
GBR -0.6 (0.16)
1.4 (0.39)
-0.7 (0.17)
-0.6 (0.17)
0.4 (0.19)
-2.3 (0.56)
-0.3 (0.06)
1.3 (0.36)
-1 (0.23)
0.9 (0.3)
-0.5 (0.14)
-0.9 (0.23)
-0.9 (0.24)
23.9 (4.66)
Note: The cells report the steady-state spatio-temporal effects of a 1% increase in the column country’s rate of unemployment on its own labor training expenditures (logged × 100) and the expenditures of its EU counterparts (identified by the rows) based on the model (4) estimates. Parentheses contain standard errors.

30
Figure 1. A
ggregate A
ctive Labor Ma
rket Expenditures in the
EU
, 1980-2003
0 50
100
150
200
250
300
1980
1981
1982
1983
1984
1985
1986
1987
1988
1989
1990
1991
1992
1993
1994
1995
1996
1997
1998
1999
2000
2001
2002
2003
Active Labor Market Expenditures per Capita(EU Average, 2000 PPP$)
0 0.2
0.4
0.6
0.8
1 1.2
Coefficient of Variation
ALM
P
CV
31
Figure 2. Best Response Functions: Strategic Substitutes
1p
2p
)( 12 pRp =
)( 21 pRp =

32
Figure 3. Disaggregated Active Labor Market Expenditures in the OECD, 1980-2003
0
5
10
15
20
25
30
35
40
45
50
1980
1981
1982
1983
1984
1985
1986
1987
1988
1989
1990
1991
1992
1993
1994
1995
1996
1997
1998
1999
2000
2001
2002
2003
Per
cent
age
of T
otal
AL
MP
Exp
endi
ture
s
Subsidized Employment
Labor Market Training
Empoloyment Measures for Disabled
Youth Measures
Employment Service and Administration