correlation between difficulty and discrimination indices ... issue-5/version-4... · mcqs...
TRANSCRIPT
IOSR Journal of Research & Method in Education (IOSR-JRME)
e-ISSN: 2320–7388,p-ISSN: 2320–737X Volume 7, Issue 5 Ver. IV (Sep. – Oct. 2017), PP 28-43
www.iosrjournals.org
DOI: 10.9790/7388-0705042843 www.iosrjournals.org 28 | Page
Correlation between Difficulty and Discrimination Indices of
MCQs Type A in Formative Exam in Anatomy
*Dr. Itedal Abdelraheem Mohamed Ahmed
1, Dr. Adel Abdullah Moalwi
2
1Najran University, Faculty Medicine, Department of Anatomy
2Najran University, Faculty Medicine, Department of Surgery
Corresponding Author: Dr. Itedal Abdelraheem Mohamed Ahmed
Abstract: Difficulty (D) and discrimination (P) indices are the factors used to assess the typical of MCQs type A
in the examination. The plan of this study knows the correlation between the (D) and (P) and the standard of
MCQs informative examination in Anatomy. There were 580 MCQs items, taken from six exams for medical
female students conducting in the Najran University department of anatomy. The relationship between them
determined by a Pearson correlation using SPSS-PC version 20.0. Distribution of items: very difficult; 9
(3.5%): 75 (37.5 %), difficult;2 (1%):14 (7.8%), average; 45 (22.5%): 6 (3%), easy; 2 (1.1%): 29 (14.5%) and
very easy; 1 (0.6%): 27 (13.5%).Poor discrimination; 61 (30.5%): 13 (7.2%), acceptable; 0(0%):19 (10.6%),
good; 0 (0%): 7 (3.5%), very good; 0 (0%): 9 (5%) and excellent; 14 (7%): 64 (32%).The coefficient “r” (r =
0.509, P = (0.000) > 0.01, r = 0.181, P = (0.072) > 0.01, r = 0-.059, P = (.560) < 0.01, r = 0.260, P =
(0.009) < 0.01, r = 0.490, P = (0.000)> 0. and r = 0.372, P = (0.000) > 0.01.Our finding has a widely
positive correlation between (D) and (P) indices.
Keywords: Item analysis, Difficult index, Discrimination index, formative test, Single best response type MCQ.
----------------------------------------------------------------------------------------------------------------------------- ----------
Date of Submission: 13-09-2017 Date of acceptance: 28-09-2017
----------------------------------------------------------------------------------------------------------------------------- ----------
I. Introduction
Formative examinations are part of the instructional process which helps to modify teaching and
learning while they are happening. Timely modification can be made to improve knowledge. Knowledge of
students can be assessed by MCQs dates to 1960 .After 1999, in medical sciences, use of MCQs has been
diversified to departmental, university and competitive examinations. Informative examinations MCQs help to
understand the strength, weakness, gaps in knowledge, and provide feedback to teachers on their educational
actions [1,2,3].
Evaluation is an important component of a teaching-learning curriculum. A significant application
of evaluation is for continued monitoring of learning activities for giving a feedback to students and
teachers. Today Multiple Choice Questions (MCQs) is the most commonly used tool for assessing the
knowledge capabilities of medical students.However it is said that MCQs emphasize recall of factual
information rather than conceptual understanding and interpretation of concepts[4]. There is more to writing
good MCQs than writing good questions. Properly constructed MCQs can assess higher cognitive
processing of Bloom’s taxonomy such as interpretation, synthesis and application of knowledge, instead of
just testing recall of isolated facts [5,6]. Designing good MCQs is a complex, challenging and time consuming
process. Having constructed and assessed, MCQs need to be tested for the standard or quality .Item analysis
examines the student responses to individual test items (MCQs) to assess the quality of those items and test as
a whole[7]. It is a valuable yet relatively simple procedure performed after the examination that provides
information regarding the reliability and validity of a test [8]. Thus item analysis assesses the assessment
tool for the benefit of both student and teacher.
Item analysis is a process which examines students, responses to individual test items in order to
assess the quality of those items and quality of the test as a whole. It is of great help in improving the quality of
items which may be used again in subsequent tests. It also nurtures a thought in the mind of the instructor to
improve the skill in the construction of test items, and also helps identify course content which needs greater
emphasis or clarity .Nonetheless, it also provides feedback to teachers to instill changes in the standard of
teaching. The item statistics can help find out poor items which need improvement or deletion. It allows any
aberrant items to be given attention and reconstructed. Although some basic form of item analysis of the MCQ
tests might have been carried out routinely there has been no evidence that the data generated have been used to
help develop or select subsequent MCQ items [9,10].
There was a wide distribution of item difficulty indices (8.57 to 95.71) and discrimination indices

Correlation Between Difficulty and Discrimination Indices of MCQs Type A in Formative Exam in
DOI: 10.9790/7388-0705042843 www.iosrjournals.org 29 | Page
(-0.54 to 0.8).The mean difficulty index (P) was 52.53 + 20.59 and mean discrimination index was 0.30+ 0.18.
On average, about23% of the MCQ items were easy (P >70%), while about 15%were difficult (P <30%). The
remaining 62% items were within acceptable range (30 to 70%). In all 4% of the items showed negative
discrimination and 21% of the items exhibited poor discrimination. The remaining 75% of the items were in the
range of acceptable to excellent discrimination. The discrimination index exhibited slight positive correlation
with difficulty index (r = 0.191, P=0.003<0.01. ) The maximal discrimination (D=0.6-0.8) was observed with
moderately easy/difficult items (P = 40% - 60%) [11].
Difficulty index of 31(62%) items was in the acceptable range (p value 30-70%), 16(32%) items were
too easy (p value >70%) and 3(6%) items were too difficult (p value <30%). Discrimination index of 26 (52%)
items was excellent (d value>0.35), 9(18%) items was good (d value 0.20-0.34) and 15(30%)items were poor (d
value<0.2%). A total of fifty items had 150 distractors. Amongst these, 53(35.3%)were nonfunctional
distractors, 38(18.6%) were functional distractors and 69(46.06%) had nil responsive. not attempted by any
student. On the basis of non-functional distractors, distractor effectiveness of each item was assessed. Inter-
relationship between these indices was analyzed [12].
The items were categorized in their discrimination indices based on 13
Ebel (1972) guidelines on CT
item indices. As a rule-of thumb, any item discrimination index of 0.2 or higher is acceptable 14
(Brown, 1983; 15
Crocker and Algina, 1986.)Among the seventy items analyzed, forty-nine (70%) were found with index level of
0.2 or higher and were able to discriminate good and weak students. 16
Lin et al., (1999) in item analysis of
registered nurse licensure examination in Taiwan held in 1996 found that 23 out of 80 (29%) MCQ items on
Basic Medical Sciences had discrimination indices less than 0.2.
Pearson correlation between difficulty and discrimination indices showed that discrimination index
correlate poorly with difficulty index (r = -0.325). The correlation is significant at 0.01 level (2-tailed).Negative
correlation signifies that with increasing difficulty index values, there is decrease in discrimination index.
Negative correlation between difficulty and discrimination index indicated that with increase in difficulty index,
there is decrease in discrimination index. As the test items get easier, the discrimination index decreases, thus it
fails to differentiate weak and good students [17].
Same observation was reported by Si-Mui Sim et al., (2006) in their study, Mitra et al., (2009)showed
that the discrimination index correlated poorly with the difficulty index (r= -0.325). The negative correlation
signified that with increasing difficulty index values, there was a decrease in the discrimination index
indicating that low performance students were more likely to get the correct answer. As the items got easier
(above 75%), the level of discrimination index decreased consistently.
Pearson correlation between difficulty and discrimination indices showed that discrimination index
correlate poorly with difficulty index (r = -0.453). The correlation was significant at 0.000 level (2-tailed).
Negative correlationsignifies that with increasing difficulty index values, there is decrease in discrimination
index. When the data was entered in Microsoft illustration a dome shaped relationship was displayed (Figure
4.9). Initially, the discrimination power increased with the level of difficulty of the items, until it reached a
plateau (discrimination index of about 0.28 with the maximum 0.65) with difficulty indices of about
0.50(extending up to 0.70) and then began to decline with further increase in difficulty indices. The
discrimination power of the items with difficulty indices 0.10 and 1.0 were zero [18].
Relationship between Item difficulty (p) and discrimination power index (d) for each test item was
determined by Pearson correlation analysis. The difficulty indices and discrimination indices are most often
reciprocally related. The relationship between “p ”and “d” is not linear but is somewhat dome shaped. Pearson
correlation coefficient “r” calculated as -0.3711 showing a moderate negative relationship between values of Dv
and Dp. This negative correlation signifies that as the difficulty index increased discrimination index also
increase but to an optimum value only after which discrimination power decrease with the increase in difficulty
level. This suggested that the easier items ( >0.80 ) or too difficult items ( <0.20) poorly discriminate between
the superior and inferior examinees [19].
The result of the work showed that most of the test items fall in the acceptable range of difficulty index
and discrimination index. However, 17 of the test items was excluded due to very high or very low difficulty
level and poor discrimination power. Purposive sampling was adopted for this study and 100 B.Ed. Physical
Science students were taken from private B.Ed. Colleges in Pondicherry, India. A test of 100 items was used for
data collection. Using the findings relationship between the difficulty index of each item and the corresponding
discrimination index is carried out using the Pearson correlation formula. From the analysis, it was found that
item discrimination power increased with the increase in difficulty value but got decreased for very easy and
very difficult test items [20].
Correlation Between Difficulty and Discrimination Indices of MCQs Type A in Formative Exam in
DOI: 10.9790/7388-0705042843 www.iosrjournals.org 30 | Page
II. Method and material The MCQ type A items were created by female teachers and vetted by reviewer committee
department for content accuracy every year. The vetted questions were selected by the female departmental
head (test was administered by the researcher himself for data collection) and formatted for an examination
paper.
Current study, 6 test MCQs taken from the past 2 year for anatomy first term and second term
examinations, at first term two levels three and five and two papers exam and term two only level four and one
paper exam were analyzed. Each examination was carried out at the end of the term. A varied number students
appeared for each the examination. Each term the examination covered different topics, grouped generally
according to the systems. However, some repetition of the questions did not occur. Each MCQ consisted of a
stem and five responses and the students were asked to select one correct answer from these five choices.
There were 580 MCQs items, taken from six exam for medical female students conducting in Najran
University –department of anatomy and analyzed for level of difficulty and discrimination indices. The MCQ
papers contained 100 expect one paper exam contained 80 questions drawn from different regions. It formed a
part of 2 ½ hours MCQ paper to be answered each question in 1 ½ minutes. A correct response to an item was
awarded 1.0 mark and the wrong one zero, no negative marks allotted. The results of students performance in
these MCQ tests were then used to determine the level of difficulty P- value (difficult index) and power of
discrimination (discrimination index) using SPSS-PC statistical software version 20.0.
Interpretation
Difficulty Index (P) if:
≤ 0.20 Very difficult (should be revised)
0.21 – 0.30 Difficult (retained in the Q. bank)
0.31 – 0.69 Average (retained in the Q. bank)
0.70 – 0.80 Easy (revised before re-use)
≥ 0.81 Very easy (discarded or carefully reviewed)
Discrimination Index (D) if:
D = Negative Defective item / Wrong key
D < 0- 0.19 Poor discrimination
D between 0.2-0.29 Acceptable discrimination
D between 0.3-0.39 Good discrimination
D =0.4 Very good discrimination
D > 0.4 Excellent discrimination
III. Statistical Methods
Statistical analysis was performed by SPSS-PC statistical software version 20.0 (Statistical Package for
the Social Sciences). Correlation between the item difficulty index and discrimination index values for all items
was determined using Pearson correlation analysis, descriptive frequency and crosstabs and correlation
probabilities a P value, p <0.01 (2-sided) was considered to indicate statistical significance. The Pearson
correlation is a parametric measure of correlation for two variables. It measures both the power and the direction
of a linear relationship. If one variable X is an exact linear function of another variable Y, a positive relationship
exists if the correlation is +1.0 and a negative relationship occurs if the correlation is -1.0. If there is no linear
predictableness between the two variables, the correlation is 0.0. The following guidelines have been proposed
table III-1:
Table III-1 guidelines Coefficient, r Coefficient, r
Strength of Association Positive Negative
Small 0.1 to 0.3 -0.1 to -0.3 Medium 0.3 to 0.5 -0.3 to -0.5
Large 0.5 to 1.0 -0.5 to -1.0
IV. Result
The following tables and figures shows the findings of the relationship between difficulty and
discrimination indices (item analysis) which methods to assess the quality of test items (questions). The item

Correlation Between Difficulty and Discrimination Indices of MCQs Type A in Formative Exam in
DOI: 10.9790/7388-0705042843 www.iosrjournals.org 31 | Page
difficult is simply the percentage of students who answer an item correctly and item discrimination indicate to
the ability of an item to distinguish among students on the basis of how well they recognize the material being
tested. Table 1 explains the distribution of difficulty items of anatomy 1 exam term one in 2016 and 2017
years and each exam consist of 100 items. The number of items very difficult; 75 (37.5 %) and 3 (1.5 %),
difficult;2 (1%) and 8 (4%), average; 6 (3%) and 33 (16.5%), easy;4 (2%) and 29 (14.5%), very easy; 13 (6.5%)
and 27 (13.5%).Table 2 shows the frequency of discrimination items. The poor discrimination; 61 (30.5%) &
41 (20.5%), Acceptable; 20 (10%) & 0 (0%), good; 1 (0.5%) & 0 (0%), very good; 4 (2%) & 0
(0%),excellent14 (7%) and59 (29.5%) of anatomy-1 (2016-2017) respectively.
Table 1 Interpretation of Difficulty Index Frequency of Anatomy-1Exam 2016
Interpretation of Difficulty index Frequency % Relative Frequency %
Anatomy -1 exam 2016 Anatomy -1 exam 2017
P ≤ 0.20 75 (37.5%) 3 (1.5%) 78 (39%)
P between 0.21 – 0.30 2 (1%) 8 (4%) 10 (5%)
P between 0.31 – 0.69 6 (3%) 33 (16.5%) 39 (19.5%)
P between 0.70 – 0.80 4 (2%) 29 (14.5%) 33(16.5%) P > 0.81 13 (6.5%) 27 (13.5%) 40 (20%)
Total 100 (50%) 100 (50%) 200 (100%)
P Value: Difficult index
Table 2 Interpretation of Discrimination Index Frequency of Anatomy-1Exam 2017
D: Discrimination index
Table 3 shows the distributions of difficult and discrimination items in anatomy -2 (2016-2017). The very
difficult 9 (3.5%) & 20 (10%), difficult 8 (4%) & 14 (7%), average 41 (20.5%) & 45 (22.5%), easy 24
(12%) & 6 (3%) and very easy 18 (9%) & 15 (7.5%). Table 4 explains the following distribution of
discriminate items: poor discrimination;22 (11%) &29 (14.5%),acceptable;4 (2%) & 10 (5%), good; 7 (3.5%)
& 0 (0%), very good; 3 (1.5%) & 0 (0%) and excellent;64 (32%) & 51 (25.5%) respectively.
Table 3 Interpretation of Difficulty Index Frequency of Anatomy-2Exam
Interpretation of Difficulty index Frequency % Relative Frequency %
Anatomy -2 exam 2016 Anatomy -2 exam 2017
P ≤ 0.20 9 (3.5%) 20 (10%) 29(14.5%)
P between 0.21 – 0.30 8 (4%) 14(7%) 22(11%) P between 0.31 – 0.69 41 (20.5%) 45(22.5%) 86(43%)
P between 0.70 – 0.80 24 (12%) 6(3%) 30 (15%)
P >0.81 18 (9%) 15 (7.5%) 33 (16.5%)
Total 100 (50%) 100 (50%) 200 (100%)
P Value: Difficult index
Table 4 Interpretation of Discrimination Index Frequency of Anatomy-2Exam
D: Discrimination index
Table 5 displays distribution difficult items and table 6 shows the distribution of discrimination items
Frequency of anatomy3 exams (2016-2017). Very difficult;22 (12.2%) & 40 (22.2%), difficult; 12 (6.7%) &14
(7.8%), average; 43 (23.9%)& 35 (19.4%), easy;2 (1.1%) & 4 (22%), very easy; 1 (0.6%) & 7 (3.9%) and
Interpretation of Discrimination index
Frequency % Relative Frequency %
Anatomy -1 exam 2016 Anatomy -1 exam 2017
D < 0- 0.19 61 (30.5%) 41 (20.5%) 102 (51%)
D between 0.2-0.29 20 (10%) 0 (0%) 10 (5%)
D between 0.3-0.39 1 (0.5%) 0 (0%) 1 (0.5%)
D = 0.4 4 (2%) 0 (0%) 4 (2%)
D > 0.4 14 (7%) 59 (29.5%) 73 (36.5%)
Total 100 (50%) 100 (50%) 200 (100%)
Interpretation of Discrimination
index Frequency %
Relative Frequency % Anatomy -2 exam 2016 Anatomy -2 exam 2017
D < 0- 0.19 22 (11%) 29 (14.5%) 51 (25.5%)
D between 0.2-0.29 4 (2%) 10 (5%) 14 (7%) D between 0.3-0.39 7 (3.5%) 10 (5%) 17 (8.5%)
D = 0.4 3 (1.5%) 0 (0%) 3 (1.5%)
D > 0.4 64 (32%) 51 (25.5%) 115 (57.5%)
Total 100 (50%) 100 (50%) 200 (100%)

Correlation Between Difficulty and Discrimination Indices of MCQs Type A in Formative Exam in
DOI: 10.9790/7388-0705042843 www.iosrjournals.org 32 | Page
table 6 shows: poor discrimination; 13 (7.2%) & 31 (17.2%),acceptable; 11 (6.1%) & 19 (10.6%), good: 4
(2.2%)&5 (2.8%), very good; 8 (4.4%) & 9 (5%) and excellent discrimination; 44 (24.4%) &36 (20%)
respectively.
Table 5 Interpretation of Difficulty Index Frequency of Anatomy3Exam
Interpretation of Difficulty index Frequency%
Relative Frequency% Anatomy -3 exam 2016 Anatomy -3 exam 2017
P <& = 0.20 22 (12.2%) 40 (22.2%) 62(34.4%)
P between 0.21 – 0.30 12 (6.7%) 14(7.8%) 26(14.4%)
P between 0.31 – 0.69 43 (23.9%) 35(19.4%) 78(43.3%) P between 0.70 – 0.80 2(1.1%) 4(22%) 6(3.3%)
P >0.81 1 (0.6%) 7 (3.9%) 8(4.4%)
Total 80 (44.4%) 100 (55.6%) 180 (100%)
P Value: Difficult index
Table 6 Interpretation of Discrimination Index Frequency of Anatomy3Exam
D: Discrimination index
Very difficult Questions (Q) should be revised, difficult & average retained in the Q bank, easy QQ revised
before re-use and very easy QQ discarded or carefully reviewed.
The following figures show data crostabulation between difficult and discrimination indices. (Figure 1)
displayed poor discrimination more than anther at a level very and difficult items while excellent discrimination
more than others at a level very easy items that mean decrease the difficulty index with increase
discrimination that indicated to the positive relationship between them.
Figure 1 Crosstabulation of Difficult and Discrimination Indices of Anatomy- 1Exam 2016
Figure 2 shows excellent discrimination more at level average, easy, very easy, difficult and very difficult
items, however the poor discrimination items more in level average, easy, very easy, difficult and very difficult
these distributions indicated to negative correlation.
Interpretation of Discrimination index
Frequency % Relative Frequency %
Anatomy -3 exam 2016 Anatomy -3 exam 2017
D < 0- 0.19 13 (7.2%) 31 (17.2%) 44 (25.5%)
D between 0.2-0.29 11 (6.1%) 19 (10.6%) 30 (7%)
D between 0.3-0.39 4 (2.2%) 5 (2.8%) 9 (8.5%) D = 0.4 8 (4.4%) 9 (5%) 17 (1.5%)
D > 0.4 44 (24.4%) 36 (20%) 80 (57.5%)
Total 80 (44.4%) 100 (55.6%) 180 (100%)

Correlation Between Difficulty and Discrimination Indices of MCQs Type A in Formative Exam in
DOI: 10.9790/7388-0705042843 www.iosrjournals.org 33 | Page
Figure 2 Crosstabulation of Difficult and Discrimination Indices of Anatomy -1 exam 2017
Figure 3 explains the excellent discrimination items more than anther at all levels of difficult items that
indicates to negative relationship between two variables.
Figure 3 Crosstabulation of Difficult and Discrimination Indices of Anatomy- 2 Exam 2016
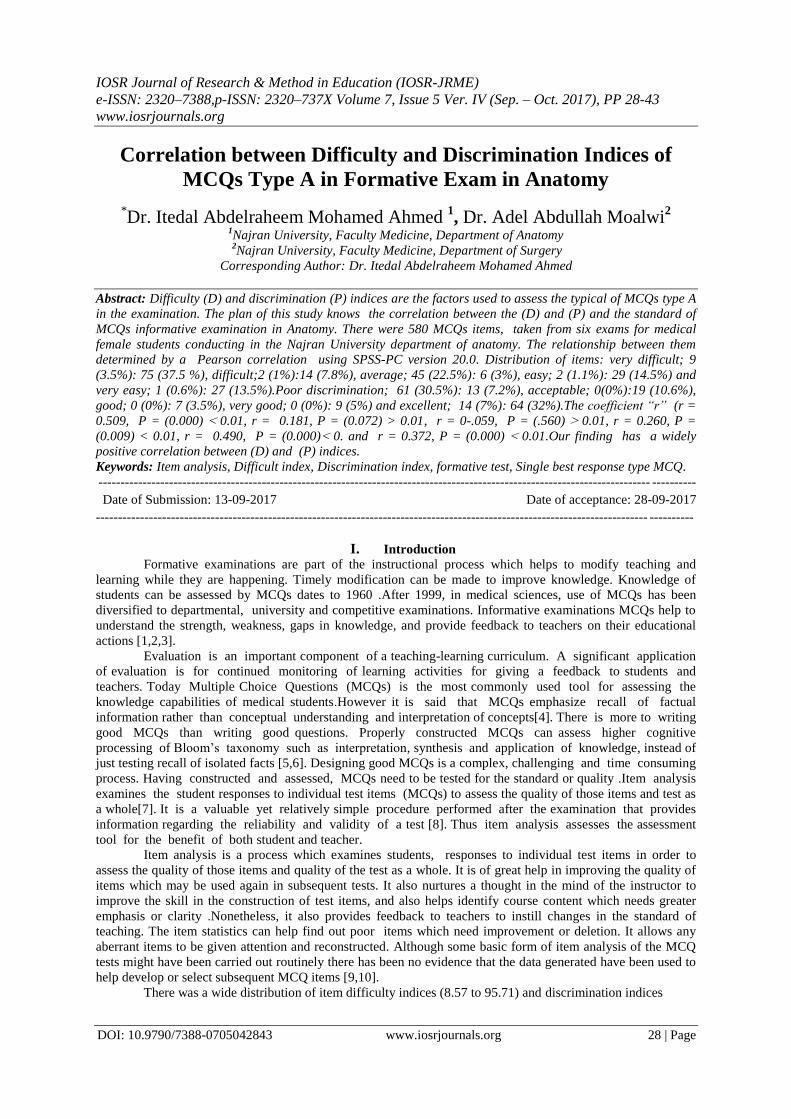
Figure 4 shows the poor discrimination items more than others at levels of very difficult items that indicates to
relate together.
Correlation Between Difficulty and Discrimination Indices of MCQs Type A in Formative Exam in
DOI: 10.9790/7388-0705042843 www.iosrjournals.org 34 | Page
Figure 4 Crosstabulation of Difficult and Discrimination Indices of Anatomy- 2 Exam 2017
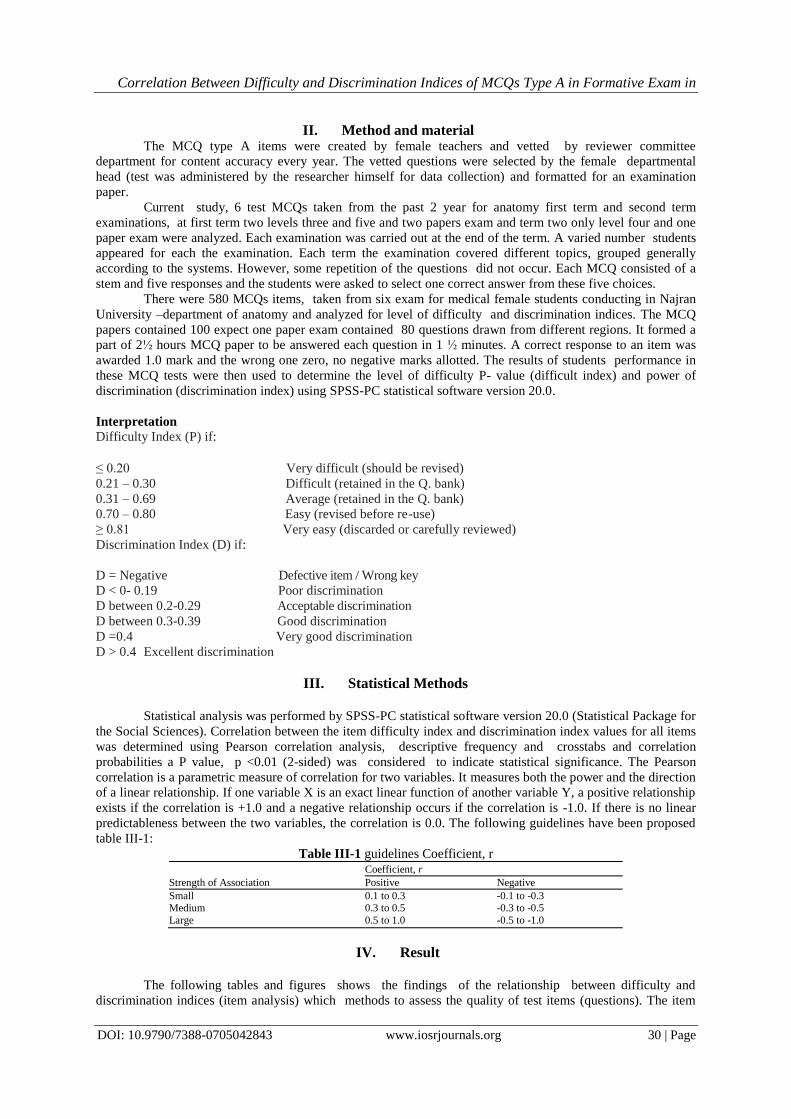
Figure 5 displayed poor and acceptable discrimination items common more than others at a level very difficult
items that mean difficult index decrease and discrimination index increase that to indicates too positive
correlation.
Figure 5 Crosstabulation of Difficult and Discrimination Indices of Anatomy -3 Exam 2016
Figure 6 explained poor discrimination items more than anther at very difficult that mean difficult index
decrease while discrimination index increase this indicates a positive relationship.

Correlation Between Difficulty and Discrimination Indices of MCQs Type A in Formative Exam in
DOI: 10.9790/7388-0705042843 www.iosrjournals.org 35 | Page
Figure 6 Crosstabulation of Difficult and Discrimination Indices of Anatomy-3 Exam 2017
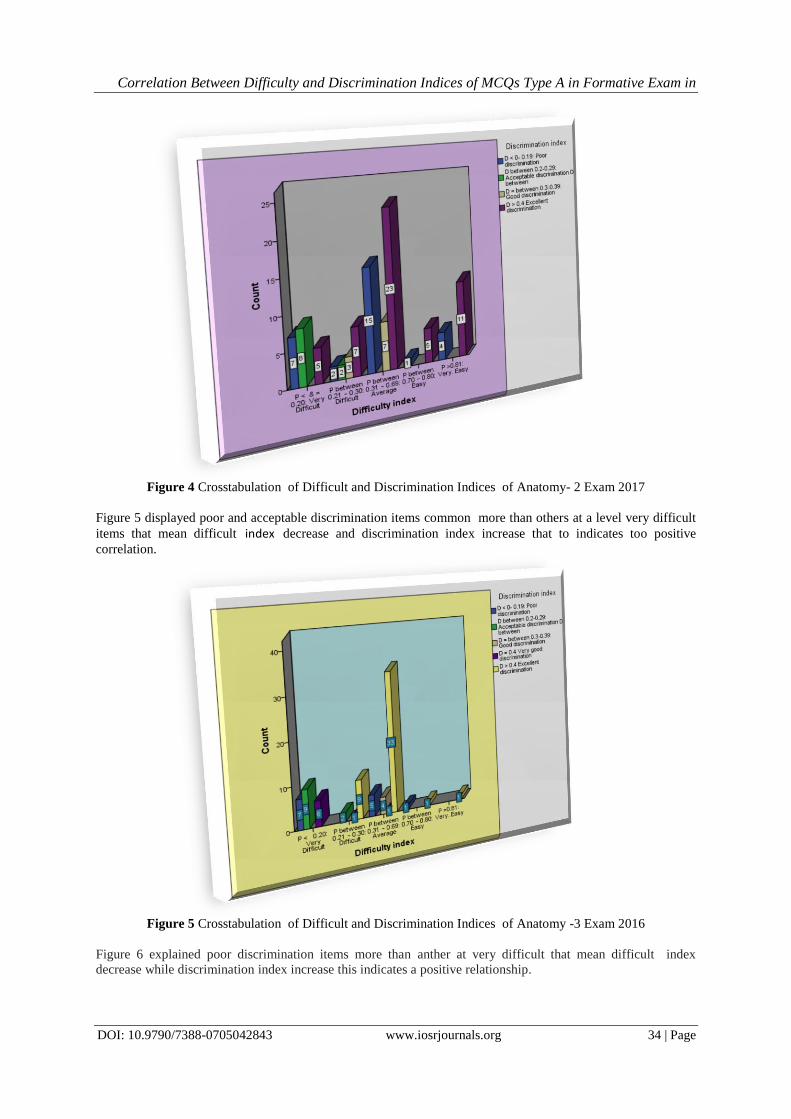
Table 7 and following figures show correlation between difficult and discrimination indices. Table 7 explains
the items of six anatomy exams and displayed relationship of difficulty and discrimination indices. The strength
of association (coefficient, r)of items: anatomy -1 (2016);r = 0.509, P =(0.000)>0.01and its large positive
correlation, anatomy -1 (2017); r =0.181,P = (0.072)>0.01its small negative correlation, anatomy -2 (2016); r =
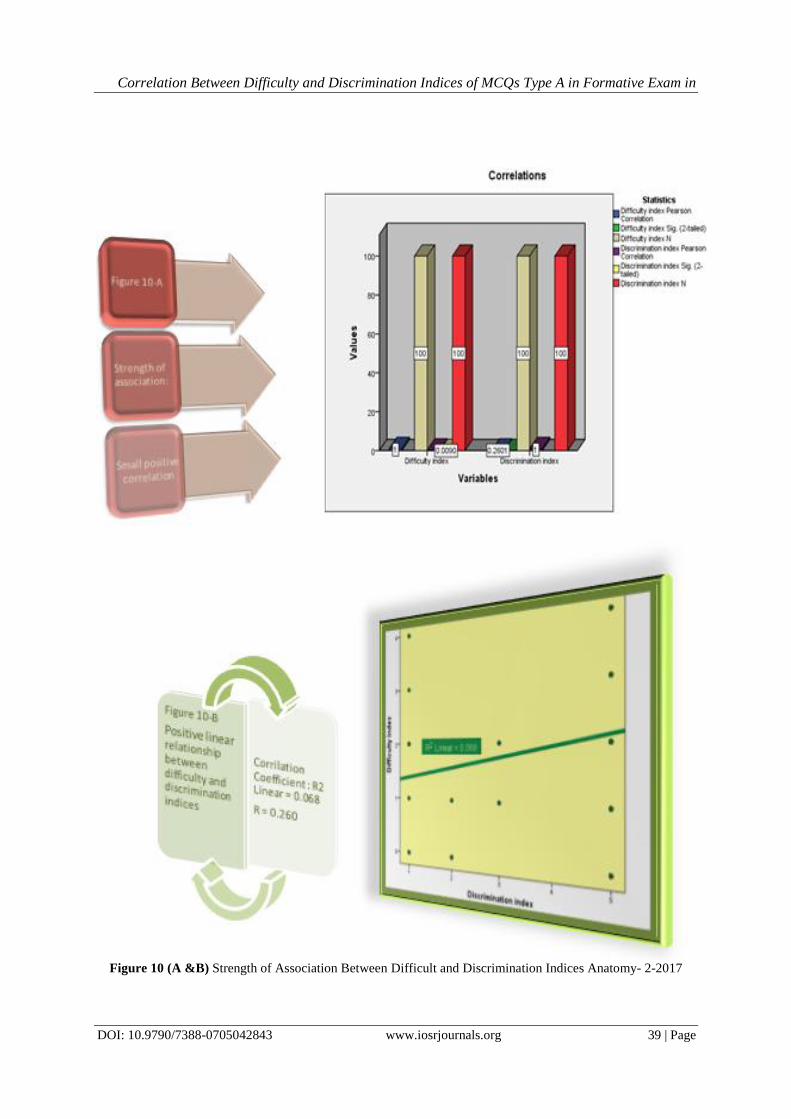
0-.059, P = (.560) < 0.01 its large negative correlation, anatomy -2 (2017); r = 0.260,P = (0.009) < 0.01 its
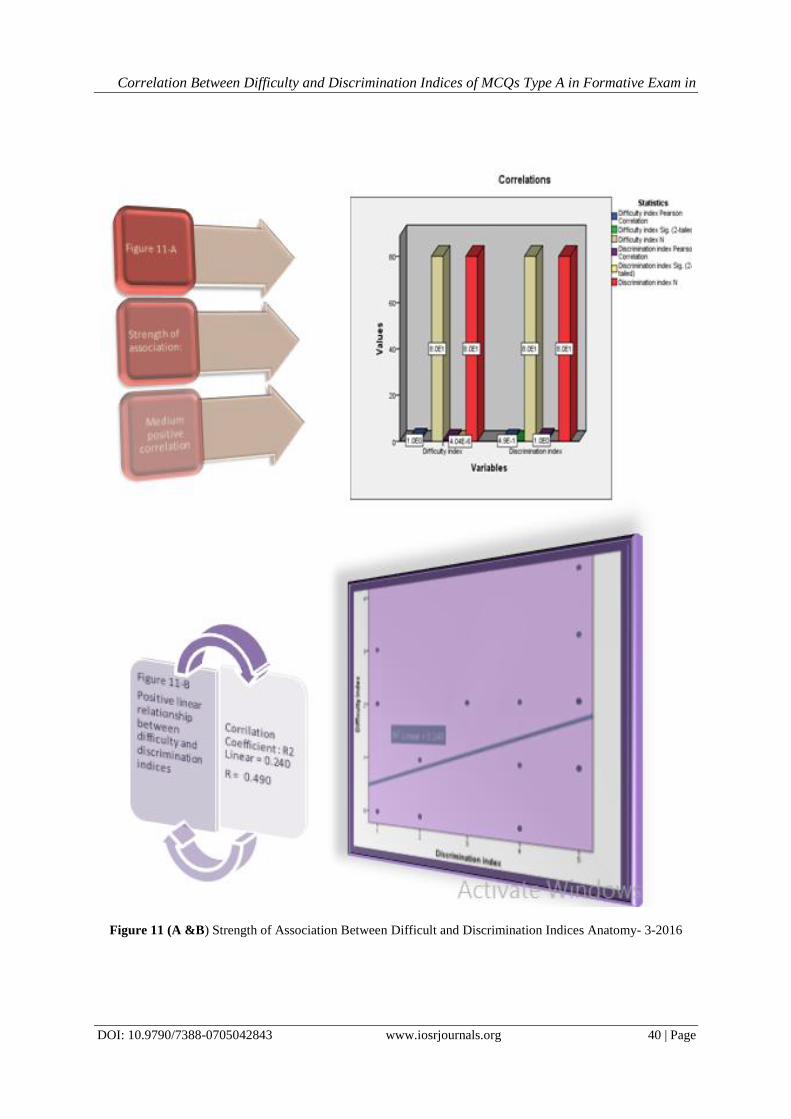
small positive correlation, anatomy -3 (2016); r = 0.490, P = (0.000) > 0.01 its medium positive correlation and
anatomy -3 (2017); r = 0.372,P = (0.000) > 0.01 its medium positive correlation refers table III-1 above and the
following figures supported these data analyses.
Table 7 Correlation Between Difficulty and Discrimination Indices of MCQs Type A in Formative Exam in
Anatomy
MCQs type A in formative exam Significant at the 0.01 level (2-tailed) Coefficient
(r) Difficulty index Discrimination index
Anatomy 1 2016 0.000 0.000 0.509**
Anatomy 1 2017 0.072 0.072 0.181 Anatomy 2 2016 0.560 0.560 -0.059
Anatomy 2 2017 0.009 0.009 0.260**
Anatomy 3 2016 0.000 0.000 0.490** Anatomy 3 2017 0.000 0.000 0.372**
**. Correlation is significant at the 0.01 level (2-tailed).

Correlation Between Difficulty and Discrimination Indices of MCQs Type A in Formative Exam in
DOI: 10.9790/7388-0705042843 www.iosrjournals.org 36 | Page
Figure 7 (A &B) Strength of Association Between Difficult and Discrimination Indices Anatomy- 1 2016
Correlation Between Difficulty and Discrimination Indices of MCQs Type A in Formative Exam in
DOI: 10.9790/7388-0705042843 www.iosrjournals.org 37 | Page
Figure 8 (A &B) Strength of Association Between Difficult and Discrimination Indices Anatomy-1-2017

Correlation Between Difficulty and Discrimination Indices of MCQs Type A in Formative Exam in
DOI: 10.9790/7388-0705042843 www.iosrjournals.org 38 | Page
Figure 9 (A&B) Strength of Association Between Difficult and Discrimination Indices Anatomy -2-2016
Correlation Between Difficulty and Discrimination Indices of MCQs Type A in Formative Exam in
DOI: 10.9790/7388-0705042843 www.iosrjournals.org 39 | Page
Figure 10 (A &B) Strength of Association Between Difficult and Discrimination Indices Anatomy- 2-2017
Correlation Between Difficulty and Discrimination Indices of MCQs Type A in Formative Exam in
DOI: 10.9790/7388-0705042843 www.iosrjournals.org 40 | Page
Figure 11 (A &B) Strength of Association Between Difficult and Discrimination Indices Anatomy- 3-2016

Correlation Between Difficulty and Discrimination Indices of MCQs Type A in Formative Exam in
DOI: 10.9790/7388-0705042843 www.iosrjournals.org 41 | Page
Figure 12 (A &B) Strength of Association Between Difficult and Discrimination Indices Anatomy- 3-2017

Correlation Between Difficulty and Discrimination Indices of MCQs Type A in Formative Exam in
DOI: 10.9790/7388-0705042843 www.iosrjournals.org 42 | Page
V. Discussion
The outcomes of this study indicate the significance of item analysis (difficulty and discrimination
indices) for determining the quality and validity of individual exam item in constructing a more reliable exam.
The current study was conducted with the similar aim to previous studies above. In this study the items of
anatomy -2 (2017); r = 0.260, P = (0.009) < 0.01 its small positive correlation same opinions were reported by
Sushma S. Pande, et al. (2013) in their study on correlation between difficulty & discrimination indices of
MCQs informative exam in Physiology; the discrimination index exhibited a slight positive correlation with the
difficulty index (r = 0.191, P=0.003<0.01). In this study the items of anatomy -1 (2017); r = 0.181, P = (0.072)
< 0.01 its small negative correlation and items of anatomy -2 (2016); r = -0.059, P = (.560) < 0.01 its large
negative correlation same observation was reported by Si-Mui Sim et al., (2006) in their study, Mitra et al.,
(2009) showed that the discrimination index correlated poorly with the difficulty index (r= -0.325), Suruchi
S (2014) reported that Pearson correlation coefficient r calculated as -0.3711 showing a moderate negative
relationship between values of Dv and Dp and also similar finding Md Ahsan and et al. (2016) found the
discrimination index correlate poorly with difficulty index (r = -0.453). This could have been due to poor
understanding of difficult topics, obscurity in expressions of the questions or even unfitting key or personal
difference in forming the questions and may also be due to dissimilarities in students' intelligence level. We
found the strength association between item difficulty index or the p –value is defined as the percentage of
examinees selecting the answer to the item correctly and the item discrimination index is a basic measure of
the validity of items of anatomy -1 (2016); r = 0.509, P = (0.000) > 0.01 and its large positive correlation, the
items of anatomy -3 (2016); r = 0.490, P = (0.000) >0.01 its medium positive correlation and the items of
anatomy -3 (2017); r = 0.372, P = (0.000) > 0.01 its medium positive correlation; i.e. these exams characterized
by validity and reliability and we did not find a similar finding in this part of our study. In our study the widely
held items of anatomy exams satisfied the criteria of acceptable difficulty and good discrimination, which
means the MCQs designed were of good quality. Easy and difficult items had the highest discriminative
ability. Very easy and very difficult items showed poor discrimination. Even bad discrimination was
observed in very difficult items.
VI. Conclusion
Our finding of the study reveals that anatomy test items with good discrimination coefficient
have a widely positive correlation between difficulty (D) and discrimination (P) indices. Item analysis
(parameter D and A)improves exams and give it reliability and validity, which functions as implement to
evaluate students and instructional quality.
Acknowledgements
Many pleasures and appreciation owed to many people who contributed knowingly and indirectly to
this work, gratitude to all authors who cited who their work in this research. Many thanks and appreciations go
to everyone who encouraged and supported the ideas of this work.
References [1] Sadler, D.R, Formative assessment revisiting the territory, Assessment in Education :Principles, Policy & Practice,1465-329X,
5, 1, 1998, 77-84 .
[2] Nicol, D.J. & Macfarlane-Dick, D., Formative assessment and self-regulated learning: a model and seven principles of good
feedback practice, Studies in Higher Education,31, 2 ,2006,199-218.
[3] Hubbard, J.P. &Clemans 1961 W.V, Multiple choice Examinations in Medicine: A Guide for Examiner and Examinee. London: Lea&Fabiger.
[4] Srivastava A, Dhar A, Agarwal CS .Why MCQ? Indian Journal of Surgery 2004;66:246 248.
[5] Carneson J, Delpierre G, Masters K. Designing and managing MCQs. Appendix C: MCQs and Blooms taxonomy(Online) 2011(Cited 2011 Feb2). Available from URLhttp://web.uct.ac.za/projects/cbe /mcqman/mcqappc.html.
[6] Case SM, Swanson DB. Extended matching items: a practical alternative to free response questions, Tech Learn med
1993;5:107-15 Singh T, Gupt. [7] Singh T, Gupta P, Singh D. Test and Item analysis. In: Principles of Medical Education.3rded. NewDelhi: Jaypee Brothers
Medical Publishers(P) Ltd:2009,70-77.
[8] Considine J, Botti M, Thomas S .Design, format, validity and reliability of multiple choice questions for use in nursing researchand education. Collegian2005;12:19-24.
[9] Si-Mui Sim, Rasiah R.I. , Relationship between item difficulty and discrimination indices in true/false type multiple choice
questions of a para-clinical multidisciplinary paper. Ann Acad Med Singapore, 35, 2006, 67-71. [10] Zubairi, A.M &Kassim. N.L.A., Classical and Rasch analysis of dichotomously scored reading comprehension test items.
Malaysian J of ELT Res, 2, 2006, 1-20.
[11] Sushma S. Pande, et al, Correlation between difficulty & discrimination indices of MCQs in formative exam in Physiology.
South‐East Asian Journal of Medical Education Vol. 7 no. 1, 2013, 45:50.
[12] Mehta G, Mokhasi V. Item Analysis of Multiple Choice Questions - An Assessment of the Assessment Tool. International Journal of Health Sciences and Research 2014, 197,2249-9571

Correlation Between Difficulty and Discrimination Indices of MCQs Type A in Formative Exam in
DOI: 10.9790/7388-0705042843 www.iosrjournals.org 43 | Page
[13] Ebel, R.L. (1972). Essentials of educational measurement (1st Ed.).New Jersey: Prentice Hall ; Quoted in: Ainol Madziah
Zubairi, NoorLide Abu Kassim. Classical and Rasch analyses of dichotomously scored reading comprehension test items.
Malaysian Journal of ELT Research. 2, 2006, 1-20. [14] Brown, F.G. (1983). Principles of educational and psychological testing (3rdEd.). New York: Holt, Rinehart and Winston.
[15] Crocker, L, Algina, J. (1986). Introduction to classical and modern test theory. New York: Holt, Rinehart and Winston. Above
two references quoted in: Li-Chan Lin, Hui-Min Tseng, Shiao-Chi Wu .Item analysis of the registered nurse licensure exam taken bynurse candidates from vocational nursing high schools in Taiwan.Proc.Natl.Sci. Counc. ROC(D).9(1),1999,24-31.
[16] Li-Chan Lin, Hui-Min Tseng, Shiao-Chi Wu (1999). Item analysis of the registered nurse licensure exam taken by nurse
candidates from vocational nursing high schools in Taiwan Proc. Natl. Sci. Counc. ROC [17] Mitra, N.K., Nagaraja, H.S., Ponnudurai, G. &Judson, J. P. ,The levels of difficulty and discrimination indices in type A
multiple choice questions of Pre-clinical Semester multidisciplinary summative tests. IeJSME, 3, 1, 2009,2-7.
[18] Md Ahsan Habib, HumayunKabirTalukder and MdMahbubur Rahman, Post-application Quality Analysis of MCQs of Preclinical Examination Using Item Analysis.Bangladesh Journal of Medical Education ISSN: 2306-0654 Vol.- 07, Issue- 01, 2016, 2:7.
[19] Suruchi S, Test Item Analysis and Relationship BetweenDifficulty Level and Discrimination Index of TestItems in an
Achievement Test in Biology. Indian journal of research; olume : 3 Issue : 6,2014,57-58. [20] S. MARIA, E. SREEKALA, Relevance of item analysis in standardizing an Achievement test in teaching of
physical Science in b.ed syllabus. i-manager’s Journal of Educational Technology, Vol. 12 l No. 3,2015,30:36.
Dr. Itedal Abdelraheem Mohamed Ahmed . “Correlation between Difficulty and Discrimination
Indices of MCQs Type A in Formative Exam in Anatomy.” IOSR Journal of Research & Method
in Education (IOSR-JRME) , vol. 7, no. 5, 2017, pp. 28–43.