correlation and regression david young department of statistics and modelling science, university of...
TRANSCRIPT

Correlation and RegressionDavid YoungDepartment of Statistics and Modelling Science, University of StrathclydeRoyal Hospital for Sick Children, Yorkhill NHS Trust
Relationships between Variables•common aim of research is to try to relate a variable of interest
to one or more other variables•demonstrate an association between variables (not necessarily
causal) e.g. dose of drug and resulting systolic blood pressure, advertising expenditure of a company and end of year sales figures, etc.
•establish a theoretical model to predict the value of one variable from a number of known factors
Dependent and Independent Variables•the independent variable is the variable which is under the
investigator’s control (denoted x)•the dependent variable is the one which the investigator is
trying to estimate or predict (denoted y)•can a relationship be used to predict what happens to y as x
changes (i.e. what happens to the dependent variable as the independent variable changes)?
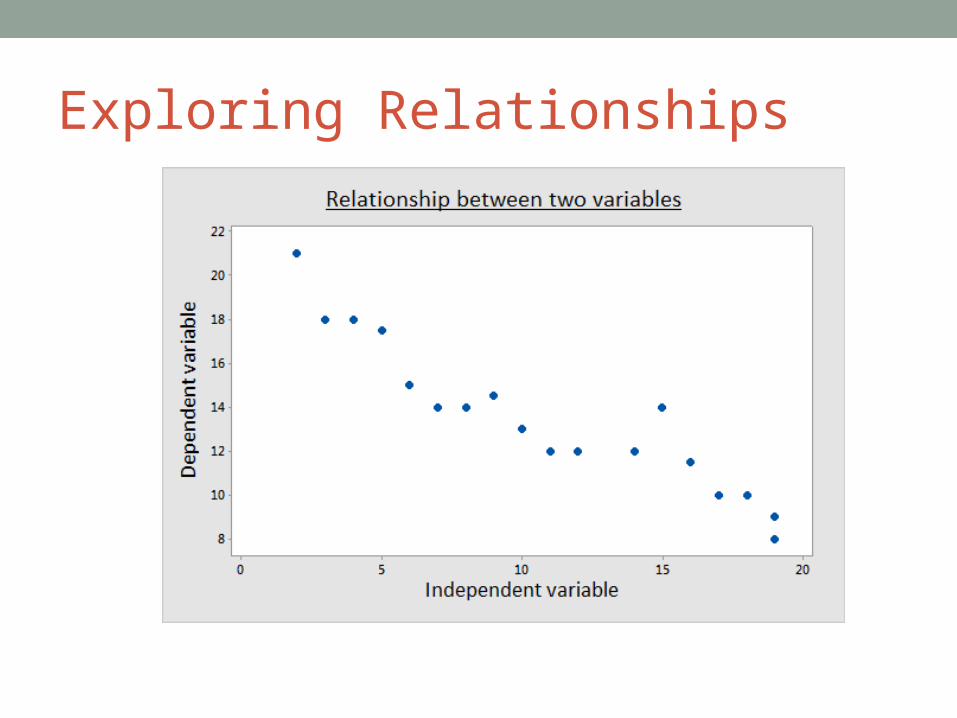
Exploring Relationships
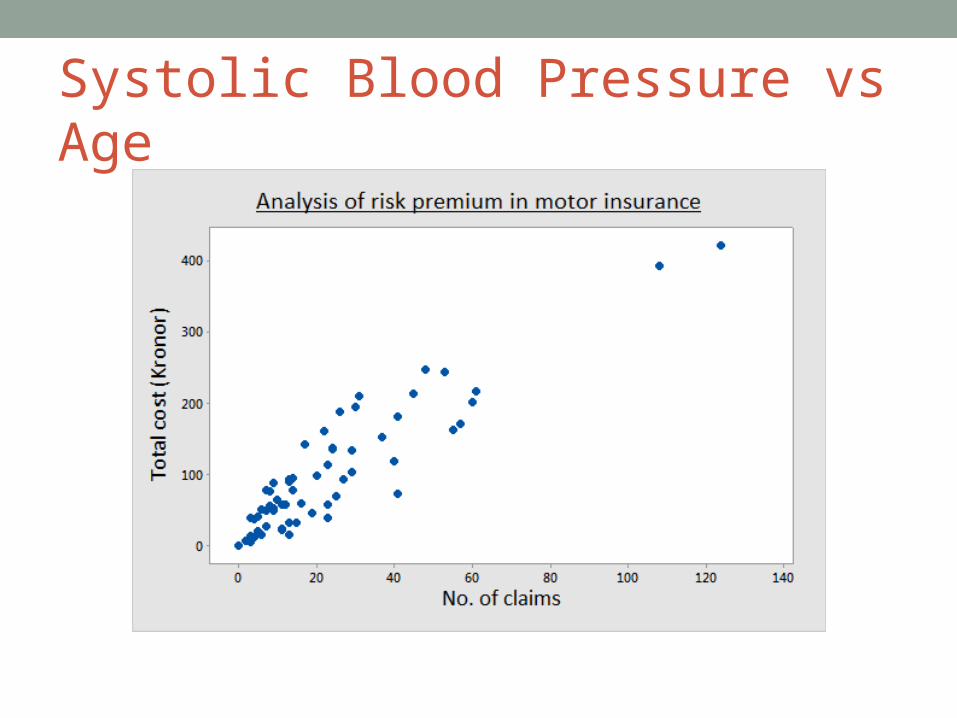
Systolic Blood Pressure vs Age

Scatter Plots
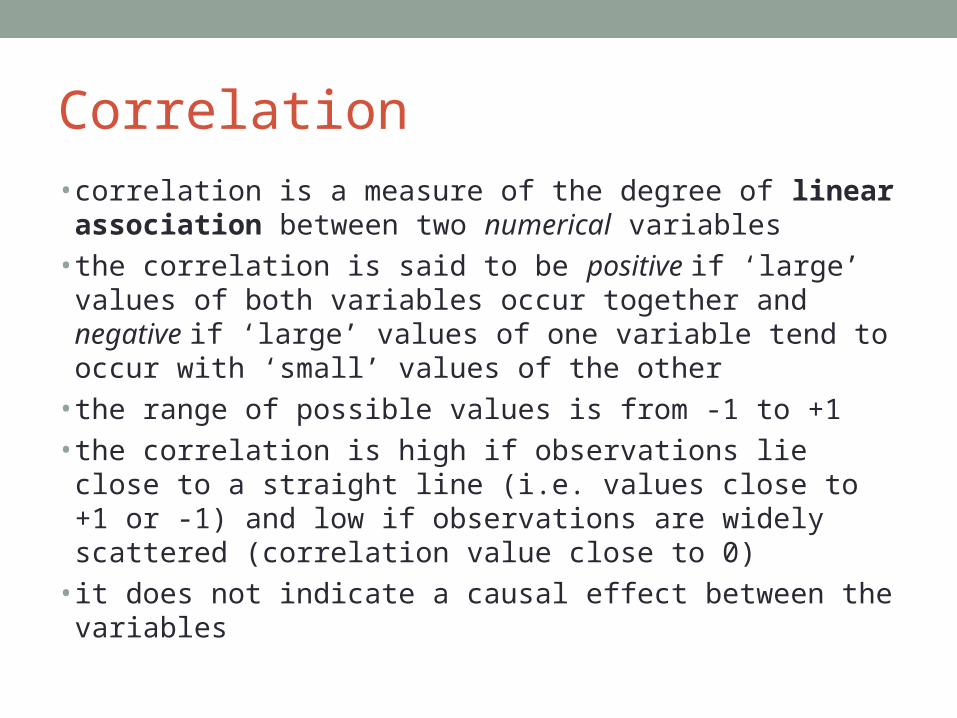
Correlation•correlation is a measure of the degree of linear association
between two numerical variables•the correlation is said to be positive if ‘large’ values of both
variables occur together and negative if ‘large’ values of one variable tend to occur with ‘small’ values of the other
•the range of possible values is from -1 to +1•the correlation is high if observations lie close to a straight line
(i.e. values close to +1 or -1) and low if observations are widely scattered (correlation value close to 0)
• it does not indicate a causal effect between the variables

Correlation

Correlation
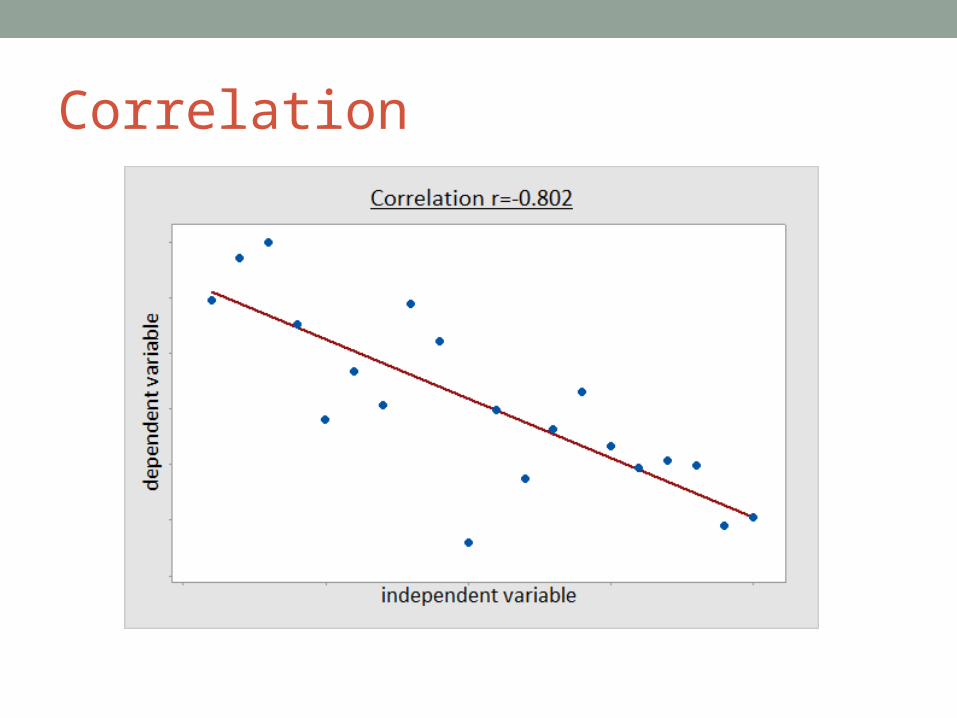
Correlation

No Correlation
Correlation
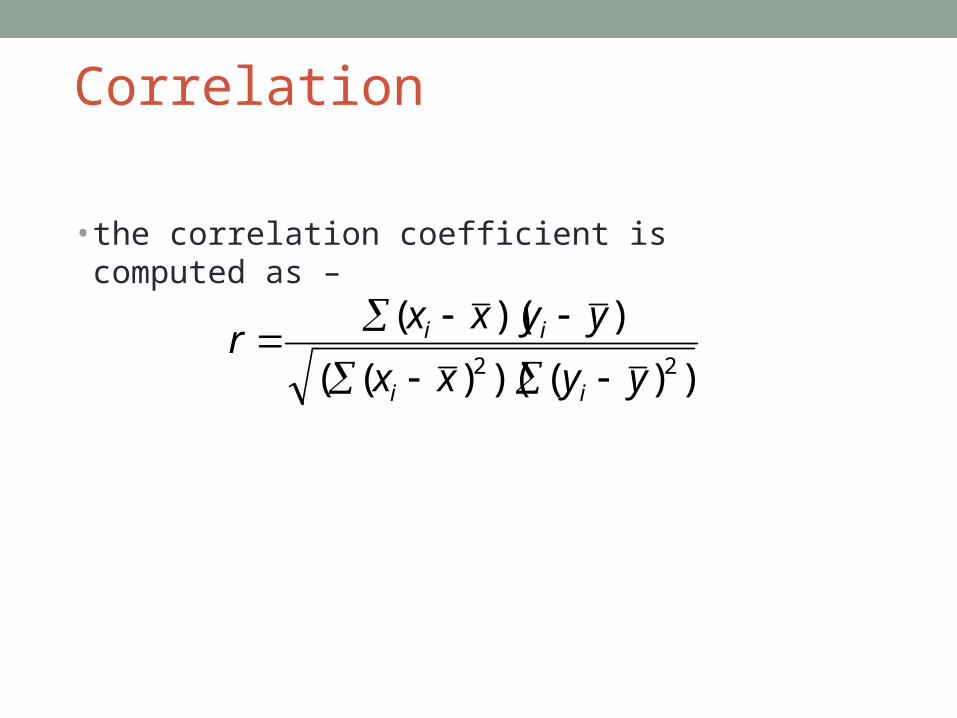
•the correlation coefficient is computed as –
))()()((
))((22 yyxx
yyxxr
ii
ii
Interpretation of Correlation•there may be no direct connection between highly correlated
variables (known as spurious correlation)•coincidental correlation – e.g. the price of M&S sandwiches
and the size of the hole in the ozone layer over the past 5 years•indirect correlation – e.g. high correlation between infant
mortality and the extend of overcrowding in a certain town between 1st and 2nd WW (depend not on each other but on a third variable i.e. low income level)
•N.B. low correlation does not necessarily mean a low degree of association (relationship may be non-linear)
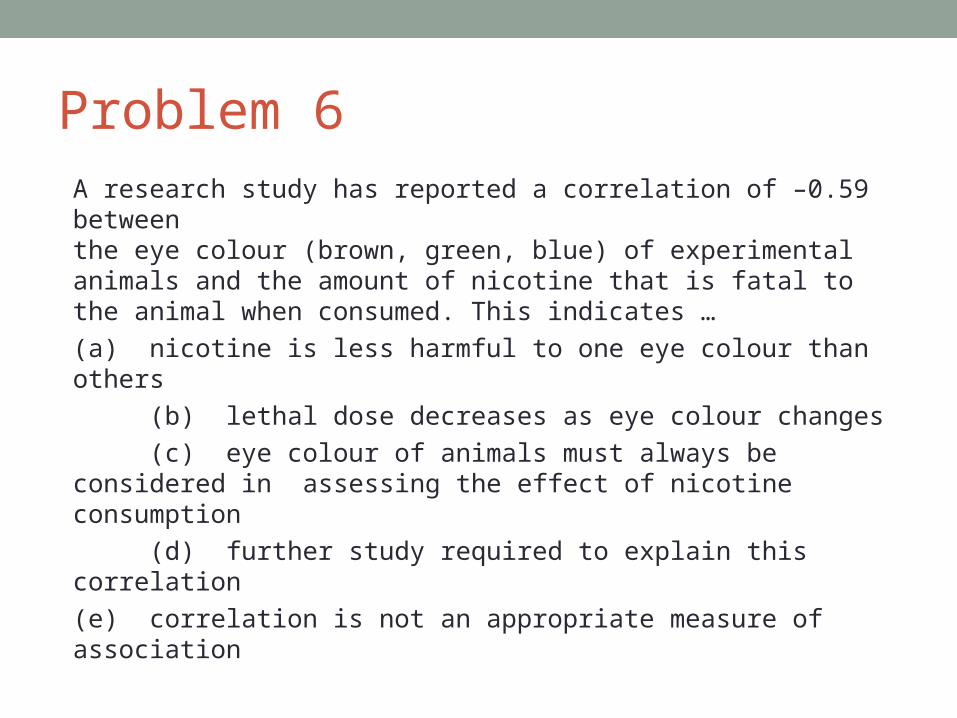
Problem 6A research study has reported a correlation of –0.59 betweenthe eye colour (brown, green, blue) of experimental animals and the amount of nicotine that is fatal to the animal when consumed. This indicates …(a) nicotine is less harmful to one eye colour than others
(b) lethal dose decreases as eye colour changes (c) eye colour of animals must always be considered in
assessing the effect of nicotine consumption (d) further study required to explain this correlation
(e) correlation is not an appropriate measure of association

Problem 7If the correlation between body weight and annual incomewere high and positive, we would conclude that …
(a) high incomes cause people to eat more food(b) low incomes cause people to eat less food
(c) high income people tend to spend a greater proportion of their income on food than low income people, on average
(d) high income people tend to be heavier than low income people, on average(e) high incomes cause people to gain weight

Example

Hypothesis Testing•the linear relationship between two variables is significant if
there is evidence to suggest that is significantly different from zero
•for the hypothesis test
•observed value of r is 0.864 and associated p-value is <0.001 (calculated by MINITAB using >Stat >Basic Statistics >Correlation)
•Conclusion: reject H0 and conclude that there is evidence to suggest that there is a linear relationship of size on age
0:H and 0:H 10

Summary•correlation () is a measure of the linear relationship between
two variables•it gives an actual measure of the strength of the linear
relationship seen in a scatter plot•values range from –1 to +1•the closer is to ±1, the stronger the linear relationship•N.B. high correlation does not indicate a causal effect!•correlation is not an appropriate measure for testing the
equivalence of two methods

Regression•develop an equation to predict the dependent variable from
knowledge of predictor variable(s)• linear regression fits a straight line to the data•general equation of a straight line …
•where a is the intercept and b is the slope, or gradient, of the line
•fit this line by eye – subjective•method of least squares
bxay
Practical Example•data from a study of foetal development•date of conception (and hence age) of the foetus is known
accurately•height of the foetus (excluding the legs) is known from
ultrasound scan•age and length of the foetus are clearly related•aim is to model the length and age data and use this to assess
whether a foetus of known age is growing at an appropriate rate
Descriptive Statistics
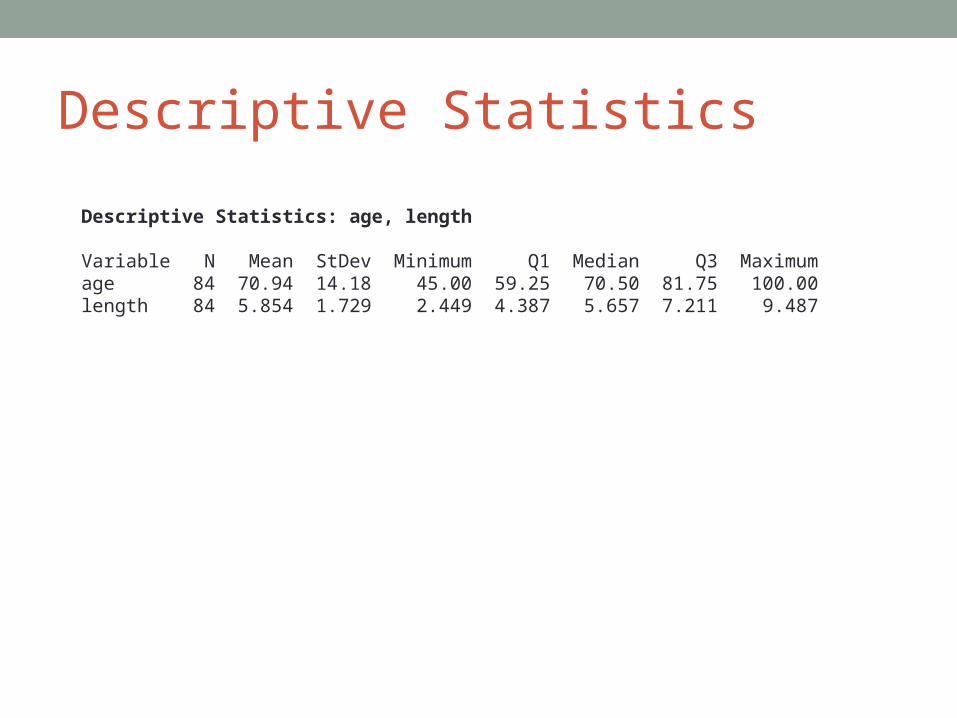
Descriptive Statistics: age, length
Variable N Mean StDev Minimum Q1 Median Q3 Maximumage 84 70.94 14.18 45.00 59.25 70.50 81.75 100.00length 84 5.854 1.729 2.449 4.387 5.657 7.211 9.487
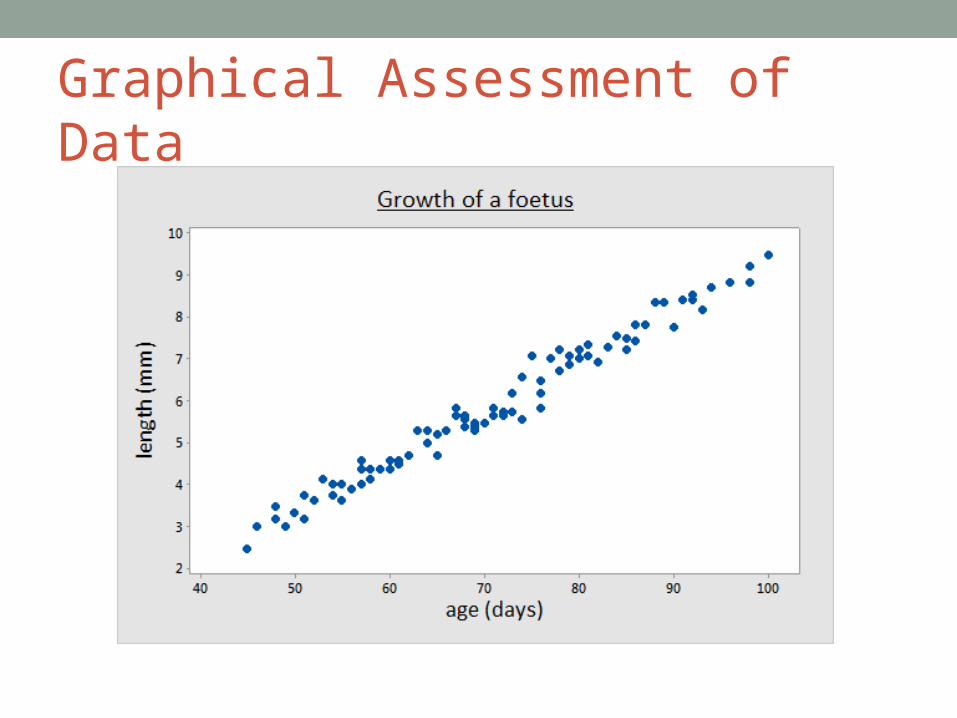
Graphical Assessment of Data
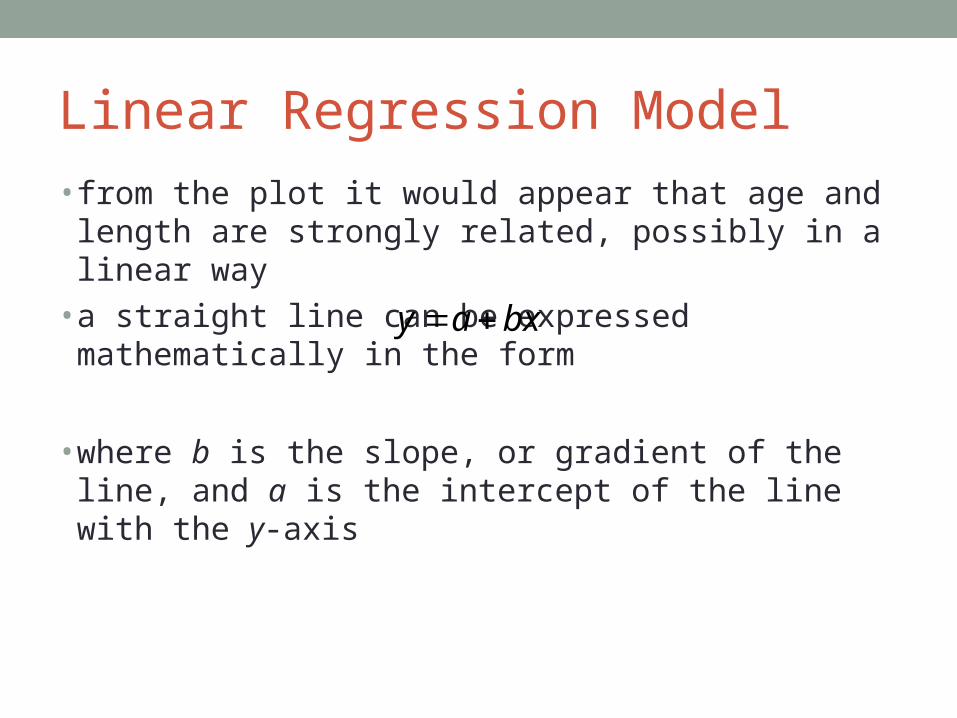
Linear Regression Model• from the plot it would appear that age and length are strongly
related, possibly in a linear way• a straight line can be expressed mathematically in the form
• where b is the slope, or gradient of the line, and a is the intercept of the line with the y-axis
bxay
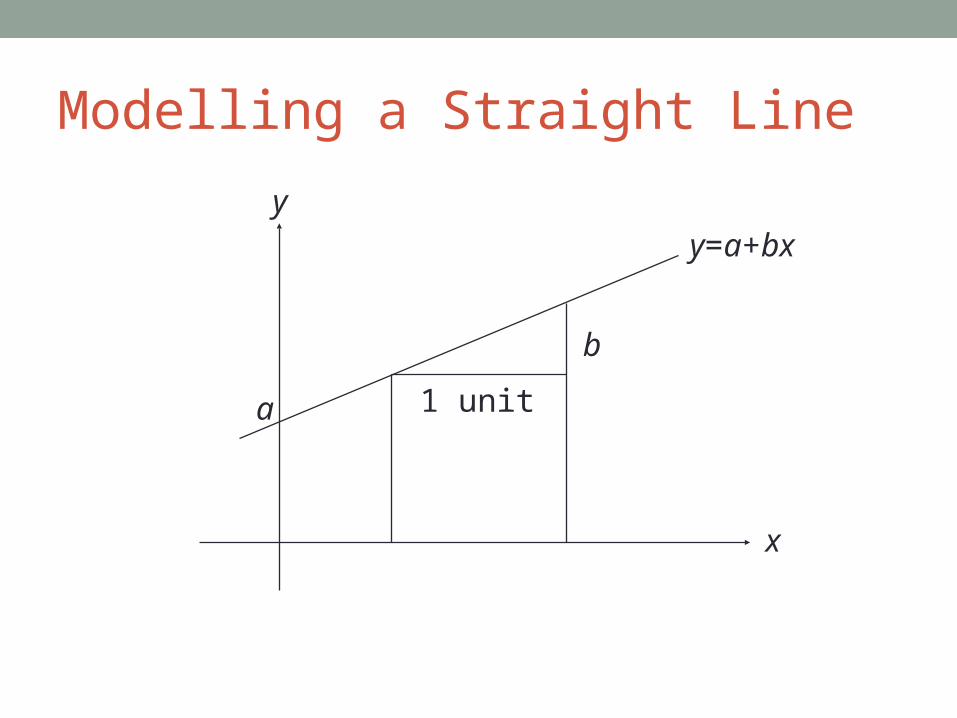
Modelling a Straight Line
a 1 unit
b
x
y=a+bx
y
Fitting a Regression Line•if the data lay on a straight line and there was no random
variation about that line, it would be simple to draw an approximate straight line on the scatter-plot
•this is not the case with real data•for a given value of the explanatory variable there will be a
range of observed values for the response variable•different assessors would estimate different regression lines•in order to have objective results, it is necessary to define
some criteria in order to produce the ‘best fitting straight line’ for a given set of data
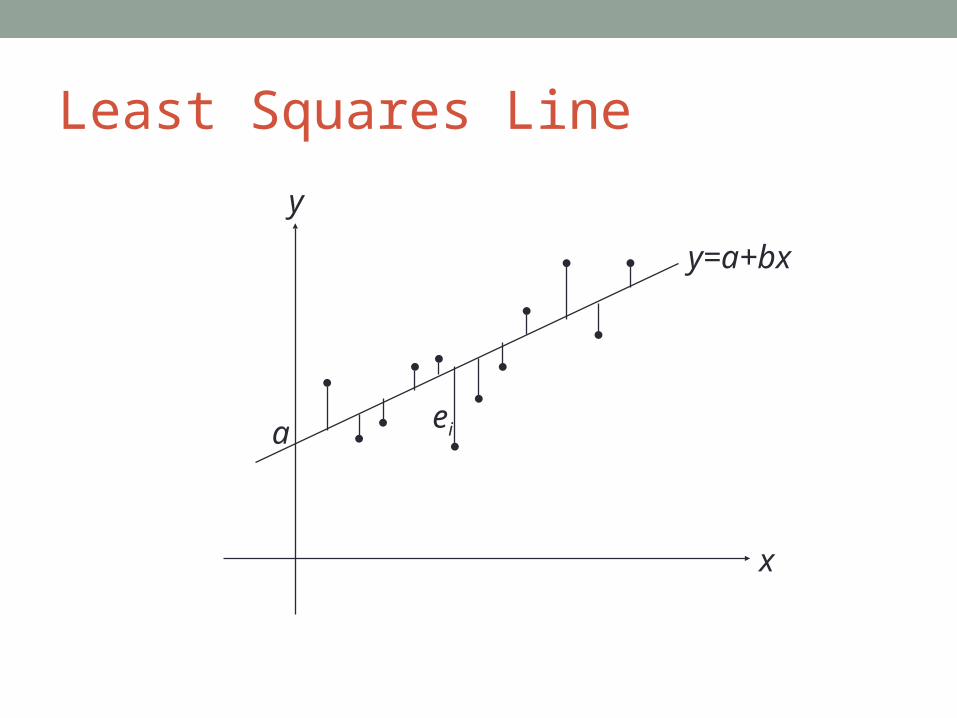
Method of Least Squares•define the position of the line which, on average, has all the
points as close to it as possible•the method of least squares finds the straight line which
minimises the sum of the squared vertical deviations from the fitted line
•the best fitting line is called the least squares linear regression line
•the vertical distances between each point and the fitted line are called the residuals and are used in estimating the variability about the fitted line
Least Squares Line
x
a
y=a+bx
y
ei
Parameter Estimates
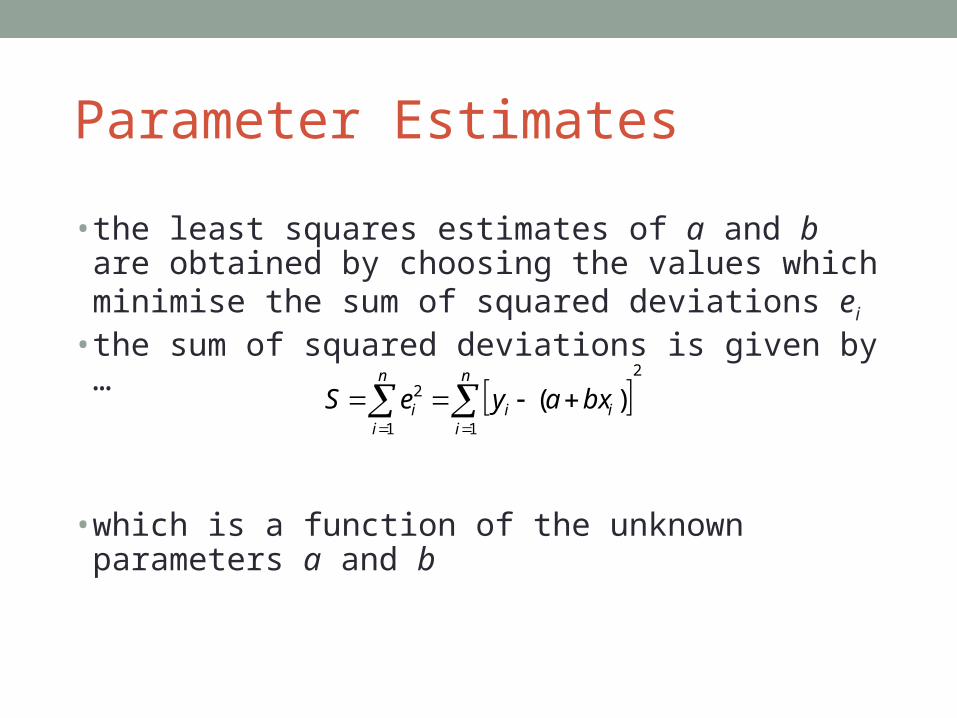
•the least squares estimates of a and b are obtained by choosing the values which minimise the sum of squared deviations ei
•the sum of squared deviations is given by …
•which is a function of the unknown parameters a and b
2
11
2 )(
n
iii
n
ii bxayeS
Interpretation of Results
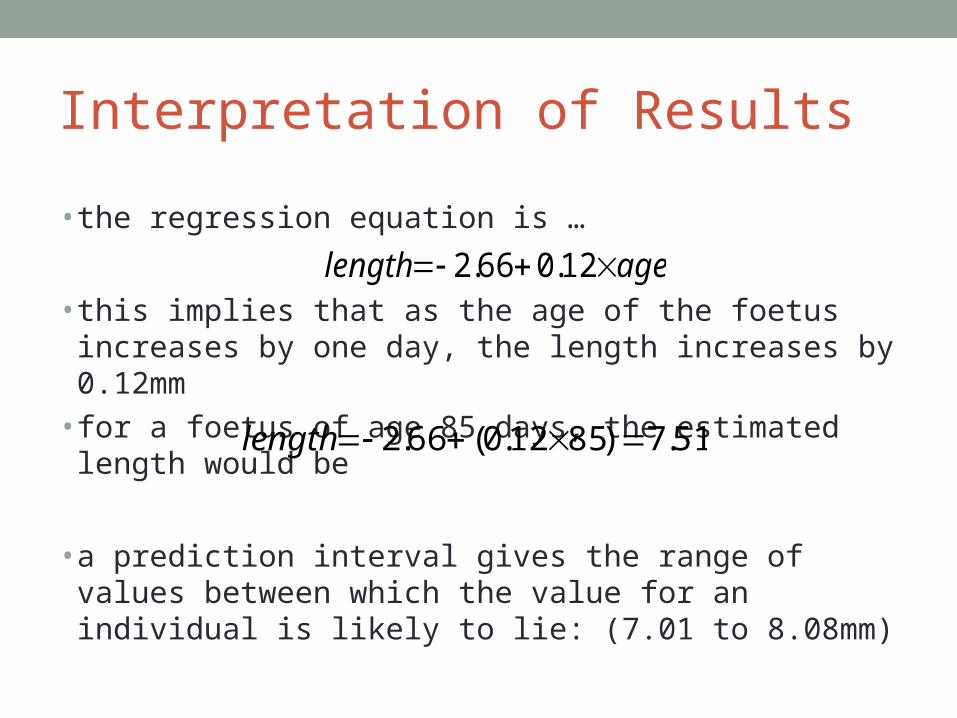
•the regression equation is …
•this implies that as the age of the foetus increases by one day, the length increases by 0.12mm
•for a foetus of age 85 days, the estimated length would be
•a prediction interval gives the range of values between which the value for an individual is likely to lie: (7.01 to 8.08mm)
agelength 12.066.2
51.7)8512.0(66.2 length
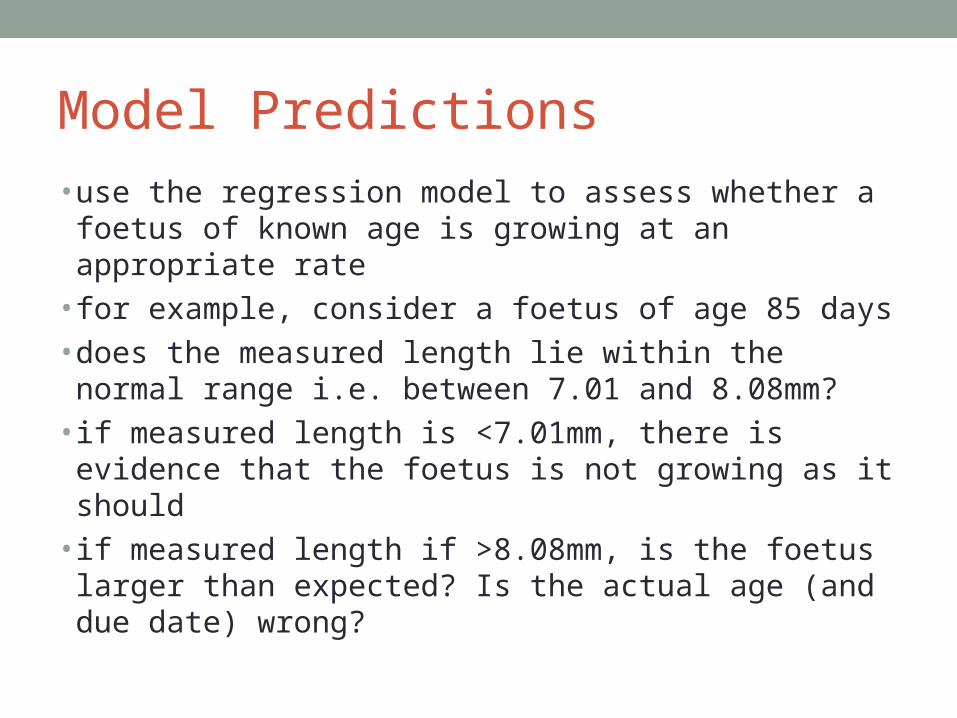
Model Predictions•use the regression model to assess whether a foetus of known
age is growing at an appropriate rate•for example, consider a foetus of age 85 days•does the measured length lie within the normal range i.e.
between 7.01 and 8.08mm?•if measured length is <7.01mm, there is evidence that the
foetus is not growing as it should•if measured length if >8.08mm, is the foetus larger than
expected? Is the actual age (and due date) wrong?

Uses of Regression Lines•the least squares regression line may be used to estimate a
value of the dependent variable given a value of the independent variable
•the value of the independent variable (x) should be within in the range of the given data
•the predicted value of the dependent variable (y) is only an estimate
•even though the fit of the regression line is good, it does not prove there is a relationship between the variables outside of the values from the given experiment (use care in predicting)

Coefficient of Determination• the R-Sq value of 97.6% in the output is called the coefficient of
determination
• this is a measure of the amount of variability in the data which is explained by the regression line
• it therefore indicates how well the linear regression model fits the data (and therefore how accurate the predicted values using the model will be)
• the correlation (r) between foetal size and age is 0.988
• the coefficient of determination is r2 (i.e. 0.988×0.988)
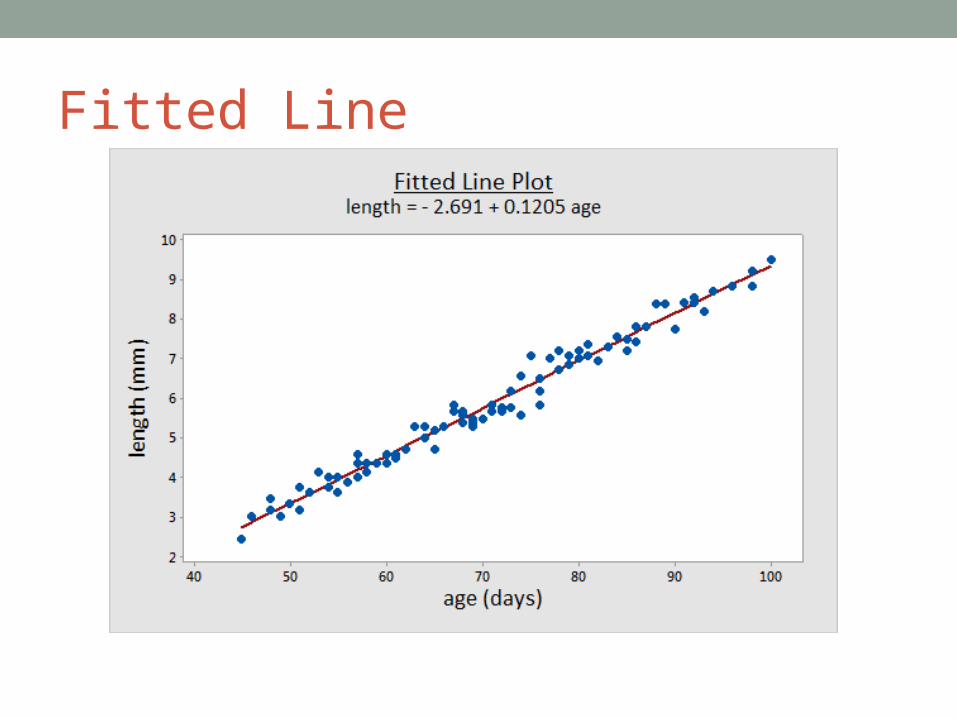
Fitted Line
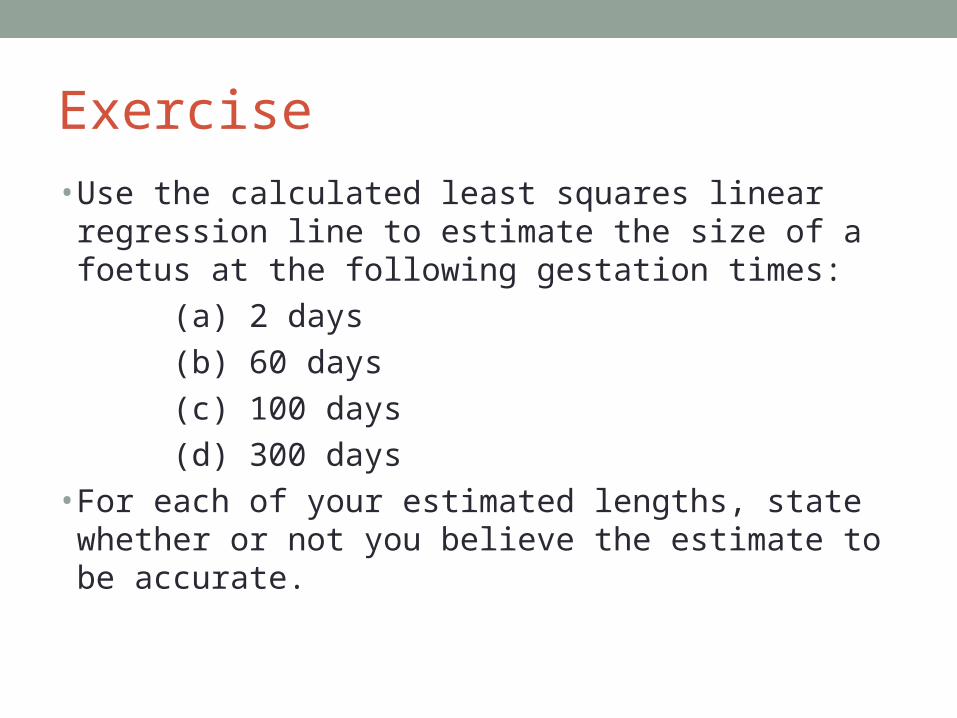
Exercise•Use the calculated least squares linear regression line to
estimate the size of a foetus at the following gestation times:(a) 2 days(b) 60 days(c) 100 days(d) 300 days
•For each of your estimated lengths, state whether or not you believe the estimate to be accurate.

Interpretation•why are all the dependent variable observations (size) not the
same?•depends on the independent variable (age)•total variation present is the total variation from the mean line
(‘best’ estimate of size if no linear relationship)•97.6% of the variation in size is explained by the linear
relationship with the variable age•2.4% of the variation is not explained – could be random (since
not every foetus of the same age will be the same size) or caused by another variable (e.g. smoking habits of mother, diet, etc.)