correlation and covariance - the college of engineering at...
TRANSCRIPT
Correlation and Covariance
R. F. Riesenfeld(Based on web slides by
James H. Steiger)
Goals
⇨ Introduce concepts of
Covariance
Correlation
⇨ Develop computational formulas
2R F Riesenfeld Sp 2010 CS5961 Comp Stat
Covariance
⇨ Variables may change in relation to each other
⇨ Covariance measures how much the movement in one variable predicts the movement in a corresponding variable
3R F Riesenfeld Sp 2010 CS5961 Comp Stat
Smoking and Lung Capacity
⇨ Example: investigate relationship between cigarette smoking and lung capacity
⇨ Data: sample group response data on smoking habits, and measured lung capacities, respectively
R F Riesenfeld Sp 2010 CS5961 Comp Stat 4
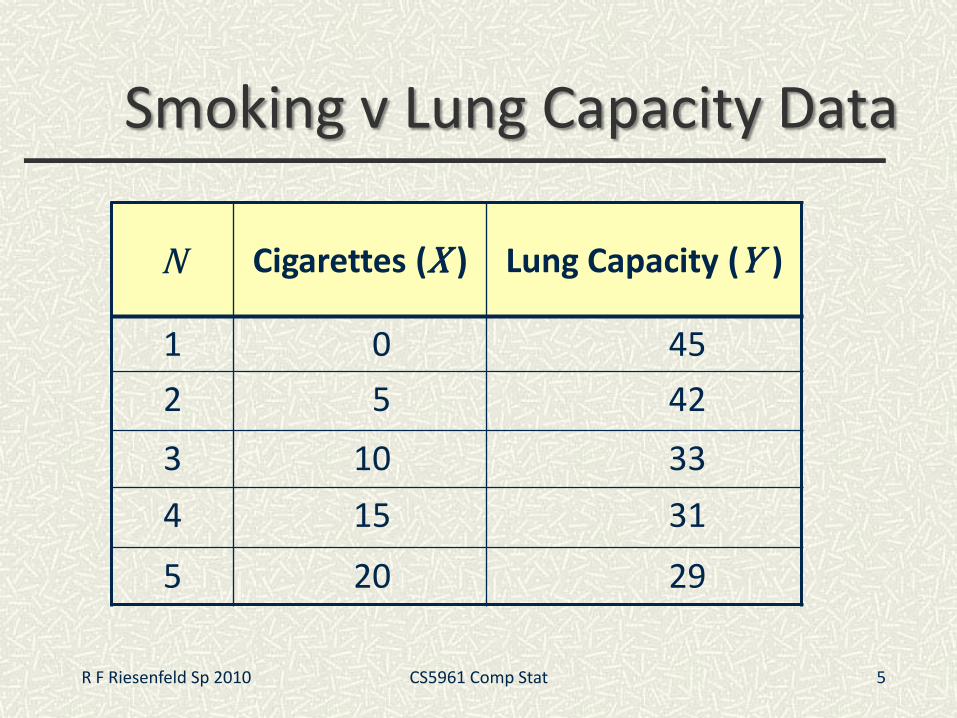
Smoking v Lung Capacity Data
5
N Cigarettes (X ) Lung Capacity (Y )
1 0 45
2 5 42
3 10 33
4 15 31
5 20 29
R F Riesenfeld Sp 2010 CS5961 Comp Stat
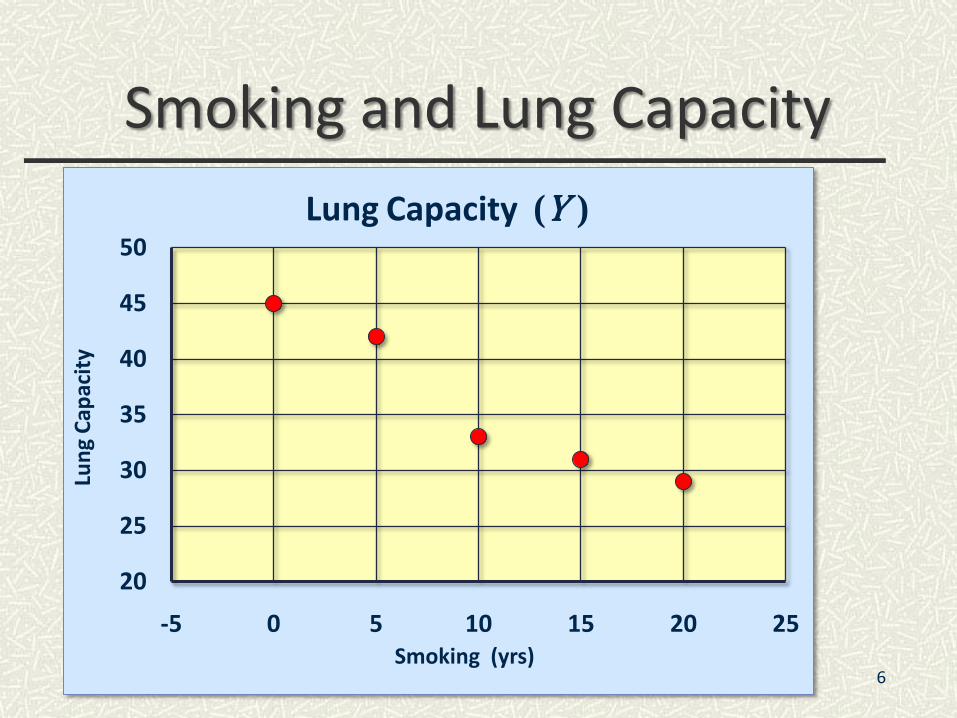
Smoking and Lung Capacity
6
20
25
30
35
40
45
50
-5 0 5 10 15 20 25
Lun
g C
apac
ity
Smoking (yrs)
Lung Capacity (Y )
Smoking v Lung Capacity
⇨ Observe that as smoking exposure goes up, corresponding lung capacity goes down
⇨ Variables covary inversely
⇨ Covariance and Correlation quantify relationship
7R F Riesenfeld Sp 2010 CS5961 Comp Stat

Covariance
⇨ Variables that covary inversely, like smoking and lung capacity, tend to appear on opposite sides of the group means
When smoking is above its group mean, lung capacity tends to be below its group mean.
⇨ Average product of deviation measures extent to which variables covary, the degree of linkage between them
8R F Riesenfeld Sp 2010 CS5961 Comp Stat
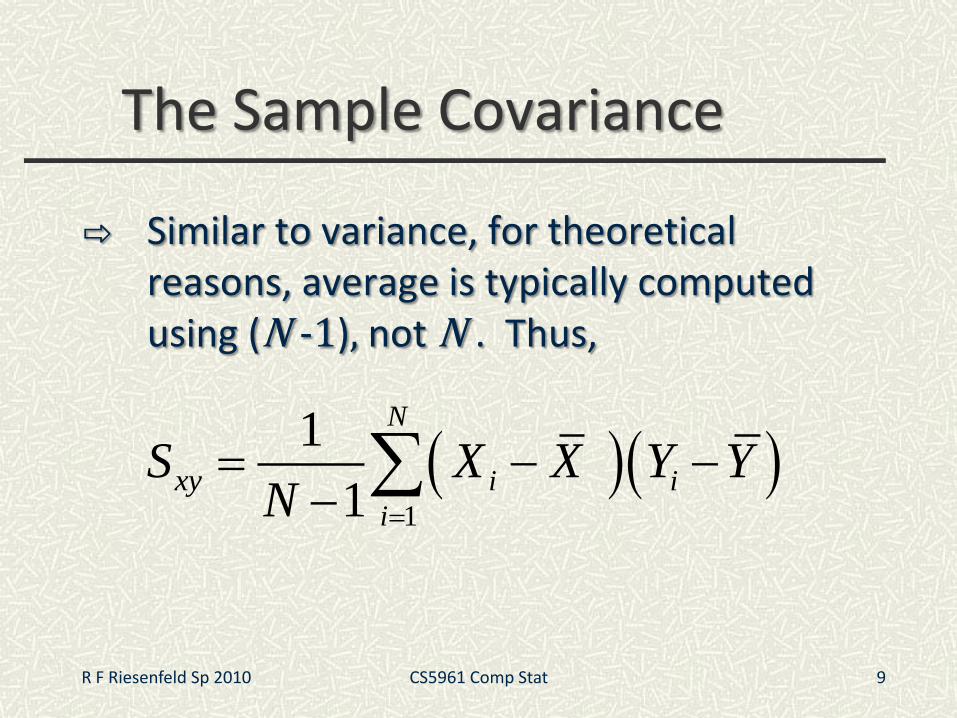
The Sample Covariance
⇨ Similar to variance, for theoretical reasons, average is typically computed using (N -1), not N . Thus,
1
1
1
N
i i
i
xyS X X Y YN
9R F Riesenfeld Sp 2010 CS5961 Comp Stat
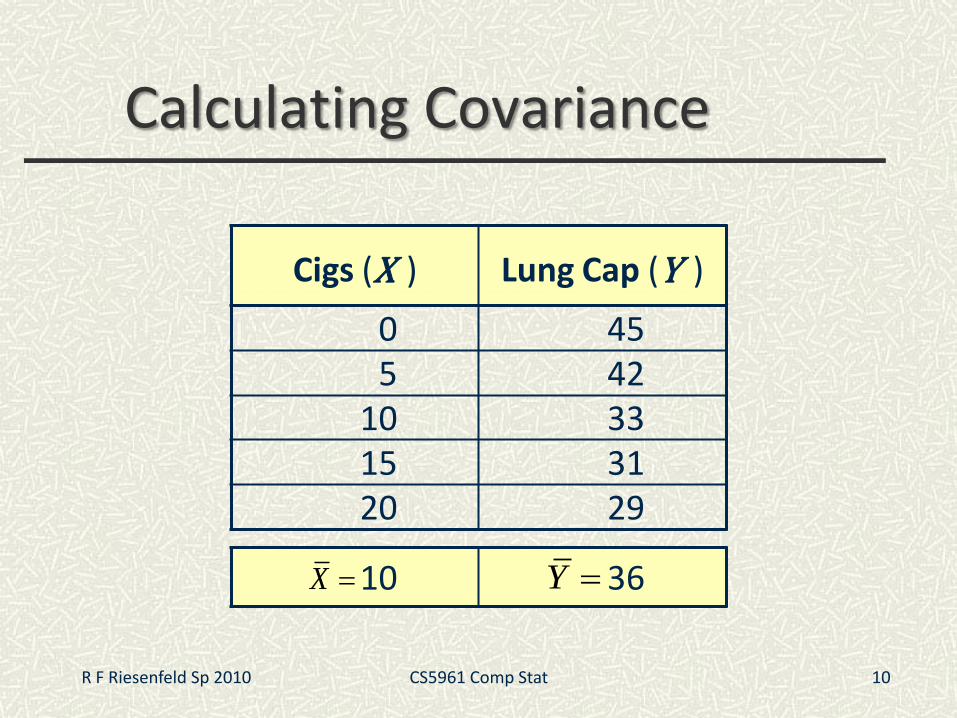
Cigs (X ) Lung Cap (Y )
0 455 42
10 3315 3120 29
10 36
Calculating Covariance
R F Riesenfeld Sp 2010 CS5961 Comp Stat 10
X Y
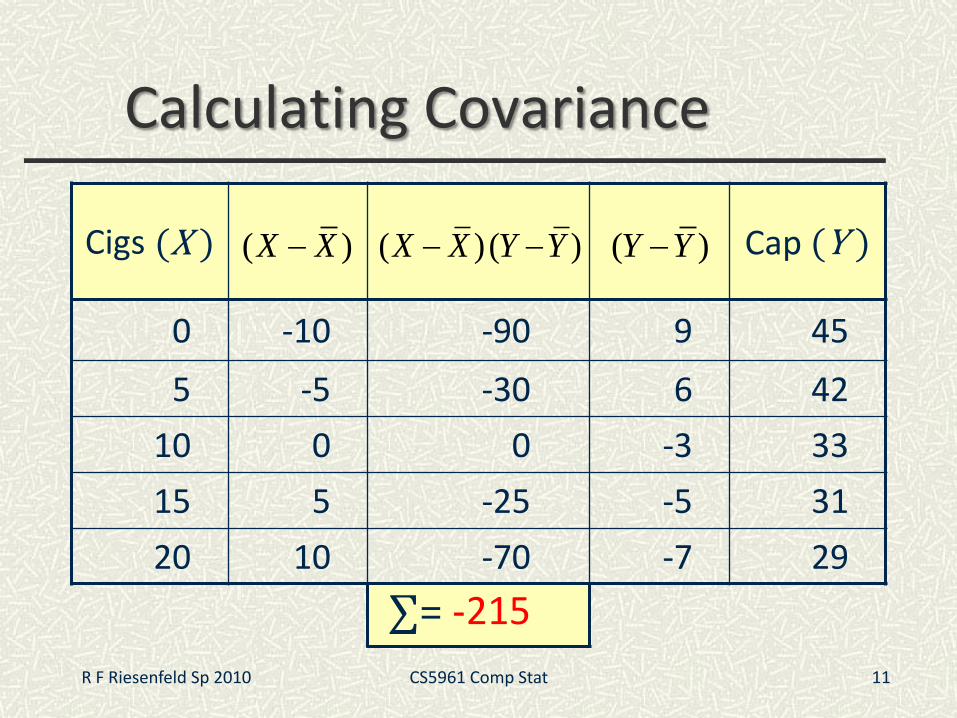
Calculating Covariance
Cigs (X ) Cap (Y )
0 -10 -90 9 45
5 -5 -30 6 42
10 0 0 -3 33
15 5 -25 -5 31
20 10 -70 -7 29
∑= -215
R F Riesenfeld Sp 2010 CS5961 Comp Stat 11
( ) ( )X X Y Y ( )Y Y ( )X X
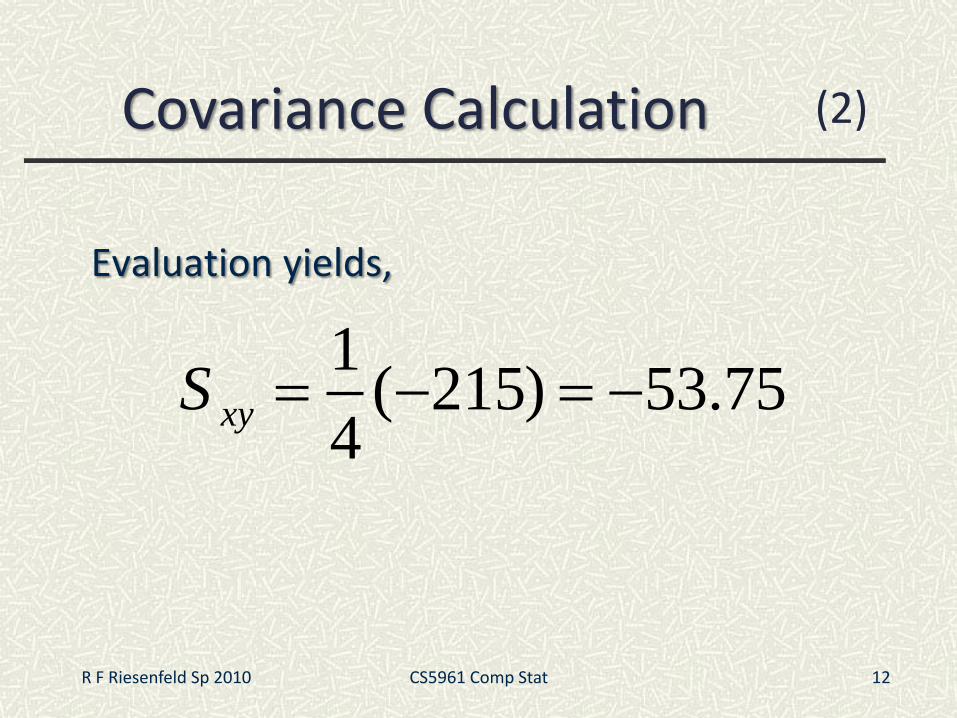
Evaluation yields,
1( 215) 53.75
4xyS
12
Covariance Calculation (2)
R F Riesenfeld Sp 2010 CS5961 Comp Stat
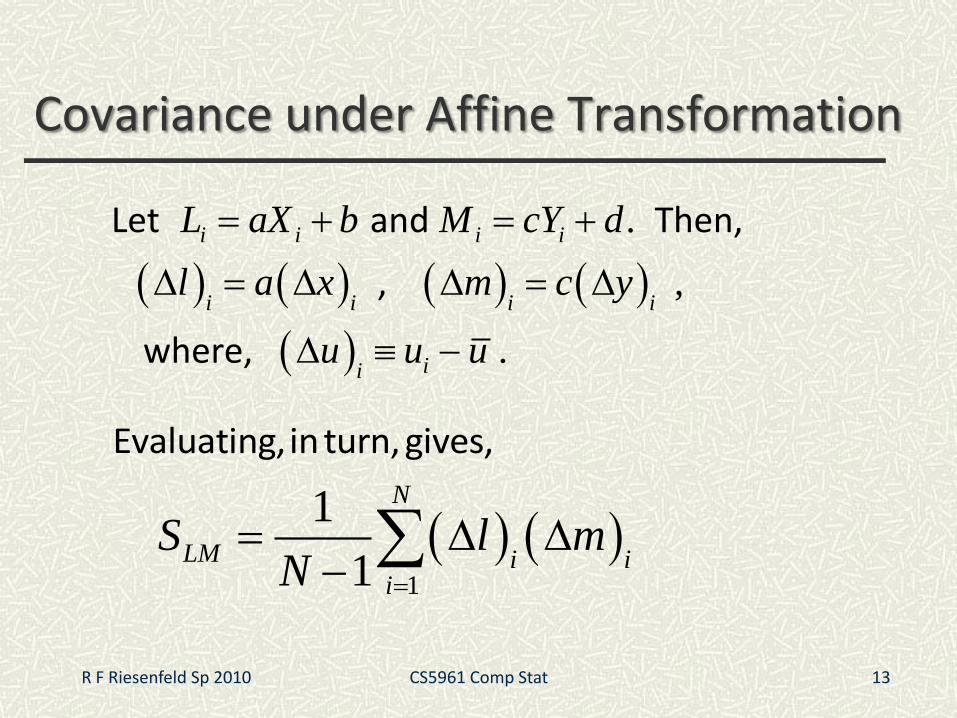
Covariance under Affine Transformation
.
,
.
i i i i
i i i i
ii
L aX b M cY d
l a x m c y
u u u
Let and Then,
,
where,
1
1
1
N
LM i ii
S l mN
13
Evaluating, in turn, gives,
R F Riesenfeld Sp 2010 CS5961 Comp Stat
14
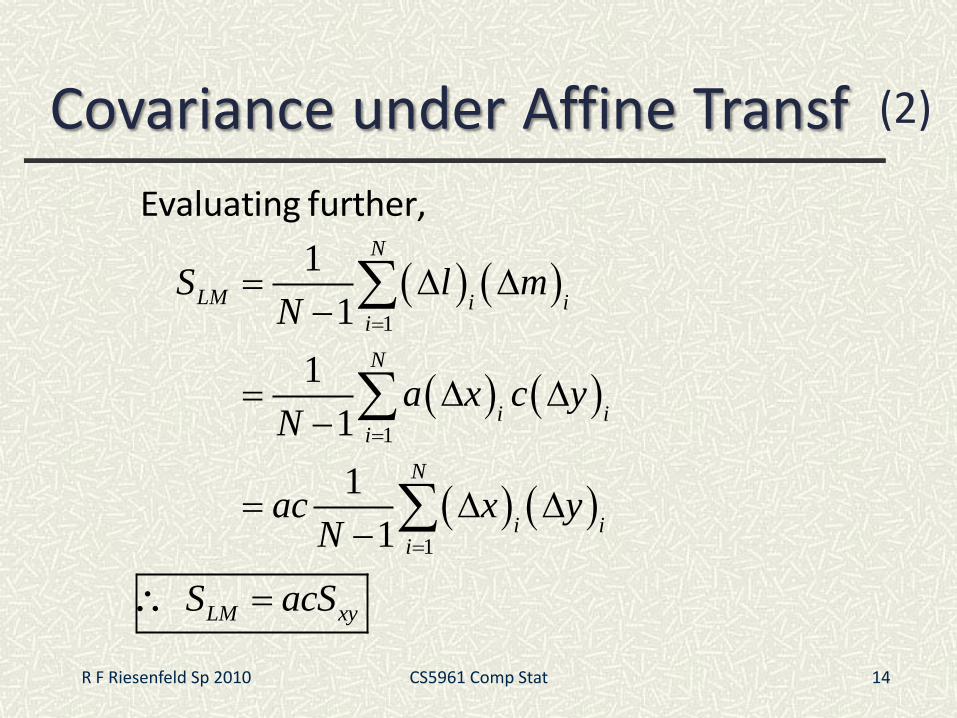
Covariance under Affine Transf (2)
1
1
1
1
1
1
1
1
1
N
LM i ii
N
i ii
N
i ii
S l mN
a x c yN
ac x yN
Evaluating further,
LM xyS acS
R F Riesenfeld Sp 2010 CS5961 Comp Stat
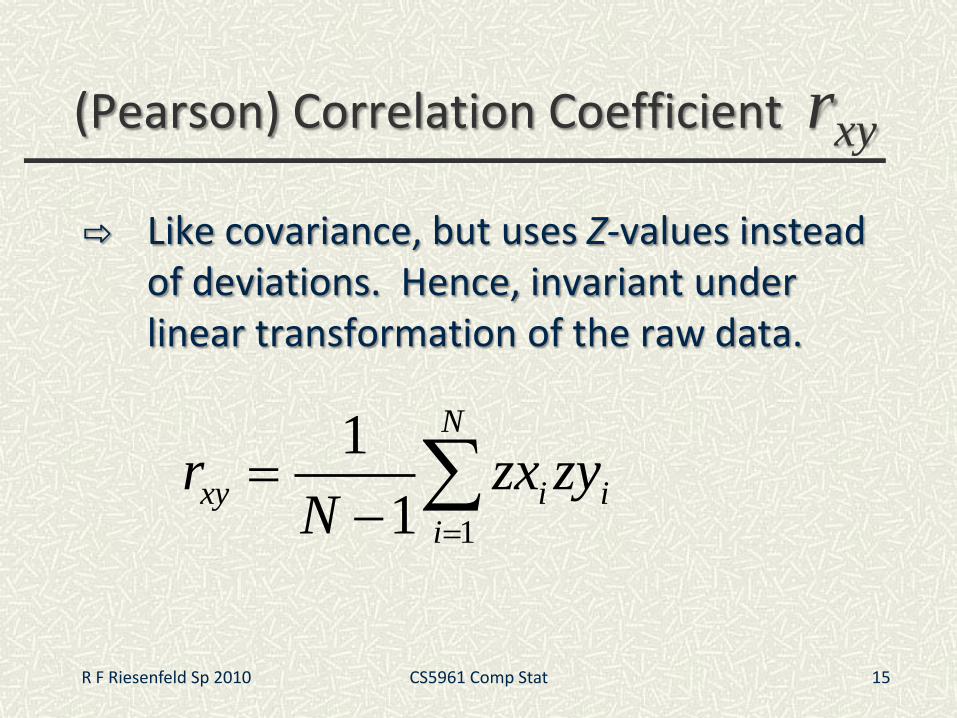
(Pearson) Correlation Coefficient rxy
⇨ Like covariance, but uses Z-values instead of deviations. Hence, invariant under linear transformation of the raw data.
1
1
1
N
xy i i
i
r zx zyN
15R F Riesenfeld Sp 2010 CS5961 Comp Stat
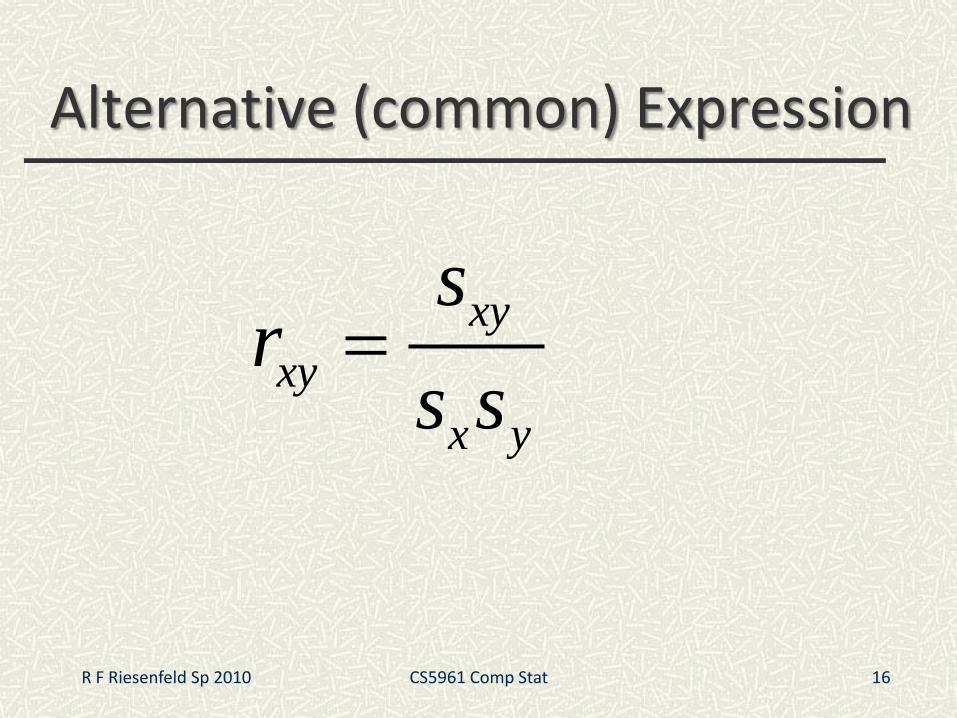
Alternative (common) Expression
16
xy
xy
x y
sr
s s
R F Riesenfeld Sp 2010 CS5961 Comp Stat
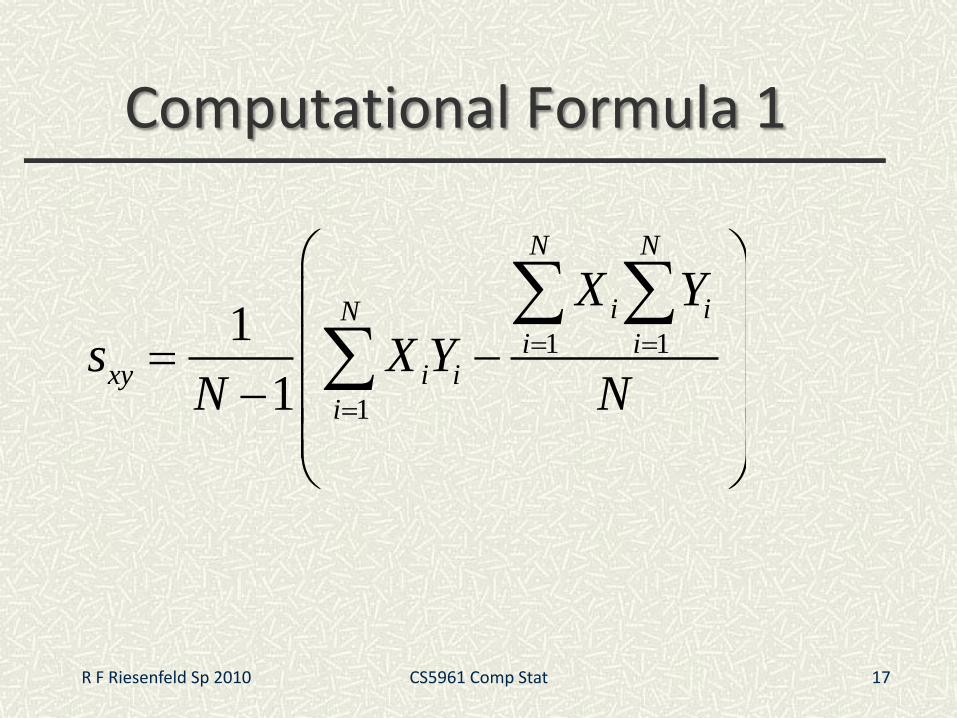
Computational Formula 1
1 1
1
1
1
N N
i iNi i
xy i i
i
X Y
s X YN N
17R F Riesenfeld Sp 2010 CS5961 Comp Stat
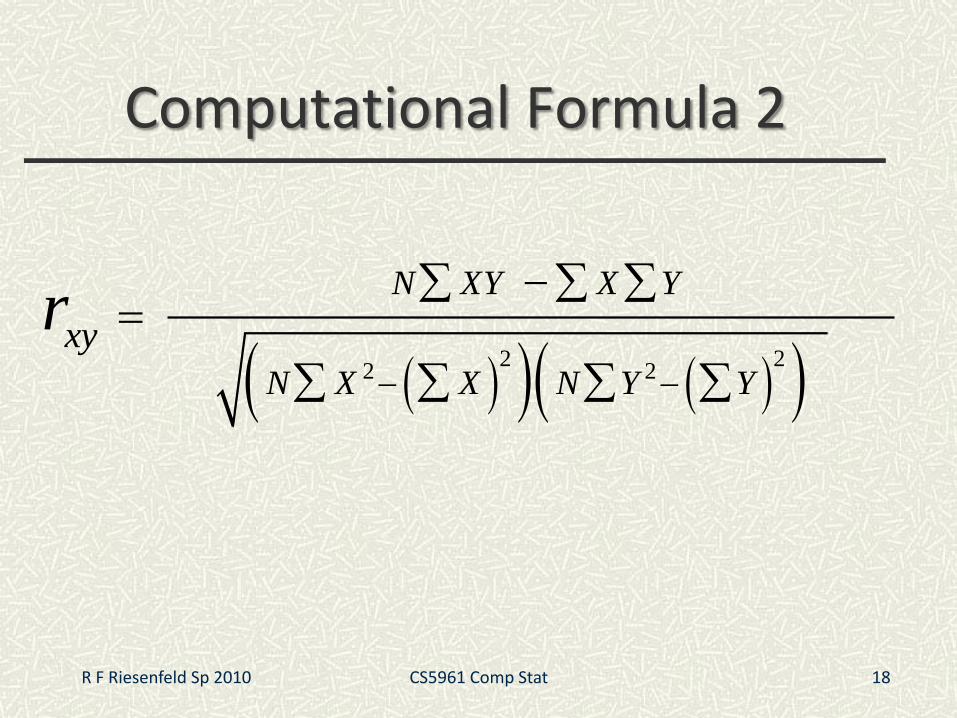
Computational Formula 2
18
2 22 2
N XY X Y
N X X N Y Y
xyr
R F Riesenfeld Sp 2010 CS5961 Comp Stat
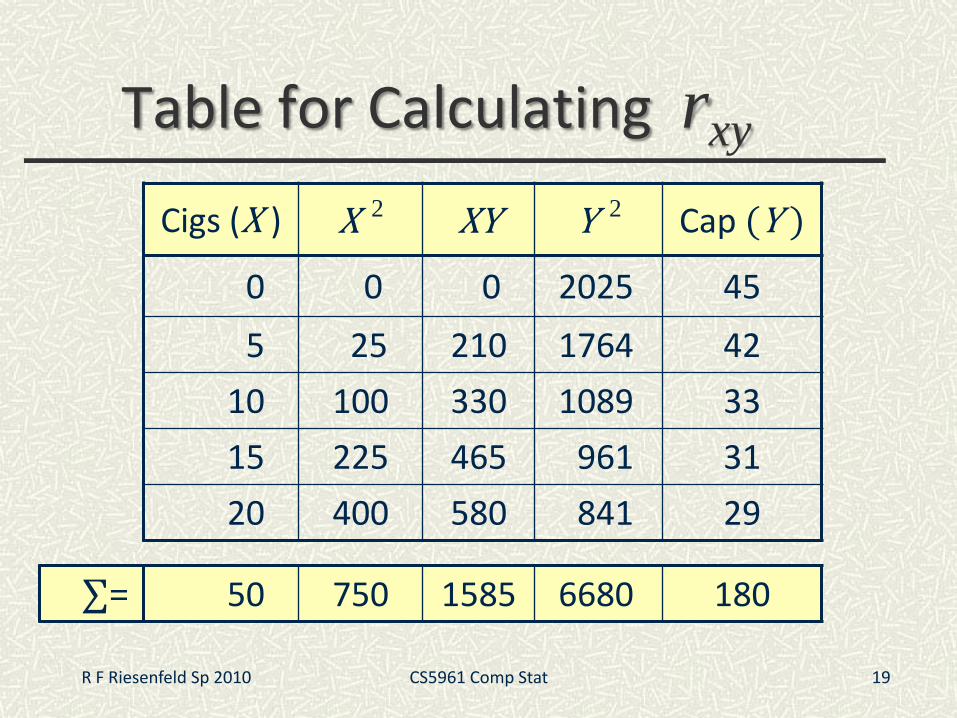
Table for Calculating rxy
19
Cigs (X ) X 2 XY Y 2 Cap (Y )
0 0 0 2025 45
5 25 210 1764 42
10 100 330 1089 33
15 225 465 961 31
20 400 580 841 29
∑= 50 750 1585 6680 180
R F Riesenfeld Sp 2010 CS5961 Comp Stat
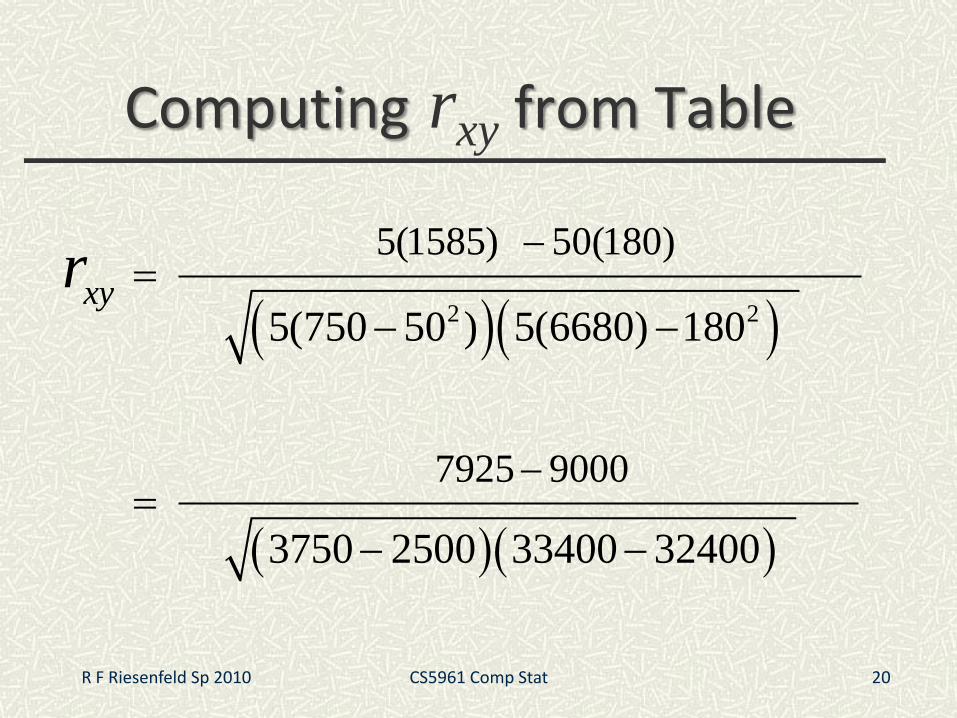
Computing rxy from Table
2 2
5(1585) 50(180)
7925 9000
5(750 50 ) 5(6680) 180
3750 2500 33400 32400
xyr
20R F Riesenfeld Sp 2010 CS5961 Comp Stat
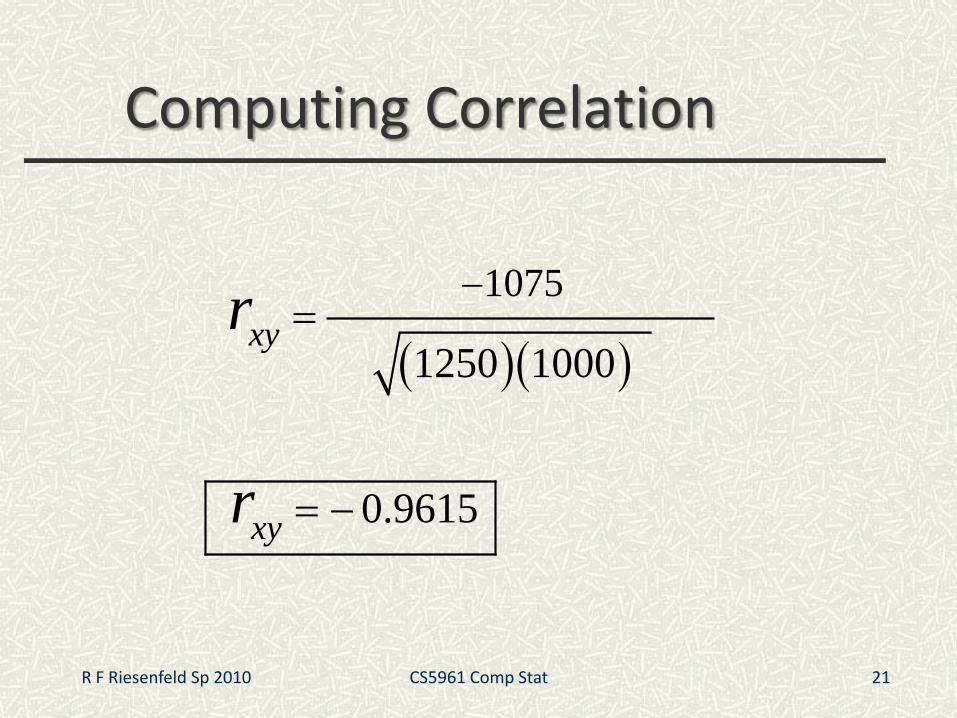
Computing Correlation
1075
1250 1000
0.9615
xy
xy
r
r
21R F Riesenfeld Sp 2010 CS5961 Comp Stat
Conclusion
⇨ rxy = -0.96 implies almost certainty
smoker will have diminish lung capacity
⇨ Greater smoking exposure implies greater likelihood of lung damage
22
0.96xy
r
R F Riesenfeld Sp 2010 CS5961 Comp Stat
End
Covariance & Correlation
23
Notes
R F Riesenfeld Sp 2010 CS5961 Comp Stat