correlates of physician burnout across regions and specialties: a
TRANSCRIPT
Lee et al. Human Resources for Health 2013, 11:48http://www.human-resources-health.com/content/11/1/48
RESEARCH Open Access
Correlates of physician burnout across regionsand specialties: a meta-analysisRaymond T Lee1*, Bosu Seo2, Steven Hladkyj3, Brenda L Lovell4 and Laura Schwartzmann5
Abstract
Background: Health care organizations globally realize the need to address physician burnout due to its closelinkages with quality of care, retention and migration. The many functions of health human resources includeidentifying and managing burnout risk factors for health professionals, while also promoting effective coping. Ourstudy of physician burnout aims to show: (1) which correlates are most strongly associated with emotionalexhaustion (EE) and depersonalization (DP), and (2) whether the associations vary across regions and specialties.
Methods: Meta-analysis allowed us to examine a diverse range of correlates. Our search yielded 65 samples ofphysicians from various regions and specialties.
Results: EE was negatively associated with autonomy, positive work attitudes, and quality and safety culture. It waspositively associated with workload, constraining organizational structure, incivility/conflicts/violence, low qualityand safety standards, negative work attitudes, work-life conflict, and contributors to poor mental health. We found asimilar but weaker pattern of associations for DP.Physicians in the Americas experienced lower EE levels than physicians in Europe when quality and safety cultureand career development opportunities were both strong, and when they used problem-focused coping. The formerexperienced higher EE levels when work-life conflict was strong and they used ineffective coping. Physicians inEurope experienced lower EE levels than physicians in the Americas with positive work attitudes. We found a similarbut weaker pattern of associations for DP.Outpatient specialties experienced higher EE levels than inpatient specialties when organization structures wereconstraining and contributors to poor mental health were present. The former experienced lower EE levels whenautonomy was present. Inpatient specialties experienced lower EE levels than outpatient specialties with positivework attitudes. As above, we found a similar but weaker pattern of associations for DP.
Conclusions: Although we could not infer causality, our findings suggest: (1) that EE represents the core burnoutdimension; (2) that certain individual and organizational-level correlates are associated with reduced physicianburnout; (3) the benefits of directing resources where they are most needed to physicians of different regions andspecialties; and (4) a call for research to link physician burnout with performance.
Keywords: Physician burnout, Work engagement, Health and safety, Mental and physical well-being,Coping strategies, Health behaviors
BackgroundHealth care organizations globally realize the need toaddress physician burnout due to its close linkages withquality of care, retention and migration. A 2008 WorldHealth Organization (WHO) report found that themajor factors for turnover and migration were poor or
* Correspondence: [email protected] of Business Administration, University of Manitoba,181 Freedman Crescent, Winnipeg, MB R3T 5V4, CanadaFull list of author information is available at the end of the article
© 2013 Lee et al.; licensee BioMed Central LtdCommons Attribution License (http://creativecreproduction in any medium, provided the or
dangerous working conditions, insufficient resources,limited career opportunities, and economic instability[1]. The field of health human resources (HHR) dealswith human resource issues for workers in the healthsector, and has been suggested as a way to strengthenhealth system performance and to improve well-being forhealth professionals [2]. The many functions of HHRinclude identifying and managing the individual and
. This is an Open Access article distributed under the terms of the Creativeommons.org/licenses/by/2.0), which permits unrestricted use, distribution, andiginal work is properly cited.
Lee et al. Human Resources for Health 2013, 11:48 Page 2 of 16http://www.human-resources-health.com/content/11/1/48
environmental burnout risk factors, while simultaneouslypromoting effective coping [3-5].Burnout is a specific pattern of response to chronic
work-related stress that is a serious issue for many physi-cians [6]. Physician burnout is characterized primarily by adepletion of mental energy, known as emotional exhaustion(EE). With such depletion, providers feel unable to give ofthemselves, which leads to cynical attitudes and detachedfeelings toward patients, known as depersonalization (DP).The third burnout dimension is negative self-appraisal,especially in the competencies required to work withothers, known as diminished personal accomplishment [6].Our study will focus on the EE and DP dimensions only.The frameworks to explain the development of burnout
in health professionals have ranged from personal charac-teristics to work organization variables or a combination ofthe two. For example, Wiskow et al.’s model emphasizesthe impact of the work environment, which is influencedby: (a) organizational functionality; (b) organizational cul-ture; (c) management and patient support; (d) staff devel-opment; and (e) work-family balance [7]. These elementshave been linked to burnout, medical errors and quality ofcare [7,8]. In turn, burnout is posited to be a risk factor forincreased turnover and migration in physicians [2,8,9].Existing evidence supports models with personal and workcharacteristics. The three levels of change to reduce burn-out risk are: (1) modifying the organizational structureand work processes; (2) improving the fit between theorganization and the individual physician, includingprofessional development programs to facilitate betteradaption to the work environment; and (3) individual-levelactions to reduce stress and poor health symptoms througheffective coping and promoting healthy behaviors [2,3,10].The aims of our study of physicians are to determine
which correlates would be most strongly associated withEE and DP, and whether the associations would varyacross geographical regions and specialties. The threelevels of burnout risk served as the framework for thecategorization of variables that we created in this study.Our findings will help the field of HHR to identify personaland work characteristics that are the most significant riskfactors for EE and DP, and direct resources most neededto physicians of different regions and specialties.
MethodsWe chose meta-analysis in this study. The use ofmulti-sample data of physicians from different regionsand specialties allows for the examination of a morediverse range of risk factors than would be possiblewith any single-sample data. Our study followed thePreferred Reporting Items for Systematic Reviewsand Meta-Analyses (PRISMA) guidelines and reportingstandards [11].
Literature searchWe searched for published studies from 1991 to 2011,using the terms, ‘physician/doctor emotional exhaus-tion,’ ‘physician/doctor burnout,’ and ‘physician/doctorcoping,’ with the search engines: Cochrane, Embase,TheFreeLibrary.com, Google, Google Scholar, LILACS,PsycINFO, PubMed, SciELO and Scopus. Our searchyielded 92 studies of medical doctors, but 27 were ex-cluded either because they each included physicians withother health professionals (k = 13), or did not report or re-spond to email requests for the necessary statistics (k =14). The remaining (K = 65) sampled exclusively physi-cians and provided either the sample correlations (r) orstatistics that could be converted to r. The studies used inour meta-analysis are listed in the Appendix. Four of thesewere published in Spanish, with the variables and textrecorded and translated into English by the fifth author.
ProcedureFor the coding of sample characteristics, we coded eachstudy sample on the method of survey administration,response rate, sample size, gender distribution, mean yearsof age, mean years in practice, country of the sample andmedical specialty distribution.For the coding of statistics, the internal consistency
reliability estimates (Cronbach’s α) and the associationsbetween each correlate with EE and DP were recorded.For conversion to r, 30 studies provided either a 2 × 2 χ2,
t-ratio, one-way F-ratio or odds ratio (OR). To convertthe χ2 to r, we used the formula [12]:
r ¼ χ2=N� �1=2
; ð1Þ
and to convert the t-ratio or F-ratio to r, we used theformula [12]:
r ¼ t2= t2 þ df� �� �1=2
: ð2Þ
To convert the OR to r, we used the formula [13]:
r ¼ OR3=4−1� �
= OR3=4 þ 1� �
: ð3Þ
For the correlates, the classification of variables as eitherenvironmental drivers or constraints were informed byLewin’s field theory [14], which posits that behavior is thefunction of the person and the environment, and Loweand Chan’s classification of healthy work environmentindicators [15]. The remaining variables were categorizedeither as work-life conflict, contributors to good health,contributors to poor mental health or coping strategies(see the correlates under each of the categories in Table 1).The fourth author classified all the variables, and thefirst author checked the categorizations. The inter-rateragreement for the classification was 100%.

Table 1 Weighted mean reliability estimates of all variables
k n αcorrelate αEE αDPWork engagement drivers
Recognition/feedback 4 2,125 0.79 0.86 nd
Autonomy 7 2,821 0.71 0.89 0.73
Organization/peer support 3 1,626 nd 0.87 0.69
Adequate resources 2 1,089 nd 0.87 0.68
Work engagement constraints
Professional values 4 686 0.80 nd 0.70
Organization structures 5 1,084 nd 0.88 nd
Inadequate resources 5 1,023 nd 0.89 0.78
Role ambiguity/conflict 3 622 nd 0.87 0.80
Insufficient input 4 437 0.89 0.89 0.79
Workload 19 6,205 0.74 0.88 0.75
Inadequate skills/preparation 4 1,242 nd 0.87 0.80
Position-specific demands 10 3,550 0.76 0.88 0.76
Work attitudes drivers 17 13,271 0.61 0.84 0.75
Work attitudes constraints 13 4,652 0.74 0.90 0.76
Health and safety drivers
Quality and safety culture 8 8,618 0.67 0.87 0.69
Clinical skills 3 1,033 0.81 0.88 0.69
Professional development 6 1,377 nd nd nd
Health and safety constraints
Incivility/conflicts/violence 7 1,816 0.84 0.89 0.79
Lack of quality and safety 15 5,612 0.80 0.88 0.76
Work-life/home conflict 14 3,846 0.80 0.88 0.73
Contributions to poormental health
23 7,345 0.78 0.87 0.69
Contributions to good health 6 3,684 nd 0.87 0.80
Adaptive coping
Social support 6 2,297 0.74 0.87 0.80
Problem-focused 8 1,856 0.75 0.87 0.78
Ineffective coping 9 2,007 0.78 0.87 0.76
α, Cronbach’s α weighted mean reliability estimate; DP, depersonalization; EE,emotional exhaustion; k, number of samples; n, sample size across k; nd, noestimate computed.
Lee et al. Human Resources for Health 2013, 11:48 Page 3 of 16http://www.human-resources-health.com/content/11/1/48
The correlates classified under work engagement driversare: recognition/feedback, autonomy, organization/peersupport and adequate resources. The correlates classifiedunder work engagement constraints are: professional values(for example, compromise of beliefs), organization struc-tures (for example, supervision, inflexible work arrange-ments), inadequate resources, role ambiguity/conflict,insufficient input, workload, inadequate skills/preparation,and position-specific demands (for example, patient suffer-ing and emotions). Work attitudes drivers include job andprofessional satisfaction, and organizational commitment.Work attitudes constraints include lack of motivation, car-eer regret and intent to leave profession. The correlates
classified under health and safety drivers are: quality andsafety culture (for example, time for patients, managementof patient-load), clinical skills, and professional develop-ment. The correlates classified under health and safety con-straints are: incivility/conflicts/violence, and lack of qualityand safety (for example, ergonomics and work-related haz-ards). Work-life/home conflict is incompatibility betweenprofessional and personal obligations and commitments.Contributors to poor mental health include fatigue, anxietyand depression. Contributors to good health include relax-ation, hobbies, time for self and others. The correlates clas-sified under adaptive coping are: social support (family,relatives, friends, outside acquaintances) and problem-focused (for example, prioritization of goals, findingmeaning, spirituality). Ineffective coping includes over-eating, inactivity and emotion-focused.
AnalysesFor point estimates, our meta-analysis did not includeany correlate examined in only one sample. Where a studyhad two or more separate item measures for a given cor-relate, we first calculated their mean r with the burnoutdimension. For each correlate with a k ≥2, we calculatedthe weighted mean meta-correlation (ρ), and ρ correctedfor within-sample measurement unreliability (ρc), usingthe formula [16]:
ρc ¼ rxy= αxαy� �1=2
; ð4Þwhere rxy = r of correlate with burnout dimension, αx =reliability estimate of correlate, αy = reliability estimate ofburnout dimension. We substituted the value of theweighted mean of Cronbach’s α or 1 when no reliabilityestimate was provided.We considered ρc ≥0.30 to have practical significance
for evaluation purposes. For example, a ρc = 0.30 betweena work constraint and burnout could mean that 66% ofphysicians in restrictive environments have high EE levels,and 66% of those in supportive environments have low EElevels [17].For dispersion around ρc, we calculated the variance of
ρc (σ2ρc), and the Q-test for homogeneity of r [16], where
significance indicates that the associations vary acrossk. For homogeneous k, the standard error of ρc (SE ρc)formula is [18]:
SE ρc homogeneous ¼ 1−ρc2
� �= n–kð Þ1=2; ð5Þ
and for heterogeneous k, the SE ρc formula is [18]:
SE ρc heterogeneous ¼ 1−ρc2
� �= n–kð Þ1=2
h iþ σ2
res=k� �n o
;
ð6Þwhere σ2res = σ2ρc – σ2 ρ. The SE ρc was used to constructthe 95% confidence interval (CI) of ρc.
Lee et al. Human Resources for Health 2013, 11:48 Page 4 of 16http://www.human-resources-health.com/content/11/1/48
For group differences, for heterogeneous k, we comparedthe difference in ρc’s between regions and between specialtygroups using the formula [12]:
Zj j− difference ¼ zc1’−zc2 ’= 1= n1–3½ � þ 1= n2–3½ �ð Þ1=2;
ð7Þ
where zc’ ¼ 1=2ð Þloge 1þ ρc� �
= 1−ρc� �� �
:
To check for publication bias, the file drawer problemexists when studies with significant results are published,while those with non-significant results are not reported.This and other types of publication bias are evidentwhen the funnel plot (r by n) is asymmetrical or skewed[19]. Publication bias was checked by: (1) estimating the kwith non-significant r that would be needed to increasethe ρc’s significance level to ≥0.05 (that is, fail-safe k or kfs)for each correlate [20], and (2) examining the funnel plotsof correlates with k ≥15.
Analytical softwareWe used the META 5.3 meta-analysis program (NationalCollegiate Software Clearinghouse, Raleigh, NC, USA)[21] to estimate the weighted mean of Cronbach’s α, ρ,ρc, σ
2ρc, SE ρc, 95% CI of ρc, Q-test for homogeneity ofr, and kfs. We used the Microsoft Excel 2010 (Microsoft,Redmond, WA, USA) spreadsheet to convert the χ2, t-ratio, one-way F-ratio and OR statistics to r’s; computethe K and N, and each group k and n descriptive statistics;and one-way F- and Z-difference tests. We used the Excelscatter chart program to create the funnel plot.
ResultsSample characteristicsTable 2 shows that the overall K = 65; N = 28,882;weighted mean for years of age = 45, weighted mean foryears in practice = 15, and weighted mean for proportionof males = 73%. All research participants were administered
Table 2 Sample distribution
k nk Years of age
Region
Americas 26 12,457 42 (14)
Europe 28 13,085 47 (4)
Asia/Australia 11 3,340 41 (4)
F-ratio, df = 2, 62 - - 2.57a
Specialty group
Inpatient 25 10,935 42 (14)
Outpatient 17 4,775 44 (3)
Mixed 23 13,172 47 (4)
F-ratio, df – 2, 62 - - 1.80
N 65 28,882 45 (9)
Values presented as weighted mean (SD). k, number of samples; nk, cumulative n a
questionnaires either through postal mail (61%), email (4%),in person (24%) or unspecified (12%), and the weightedmean response rate = 62%.For the Americas, k = 26, n = 12,457; for Europe, k = 28,
n = 13,085, and for Australia/Asia, k = 11, n = 3,340. Onaverage, the European samples were older (47 years)than either the American (42 years) or Australian/Asian(41 years) samples. On average, the American samples pro-vided a lower response rate (53%) than either the European(69%) or Australian/Asian (68%) samples.We divided the samples into three specialty groups. The
first was where, within a study sample, all the physicianssaw their patients in hospital settings (inpatient special-ties); the second was where, within a study sample, all ofthe physicians saw their patients in non-hospital settings,such as in walk-in clinics (outpatient specialties); and thethird was where, within a study sample, some physicianssaw patients in hospital settings and other physicianssaw patients in non-hospital settings (mix of inpatientand outpatient specialties). For the inpatient specialtygroup (anesthesiology, internal, gynecology, oncology,otolaryngology, pediatric, surgical), k = 25, n = 10,935; forthe outpatient specialty group (emergency medicine, infec-tious diseases, general/family, ophthalmology, psychiatry),k = 17, n = 4,775; and for the mixed group, k = 23,n = 13,172. On average, the outpatient specialty group hadfewer years of practice experience (13 years) than eitherthe inpatient specialty (16 years) or mixed (15 years)groups. On average, the outpatient specialty group provideda higher response rate (76%) than either the inpatientspecialty (63%) or mixed groups (57%).
Reliability estimatesTable 1 shows the k, n and the weighted mean ofCronbach’s α of each variable. The weighted mean ofCronbach’s α ranged from 0.61 to 0.89 for the correlates,with 15/17 (88%) above 0.70. The weighted mean of
Years in practice Males (%) Response rate (%)
16 (3) 74 (13) 53 (24)
15 (3) 72 (14) 69 (10)
15 (3) 76 (12) 68 (14)
0.90 0.39 6.28b
16 (2) 73 (16) 63 (19)
13 (3) 76 (14) 76 (14)
15 (3) 73 (12) 57 (18)
6.49b 0.28 5.89b
15 (3) 73 (14) 62 (19)
cross k. aP <0.05; bP <0.01.
Lee et al. Human Resources for Health 2013, 11:48 Page 5 of 16http://www.human-resources-health.com/content/11/1/48
Cronbach’s α ranged from 0.84 to 0.90 for EE and from0.68 to 0.80 for DP.
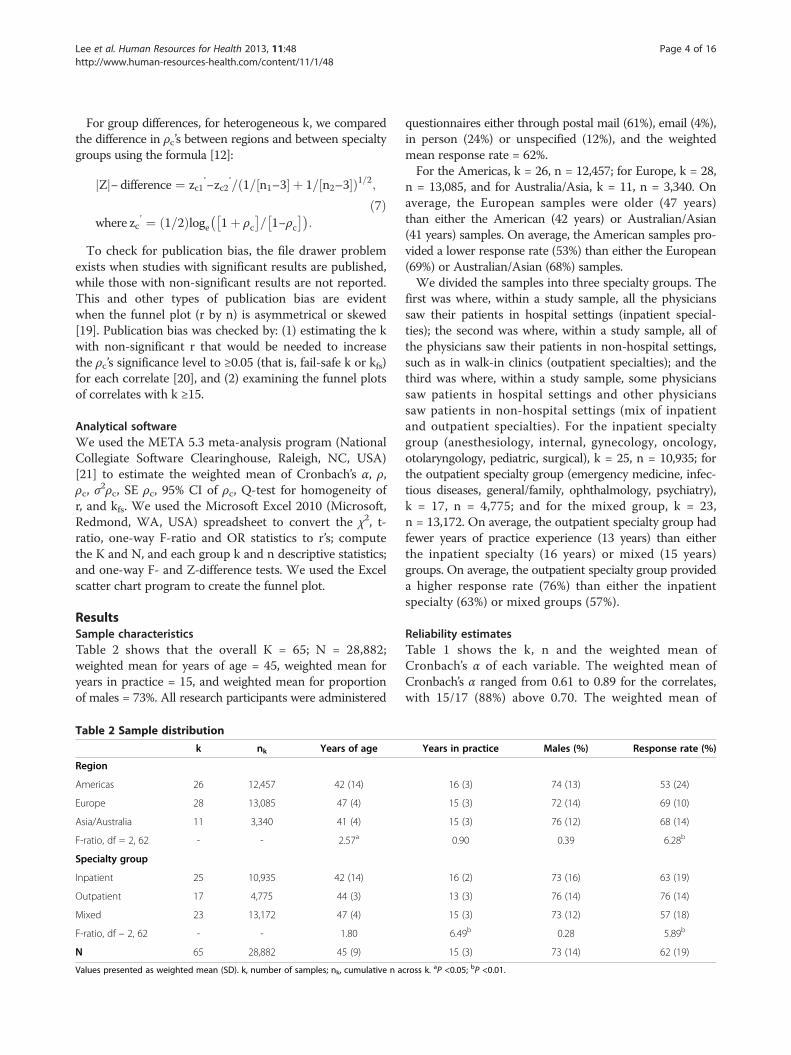
Overall associationsTables 3 and 4 show the k, n, ρ, ρc, σ
2ρc, 95% CI of ρc,
Q-test, and kfs. Table 3 reveals that EE had 25 correlateswith k ≥2, and 17/25 (68%) had ρc’s ≥0.30. Autonomy(ρc = −0.36) was the strongest correlate of the work en-gagement drivers; workload (ρc = 0.66) and organizationalstructure (ρc = 0.45) were the strongest correlates of thework engagement constraints. EE was associated with thework attitude drivers (ρc = −0.47) and work attitude con-straints (ρc = 0.46). Quality and safety culture (ρc = −0.34)
Table 3 Meta-correlations with emotional exhaustion (EE)
Correlates k n ρ
Work Engagement Drivers
Recognition/feedback 4 2,125 −0.17
Autonomy 6 2,189 −0.26
Organization/peer support 4 2,748 −0.15
Adequate resources 2 1,089 −0.14
Work Engagement Constraints
Professional values 2 91 0.36
Organization structures 5 1,084 0.44
Inadequate resources 5 1,023 0.34
Role ambiguity/conflict 3 622 0.23
Insufficient input 4 437 0.34
Workload 19 6,205 0.51
Inadequate skills/preparation 4 1,242 0.24
Position specific demands 10 3,550 0.32
Work Attitude Drivers 16 12,323 −0.30
Work Attitude Constraints 13 4,652 0.35
Health & Safety Drivers
Quality & safety culture 7 8,226 −0.23
Clinical Skills 3 1,033 −0.08
Professional development 6 1,377 −0.31
Health & Safety Constraints
Incivility/conflicts/violence 7 1,816 0.34
Lack of quality & safety 15 5,612 0.34
Work–Life/Home Conflict 13 3,817 0.40
Contributors to Poor Mental Health 23 7,345 0.49
Contributors to Good Health 6 4,806 −0.28
Adaptive Coping
Social support 7 3,448 −0.17
Problem-focused 9 3,007 −0.20
Ineffective Coping 9 3,129 0.22
95% CI ρc, confidence interval; σ2ρc, variance of ρc; k, number of samples; kfs, fail-safecorrelation; ρc, ρ after correcting for measurement unreliability with value ≥0.30 inacross k. aP <0.05; bP <0.001.
was the strongest correlate of the health and safety drivers;incivility/conflicts/violence (ρc = 0.41), and lack of qualityand safety (ρc = 0.42) were equally strong correlates of thehealth and safety constraints. EE was strongly associatedwith work-life conflict (ρc = 0.49), and contributors topoor mental health (ρc = 0.62), moderately associated withcontributors to good health (ρc = −0.32) and ineffectivecoping strategies (ρc = 0.33).EE had 22/25 (88%) correlates with kfs ≥10, and 17/25
(68%) correlates with a kfs/k ratio ≥4/1, indicating minimalrisks of the file drawer problem. Figures 1, 2, 3 and 4 showthe plots of r by n for workload, work attitude drivers, lackof quality and safety, and contributors to poor mental
ρc σ2ρc 95% CI ρc Q kfs
−0.20b 0.003 −0.24 to −0.11 6.69 10
−0.36b 0.021 −0.60 to −0.01 53.09b 30
−0.18b 0.002 −0.21 to −0.09 4.18 8
−0.15b 0.002 −0.18 to −0.11 2.35 4
0.42b 0.000 0.41 to 0.42 0.01 13
0.45b 0.038 0.08 to 0.82 63.41b 40
0.36b 0.012 0.18 to 0.53 15.16b 31
0.24b 0.007 0.12 to 0.34 5.14 11
0.36b 0.017 0.15 to 0.56 9.79a 23
0.66b 0.018 0.28 to 0.79 206.09b 183
0.26b 0.002 0.25 to 0.27 3.34 16
0.40b 0.004 0.27 to 0.43 18.19a 61
−0.47b 0.022 −0.61 to −0.02 328.50b 85
0.46b 0.008 0.21 to 0.52 50.15b 82
−0.34b 0.016 −0.50 to 0.00 143.72b 28
−0.08a 0.004 −0.16 to −0.00 4.39 2
−0.31b 0.014 −0.51 to −0.10 23.74b 31
0.41b 0.015 0.14 to 0.58 34.61b 43
0.42b 0.007 0.22 to 0.51 50.11b 94
0.49b 0.019 0.16 to 0.69 102.49b 98
0.62b 0.013 0.30 to 0.71 168.99b 210
−0.32b 0.01 −0.48 to −0.10 57.76b 29
−0.26b 0.007 −0.32 to −0.04 28.34b 18
−0.29b 0.009 −0.38 to −0.04 30.42b 29
0.33b 0.009 0.07 to 0.50 31.28b 33
k for critical ρc ≥0.05; n, sample size across k; ρ, weighted mean meta-bold; Q, homogeneity of r test, where significance indicates that the ρc’s vary

Table 4 Meta-correlations with depersonalization (DP)
Correlates k n ρ ρc σ2ρc 95% CI ρc Q kfs
Work Engagement Drivers
Recognition, feedback 3 853 −0.04 −0.05 0.004 −0.07 to −0.01 3.25 <1
Autonomy 5 1,769 -0.17 −0.24b 0.003 −0.42 to 0.01 22.36b 15
Organization/peer support 3 1,597 −0.08 −0.09b 0.004 −0.18 to 0.01 6.17a 2
Work Engagement Constraints
Professional values 4 686 0.28 0.36b 0.003 0.34 to 0.37 2.23 21
Organization structures 2 198 0.47 0.47b 0.003 0.46 to 0.47 1.02 17
Role Ambiguity/conflict 2 593 0.23 0.26b 0.003 0.25 to 0.26 0.05 8
Workload 12 3,899 0.26 0.29b 0.011 0.11 to 0.48 48.80b 58
Inadequate skills/preparation 3 679 0.28 0.35b 0.001 0.34 to 0.36 0.53 15
Position specific demands 7 1,773 0.28 0.38b 0.005 0.27 to 0.41 10.30b 41
Work Attitudes Drivers 13 11,206 −0.24 −0.36b 0.008 −0.43 to −0.10 100.07b 55
Work Attitudes Constraints 7 1,945 0.24 0.32b 0.009 0.11 to 0.40 19.44b 33
Health & Safety Drivers
Quality & safety culture 7 7,640 −0.24 −0.35b 0.006 −0.41 to −0.12 51.09b 30
Clinical skills 2 975 −0.11 −0.15b 0.001 −0.15 to −0.16 1.12 4
Professional development 5 1,348 −0.18 −0.18b 0.000 −0.18 to −0.18 0.61 13
Health & Safety Constraints
Incivility/conflicts/violence 3 220 0.42 0.51b 0.01 0.49 to 0.54 3.18 25
Lack of quality & safety 8 2,573 0.27 0.33b 0.012 0.10 to 0.53 36.49b 42
Work–Life/ Home Conflict 9 2,511 0.27 0.34b 0.01 0.13 to 0.47 29.06b 39
Contributors to Poor Mental Health 17 5,411 0.27 0.34b 0.008 0.14 to 0.42 50.96b 78
Contributors to Good Health 5 3,387 −0.15 −0.15b −0.16 −0.27 to −0.04 16.71b 11
Adaptive Coping
Social support 5 1,866 −0.16 −0.21b 0.004 −0.23 to −0.10 7.10 11
Problem-focused 7 1,647 −0.14 −0.18b 0.004 −0.16 to −0.14 7.31 14
Ineffective Coping 9 2,007 0.19 0.24b 0.012 0.02 to 0.40 26.13b 25
95% CI ρc, confidence interval; σ2ρc, variance of ρc; k, number of samples; kfs, fail-safe k for critical ρc ≥0.05; n, sample size across k; ρ, weighted mean meta-correlation; ρc, ρ after correcting for measurement unreliability with value ≥0.30 in bold; Q, homogeneity of r test, where significance indicates that the ρc’s varyacross k. aP <0.05; bP <0.001.
Lee et al. Human Resources for Health 2013, 11:48 Page 6 of 16http://www.human-resources-health.com/content/11/1/48
health. All four were funnel-shaped with three symmetrical,indicating minimal risks of publication bias [17].Table 4 reveals that DP had 22 correlates with k ≥2, and
11/22 (50%) had ρc’s ≥0.30. Three correlates, adequateresources, inadequate resources and insufficient inputs,each had k = 1 and were not included in the meta-analysisfor DP. Organizational structure (ρc = 0.47) was thestrongest correlate of the work engagement constraints.DP was moderately associated with the work attitude drivers(ρc = −0.36) and work attitude constraints (ρc = 0.32).Quality and safety culture (ρc = −0.35) was the strongestcorrelate of the health and safety drivers; incivility/con-flicts/violence (ρc = 0.51) was a stronger correlate thanlack of quality and safety (ρc = 0.33) of the health andsafety constraints. DP was moderately associated withwork-life conflict (ρc = 0.34), and contributors to poormental health (ρc = 0.34).
DP had 18/22 (82%) correlates with kfs ≥10, and 13/22(59%) correlates with a kfs/k ratio ≥4/1, indicating minimalrisks of the file drawer problem. Figure 5 shows the plotof r by n for contributors to poor mental health. It wasfunnel-shaped and symmetrical, indicating a minimal riskof publication bias.
Group differencesThe interpretation of the overall ρc’s must be qualified dueto heterogeneity of r’s across k on both burnout dimen-sions. The r’s were heterogeneous on 18/25 (72%) correlatesfor EE, and on 12/22 (55%) correlates for DP. For thesecorrelates, we compared the significance of ρc differencesbetween the two largest regions, the Americas and Europe,and between inpatient and outpatient specialty groups.We did not compare with the mixed group because both

Figure 1 Funnel plot of workload with emotional exhaustion (EE). x-axis: r; y-axis: n. k = 19; range of n: 37 to 1,021.
Lee et al. Human Resources for Health 2013, 11:48 Page 7 of 16http://www.human-resources-health.com/content/11/1/48
inpatient and outpatient specialties were combined in agiven sample.Tables 5 and 6 show the k, n, ρc and Z-difference be-
tween regions. Table 5 reveals that EE had 13/18 (72%)correlates with significant ρc differences. The ρc’s of theAmericas were stronger than Europe on 11 correlates.The most notable differences were in quality and safetyculture (−0.56 versus −0.25), professional development(−0.41 versus −0.22), work-life conflict (0.57 versus 0.40),problem-focused coping (−0.44 versus −0.17), and ineffect-ive coping (0.53 versus 0.32). Physicians in the Americaswere at lower risk than physicians in Europe for EE whenquality and safety culture and career development oppor-tunities were present, and problem-focused coping wasused. The former were at higher risk than the latter whenwork-life conflict was present, and ineffective coping wasused. The ρc of the work attitude drivers was stronger forEurope (−0.64) than for the Americas (−0.28), indicating
Figure 2 Funnel plot of lack of quality and safety with emotional exh
that the former was at lower risk than the latter for EEwhen their attitudes were positive.Table 6 reveals that DP had 8/12 (67%) correlates with
significant ρc differences. The ρc’s of the Americas werestronger than Europe on seven correlates. The most not-able differences were in lack of quality and safety (0.47versus 0.29), and work-life conflict (0.42 versus 0.27).Physicians in the Americas were at higher risk than phy-sicians in Europe for DP when quality and safety wascompromised and work-life conflict was present.Tables 7 and 8 show the k, n, ρc and Z-difference be-
tween specialty groups. Table 7 reveals that EE had 8/16(50%) correlates with significant ρc differences. The ρc’sof the outpatient specialties were stronger than theinpatient specialties on seven correlates. The most not-able differences were in autonomy (−0.79 versus −0.57),organizational structures (0.72 versus 0.32) and contribu-tors to poor mental health (0.77 versus 0.56). The former
austion (EE). x-axis: r; y-axis: n. k = 15; range of n: 84 to 1,021.

Figure 3 Funnel plot of work attitudes drivers with emotional exhaustion (EE). x-axis: r; y-axis: n. k = 16; range of n: 50 to 2,536.
Lee et al. Human Resources for Health 2013, 11:48 Page 8 of 16http://www.human-resources-health.com/content/11/1/48
were at higher risk than the latter for EE when theorganization of work was constraining and poor mentalhealth were present, but were at lower risk for EE withautonomy and use of problem-focused coping. The ρc ofthe work attitude drivers was stronger for the inpatientspecialties (−0.44) than for the outpatient specialties(−0.29), indicating that the former was at lower risk for EEwhen their attitudes were positive.Table 8 reveals that DP had 3/10 (30%) correlates with
significant ρc differences. The ρc’s of the outpatient spe-cialties were stronger than the inpatient specialties forwork-life/home conflict (0.46 versus 0.32), and contribu-tors to poor mental health (0.63 versus 0.35), indicatingthat the former were at higher risk than the latter forDP when work-life conflict and poor mental health waspresent. The ρc of the work attitude drivers was strongerρc for the inpatient specialties (−0.45) than the outpatient
Figure 4 Funnel plot of contributors to poor mental health with emoto 1,435.
specialties (−0.29), indicating that the former was at lowerrisk for DP when their attitudes were positive.
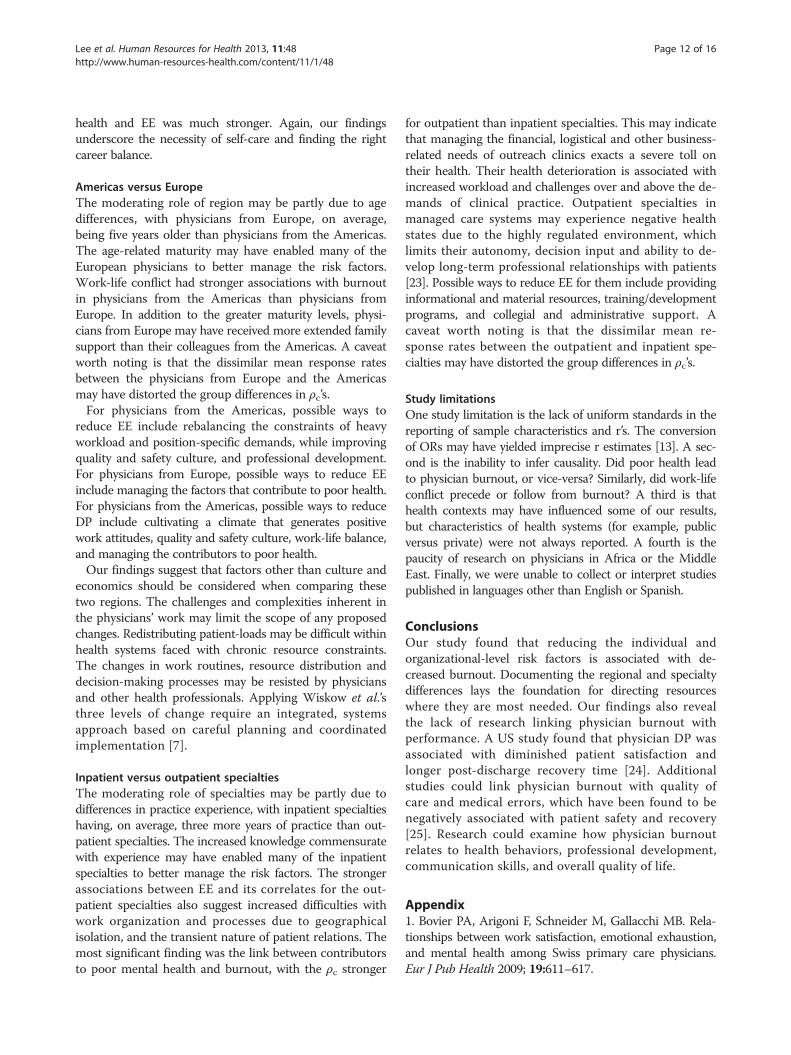
DiscussionFigure 6 shows the overall associations and reveals somesignificant trends. The ρc’s with burnout were strongerfor constraints than for drivers. Similarly, the ρc’s withburnout were stronger for work-life conflict and contrib-utors to poor mental health than contributors to goodhealth. EE was more strongly associated with a greaternumber of correlates than DP. EE’s stronger ties with theenvironmental drivers and constraints support Maslach’scontention that it represents the core aspect of burnout[22]. The results also support Maslach’s position that EE ismore closely tied to health states. The implication is thatwhile drivers are important, the management of constraintsmay be even more critical for physicians who experience
tional exhaustion (EE). x-axis: r; y-axis: n. k = 23, range of n: 29
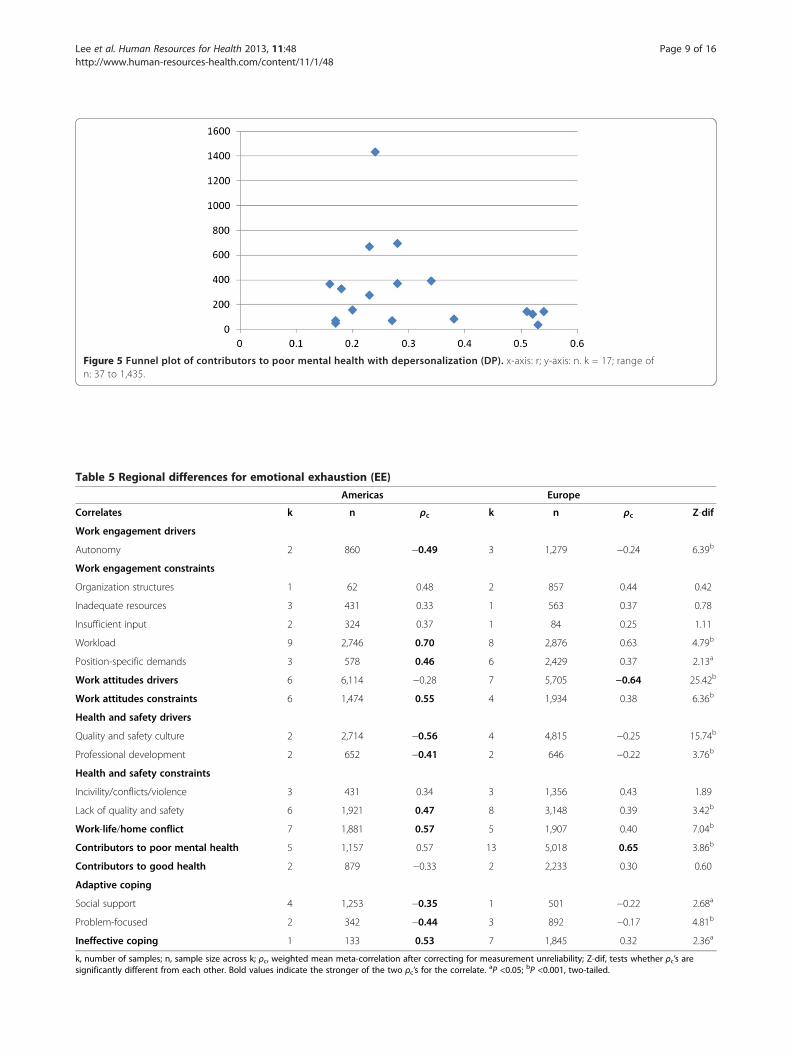
Table 5 Regional differences for emotional exhaustion (EE)
Americas Europe
Correlates k n ρc k n ρc Z-dif
Work engagement drivers
Autonomy 2 860 −0.49 3 1,279 −0.24 6.39b
Work engagement constraints
Organization structures 1 62 0.48 2 857 0.44 0.42
Inadequate resources 3 431 0.33 1 563 0.37 0.78
Insufficient input 2 324 0.37 1 84 0.25 1.11
Workload 9 2,746 0.70 8 2,876 0.63 4.79b
Position-specific demands 3 578 0.46 6 2,429 0.37 2.13a
Work attitudes drivers 6 6,114 −0.28 7 5,705 −0.64 25.42b
Work attitudes constraints 6 1,474 0.55 4 1,934 0.38 6.36b
Health and safety drivers
Quality and safety culture 2 2,714 −0.56 4 4,815 −0.25 15.74b
Professional development 2 652 −0.41 2 646 −0.22 3.76b
Health and safety constraints
Incivility/conflicts/violence 3 431 0.34 3 1,356 0.43 1.89
Lack of quality and safety 6 1,921 0.47 8 3,148 0.39 3.42b
Work-life/home conflict 7 1,881 0.57 5 1,907 0.40 7.04b
Contributors to poor mental health 5 1,157 0.57 13 5,018 0.65 3.86b
Contributors to good health 2 879 −0.33 2 2,233 0.30 0.60
Adaptive coping
Social support 4 1,253 −0.35 1 501 −0.22 2.68a
Problem-focused 2 342 −0.44 3 892 −0.17 4.81b
Ineffective coping 1 133 0.53 7 1,845 0.32 2.36a
k, number of samples; n, sample size across k; ρc, weighted mean meta-correlation after correcting for measurement unreliability; Z-dif, tests whether ρc’s aresignificantly different from each other. Bold values indicate the stronger of the two ρc’s for the correlate. aP <0.05; bP <0.001, two-tailed.
Figure 5 Funnel plot of contributors to poor mental health with depersonalization (DP). x-axis: r; y-axis: n. k = 17; range ofn: 37 to 1,435.
Lee et al. Human Resources for Health 2013, 11:48 Page 9 of 16http://www.human-resources-health.com/content/11/1/48

Table 6 Regional differences for depersonalization (DP)
Americas Europe
Correlates k n ρc k n ρc Z-dif
Work engagement drivers
Autonomy 2 860 −0.28 2 859 −0.20 1.70
Organization/peer support 1 133 −0.15 1 1,435 −0.08 0.80
Work engagement constraints
Workload 3 993 0.32 7 2,313 0.33 0.29
Position-specific demands 2 385 0.51 4 815 0.32 2.71a
Work attitudes drivers 5 4,842 −0.31 5 5,148 −0.38 4.19b
Work attitudes constraints 3 765 0.38 3 913 0.25 2.89a
Quality and safety culture 2 2,714 −0.41 4 4,229 −0.33 3.86b
Health and safety constraints
Lack of quality and safety 2 760 0.47 5 1,270 0.29 4.33b
Work-life/home conflict 4 1,138 0.42 4 1,344 0.27 4.14b
Contributors to poor mental health 4 608 0.45 10 3,898 0.33 3.23b
Contributors to good health 1 582 −0.27 2 2,233 −0.13 3.02a
Ineffective coping 1 133 0.32 7 1,845 0.23 1.02
k, number of samples; n, sample size across k; ρc, weighted mean meta-correlation after correcting for measurement unreliability; Z-dif, tests whether ρc’s aresignificantly different from each other. Bold values indicate the stronger of the two ρc’s for the correlate. aP <0.05; bP <0.001, two-tailed.
Table 7 Specialty group differences for emotional exhaustion (EE)
Inpatient Outpatient
Correlates k n ρc k n ρc Z-dif
Work engagement drivers
Autonomy 2 843 −0.57 1 50 −0.79 2.79a
Work engagement constraints
Organization structures 3 654 0.32 1 294 0.72 8.27b
Inadequate resources 2 592 0.38 3 431 0.33 0.96
Insufficient input 1 29 0.44 3 408 0.35 0.54
Workload 9 4,366 0.72 5 558 0.65 2.82a
Position-specific demands 4 2,519 0.38 4 591 0.42 1.00
Work attitudes drivers 5 2,854 −0.44 5 2,236 −0.29 5.94b
Work attitudes constraints 6 2,711 0.44 5 1,346 0.44 0.06
Health and safety drivers
Professional development 3 1,112 −0.31 1 145 −0.34 0.35
Health and safety constraints
Incivility/conflicts/violence 2 1,007 0.36 5 809 0.48 3.02a
Lack of quality and safety 8 4,518 0.41 5 839 0.50 3.00a
Work-life/home conflict 6 2,055 0.49 3 471 0.52 0.94
Contributors to poor mental health 10 3,498 0.56 5 791 0.77 9.86b
Adaptive coping
Social support 3 1,190 −0.18 1 133 −0.17 1.18
Problem-focused 5 1,543 −0.29 1 133 −0.48 2.51a
Ineffective coping 4 1,469 0.32 2 217 0.47 1.80
k, number of samples; n, sample size across k; ρc, weighted mean meta-correlation after correcting for measurement unreliability; Z-dif, tests whether ρc’s aresignificantly different from each other. Bold values indicate the stronger of the two ρc’s for the correlate. aP <0.05; bP <0.001, two-tailed.
Lee et al. Human Resources for Health 2013, 11:48 Page 10 of 16http://www.human-resources-health.com/content/11/1/48
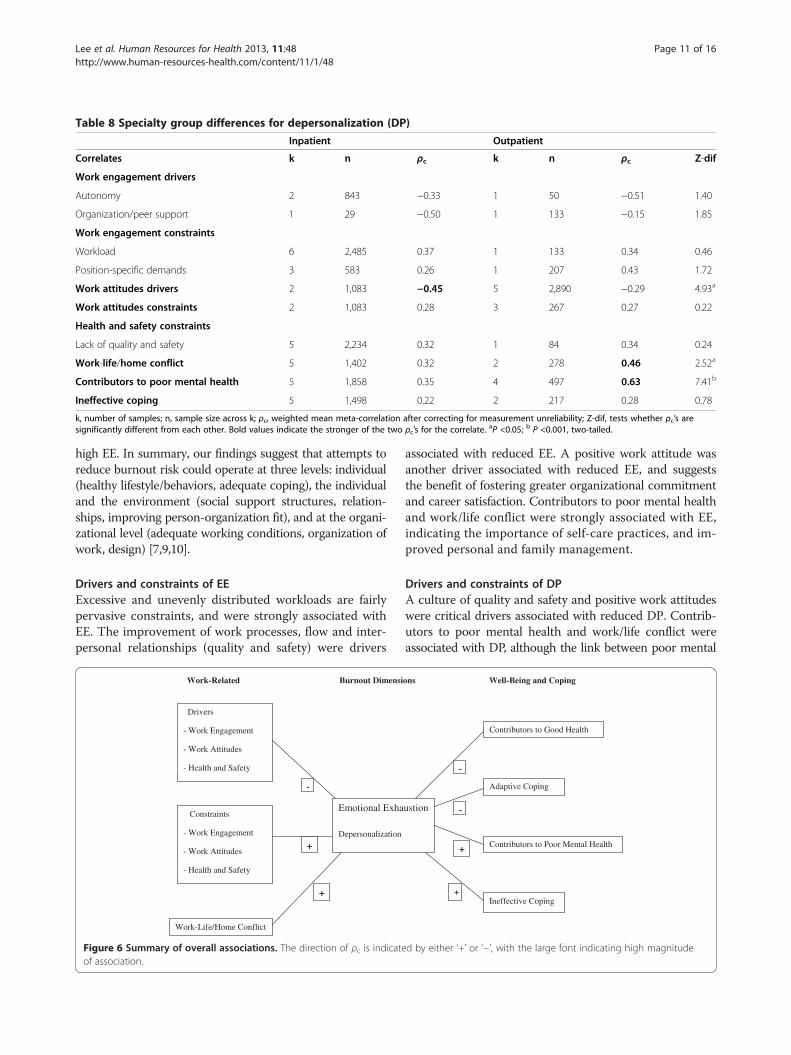
Table 8 Specialty group differences for depersonalization (DP)
Inpatient Outpatient
Correlates k n ρc k n ρc Z-dif
Work engagement drivers
Autonomy 2 843 −0.33 1 50 −0.51 1.40
Organization/peer support 1 29 −0.50 1 133 −0.15 1.85
Work engagement constraints
Workload 6 2,485 0.37 1 133 0.34 0.46
Position-specific demands 3 583 0.26 1 207 0.43 1.72
Work attitudes drivers 2 1,083 −0.45 5 2,890 −0.29 4.93a
Work attitudes constraints 2 1,083 0.28 3 267 0.27 0.22
Health and safety constraints
Lack of quality and safety 5 2,234 0.32 1 84 0.34 0.24
Work-life/home conflict 5 1,402 0.32 2 278 0.46 2.52a
Contributors to poor mental health 5 1,858 0.35 4 497 0.63 7.41b
Ineffective coping 5 1,498 0.22 2 217 0.28 0.78
k, number of samples; n, sample size across k; ρc, weighted mean meta-correlation after correcting for measurement unreliability; Z-dif, tests whether ρc’s aresignificantly different from each other. Bold values indicate the stronger of the two ρc’s for the correlate. aP <0.05; b P <0.001, two-tailed.
Lee et al. Human Resources for Health 2013, 11:48 Page 11 of 16http://www.human-resources-health.com/content/11/1/48
high EE. In summary, our findings suggest that attempts toreduce burnout risk could operate at three levels: individual(healthy lifestyle/behaviors, adequate coping), the individualand the environment (social support structures, relation-ships, improving person-organization fit), and at the organi-zational level (adequate working conditions, organization ofwork, design) [7,9,10].
Drivers and constraints of EEExcessive and unevenly distributed workloads are fairlypervasive constraints, and were strongly associated withEE. The improvement of work processes, flow and inter-personal relationships (quality and safety) were drivers
Work-Related Burnout Dimensi
Drivers
- Work Engagement
- Work Attitudes
- Health and Safety
Constraints
- Work Engagement
- Work Attitudes
- Health and Safety
Work-Life/Home Conflict
Emotional Exha
Depersonalization
-
+
+
Figure 6 Summary of overall associations. The direction of ρc is indicateof association.
associated with reduced EE. A positive work attitude wasanother driver associated with reduced EE, and suggeststhe benefit of fostering greater organizational commitmentand career satisfaction. Contributors to poor mental healthand work/life conflict were strongly associated with EE,indicating the importance of self-care practices, and im-proved personal and family management.
Drivers and constraints of DPA culture of quality and safety and positive work attitudeswere critical drivers associated with reduced DP. Contrib-utors to poor mental health and work/life conflict wereassociated with DP, although the link between poor mental
ons Well-Being and Coping
ustion
Contributors to Good Health
Adaptive Coping
Contributors to Poor Mental Health
Ineffective Coping
-
-
+
+
d by either ‘+’ or ‘−’, with the large font indicating high magnitude
Lee et al. Human Resources for Health 2013, 11:48 Page 12 of 16http://www.human-resources-health.com/content/11/1/48
health and EE was much stronger. Again, our findingsunderscore the necessity of self-care and finding the rightcareer balance.
Americas versus EuropeThe moderating role of region may be partly due to agedifferences, with physicians from Europe, on average,being five years older than physicians from the Americas.The age-related maturity may have enabled many of theEuropean physicians to better manage the risk factors.Work-life conflict had stronger associations with burnoutin physicians from the Americas than physicians fromEurope. In addition to the greater maturity levels, physi-cians from Europe may have received more extended familysupport than their colleagues from the Americas. A caveatworth noting is that the dissimilar mean response ratesbetween the physicians from Europe and the Americasmay have distorted the group differences in ρc’s.For physicians from the Americas, possible ways to
reduce EE include rebalancing the constraints of heavyworkload and position-specific demands, while improvingquality and safety culture, and professional development.For physicians from Europe, possible ways to reduce EEinclude managing the factors that contribute to poor health.For physicians from the Americas, possible ways to reduceDP include cultivating a climate that generates positivework attitudes, quality and safety culture, work-life balance,and managing the contributors to poor health.Our findings suggest that factors other than culture and
economics should be considered when comparing thesetwo regions. The challenges and complexities inherent inthe physicians’ work may limit the scope of any proposedchanges. Redistributing patient-loads may be difficult withinhealth systems faced with chronic resource constraints.The changes in work routines, resource distribution anddecision-making processes may be resisted by physiciansand other health professionals. Applying Wiskow et al.’sthree levels of change require an integrated, systemsapproach based on careful planning and coordinatedimplementation [7].
Inpatient versus outpatient specialtiesThe moderating role of specialties may be partly due todifferences in practice experience, with inpatient specialtieshaving, on average, three more years of practice than out-patient specialties. The increased knowledge commensuratewith experience may have enabled many of the inpatientspecialties to better manage the risk factors. The strongerassociations between EE and its correlates for the out-patient specialties also suggest increased difficulties withwork organization and processes due to geographicalisolation, and the transient nature of patient relations. Themost significant finding was the link between contributorsto poor mental health and burnout, with the ρc stronger
for outpatient than inpatient specialties. This may indicatethat managing the financial, logistical and other business-related needs of outreach clinics exacts a severe toll ontheir health. Their health deterioration is associated withincreased workload and challenges over and above the de-mands of clinical practice. Outpatient specialties inmanaged care systems may experience negative healthstates due to the highly regulated environment, whichlimits their autonomy, decision input and ability to de-velop long-term professional relationships with patients[23]. Possible ways to reduce EE for them include providinginformational and material resources, training/developmentprograms, and collegial and administrative support. Acaveat worth noting is that the dissimilar mean re-sponse rates between the outpatient and inpatient spe-cialties may have distorted the group differences in ρc’s.
Study limitationsOne study limitation is the lack of uniform standards in thereporting of sample characteristics and r’s. The conversionof ORs may have yielded imprecise r estimates [13]. A sec-ond is the inability to infer causality. Did poor health leadto physician burnout, or vice-versa? Similarly, did work-lifeconflict precede or follow from burnout? A third is thathealth contexts may have influenced some of our results,but characteristics of health systems (for example, publicversus private) were not always reported. A fourth is thepaucity of research on physicians in Africa or the MiddleEast. Finally, we were unable to collect or interpret studiespublished in languages other than English or Spanish.
ConclusionsOur study found that reducing the individual andorganizational-level risk factors is associated with de-creased burnout. Documenting the regional and specialtydifferences lays the foundation for directing resourceswhere they are most needed. Our findings also revealthe lack of research linking physician burnout withperformance. A US study found that physician DP wasassociated with diminished patient satisfaction andlonger post-discharge recovery time [24]. Additionalstudies could link physician burnout with quality ofcare and medical errors, which have been found to benegatively associated with patient safety and recovery[25]. Research could examine how physician burnoutrelates to health behaviors, professional development,communication skills, and overall quality of life.
Appendix1. Bovier PA, Arigoni F, Schneider M, Gallacchi MB. Rela-tionships between work satisfaction, emotional exhaustion,and mental health among Swiss primary care physicians.Eur J Pub Health 2009; 19:611–617.
Lee et al. Human Resources for Health 2013, 11:48 Page 13 of 16http://www.human-resources-health.com/content/11/1/48
2. Embriaco N, Azoulay E, Barrau K, Kentish N,Pochard F, Loundou A, Papazian L: High level of burn-out in intensivists. Am J Respir Crit Care Med 2007;175:686–692.3. Kuerer HM, Eberlein TJ, Pollock RE, Huschka M,
Baile WF, Morrow M, Michelassi F, Singletary SE,Novotny P, Sloan J, Shanafelt TD: Career satisfaction,practice patterns, and burnout among surgical oncolo-gists: report of the quality of life of members of theSociety of Surgical Oncology. Ann Surg Oncol 2007;14:3043–3053.4. Campbell DA, Sonnad SS, Eckhauser FE, Campbell
KK, Greenfield LJ: Burnout among American surgeons.Surgery 2001; 130:696–705.5. Kumar S, Fischer J, Robinson E, Hatcher S, Bhagat
RN: Burnout and job satisfaction in New Zealand psy-chiatrists: a national study. Int J Soc Psychiatry 2007;53:306–316.6. Korkeila JA, Töyry S, Kumpulainen K, Toivola JM,
Räsänen K, Kalimo R: Burnout and self-perceived healthamong Finnish psychiatrists and child psychiatrists: anational survey. Scand J Public Health 2003; 31:85–91.7. Visser MRM, Smets EMA, Oort FJ, de Haes HCJM:
Stress, satisfaction, and burnout among Dutch medicalspecialists. CMAJ 2003; 168:271–275.8. Asai M, Morita T, Akechi T, Sugawara Y, Fujimon
M, Akizuki N, Nakano T, Uchitomi Y: Burnout and psychi-atric morbidity among physicians engaged in end-of-lifecare for cancer patients: a cross-sectional nationwidesurvey in Japan. Psychooncology 2006; 16:421–428.9. Deckard GJ, Hicks LL, Hamory BH: The occurrence
and distribution of burnout among infectious diseasesphysicians. J Infect Dis 1992; 165:224–228.10. Bargellini A, Barbieri A, Rovesti S, Vivoli R,
Roncaglia R, Borella P: Relation between immune variablesand burnout in a sample of physicians. Occup Environ Med2000; 57:453–457.11. Dickinson-Bannack ME, González-Salinas C,
Fernández-Ortega MA, Palomeque RP, González QuintanillaE, Hernández-Vargas I: Burnout syndrome among Mexicanprimary care physicians. Archivos en Medicina Familiar2007; 9:75–79.12. Winefield HR, Anstey TJ: Job stress in general prac-
tice: practitioner age, sex, and attitudes as predictors. FamPract 1991; 8:140–144.13. Morais A, Maia P, Azevedo A, Amaral C, Tavares J:
Stress and burnout among Portuguese anaesthesiologists.Eur J Anaesthesiol 2006; 23:433–439.14. Montgomery AJ, Panagopolou E, Benos A: Work-
family interference as a mediator between job demandsand job burnout among doctors. Stress and Health 2006;22:203–212.15. Grassi L, Magnani K, Ercolani M: Attitudes toward
euthanasia and physician-assisted suicide among Italian
primary care physicians.J Pain Symptom Manage 1999;17:188–196.16. Oyzurt, A. Hayran 0, Sur H: Predictors of burnout
and job satisfaction among Turkish physicians. QJM 2006;99:161–169.17. AI-Dubai S, Rampal K: Prevalence and associated
factors of burnout among doctors in Yemen. J Occup Health2010; 52:58–65.18. Lemkau J, Rafferty J, Gordon Jr R: Burnout and
career-choice regret among family practice physicians inearly practice. Fam Pract Res J 1994; 14:213–222.19. Lee FJ, Stewart M, Brown JB: Stress, burnout, and
strategies for reducing them. Can Fam Physician 2008;54:234–235.20. Shanafelt TD, Balch CM, Bechamps G, Russell T,
Dyrbye L, Satele D, Collicott P, Novotny PJ, Sloan J,Freischlag J: Burnout and medical errors among Americansurgeons. Ann Surg 2010; 251:995–1000.21. Benbow SM, Jolley DJ: Burnout and stress amongst
old age psychistrists. Int J Geriatr Psychiatry 2002;17:710–714.22. Ádám S, Györffy Z, Susánszky É: Physician burnout
in Hungary: a potential role for work family conflict. JHealth Psychol 2008; 13:847–856.23. Shanafelt TD, West CP, Sloan JA, Novotny PJ,
Poland GA, Menaker R, Rummans TA, Dyrbye LN: Careerfit and burnout among academic faculty. Arch Intern Med2009; 169:990–995.24. Sharma A, Sharp DM, Walker LG, Monson JRT:
Stress and burnout in colorectal and vascular surgicalconsultants working in the UK National Health Service.Psychooncology 2008; 17:570–576.25. Grassi L, Magnani K: Psychiatric morbidity and
burnout in the medical profession: an Italian study ofgeneral practitioners and hospital physicians. PsychotherPsychosom 2000; 69:329–334.26. Stafford L, Judd F: Mental health and occupational
wellbeing of Australian gynaecologic oncologists. GynecolOncol 2010; 116:526–532.27. Bruce SM, Conaglen HM, Conaglen JV: Burnout in
physicians: a case for peer-support. Intern Med J 2005;35:272–278.28. Wu S, Zhu W, Li H, Wang Z, Wang M: Relation-
ship between job burnout and occupational stressamong doctors in China. Stress and Health 2008;24:143–149.29. Yost WB, Eshelman A, Raoufi M, Abouljoud MS:
A national study of burnout among American transplantsurgeons. Transplant Proc 2005; 37:1399–1401.30. Moreno-Jiménez B, Rodríguez-Carvajal R, Garrosa
Hernández E, MoranteBenadero Ma. E: Terminal ver-sus non-terminal care in physician burnout: the role ofdecision-making processes and attitudes to death. SaludMental 2008; 31:93–101.

Lee et al. Human Resources for Health 2013, 11:48 Page 14 of 16http://www.human-resources-health.com/content/11/1/48
31. Halbesleben JRB, Rathert C: Linking physician burn-out and patient outcomes: exploring the dyadic relationshipbetween physicians and patients. Health Care ManageRev 2008; 33:29–39.32. Smets EMA, Visser MRM, Oort FJ, Schaufeli WB,
de Haes H: Perceived inequity: does it explain burnoutamong medical specialists? J Appl Soc Psychol 2004;34:1900–1918.33. McManus IC, Winder BC, Gordon D: The causal
links between stress and burnout in a longitudinal studyof UK doctors. Lancet 2002; 359:2089–2090.34. Deary IJ, Agius RM, Sadler A: Personality and
stress in consultant psychiatrists. Int J Soc Psychiatry1996; 42:112–123.35. Houkes I, Winants Y, Twellaar M: Specific deter-
minants of burnout among male and female generalpractitioners: a cross-lagged panel analysis. J Occup OrganPsych 2008; 81:249–276.36. Goldberg R, Boss W, Chan L, Goldberg J, Mallon
WK, Moradzadeh D, Goodman EA, McConkie ML:Burnout and its correlates in emergency physicians:four years' experience with a wellness booth. Acad EmergMed 1996; 3:1156–1164.37. Leiter MP, Frank E, Matheson TJ: Demands, values,
and burnout. Can Fam Physician 2009; 55:1224–1225.38. Travado L, Grassi L, Gil F, Ventura C, Martins C;
Southern European Psycho-Oncology Study Group:Physician-patient communication among Southern Europeancancer physicians: the influence of psychosocial orienta-tion and burnout. Psychooncology 2005; 14:661–670.39. Lee RT, Lovell BL, Brotheridge CM: Tenderness
and steadiness: Relating job and interpersonal demandsand resources with burnout and physical symptoms ofstress in Canadian physicians. J Appl Soc Psychol 2010;40:2319–2342.40. Truchot D: Career orientation and burnout in French
general practitioners. Psychol Rep 2008; 103:875–881.41. Lisowska AGE: Professional burnout and stress
among Polish physicians explained by the HobfollResources Theory. J Physiol Pharmacol 2007; 58:243–252.42. Gabbe SG, Melville J, Mandel L, Walker E: Burnout
in chairs of obstetrics and gynecology: diagnosis, treatment,and prevention. Am J Obstet Gynecol 2002; 186:601–612.43. Peisah C, Latif E, Wilhelm K, Williams B: Secrets
to psychological success: Why older doctors might havelower psychological distress and burnout than youngerdoctors. Aging Ment Health 2009; 13:300–307.44. Surgenor LJ, Spearing RL, Horn J, Beautrais AL,
Mulder RT, Chen P: Burnout in hospital-based medicalconsultants in the New Zealand public health system.NZ Med J 2009; 122:11–18.45. Ramirez AJ, Graham J, Richards MA, Cull A,
Gregory WM: Satisfaction at work. Lancet 1996;347:724–728.
46. Lim RCH, Pinto C: Work stress, satisfaction, andburnout in New Zealand radiologists: comparison of pub-lic hospital and private practice in New Zealand. J MedImaging Radiat Oncol 2009; 53:194–199.47. Barros D, Tironi M, Sobrinho C, Neves F, Bitencourt
A, Almeida A, de Souza Y, Teles M, Feitosa A, Mota I,França J, Borges L, Lordão M, Trindade M, Almeida M,Filho E, José E, dos Reis: Intensive care unit physicians:socio-demographic profile, working conditions, and factorsassociated to the burnout syndrome. Rev Bras Ter Intensiva2008; 20:235–240.48. Tokuda Y, Hayano K, Ozaki M, Bito S, Yanai H,
Koiwmi S: The interrelationships between working condi-tions, job satisfaction, burnout and mental health amonghospital physicians in Japan: a path analysis. Ind Health2009; 47:166–172.49. Johns MM, Ossoff RH: Burnout in academic chairs
of otolaryngology: head and neck surgery. Laryngoscope2005; 115:2056–2061.50. Lert F, Chastang JF, Castano I: Psychological stress
among hospital doctors caring for HIV patients in thelate nineties. AIDS Care 2001; 13:763–778.51. Viviers S, Lachance L, Maranda M, Ménard C: Burn-
out, psychological distress, and overwork: the case ofQuebec's ophthalmologists. Can J Ophthalmol 2008;43:535–546.52. van der Ploeg E, Dorresteijn SM, Kleber RJ:
Critical incidents and chronic stressors at work: theirimpact on forensic doctors. J Occup Health Psychol2003; 8:157–166.53. McPhillips HA, Stanton B, Zuckerman B, Stapleton
B: Role of a pediatric department chair: factors leadingto satisfaction and burnout. J Pediatr 2007; 151:425–430.54. Ramirez AJ, Graham J, Richards MA, Cull A, Gregory
WM, Learning MS, Snashall DC, Timothy AR: Burnoutand psychiatric disorder among cancer clinicians. Br JCancer 1995; 71:1263–1269.55. Kuhn G, Goldberg R, Compton S: Tolerance for
uncertainty, burnout, and satisfaction with the career ofemergency medicine. Ann Emerg Med 2009; 54:106–113.56. Arigoni F, Bovier PA, Mermillod B, Waltz P,
Sappino AP: Prevalence of burnout among Swiss can-cer clinicians, paediatricians and general practitioners:who are most at risk? Support Care Cancer 2009;17:75–81.57. Bakker AB, Schaufeli WB, Sixma HJ, Bosveld W,
Van Dierendonck D: Patient demands, lack of reciprocity,and burnout: longitudinal study among general practi-tioners. J Organ Beh 2000; 21:425–441.58. Krasner MS, Epstein RM, Beckman H, Suchman
A, Chapman B, Mooney CJ, Quill TE: Association of aneducational program in mindful communication withburnout, empathy, and attitudes among primary carephysicians.JAMA 2009; 302:1284–1293.

Lee et al. Human Resources for Health 2013, 11:48 Page 15 of 16http://www.human-resources-health.com/content/11/1/48
59. Fujimori M, Oba A, Koike M, Okamura M,Akizuki N, Kamiya M, Akechi T, Sakano Y, UchitomiY: Communication skills training for Japanese oncolo-gists on how to break bad news.J Cancer Educ 2003;18:194–201.60. Ratanawongsa N, Roter D, Beach MC, Laird SL,
Larson SM, Carson KA, Cooper LA: Physician burnoutand patient-physician communication during primary careencounters.J Gen Intern Med 2008; 23:1581–1588.61. Esquivel-Molina C, Buendia-Cano F, Martinez-Garcia
O. Martinez-Mendoza J, Martinez-Ordaz V, Velasco-Rodríguez V: Burnout syndrome in medical staff affiliated to atertiary care hospital (article in Spanish). Rev Med InstMex Seguro Soc 2007; 45:427–436.62. López-León E, Rodriguez-Moctezuma J, López-
Carmona J, Peralta-Pedrero M, Munguía-Miranda C:Professional burnout in family physicians and its asso-ciation with social demographic and labor factors(article in Spanish). Rev Med Inst Mex Seguro Soc 2007;45:13–19.63. Escribà-Agüir V, Artazcoz L, Pérez-Hoyos S: Effect
of psychosocial work environment and job satisfactionon burnout syndrome among specialist physicians (art-icle in Spanish). Gac Sanit 2008; 22:300–308.64. Santos M, Abalo J: Burnout syndrome in medical
staff working in neonatal intensive care units (article inSpanish). Psicologia y Salud 2005; 15:25–32.65. Lemaire JB, Wallace JE: Not all coping strategies
are created equal: a mixed methods study exploring physi-cians' self reported coping strategies. BMC Health Serv Res2010, 10:208.
AbbreviationsCI: Confidence interval; DP: Depersonalization; EE: Emotional exhaustion;HHR: Health human resources; OR: Odds ratio; PRISMA: Preferred reportingitems for systematic reviews and meta-analyses; SD: Standard deviation;SE: Standard error; WHO: World Health Organization.
Competing interestsThe authors declare that they have no competing interests.
Authors’ contributionsRL designed the study, interpreted data, wrote first and revised drafts,and constructed figures. BS analyzed and interpreted data, constructedtables, and critically evaluated both drafts for content. SH compiled andanalyzed data, and critically evaluated both drafts for content. BLcollected, compiled and interpreted data, created the categories for studyvariables, and participated in writing both drafts. LS collected, compiledand analyzed data, critically evaluated first draft for content, andparticipated in writing the revised draft. All authors read and approvedthe final manuscript.
AcknowledgementsAn earlier version of this paper was presented at the InternationalConference on Health Economics, Management and Policy, 27 to 30 June2011, Athens, Greece.
Author details1Department of Business Administration, University of Manitoba, 181Freedman Crescent, Winnipeg, MB R3T 5V4, Canada. 2EconomicsDepartment, University of the Fraser Valley, 33844 King Road, Abbotsford BC
V2S 7M7, Canada. 3Department of Psychology, University of Manitoba, 190Dysart Road, Winnipeg, MB R3T 5V4, Canada. 41 Glengarry Drive, Winnipeg,MB R3T 2J5, Canada. 5Facultad de Medicina, Universidad de la RepúblicaOriental del Uruguay, Gral Flores 2125 Sede Centrale, CP 11100, Montevideo,Uruguay.
Received: 15 May 2013 Accepted: 19 September 2013Published: 28 September 2013
References1. Buchan J: How can the Migration of Health Service Professionals be Managed
so as to Reduce any Negative Effects on Supply?. Copenhagen: World HealthOrganization; 2008. http://www.who.int/whr/2006/en/.
2. World Health Organization (WHO): The World Health Report 2006: WorkingTogether for Health. Geneva: WHO. http://www.euro.who.int/__data/assets/pdf_file/0006/75453/E93414.pdf.
3. Lundberg A: The Environment and Mental Health: A Guide for Clinicians.Mahwah, NJ: Lawrence Erlbaum Associates; 1998.
4. Fritzen SA: Strategic management of the health workforce indeveloping countries: what have we learned? Hum Resour Health 2007,5:4.
5. Van Lerberghe W, Conceicao C, Van Damme W, Ferrinho P: When staff isunderpaid: dealing with the individual coping strategies of healthpersonnel. Bull World Health Organ 2002, 80:581–584.
6. Lee RT, Lovell BL, Brotheridge CM: Tenderness and steadiness: Relatingjob and interpersonal demands and resources with burnout andphysical symptoms of stress in Canadian physicians. J Appl Soc Psychol2010, 40:2319–2342.
7. Wiskow C, Albreht T, de Pietro C: How to Create an Attractive and SupportiveWorking Environment for Health Professionals. Copenhagen: WHO; 2010:1–37.http://www.euro.who.int/__data/assets/pdf_file/0018/124416/e94293.pdf.
8. Shamian J, EI-Jardali F: Healthy workplaces for health workers in Canada:knowledge transfer and uptake in policy and practice. Healthc Pap 2007,7:6–25.
9. Department of Health: Mental Health and Ill Health in Doctors. London:Department of Health; 2008. http://lancashirecarelibraryblog.com/2008/02/22/doctors-health-mental-health-and-ill-health-in-doctors/.
10. Kuhn K: Challenge of modern working life to mental well-being andsocial inclusion, workplace-related mental health problems, risks andprevention. In Mental Health and Well-being at the Workplace: Protectionand Inclusion in Challenging Times. Edited by Baumann A, Muijen M, GaebelW. Copenhagen: WHO; 2010:13–17.
11. Moher D, Liberati A, Tetzlaff J, Altman D, PRISMA Group: Preferredreporting items for systematic reviews and meta-analyses: the PRISMAstatement. BMJ 2009, 339:332–339.
12. Rosenthal RA, Rosnow RL: Essentials of Behavioral Research: Methods andData Analysis. New York, NY: McGraw-Hill; 1984.
13. Bonett DG: Transforming odds ratios into correlations for meta-analyticresearch. Am Psychol 2007, 62:254–255.
14. Lewin K: Field Theory in Social Science: Selected Theoretical Papers. New York,NY: Harper and Row; 1951.
15. Lowe G, Chan B: Using common work environment metrics toimprove performance in healthcare organizations. Healthc Pap 2010,10:43–47.
16. Hunter JE, Schmidt FL: Methods of Meta-analysis: Correcting Error and Bias.Newbury Park, CA: Sage; 1990.
17. Randolph JJ, Edmonson RS: Using the Binomial Effect Size Display (BESD)to present the magnitude of effect sizes to the evaluation audience.Pract Assess Res Eval 2005, 10:1–7.
18. Whitener EM: Confusion of confidence intervals and credibility intervalsin meta-analysis. J Appl Psychol 1990, 73:315–321.
19. Sterne JAC, Harbord RM: Funnel plots in meta-analysis. Stata J 2004, 5:127–141.20. Rosenthal RA: The "file drawer problem" and tolerance for null results.
Psychol Bull 1979, 86:638–641.21. Schwarzer R: Meta: Meta-analysis Programs Version 5.3. National Collegiate
Software Clearinghouse: Raleigh, NC; 1989.22. Maslach C: What have we learned about burnout and health? Psychol
Health 2001, 16:607–611.23. Lovell BL, Lee RT, Frank E: May I long experience the joy of healing:
professional and personal well-being among physicians from a Canadianprovince. BMC Fam Pract 2009, 10:18.

Lee et al. Human Resources for Health 2013, 11:48 Page 16 of 16http://www.human-resources-health.com/content/11/1/48
24. Halbesleben JRB, Rathert C: Linking physician burnout and patientoutcomes: exploring the dyadic relationship between physicians andpatients. Health Care Manage Rev 2008, 33:29–39.
25. Shanafelt TD, Bradley KA, Wipf JE, Back AL: Burnout and self-reportedpatient care in an internal medicine residency program. Ann Intern Med2002, 136:358–367.
doi:10.1186/1478-4491-11-48Cite this article as: Lee et al.: Correlates of physician burnout acrossregions and specialties: a meta-analysis. Human Resources for Health2013 11:48.
Submit your next manuscript to BioMed Centraland take full advantage of:
• Convenient online submission
• Thorough peer review
• No space constraints or color figure charges
• Immediate publication on acceptance
• Inclusion in PubMed, CAS, Scopus and Google Scholar
• Research which is freely available for redistribution
Submit your manuscript at www.biomedcentral.com/submit