correlated iridates and iron pnictide and neutron
TRANSCRIPT
Persistent link: http://hdl.handle.net/2345/3803
This work is posted on eScholarship@BC,Boston College University Libraries.
Boston College Electronic Thesis or Dissertation, 2014
Copyright is held by the author, with all rights reserved, unless otherwise noted.
Combined Transport, Magnetizationand Neutron Scattering Study ofCorrelated Iridates and Iron PnictideSuperconductors
Author: Chetan Dhital
Boston College
The Graduate School of Arts and Sciences
Department of Physics
COMBINED TRANSPORT, MAGNETIZATION AND NEUTRON
SCATTERING STUDY OF CORRELATED IRIDATES AND IRON
PNICTIDE SUPERCONDUCTORS
a dissertation
by
CHETAN DHITAL
submitted in partial fulfillment of the requirements
for the degree of
Doctor of Philosophy
May 2014

copyright by CHETAN DHITAL
2014
COMBINED TRANSPORT, MAGNETIZATION AND NEUTRON
SCATTERING STUDY OF CORRELATED IRIDATES AND IRON
PNICTIDE SUPERCONDUCTORS
Author: Chetan Dhital
Advisor: Stephen D. Wilson
Abstract
The work performed within this thesis is divided into two parts, each focusing
primarily on the study of magnetic phase behavior using neutron scattering
techniques. In first part, I present transport, magnetization, and neutron scattering
studies of materials within the iridium oxide-based Ruddelsden-Popper series
[Srn+1IrnO3n+1] compounds Sr3Ir2O7 (n=2) and Sr2IrO4 (n=1). This includes a
comprehensive study of the doped bilayer system Sr3(Ir1-xRux )2O7. In second part, I
present my studies of the effect of uniaxial pressure on magnetic and structural phase
behavior of the iron-based high temperature superconductor Ba(Fe1-xCox)2As2.
Iridium-based 5d transition metal oxides host rather unusual
electronic/magnetic ground states due to strong interplay between electronic
correlation, lattice structure and spin-orbit effects. Out of the many oxides containing
iridium, the Ruddelsden-Popper series [Srn+1IrnO3n+1] oxides are some of the most
interesting systems to study both from the point of view of physics as well as from
potential applications. My work is focused on two members of this series Sr3Ir2O7
(n=2) and Sr2IrO4 (n=1). In particular, our combined transport, magnetization and
neutron scattering studies of Sr3Ir2O7 (n=2) showed that this system exhibits a
complex coupling between charge transport and magnetism. The spin magnetic
moments form a G-type antiferromagnetic structure with moments oriented along the
c-axis, with an ordered moment of 0.35±0.06 µB/Ir. I also performed experiments
doping holes in this bilayer Sr3(Ir1-xRux)2O7 system in order to study the role of
electronic correlation in these materials. Our results show that the ruthenium-doped
holes remain localized within the Jeff=1/2 Mott insulating background of Sr3Ir2O7,
suggestive of ‘Mott blocking’ and the presence of strong electronic correlation in
these materials. Antiferromagnetic order however survives deep into the metallic
regime with the same ordering q-vector, suggesting an intricate interplay between
residual AF correlations in the Jeff=1/2 state and metallic nanoscale hole regions. Our
results lead us to propose an electronic/magnetic phase diagram for Sr3(Ir1-xRux)2O7
system showing how the system moves from Jeff=1/2 antiferromagnetic Mott insulator
(Sr3Ir2O7) to paramagnetic Fermi liquid metal (Sr3Ru2O7). On the other hand, our
neutron scattering measurements on Sr2IrO4 (n=1), a prototypical Jeff=1/2 Mott
insulator, showed that the spins arranged antiferromagnetically in ab-plane with an
ordered moment comparable to that of Sr3Ir2O7.
The second part of my work is comprised of a neutron scattering-based study
of the Ba(Fe1-xCox)2As2 system, a bilayer family of iron-based high temperature
superconductors. Undoped, this system exhibits either simultaneous or nearly
simultaneous magnetic and structural phase transitions from a high temperature
paramagnetic tetragonal phase to low temperature orthorhombic antiferromagnetic
phase. With the gradual suppression of these two temperatures, the superconducting
phase appears with the highest TC obtained just beyond their complete suppression. It
has been proposed that these coupled magnetostructural transitions are secondary
manifestations which arise as a consequence of electronic nematic ordering that
occurs at a temperature higher than either of them. My work is mainly focused on
probing the spin behaviors coupling to this electronic nematic phase. I devised a small
device to apply uniaxial pressure along an in-plane high symmetry axis and studied
the magnetic and structural behavior in series of Ba(Fe1-xCox)2As2 compounds via
neutron scattering in presence of uniaxial pressure. There is an upward thermal shift
in the onset of structural and magnetic transition temperature caused by this uniaxial
pressure which is surprisingly insensitive to cobalt concentration in the absolute scale.
Furthermore, on the first order side of the phase diagram (below the tricritical point),
the structural and magnetic transitions are decoupled with magnetic transition
following structural distortion. This study suggests the importance of both spin-lattice
and orbital-lattice interactions in these families of compounds.

This dissertation is dedicated to my family.

Acknowledgements
First and foremost: I want to express my sincere thanks to my advisor Stephen
D. Wilson for providing me the opportunity to work in his research group. He not
only gave me a chance to work on many interesting projects but also taught me
magnetic neutron scattering from the beginning. His strong interest and expertise in
correlated magnetism and his curiosity toward condensed matter phenomena in
general are the key inspiring factors for this work. I am one of the lucky few who can
easily access his advisor to discuss any scientific or personal matter. I would also like
to express my special thanks to Dr. Wilson for nominating me for the GMAG
Outstanding Dissertation in Magnetism Award. The work presented herein was
awarded this honor at the 2014 APS March Meeting.
I next thank to Professor Cyril Opeil and my graduate committee members
Professor Vidya Madhavan, Professor Michael Graf and Professor Ziqiang Wang for
their efforts in our collaborations, as well as constant support and valuable
suggestions throughout this work. I also thank their group members for their
cooperation.
I cannot continue without thanking Jeffry Lynn (NIST), Clarina Dela Cruz
(ORNL), Zahra Yamani (CNBC), Wei Tian (ORNL), Masa Matsuda (ORNL) and
many others for their support in performing neutron scattering experiments. I would
like to especially thank Zahra who also taught me much of the instrumentation
techniques for neutron scattering.
I would also like to extend the acknowledgements to my colleagues Sovit
Khadka, Tom Hogan, Zhensong Ren, Xiang Chen, Rebacca Dally, Mani Pokharel,
Binod Rizal and the whole physics department for their direct and indirect support
throughout this work.
I must finally thank my first teachers and caregivers, my parents Homnath and
Bedmaya, for their endless unconditional support from the day I was born. I also want
to express my thanks to my wonderful loving wife Suchita for her constant support
and inspiration, who always encouraged me to focus on research, despite this keeping
me away from household business. I also thank my kids Hridum and Ridhima whose
innocent smiles and activities always refreshed me as well as encouraged me to
become a responsible father. Finally I like to thank my whole family and the Nepali
community in Boston for their help and inspiration.
ii
Table of Contents
Table of Contents……………………………………………………………………………ii
Chapter 1: Introduction……………………………………………………………………...1
Outline of this work…………………………………………………………..2
Chapter 2: Introduction to Iridates and Neutron Scattering……………………………...5
2.1 Introduction……………………………………………………………... 5
2.2 Spin-Orbit Interaction…………………………………………………... 6
2.3 Crystal Field Splitting, Energy Hierarchy and Ground State Wave
function…………………………………………………………………..8
2.4 Ruddelsden-Popper Series………………………………………….......12
2.5 Metal Insulator Transition and Resistivity…………………………….. 15
2.6 Magnetism……………………………………………………………... 18
2.6.1 Dipolar Interaction……………………………….. 20
2.6.2 Exchange Interaction…………………………….. 20
a. Direct Exchange……………………………... 20
b. Superexchange………………………………. 21
c. RKKY Exchange……………………………. 21
d. Double Exchange……………………………. 22
e. Dzyaloshinsky-Moria interaction……………. 23
f. Kondo Exchange…………………………….. 23
2.6.3 Magnetic Ordering……………………………….. 24
a. Ferromagnetic Ordering……………………... 24
b. Antiferromagnetic Ordering…………………. 25
2.7 Magnetism in Iridates………………………………………………….. 27
2.8 Neutron Scattering…………………………………………………….. 28
2.8.1 Elastic Nuclear Scattering………………………. 30
2.8.2 Elastic Magnetic Scattering……………………… 33
2.8.3 Polarized Neutron Scattering……………………. 36
Chapter 2 References………………………………………………………………………. 37
Chapter 3: Experimental Techniques…………………………………………………….. 42
3.1 Crystal Growth………………………………………………………….. 42
3.1.1 Flux Growth……………………………………… 43
3.2 X-ray Diffraction………………………………………………………. 44
3.3 Energy Dispersive Spectroscopy (EDS)……………………………….. 46
3.4 Resistivity Measurement………………………………………………... 47
3.5 Magnetization Measurement……………………………………………. 48
3.6 Thermogravimetric Analysis…………………………………………… 49
3.7 Neutron Scattering……………………………………………………… 50
Chapter 3 References……………………………………………………………………… 53
Chapter 4: Correlated Phase Behavior of Sr2IrO4………………………………………. 55
4.1 Motivation…………………………………………………………….. ...55
4.2 Crystal Growth and Preliminary Characterization……………………… 56
4.3 Neutron Scattering of Sr2IrO4 Single Crystal…………………………. ..57
4.4 Discussion and Conclusion……………………………………………...66
Chapter 4 References………………………………………………………………………. 71
Chapter 5: Electronic and Magnetic Phase Behavior of Sr3Ir2O7………………………. 74
5.1 Motivation………………………………………………………………. 74
5.2 Crystal Growth and Preliminary Characterization……………………… 75

iii
5.3 Resistivity of Sr3Ir2O7………………………………………………….. 76
5.4 Magnetization of Sr3Ir2O7………………………………………............. 78
5.5 Neutron Scattering of Sr3Ir2O7 …………………………………………..79
5.6 Discussion and Conclusion……………………………………………... 85
Chapter 5 References………………………………………………………………………. 87
Chapter 6: Electronic/magnetic Phase Diagram of Sr3(Ir1-xRux)2O7 ………………........ 90
6.1 Motivation……………………………………………………………….. 90
6.2 Crystal Growth and Preliminary Characterization…………………......... 91
6.3 Resistivity of Sr3(Ir1-xRux)2O7…………………………………………… 92
6.4 Magnetization of Sr3(Ir1-xRux)2O7 ………………………………………..95
6.5 Neutron Scattering of Sr3(Ir1-xRux)2O7 ………………………………….. 97
6.6 Scanning tunneling spectroscopy study of Sr3(Ir1-xRux)2O7 …………….. 99
6.7 Discussion and Conclusion…………………………………………….. 101
Chapter 6 References……………………………………………………………………... 106
Chapter 7: Iron Based Superconductors………………………………………………... 110
7.1 Introduction…………………………………………………………… 110
7.2 Phase Diagram of Ba(Fe1-xCox)2As2 system…………………………… 112
7.3 Nematicity and Detwinning…………………………………………… 114
7.4 Effect of Uniaxial Pressure on Structural and Magnetic Phase Behavior of
Ba(Fe1-xCox)2As2…………………………………………………….. 117
7.5 Experimental Details………………………………………………… 118
7.6 Effect of Uniaxial Pressure on TS and TN for Parent BaFe2As2 ………..119
7.7 Evolution of Spin Susceptibility with doping in Ba(Fe1-xCox)2As2 under
Uniaxial Pressure…………………………………………………….. 125
7.8 Discussion and Conclusion……………………………………………..132
Chapter 7 References……………………………………………………………………... 136
Chapter 8: Conclusion and Future Works……………………………………………… 140
Appendix…………………………………………………………………………………... 142
A. Some Facts about Magnetic Neutron Scattering………………………..142
B. Calculation of the Scale Factor (S) …………………………………….144
C. Calculation of Magnetic Structure Factor and Ordered Moment …….145
Appendix References……………………………………………………………………... 147
Publications List…………………………………………………………………………... 148
1
Chapter 1: Introduction
I want to start with high school definition of condensed matter physics that it
is a branch of physics which deals with the properties of matter when the matter is in
some sort of “condensed” form like liquid or solid. After my undergraduate and
master degree from Nepal, where I took most of the physics courses, I came to realize
that physics is not just the collection of assumptions, hypothetical problems and their
solutions in terms of unknown constants, particularly within condensed matter
physics. I also noticed that many great scientists have spent their whole life in this
field and most of the modern technologies we used today are the outcome of their
endless efforts in condensed matter research.
The facts mentioned above give the importance of the condensed matter
research. Now the real question to ask is: what is so special about being ‘condensed’
and why this condensed phase hosts so many different phenomena?. There is a very
short answer by P.W Anderson: “more is different”. When a large number of particles
having either charge or mass or spins or all of them together “condense” to form
solids or liquids they may lose their individual identity due to various types of
classical and quantum interactions between them. Thus, a condensed phase of matter
is in fact an assembly of a large number of microscopic constituents like charges,
masses, spins, interactions and excitations (phonons, magnons,polarons, holons,
polaritons, plasmons, solitons etc). The various interactions between these
microscopic constituents result in the emergent new macroscopic quantum states like
superconductivity, magnetism, metals, insulators, topological insulators, spin liquids,
spin ices etc. In some cases two phenomena may look different at first sight but may
still be governed by the same fundamental interactions. Condensed matter physics
2
takes the responsibility of connecting microscopic and macroscopic behaviors and
tries to organize/classify phenomena according to the mechanisms behind them.
This thesis deals with macroscopic properties of two classes of materials
within current condensed matter research: correlated iridates and iron pnictides.
There are some broad similarities between these two seemingly different families of
compounds where they lay close to the intermediate correlation regime with iridates
on the strong correlation side and iron pnictides on the weak correlation side.
Out of many different types of oxides of iridium, this thesis deals with the
Ruddlesden-Popper series oxides (Srn+1IrnO3n+1) where I have used 3 main probes:
namely electrical transport, bulk magnetization and neutron scattering to explore the
electronic/magnetic ground states and we have also shown that the electronic
correlations are important along with the strong spin-orbit interactions.
Regarding the iron-based superconductors (iron pnictides), this work is
focused on the study of structural and spin behavior of the parent and underdoped
system Ba(Fe1-xCox)2As2.In this study, I have shown that even a relatively small
symmetry breaking field, when applied in the high temperature, electronically
anisotropic phase,the so-called “nematic phase”, gives a dramatic response in the
lattice and spin behavior of the system. The evolution of the spin and lattice
susceptibility to strain with doping in presence of symmetry breaking uniaxial
pressure hints toward the importance of combined effect of spin-lattice and orbital-
lattice interactions in these systems.
Outline of this Work
The reminder of this work is divided into following chapters
3
Chapter 2: Introduction to Iridates and Neutron Scattering
This chapter provides a brief introduction to iridates, various terminologies like
crystal field splitting, spin orbit coupling, metal insulator transitions, magnetism and
neutron scattering along with key mathematical relations.
Chapter 3: Experimental Methods
This chapter provides a brief overview of the different experimental methods used
throughout the thesis including crystal growth, X-ray diffraction, energy dispersive
analysis, magnetization measurement, resistivity measurement, thermo-gravimetric
analysis and neutron scattering.
Chapter 5: Structural/magnetic Behavior of Sr2IrO4
This chapter provides the result of neutron scattering study on single layer parent
compound Sr2IrO4 which reveals the spin structure, ordered moment and the lattice
distortions.
Chapter 5: Electronic/spin Behavior of Sr3Ir2O7
This chapter provides the results of combined magnetotransport and neutron
scattering study on bilayer parent compound Sr3Ir2O7 revealing its electronic/magnetic
ground state along with previously unreported structural distortions.
Chapter 6: Electronic/magnetic Phase Diagram of Sr3(Ir1-xRux)2O7
This chapter is about the comprehensive study of doped bilayer system Sr3(Ir1-
xRux)2O7, which establishes an electronic/magnetic phase diagram with coexisting
multiple phases. This study also stresses the role of electronic correlations in this
bilayer system.

4
Chapter 7: Effect of Uniaxial Pressure on Magnetic and Structural Phase
Behavior of Ba(Fe1-xCox)2As2.
This chapter gives a very brief introduction to iron-based superconductors and
discusses the effect of uniaxial pressure on the structural and magnetic phase behavior
of concentrations in the underdoped regime.
Chapter 8: Conclusions and Future Works
In this chapter I summarize the results on both systems and suggest some future works
that should be pursued.
Appendix
List of Publications
5
Chapter 2: Introduction to Iridates and Neutron Scattering
2.1 Introduction
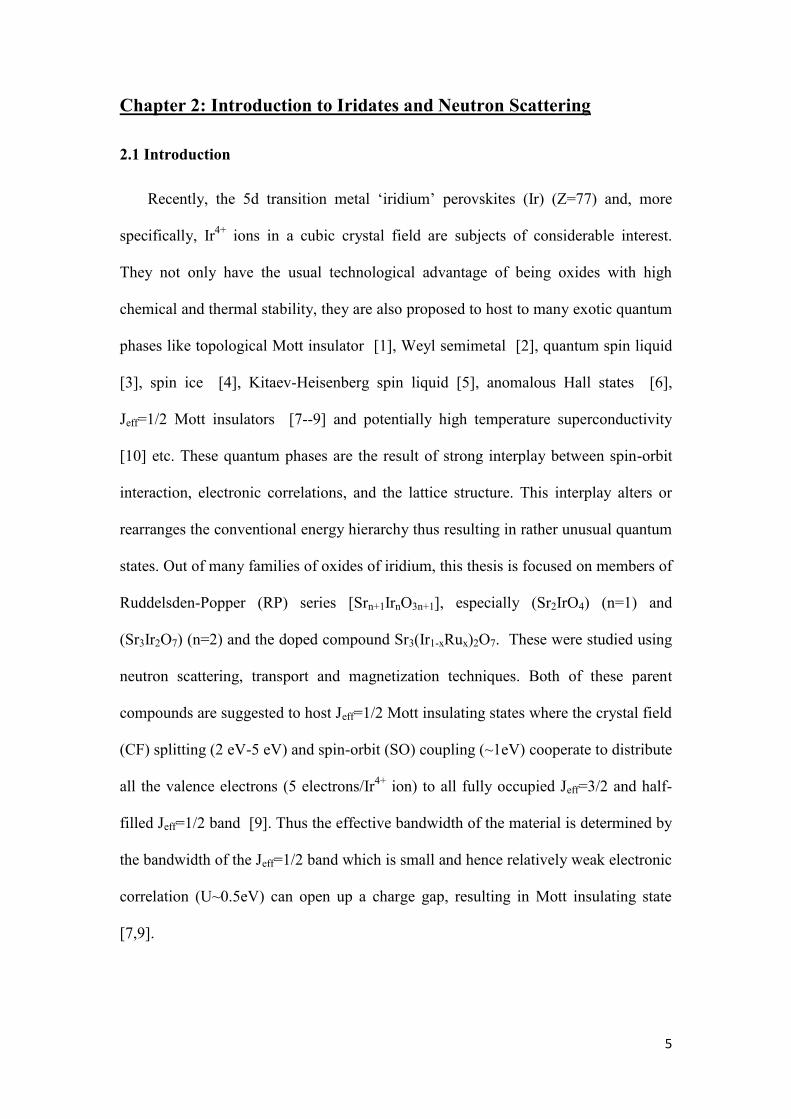
Recently, the 5d transition metal ‘iridium’ perovskites (Ir) (Z=77) and, more
specifically, Ir4+
ions in a cubic crystal field are subjects of considerable interest.
They not only have the usual technological advantage of being oxides with high
chemical and thermal stability, they are also proposed to host to many exotic quantum
phases like topological Mott insulator [1], Weyl semimetal [2], quantum spin liquid
[3], spin ice [4], Kitaev-Heisenberg spin liquid [5], anomalous Hall states [6],
Jeff=1/2 Mott insulators [7--9] and potentially high temperature superconductivity
[10] etc. These quantum phases are the result of strong interplay between spin-orbit
interaction, electronic correlations, and the lattice structure. This interplay alters or
rearranges the conventional energy hierarchy thus resulting in rather unusual quantum
states. Out of many families of oxides of iridium, this thesis is focused on members of
Ruddelsden-Popper (RP) series [Srn+1IrnO3n+1], especially (Sr2IrO4) (n=1) and
(Sr3Ir2O7) (n=2) and the doped compound Sr3(Ir1-xRux)2O7. These were studied using
neutron scattering, transport and magnetization techniques. Both of these parent
compounds are suggested to host Jeff=1/2 Mott insulating states where the crystal field
(CF) splitting (2 eV-5 eV) and spin-orbit (SO) coupling (~1eV) cooperate to distribute
all the valence electrons (5 electrons/Ir4+
ion) to all fully occupied Jeff=3/2 and half-
filled Jeff=1/2 band [9]. Thus the effective bandwidth of the material is determined by
the bandwidth of the Jeff=1/2 band which is small and hence relatively weak electronic
correlation (U~0.5eV) can open up a charge gap, resulting in Mott insulating state
[7,9].
6
Some of the outstanding issues in the field are: (1) the crystal structures of both
Sr3Ir2O7 and Sr2IrO4 were not fully understood; (2) although Jeff=1/2 Mott-insulating
behavior was proposed, there remains alternative theories regarding the microscopic
origin of the insulating phase. (3) The exact information about the magnitude and
direction of the ordered spin moment was still lacking, especially with no neutron
studies on the single crystals of these compounds (4) There was ongoing debate about
the nature of the insulating state: whether they are spin-orbit driven Jeff=1/2 Mott-
insulator or they are magnetic ordering driven Slater insulators [11]. With these
situations in hand we moved forward, successfully grew single crystals and performed
neutron scattering experiments. By now, along with our studies, there are numerous
other studies involving transport, magnetization, crystal structure, electronic structure
and spin structure of Sr2IrO4 [7,12--18] and Sr3Ir2O7 [19--26]. The results,
significance and uniqueness of our work will be discussed in the following chapters 4,
5 and 6. In the following sections, I will define some of the relevant physics along
with mathematical formalism of phenomena that are relevant to this work. A curious
reader can refer to the references given in each section.
2.2 Spin-Orbit Interaction
Spin-Orbit coupling is a relativistic effect in solids with heavier elements that
prevents the orbital angular momentum from being quenched. Each electron in a solid
has 3 degrees of freedom: Spin, Orbital and Charge. The interplay between these
determines the properties of a solid. The spin and orbital motion have angular
momentum associated with them, which produce magnetic moments. In the electrons’
rest frame, it seems as if the nucleus is orbiting around it producing relativistic
magnetic field which is given by [27].

7
2c
ε v
B (2.2.1)
Where is the electric field at the electron due to nucleus and V(r) is the
corresponding potential energy and is given by expression [27]
( )dV
Vrdr
r r
ε r (2. 2.2)
The magnetic field ( ) interacts with the spin angular momentum of the electron
giving spin orbit Hamiltonian HSO given by [27]
2
2
( ) ( ( ) )
2 2SO
e
e dVH
m c r
m B r S L (2.2.3)
where L is the orbital angular momentum and the magnetic moment m associated
with spin S is given by m=(geħ/2me)S with g as Lande’s g factor. For the Coulomb
field in a hydrogen-like atom one can write the derivative term as [27]
3
( )
4 o
dV r Ze
rdr r
(2.2.4)
Using
3
33 3
0
1
1( )( 1)
2
Z
ra n l l l
(2.2.5)
The spin orbit splitting energy can be written as [27]
4 2
3
0 0
2
3 14 ( )( 1)
2
SO
Z eE
a n l l l
S L (2.2.6)
This expression shows that the spin-orbit coupling varies as the fourth power of
atomic number Z. Iridium (5d elements in general) have relatively large atomic
8
number (Z=77) which is the reason why oxides containing iridium are an ideal
candidate for exploring spin-orbit driven physics. The spin-orbit splitting energy in
these oxides (Sr2IrO4 and Sr3Ir2O7) is of the order of (0.1eV – 1eV). This energy is
comparable to coulomb energy of about (0.4eV – 2eV).
2.3 Crystal Field Splitting, Energy Hierarchy and Ground State Wave function
For a free transition metal ion (M+), the outermost d orbitals are fivefold
degenerate. However, in a real solid this positive metal ion is surrounded by negative
ions (O2-
in metal oxides) which occupy fixed positions relative to metal ion. This
surrounding environment of negative ions creates an inhomogeneous electric field at
the position of positive metal ion. This electric field is called the crystal field [28]
which partially lifts the degeneracy of the d orbitals. This is called crystal field
splitting. The energy splitting depends upon how the negative ions are located relative
to positive ions. If the negative ions are located near the point of maximum charge
density of the positive ion, the two electron clouds experience repulsion resulting in
the increase in energy relative to other ions.
In Ruddelsden-Popper series iridates [Srn+1IrnO3n+1], the Ir4+
ion is at the center of
octahedral formed by 6 surrounding oxygen ions (O2-
). This arrangement separates the
5 degenerate d levels into two groups t2g (dxy, dyz,dxz) and eg (dx2
-y2,dz
2) with E(eg) >
E(t2g) as shown in Figure 2.3.1.
9
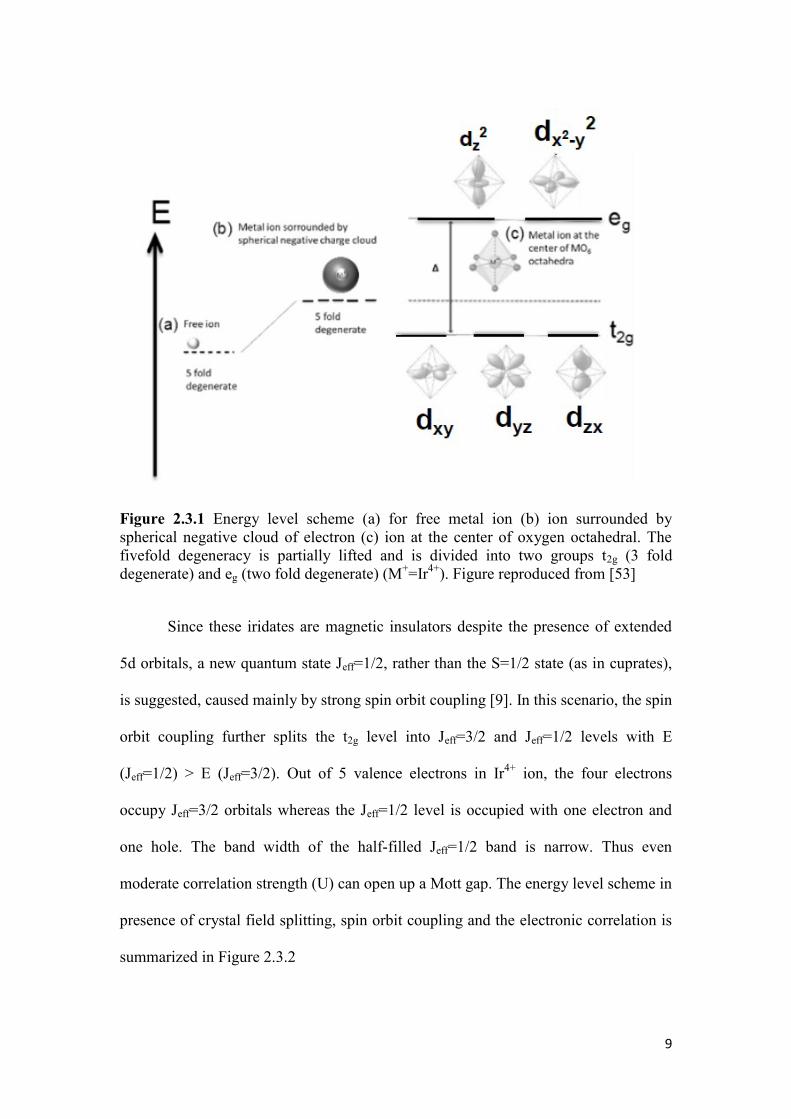
Figure 2.3.1 Energy level scheme (a) for free metal ion (b) ion surrounded by
spherical negative cloud of electron (c) ion at the center of oxygen octahedral. The
fivefold degeneracy is partially lifted and is divided into two groups t2g (3 fold
degenerate) and eg (two fold degenerate) (M+=Ir
4+). Figure reproduced from [53]
Since these iridates are magnetic insulators despite the presence of extended
5d orbitals, a new quantum state Jeff=1/2, rather than the S=1/2 state (as in cuprates),
is suggested, caused mainly by strong spin orbit coupling [9]. In this scenario, the spin
orbit coupling further splits the t2g level into Jeff=3/2 and Jeff=1/2 levels with E
(Jeff=1/2) > E (Jeff=3/2). Out of 5 valence electrons in Ir4+
ion, the four electrons
occupy Jeff=3/2 orbitals whereas the Jeff=1/2 level is occupied with one electron and
one hole. The band width of the half-filled Jeff=1/2 band is narrow. Thus even
moderate correlation strength (U) can open up a Mott gap. The energy level scheme in
presence of crystal field splitting, spin orbit coupling and the electronic correlation is
summarized in Figure 2.3.2
10
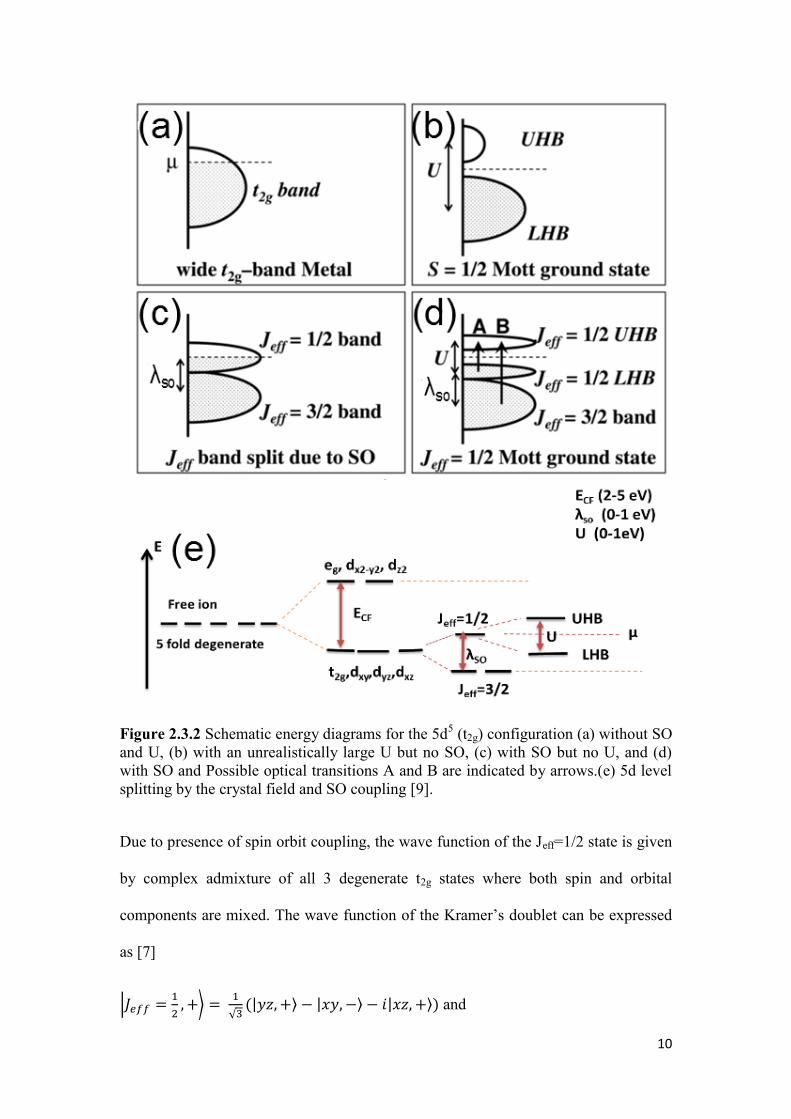
Figure 2.3.2 Schematic energy diagrams for the 5d5 (t2g) configuration (a) without SO
and U, (b) with an unrealistically large U but no SO, (c) with SO but no U, and (d)
with SO and Possible optical transitions A and B are indicated by arrows.(e) 5d level
splitting by the crystal field and SO coupling [9].
Due to presence of spin orbit coupling, the wave function of the Jeff=1/2 state is given
by complex admixture of all 3 degenerate t2g states where both spin and orbital
components are mixed. The wave function of the Kramer’s doublet can be expressed
as [7]
|
⟩
√ | ⟩ | ⟩ | ⟩ and
11
|
⟩
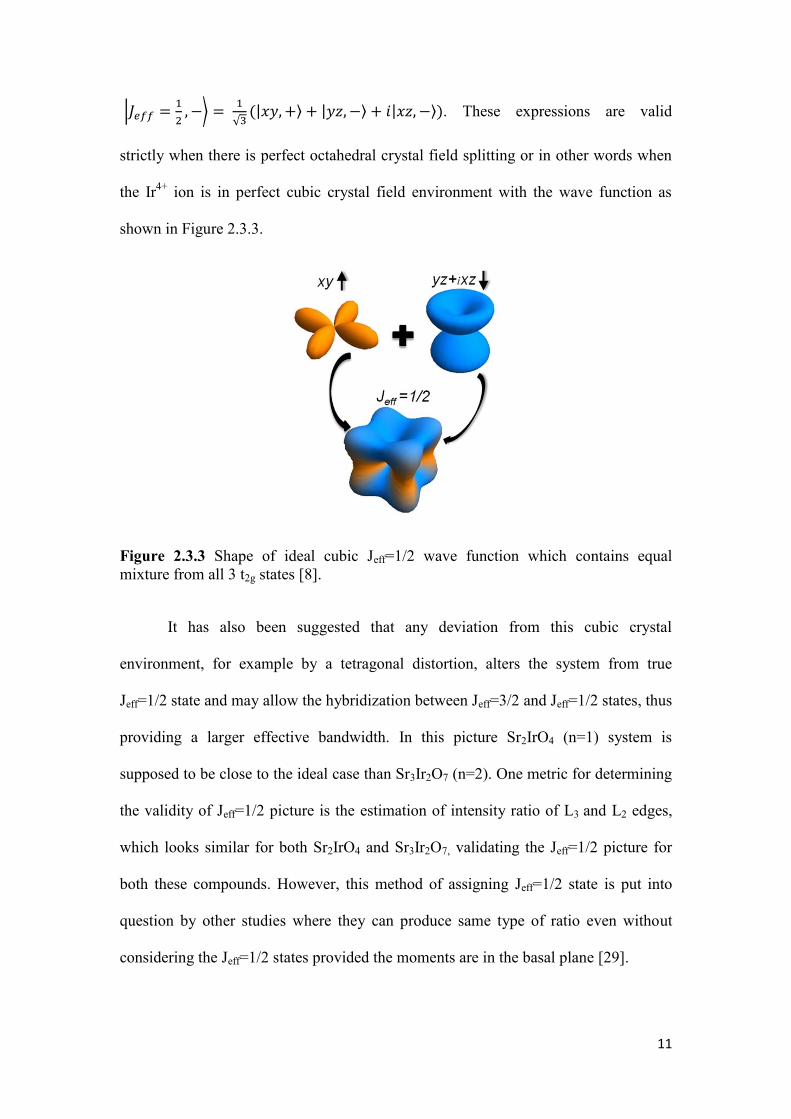
√ | ⟩ | ⟩ | ⟩ . These expressions are valid
strictly when there is perfect octahedral crystal field splitting or in other words when
the Ir4+
ion is in perfect cubic crystal field environment with the wave function as
shown in Figure 2.3.3.
Figure 2.3.3 Shape of ideal cubic Jeff=1/2 wave function which contains equal
mixture from all 3 t2g states [8].
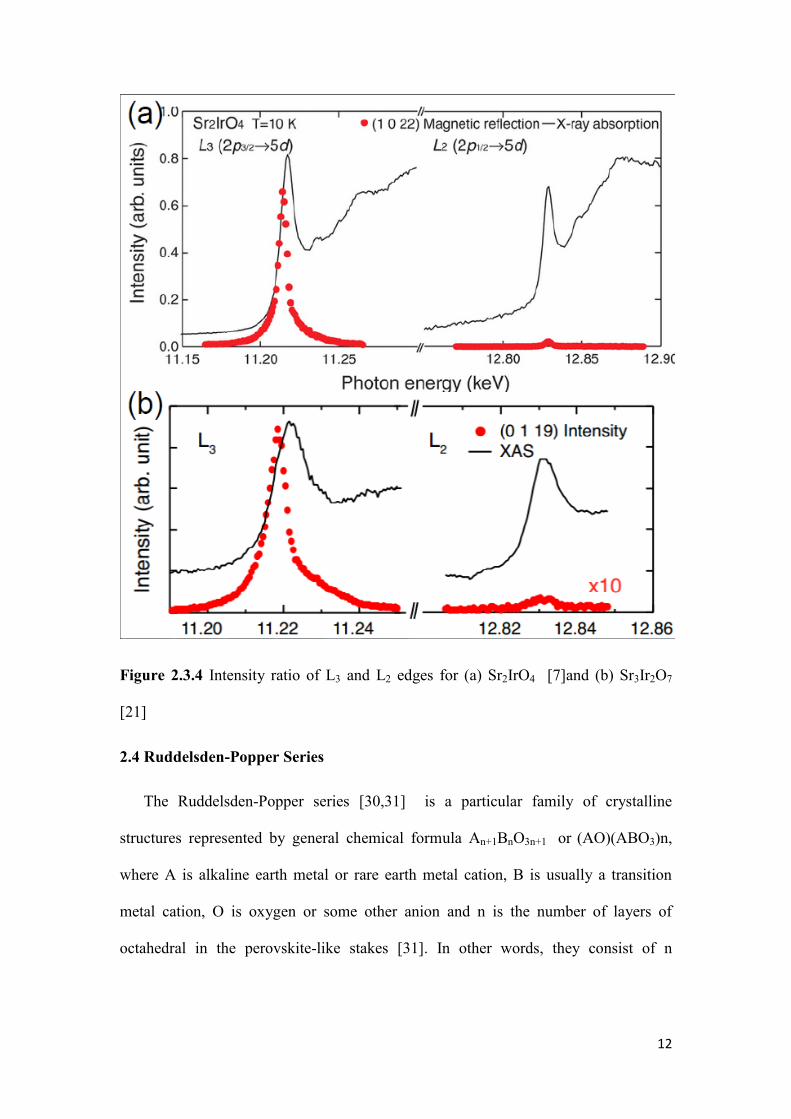
It has also been suggested that any deviation from this cubic crystal
environment, for example by a tetragonal distortion, alters the system from true
Jeff=1/2 state and may allow the hybridization between Jeff=3/2 and Jeff=1/2 states, thus
providing a larger effective bandwidth. In this picture Sr2IrO4 (n=1) system is
supposed to be close to the ideal case than Sr3Ir2O7 (n=2). One metric for determining
the validity of Jeff=1/2 picture is the estimation of intensity ratio of L3 and L2 edges,
which looks similar for both Sr2IrO4 and Sr3Ir2O7, validating the Jeff=1/2 picture for
both these compounds. However, this method of assigning Jeff=1/2 state is put into
question by other studies where they can produce same type of ratio even without
considering the Jeff=1/2 states provided the moments are in the basal plane [29].
12
Figure 2.3.4 Intensity ratio of L3 and L2 edges for (a) Sr2IrO4 [7]and (b) Sr3Ir2O7
[21]
2.4 Ruddelsden-Popper Series
The Ruddelsden-Popper series [30,31] is a particular family of crystalline
structures represented by general chemical formula An+1BnO3n+1 or (AO)(ABO3)n,
where A is alkaline earth metal or rare earth metal cation, B is usually a transition
metal cation, O is oxygen or some other anion and n is the number of layers of
octahedral in the perovskite-like stakes [31]. In other words, they consist of n

13
consecutive perovskite blocks (ABO3)n, which are separated by rock salt layers (AO)
where the perovskite structure is the n = end member as shown in Figure. 2.3.5.
Figure 2.3.5 Ruddelsden-Popper series crystal structure for (a) A2BO4 (n=1) (b)
A3B2O7 (n=2) and (c) ABO3 (n=∞). Figure reproduced using VESTA 3 software [32].
If the octahedra are perfect (meaning Ir4+
is in perfect cubic environment),
then n=1 and n=2 compounds tend to have tetragonal symmetry but when there is a
rotation or tilting of octahedral away from the perfect condition, the symmetry of the
crystal is reduced. We observe this in our samples of Sr2IrO4 and Sr3(Ir1-xRux) 2O7. In
Sr2IrO4 the neighboring octahedra rotate about the c-axis by about 11o
and this
staggered rotation propagates along both in-plane and c axes [14]. This increases the
unit cell dimension as well as reduces the symmetry of the crystal (breaks inversion
symmetry). The unit cell dimension becomes (√2a×√2a×2c) with space group
14
I41/acd (no.142) instead of (a×a×c) with space group I4/mmm (no.139) where a is a-
axis lattice parameter of undistorted unit cell and c is the c-axis lattice parameter of
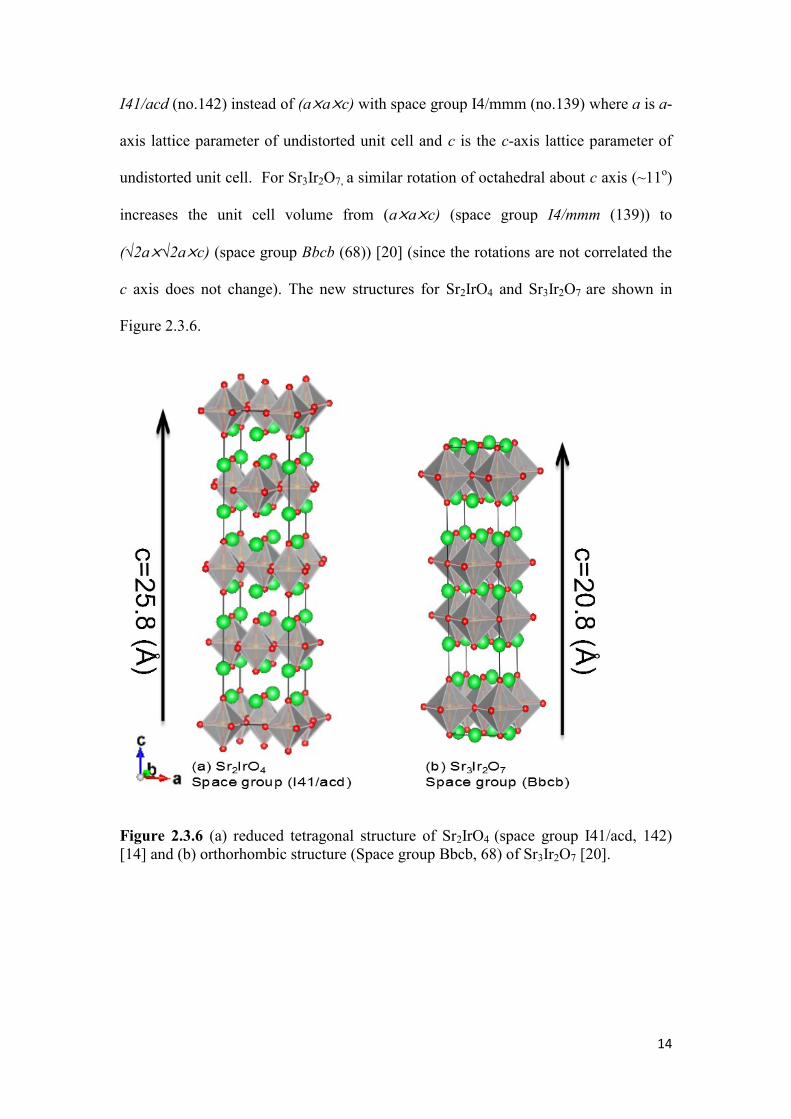
undistorted unit cell. For Sr3Ir2O7, a similar rotation of octahedral about c axis (~11o)
increases the unit cell volume from (a×a×c) (space group I4/mmm (139)) to
(√2a×√2a×c) (space group Bbcb (68)) [20] (since the rotations are not correlated the
c axis does not change). The new structures for Sr2IrO4 and Sr3Ir2O7 are shown in
Figure 2.3.6.
Figure 2.3.6 (a) reduced tetragonal structure of Sr2IrO4 (space group I41/acd, 142)
[14] and (b) orthorhombic structure (Space group Bbcb, 68) of Sr3Ir2O7 [20].
15
2.5 Metal Insulator Transition and Resistivity
A true distinction between metal and insulator can be made only at T=0 K where
an insulator will have vanishingly small charge conductivity and is characterized by a
gap in the charge excitation spectrum. At finite temperature one can only speak of
how good or how bad an insulator or metal is. The electron transport in a solid can be
affected by electron-ion interaction, electron-electron interaction and external fields
[33]. Generally the electron-ion interaction leads to band insulators [28], Peierls
insulators [33] (due to interaction with static lattice deformation) or an Anderson
insulator [34] (due to interactions with disorder or lattice imperfections). The
insulators resulting from electron-electron interactions can be classified as Slater
insulators [35] (magnetic ordering primary, electron-electron interaction secondary),
Mott-Hubbard [36] insulators (electron-electron interaction, no magnetic ordering)
and Mott-Heisenberg [37] insulators (electron-electron interaction followed by
magnetic ordering). The Slater insulating states can be realized in an
antiferromagnetically ordered lattice which can be taken as combination of two
interpenetrating half-filled sub lattices (one electron per site). In such arrangement,
the nearest neighbors always have opposite spin. These opposite spins occupy two
different sublattices to minimize their interaction. Hence a spin density wave is
formed with some commensurate wave vector Q where the density of up spin or down
spin varies periodically. This is in fact the result of tendency of electrons to avoid
each other which generally results in increase in potential energy at the expense of the
kinetic energy. Due to opposite spins on neighboring sublattices, the unit cell in real
space is doubled- meaning the reciprocal space unit cell is halved. At the boundary of
this new magnetic Brillouin zone, the bands split and hence the energy of the
occupied level is lowered. At half band filling the band splitting produces a charge
16
excitation gap [33]. The Slater and Mott-Heisenberg insulators differ from each other
because in a Slater insulator the occurrence of an insulating state is simultaneous to
formation of long-range antiferromagnetic order, though this is not the case in Mott-
Heisenberg insulator. Again, in a real solid all types of interactions are present; it is
only the strength of interaction that varies. Whatever the origin of the transition and
the nature of insulating/metallic state is, the metal insulator transitions can be broadly
classified into two types: quantum phase transition and thermodynamic phase
transition. The quantum phase transition results from the continious competition
between electrons’ kinetic and potential energy whereas the thermodynamic phase
transition results from the competition between internal energy and entropy [33]. A
good discussion of metal-insulator transition can also be found in the following
review paper by Imada et al [38].
The metal insulator transition can also be caused by percolation [39].This type of
transition mostly occurs in a doped system, where for lower concentration of dopants,
they form independent metallic clusters. However, after certain critical concentration,
these clusters start to connect throughout the whole sample providing an ‘electrical
short’ for the conduction. The value of critical concentration xc depends upon the
dimensionality of the system. The conductivity variation in percolation transition can
be expressed as [40]:
'
' 0 1
t
o
c
xT
x
(2.5.1)
Where x’ is the metallic volume fraction, x’c is the percolation threshold and t is a
critical exponent. Both x’c and t depend upon dimensionality. The system, Sr3 (Ir1-
xRux) 2O7 used in our study also shows a near-percolative (as it does not strictly obey
equation 2.5.1) metal insulator transition. The ruthenium holes form independent
17
metallic clusters at low Ru concentration however after critical concentration xc=0.35,
the system becomes truly metallic which is close to 2D percolation threshold xc=0.41.
I will discuss in further detail about this metal-insulator transition in chapter 6.
Now I turn to the temperature dependence of resistivity in different systems.
From the temperature dependence of resistivity, one can obtain crucial information
such as: gap size (activated gap in insulating/semiconducting system), nature of
metallic state (Fermi/non-Fermi liquid), conduction mechanism in insulating state and
the effective dimensionality of the system. For example: in a metallic system the
temperature dependence of the electronic part of resistivity can be expressed as [41]
n
oT AT (2.5.2)
Where is the residual resistivity, A is a temperature independent coefficient. For a
Fermi liquid metal, the exponent n is nearly 2, however in a highly correlated metal n
is less than 2. The system with n ~1 is supposed to have quantum critical behavior
with a quantum phase transition occurring at T=0 K. In an insulating
(semiconducting) system with an activated gap, the resistivity can be expressed as
[28]
0 exp( )g
B
ET T
K T (2.5.3)
Where Eg is the activated gap.
Similarly, in an insulator with variable range hoping mechanism the resistivity is
expressed as [42]
1
10 0 exp
dTT T
T
(2.5.4)
18
Where T0 is some characteristic temperature of system and d is the effective
dimensionality for the charge conduction.
2.6 Magnetism
The fundamental quantity in magnetism is the magnetic moment which is defined in
terms of an infinitesimal current loop and, given by [27]
s
Ids μ n (2.6.1)
Where n is the unit vector normal to the closed loop where the current I is flowing. dS
is the area element and integration is taken over the area of the loop. The magnetic
moment of an orbiting electron is called the Bohr magneton and is given by [27]
2
B
e
e
m (2.6.2)
Instead of just orbital motion, the electron also has the spin about its own axis. This
motion also has an associated angular momentum and hence associated magnetic
moment. In a real atom, the orbital angular momentum of the electron depends upon
the electronic state occupied by the electron. The total magnetic moment of an atom
or ion comes from vector sum of orbital and spin magnetic moment of all the
constituent electrons. The summation scheme (L-S or J-J) depends upon the spin-orbit
coupling. An atom without unpaired electrons cannot have a magnetic moment
because the vector sum cancels out completely but an atom with unpaired electrons
possess magnetic moment because the result of the summation is non-zero. A real
solid contains a large number of atoms or ions each having either zero or some net
magnetic moment in the absence of an external magnetic field. If there is no
interaction between atomic moments then they can be classified into two groups [28]:
diamagnetic and paramagnetic. When an assembly of atoms each with zero magnetic

19
moment is placed in an external magnetic field, each individual atom acquire a
magnetic moment opposite to the direction of magnetic field, a consequence of Lenz’s
law. This induced magnetic moment persists as long as the field is applied and is
largely independent of temperature. These materials, which have negative
susceptibility, are classified as diamagnetic. In fact every material has an atomic
diamagnetic component. But in atoms with non-zero and non-interacting magnetic
moments subject to an external field, they tend to align in the direction of magnetic
field giving positive and temperature dependent susceptibility. These materials having
non interacting atomic magnets of positive temperature dependent susceptibility are
called paramagnetic. However, the paramagnetic susceptibility of a non-interacting
electron gas is independent of temperature and depends only upon the density of
electronic states at the Fermi level. This susceptibility is called Pauli susceptibility
and is given by [28]
2
Pauli B fg E (2.6.3)
Where ( ) is the density of electronic states at the Fermi level. The free electrons
also have intrinsic diamagnetic reponse called Landau diamagnetism. This
diamagnetism is also independent of temperature and is given by1
3Landau Pauli .
However, in a real solid, there is, in general, some interaction between
individual magnetic moments, causing the loss of their individuality. This interaction
between atoms or ions or molecules may extend up to several unit cells in the solid
causing long range magnetic order. Such ordering results from two classes of
interactions, discussed next.
20
2.6.1 Dipolar Interaction
This interaction depends upon strength, relative orientation and the separation
between two magnetic dipoles. The interaction energy is given by [27]
0
3 2
3 ( )( )
4E
r r
1 2 1 2μ μ μ r μ r (2.6.4)
For μ1, μ2=1μB, r =1Å, E~1K. Thus, this interaction may not be responsible for high
temperature ordering.
2.6.2 Exchange Interaction
This quantum mechanical interaction is responsible for most of the conventional and
unconventional forms of magnetic ordering. The exchange Hamiltonian can be
expressed as [27]
,
ij
i j
H J i jS S (2.6.5)
Where Jij is the exchange constant between the ith
and jth
spins.
The exchange interactions can be further subclassified as: (a) Direct exchange (b)
Superexchange (Indirect exchange) (c) RKKY interaction (d) Double exchange (e)
Dzyaloshinsky-Moria (anisotropic) exchange. (f) Kondo exchange
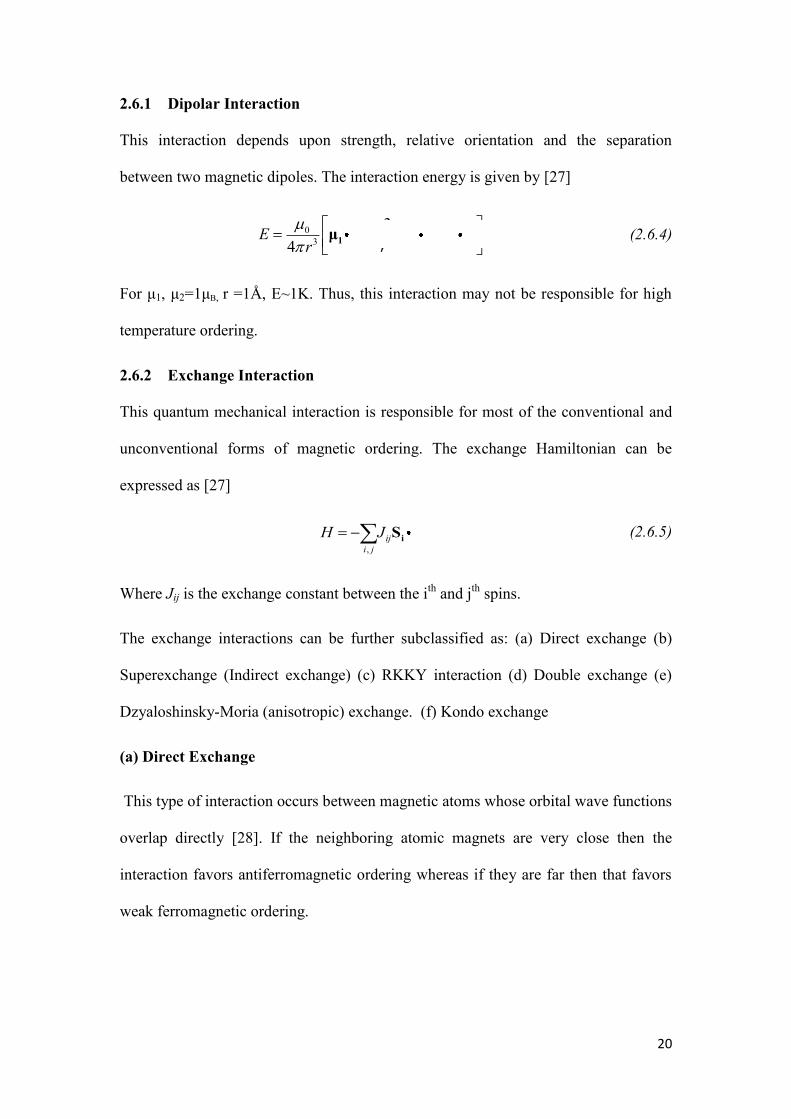
(a) Direct Exchange
This type of interaction occurs between magnetic atoms whose orbital wave functions
overlap directly [28]. If the neighboring atomic magnets are very close then the
interaction favors antiferromagnetic ordering whereas if they are far then that favors
weak ferromagnetic ordering.
21
Figure 2.6.1 direct exchange between neighboring spins.
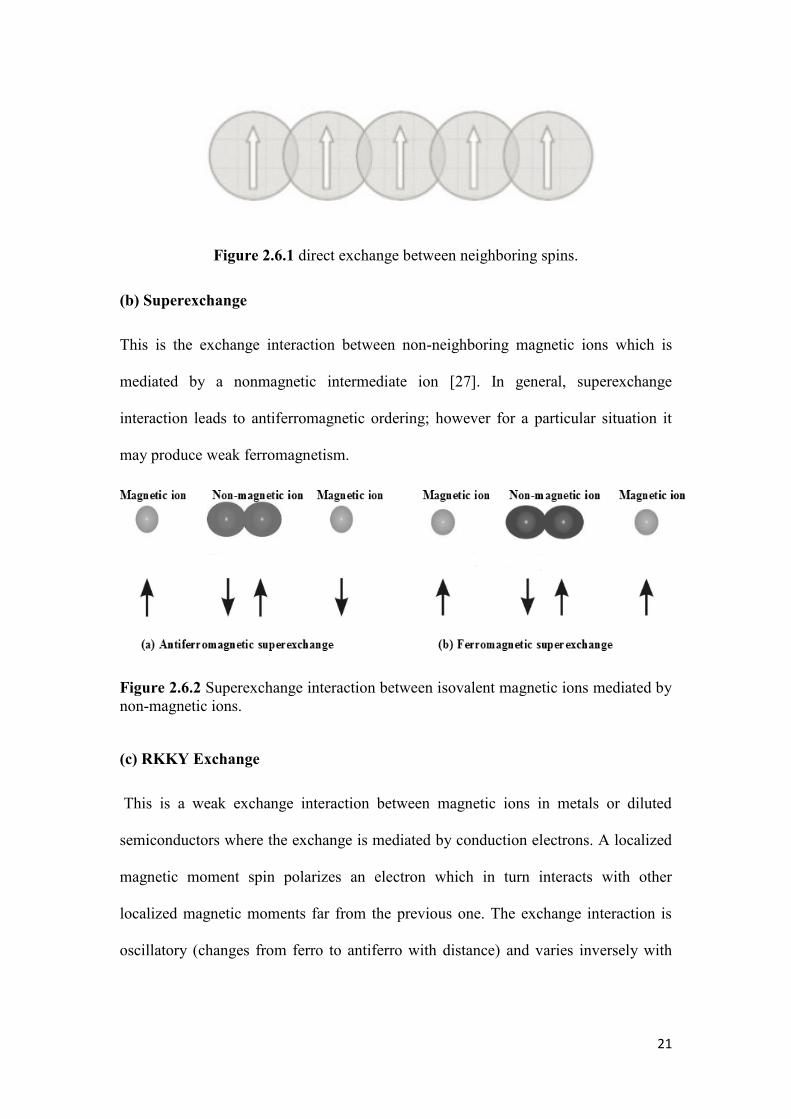
(b) Superexchange
This is the exchange interaction between non-neighboring magnetic ions which is
mediated by a nonmagnetic intermediate ion [27]. In general, superexchange
interaction leads to antiferromagnetic ordering; however for a particular situation it
may produce weak ferromagnetism.
Figure 2.6.2 Superexchange interaction between isovalent magnetic ions mediated by
non-magnetic ions.
(c) RKKY Exchange
This is a weak exchange interaction between magnetic ions in metals or diluted
semiconductors where the exchange is mediated by conduction electrons. A localized
magnetic moment spin polarizes an electron which in turn interacts with other
localized magnetic moments far from the previous one. The exchange interaction is
oscillatory (changes from ferro to antiferro with distance) and varies inversely with

22
cube of the distance between the magnetic ions. The exchange interaction can be
written as [27]
3
cos 2 f
RKKY
k rJ
r (2.6.6)
(d) Double Exchange
This is also similar to indirect ferromagnetic super exchange interaction. This type of
interaction generally occurs between two non-neighboring magnetic ions of mixed
valency mediated by nonmagnetic intermediate ion as shown in Figure 2.6.3. This
leads to ferromagnetic interaction [27]. Furthermore, there is actual hopping of an
electron from eg level of one ion M1 to that of another ion M2. This means there is
exchange of spin as well as charge which explains the name Double exchange.
Figure 2.6.3 Double exchange between M1 and M2 magnetic ions. Note: the oxidation
state of M1 and M2 are different.M2 has initially one less electron.
t2g
t2g
eg e
g
O(2p)
M1
M2
23
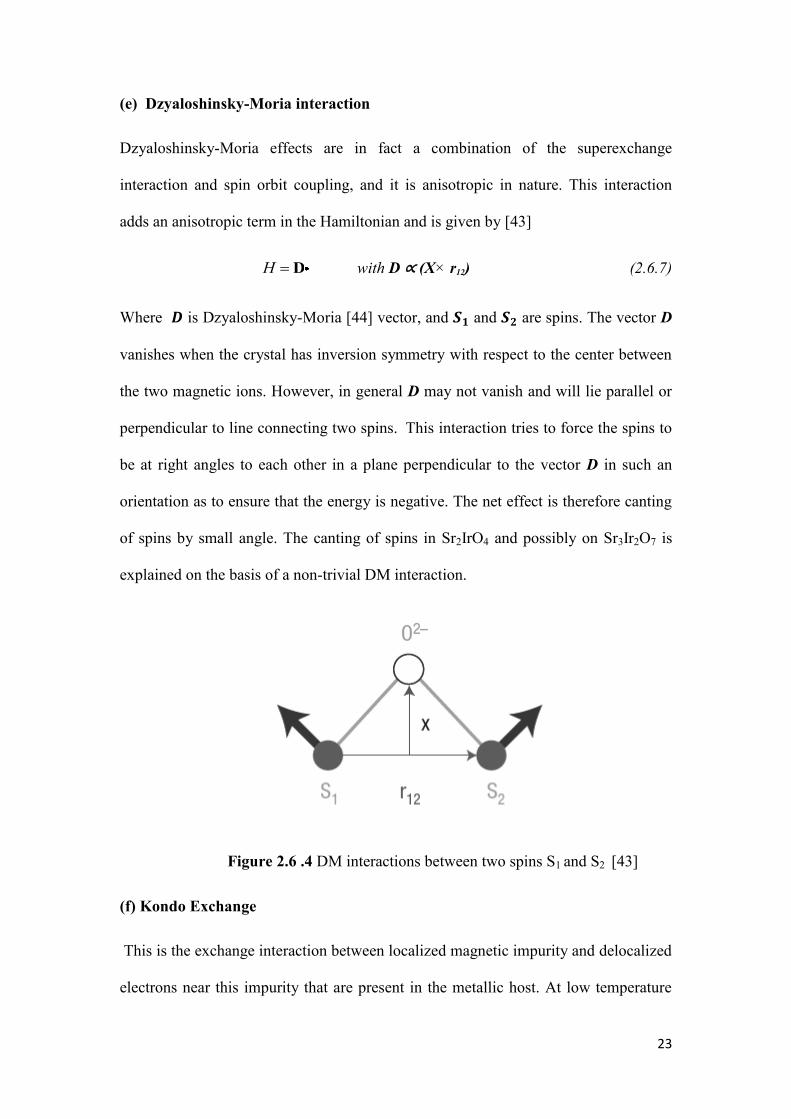
(e) Dzyaloshinsky-Moria interaction
Dzyaloshinsky-Moria effects are in fact a combination of the superexchange
interaction and spin orbit coupling, and it is anisotropic in nature. This interaction
adds an anisotropic term in the Hamiltonian and is given by [43]
1 2H D S S with D ∝ (X× r12) (2.6.7)
Where is Dzyaloshinsky-Moria [44] vector, and and are spins. The vector D
vanishes when the crystal has inversion symmetry with respect to the center between
the two magnetic ions. However, in general D may not vanish and will lie parallel or
perpendicular to line connecting two spins. This interaction tries to force the spins to
be at right angles to each other in a plane perpendicular to the vector D in such an
orientation as to ensure that the energy is negative. The net effect is therefore canting
of spins by small angle. The canting of spins in Sr2IrO4 and possibly on Sr3Ir2O7 is
explained on the basis of a non-trivial DM interaction.
Figure 2.6 .4 DM interactions between two spins S1 and S2 [43]
(f) Kondo Exchange
This is the exchange interaction between localized magnetic impurity and delocalized
electrons near this impurity that are present in the metallic host. At low temperature

24
the spins of delocalized electrons start to align themselves to screen the spin on the
local moment. This screening process creates a many body singlet state without any
moment on Kondo site [54].
2.6.3 Magnetic Ordering
The exchange interaction between the atomic or ionic magnets can force them to
arrange themselves into a particular configuration so as to minimize the free energy.
This kind of arrangement of moments can extend up to several unit cells in the lattice,
in which case the system is said to have long range ordering [28]. The chief categories
of long range magnetic ordering found in materials are the following:
(a) Ferromagnetic Ordering
A positive exchange interaction J in eq. 2.6.5 gives spontaneous magnetization
within certain regions in the solid where all the moments point to the same direction.
This region is called a magnetic domain which can extend across several unit cells.
However, magnetization of different domains may be in different directions. In
presence of an external magnetic field, all the net moments of the domains point
parallel to the field, causing a large magnetization signal. For fields above a given
threshold, the alignment is complete and this is called saturated magnetization. The
susceptibility of a ferromagnetic material depends upon temperature. The temperature
below which the spontaneous alignment of moments within each domain begins is
called the critical temperature TC. In the limit of zero magnetic fields the
susceptibility of a ferromagnetic material at T is given by Curie-Weiss law as
[27]
1
CT T
(2.6.8)
25
(b) Antiferromagnetic Ordering
If the exchange interaction J is negative then it is energetically favorable for nearest
neighbor moments to align antiparallel to each other. This kind of ordering is called
antiferromagnetic ordering. A perfect antiferromagnet can be decomposed into two
interpenetrating sublattices, on one of which all the moments point up and on the
other all the moments point down. The moments on two sublattices completely cancel
each other giving zero magnetization in the absence of external magnetic field. If the
moments on two neighboring sublattices do not cancel each other completely then the
system is called ferrimagnetic. Similar to the ferromagnet, the spontaneous ordering
within each sublattice begin below a critical temperature called Neel temperature TN.
In the limit of zero magnetic fields the susceptibility for T TN is given by Curie-
Weiss law as [27]
1
NT T
(2.6.9)
The susceptibility of paramagnetic, ferromagnetic and antiferromagnetic systems can
be expressed in terms of a generalized Curie-Weiss law as [27]
C
T
(2.6.10)
Where C is called Curie constant and is given by
2
3 B
nC
K
(2.6.11)
With n is the number density of magnetic moments, KB is Boltzmann’s constant, is
the effective localized moment and is Weiss temperature. If then there is no
interaction between moments (paramagnetic). If then the interactions are
26
ferromagnetic and if < 0, then the interactions are antiferromagnetic. The ratio
between and TC,TN gives the measure of frustration.
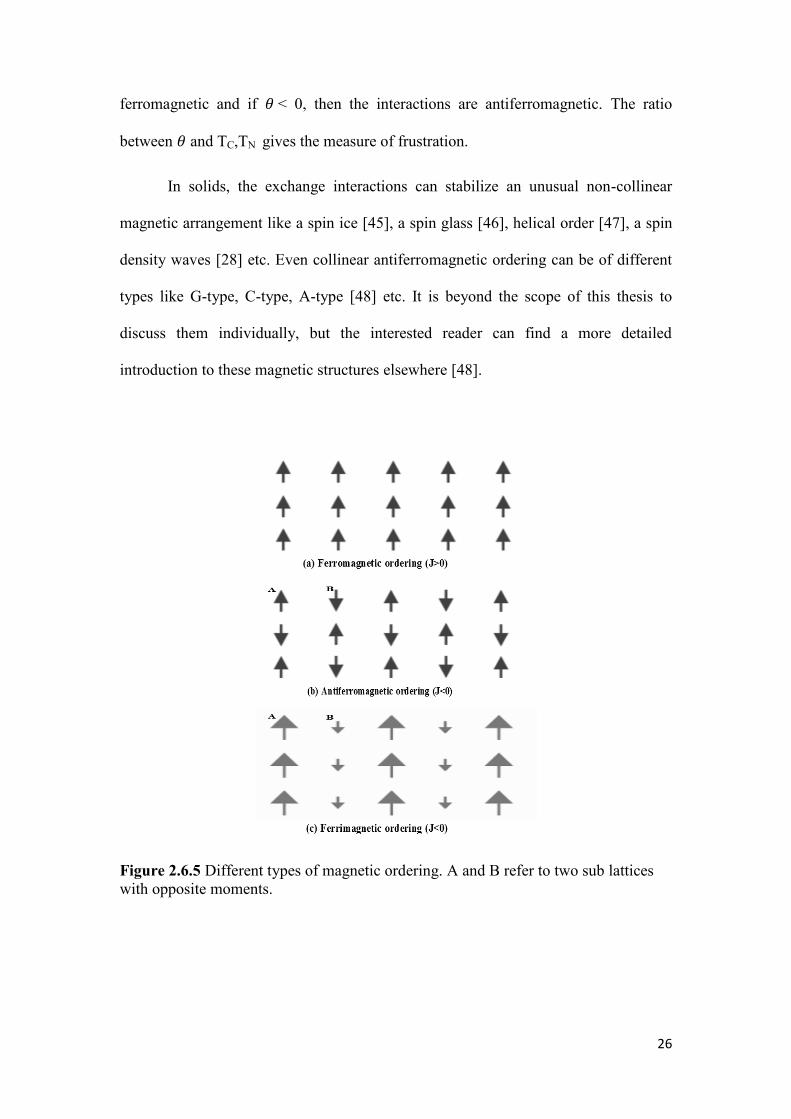
In solids, the exchange interactions can stabilize an unusual non-collinear
magnetic arrangement like a spin ice [45], a spin glass [46], helical order [47], a spin
density waves [28] etc. Even collinear antiferromagnetic ordering can be of different
types like G-type, C-type, A-type [48] etc. It is beyond the scope of this thesis to
discuss them individually, but the interested reader can find a more detailed
introduction to these magnetic structures elsewhere [48].
Figure 2.6.5 Different types of magnetic ordering. A and B refer to two sub lattices
with opposite moments.
27
2.7 Magnetism in Iridates
In the strong spin orbit coupled system like RP iridates, the magnetic interactions
cannot be determined by SU (2) symmetry of the spin alone (like in cuprates). There
are two unique features of magnetism in a strong spin-orbit coupled systems [21] (1)
orbitals of different symmetries are mixed which produce multidirectional exchange
interactions. (2) The isotropic Heisenberg interactions can be suppressed by the
anisotropic interactions like Pseudo-dipolar and Dzyaloshinsky-Moria interactions
which may arise due to destructive interference among different superexchange
pathways between different quantum phases of Jeff=1/2 states. Since orbitals of
different symmetries are involved, a change in the lattice and bonding geometry can
produce changes in the magnetic interactions. For the geometry relevant for RP
iridates, the exchange Hamiltonian can be expressed as [8]:
1 2( )( )ij i j i ij ijH J J r r j S S S S , where the first term (J1) represents isotropic AF
Heisenberg exchange between Jeff=1/2 states (here Si,j represents Jeff=1/2 state), rij is
the unit vector along ij bond. The second term represents anisotropic interlayer or
intralayer coupling which is governed by the ratio of Hund coupling (JH) to the
Coulomb repulsion within the same orbital (U).
For Sr2IrO4, even in presence of strong spin-orbit coupling, the magnon dispersion
can be described well with the phenomenological [49] J, J’, J” model where J, J’ and
J’’ correspond to first second and third nearest neighbor interactions respectively.
Thus even with presence of Jeff=1/2 states, the low energy spin excitations can be
described by an isotropic Hamiltonian, as in the cuprates with localized S=1/2 states.
The spin structure is governed solely by the crystal structure and bonding geometry
where the spins nearly follow the staggered rotation of octahedra. The moments lie in
the ab plane with small canting relative to a unique axis.
28
On the other hand, in the bilayer compound Sr3Ir2O7, the magnetic excitation
spectra show significant deviations from isotropic Heisenberg interactions and has a
giant magnon gap of 90 meV, even greater than magnon bandwidth of this system, 70
meV (90-160 meV) [22]. There is a spin flop transition from Sr2IrO4 (ab plane) to
Sr3Ir2O7 (G type with moment along c axis). Proposals have been put forward to
explain this in terms of reduced coulomb interaction (U), increased Hund coupling
and hence increased pseudo-dipolar interactions [22].
2.8 Neutron Scattering
Neutron scattering is a versatile technique that is well suited to study
correlated electron systems. The neutron is a charge zero; spin one-half fermion
having an intrinsic spin magnetic moment. This charge neutrality is helpful in
studying the bulk properties of a sample without strongly interacting with the sample,
and its non-zero magnetic moment make it useful for determining spin. Furthermore,
the wavelength and energy of thermal neutrons match the order of atomic distances
and the energy excitations of many interesting condensed matter systems. In a neutron
scattering experiment, a monochromatic/polychromatic beam of neutrons hits the
sample, interacts with it and is scattered from the sample. The energy-momentum
spectrum of the scattered neutrons is measured along a particular direction or a range
of directions. When a neutron with incident energy Ei [Ei = (1/2)mnv2
= p2/2mn =
h2/2mnλ
2] and wave vector ki (ki=2π/λi) interacts with the sample then it is scattered
with final energy Ef and wave vector kf (kf=2π/λf) such that following energy
momentum relations are satisfied [50]
i f
Q k k (2.8.1)
29
2 2 2( )
2
i f
n
k k
m
(2.8.2)
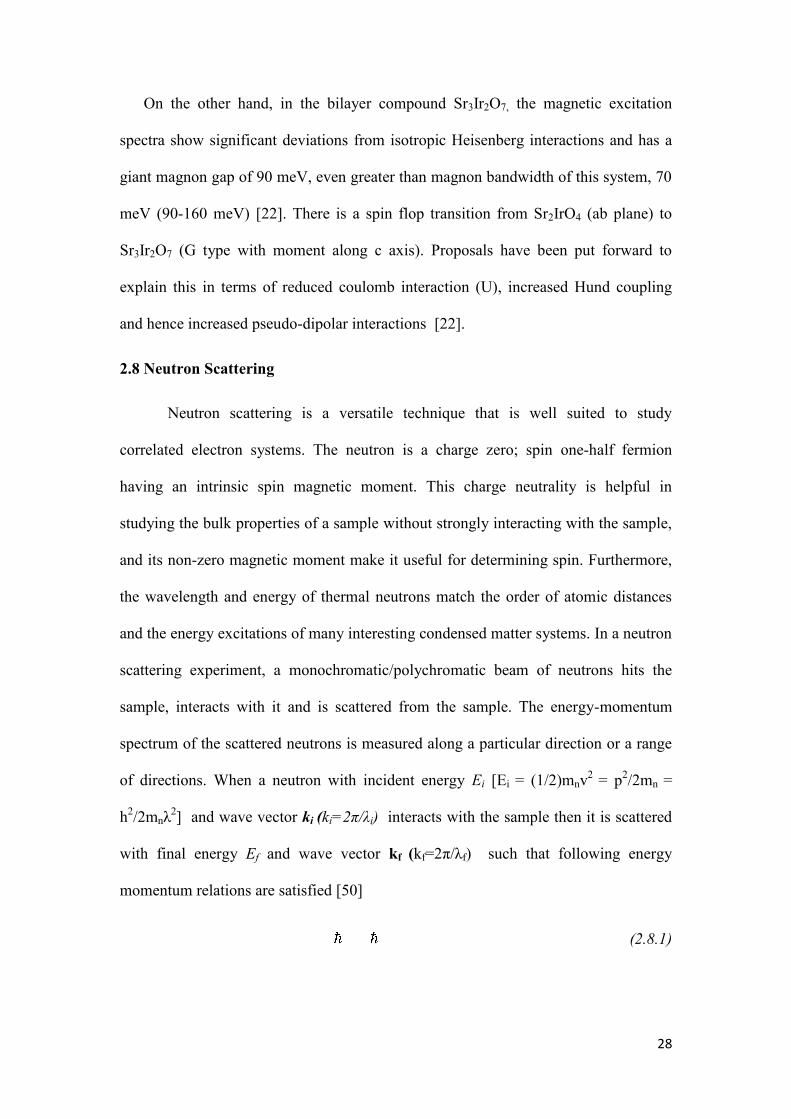
Where Q=q+ hkl, is the momentum transfer. hkl is called reciprocal lattice vector
and q is called the wave vector for elementary excitations. For q=0, Q= hkl , we have
elastic neutron scattering. The scattering process can be represented as shown in
Figure 2.8.1
Figure 2.8.1 Schematic representation of scattering process
In a neutron scattering experiment, the quantity measured is the double
differential cross section, defined as the number of neutrons scattered per second into
a solid angle dΩ with energy transfers between ħω and ħ(ω+dω), divided by the
incident neutron flux. The expression for the scattering cross section is governed by
Fermi’s golden rule and is given by [50]
i f f i
f f i i
22 2f
λ λ f f f f f f λ λ2k ,λ k ,λi
kd σ mp p k ,σ ,λ |U|k ,σ ,λ δ E E
dΩdω 2π k
(2.8.3)
where λi, λf denote the initial and final state of the sample (scatterer) and Eλi and Eλf
are initial and final energy of energy of the scatterer (sample) σi,σf are initial and final
states of the neutron,pλ is the thermal population factor, and pσ is the polarization
probability of neutron. The delta function describes the law of conservation of energy
and U is the interaction operator that depends upon the specific scattering process.
30
Equation 2.8.3 is the master equation describing the interaction of thermal/cold
neutrons with the sample.
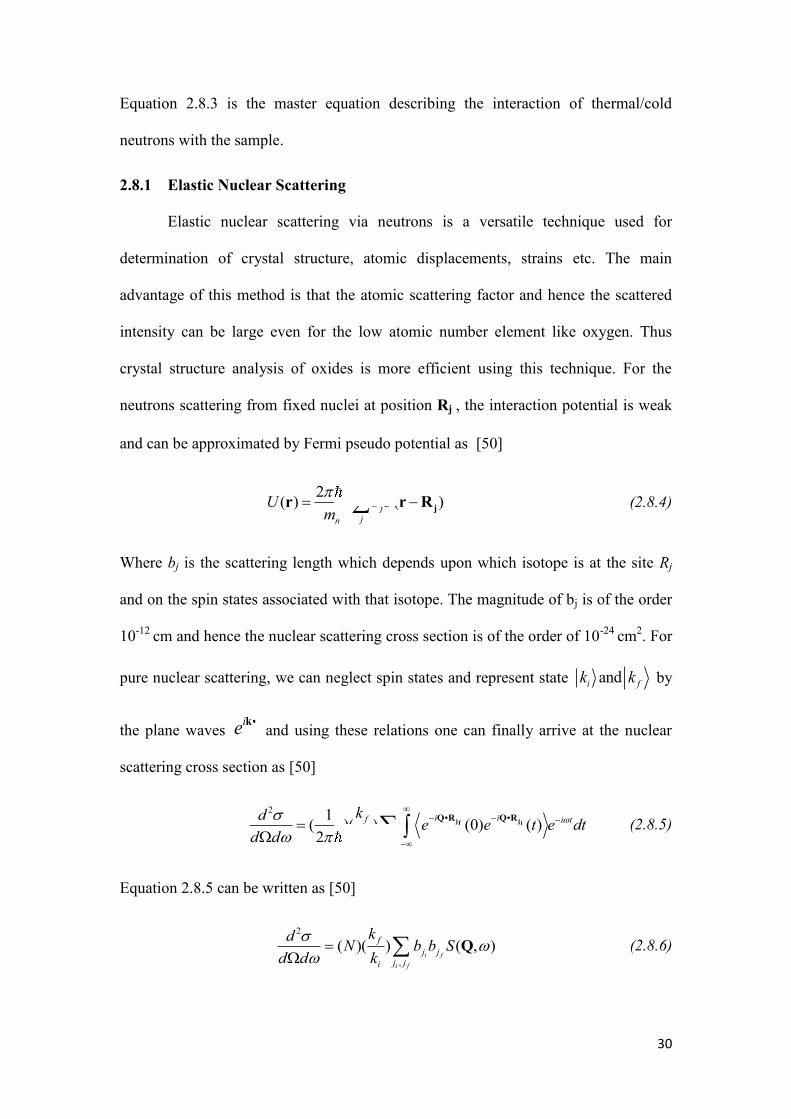
2.8.1 Elastic Nuclear Scattering
Elastic nuclear scattering via neutrons is a versatile technique used for
determination of crystal structure, atomic displacements, strains etc. The main
advantage of this method is that the atomic scattering factor and hence the scattered
intensity can be large even for the low atomic number element like oxygen. Thus
crystal structure analysis of oxides is more efficient using this technique. For the
neutrons scattering from fixed nuclei at position Rj , the interaction potential is weak
and can be approximated by Fermi pseudo potential as [50]
22
( ) ( )j
jn
U bm
j
r r R (2.8.4)
Where bj is the scattering length which depends upon which isotope is at the site Rj
and on the spin states associated with that isotope. The magnitude of bj is of the order
10-12
cm and hence the nuclear scattering cross section is of the order of 10-24
cm2. For
pure nuclear scattering, we can neglect spin states and represent state andi fk k by
the plane waves ie k r
and using these relations one can finally arrive at the nuclear
scattering cross section as [50]
2
,
1( )( ) (0) ( )2
i f
i if i t
j ji
kde e t e dt
d d k
j jf i
Q•R Q•R (2.8.5)
Equation 2.8.5 can be written as [50]
2
,
( )( ) ( , )i f
i f
f
j j
j ji
kdN b b S
d d k
Q (2.8.6)

31
Where the quantity S(Q,ω) is called the scattering function of the system and is given
by [50]
1
( , ) ( ) ( , )2
i tS I t e dt
Q Q (2.8.7)
With
,
1( , ) ( ) (0) ( )
i fj j
I t e i e i tN
f ij jQ Q R Q R (2.8.8)
The Fourier transform of I(Q,t) is called the correlation function and is given by [50]
3
1( , ) ( ) ( , )
2
iG t I t e d
Q r
r Q Q (2.8.9)
Assuming that the isotopes and the spin states of the nuclei are distributed at
random amongst all available sites and are uncorrelated between the sites, the quantity
bjibjf can be replaced by ensemble average i fj jb b . For jf≠ji and no correlation
between two sites one can write 2
i f i f f ij j j j j jb b b b b b b and for jf=ji,
2 2
i f i f ij j j j jb b b b b b . Using these relations and rearranging the terms, the
differential cross section can be written as sum of two components: coherent and
incoherent scattering. In coherent scattering, the scattered intensity from different
nuclei interfere each other whereas in incoherent scattering they are independent of
each other. For coherent scattering the coherent diffraction peaks from Bragg
scattering are determined by magnitude of 2
b and the incoherent scattering gives a
flat background determined by magnitude of 22b b . Therefore, equation 2.8.6
can be split into two equations [50]
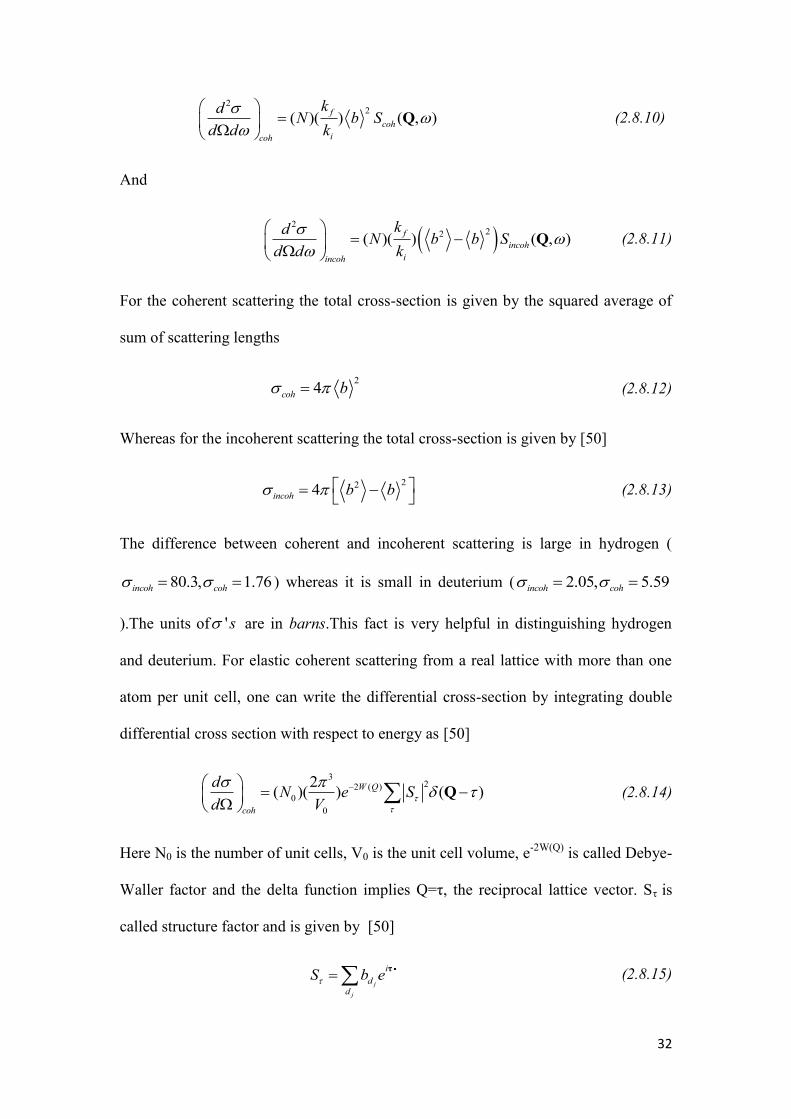
32
2
2( )( ) ( , )
f
coh
icoh
kdN b S
d d k
Q (2.8.10)
And
2
22( )( ) ( , )f
incoh
iincoh
kdN b b S
d d k
Q (2.8.11)
For the coherent scattering the total cross-section is given by the squared average of
sum of scattering lengths
2
4coh b (2.8.12)
Whereas for the incoherent scattering the total cross-section is given by [50]
224incoh b b
(2.8.13)
The difference between coherent and incoherent scattering is large in hydrogen (
80.3, 1.76incoh coh ) whereas it is small in deuterium ( 2.05, 5.59incoh coh
).The units of 's are in barns.This fact is very helpful in distinguishing hydrogen
and deuterium. For elastic coherent scattering from a real lattice with more than one
atom per unit cell, one can write the differential cross-section by integrating double
differential cross section with respect to energy as [50]
3
22 ( )
0
0
2( )( ) ( )W Q
coh
dN e S
d V
Q (2.8.14)
Here N0 is the number of unit cells, V0 is the unit cell volume, e-2W(Q)
is called Debye-
Waller factor and the delta function implies Q=τ, the reciprocal lattice vector. Sτ is
called structure factor and is given by [50]
j
j
i
d
d
S b e jτ d (2.8.15)
33
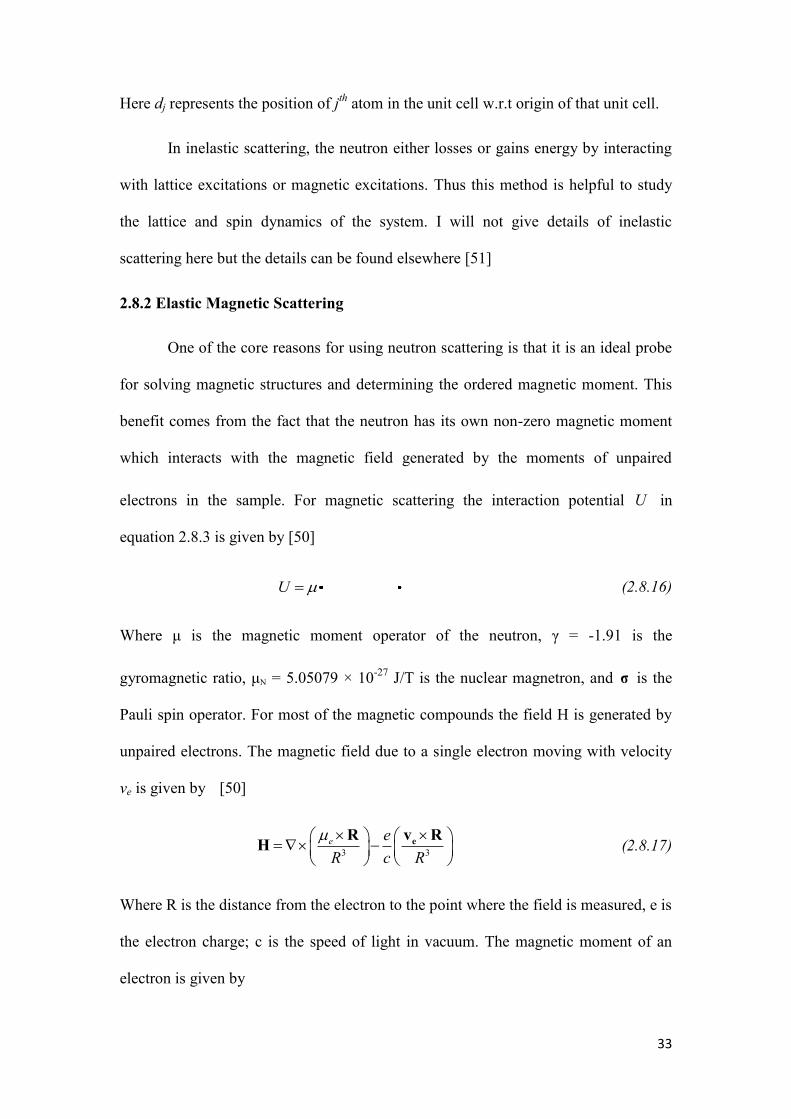
Here dj represents the position of jth
atom in the unit cell w.r.t origin of that unit cell.
In inelastic scattering, the neutron either losses or gains energy by interacting
with lattice excitations or magnetic excitations. Thus this method is helpful to study
the lattice and spin dynamics of the system. I will not give details of inelastic
scattering here but the details can be found elsewhere [51]
2.8.2 Elastic Magnetic Scattering
One of the core reasons for using neutron scattering is that it is an ideal probe
for solving magnetic structures and determining the ordered magnetic moment. This
benefit comes from the fact that the neutron has its own non-zero magnetic moment
which interacts with the magnetic field generated by the moments of unpaired
electrons in the sample. For magnetic scattering the interaction potential U in
equation 2.8.3 is given by [50]
NU H σ H (2.8.16)
Where μ is the magnetic moment operator of the neutron, γ = -1.91 is the
gyromagnetic ratio, μN = 5.05079 × 10⁻²⁷
J/T is the nuclear magnetron, and σ is the
Pauli spin operator. For most of the magnetic compounds the field H is generated by
unpaired electrons. The magnetic field due to a single electron moving with velocity
ve is given by [50]
3 3
e e
R c R
eR v R
H (2.8.17)
Where R is the distance from the electron to the point where the field is measured, e is
the electron charge; c is the speed of light in vacuum. The magnetic moment of an
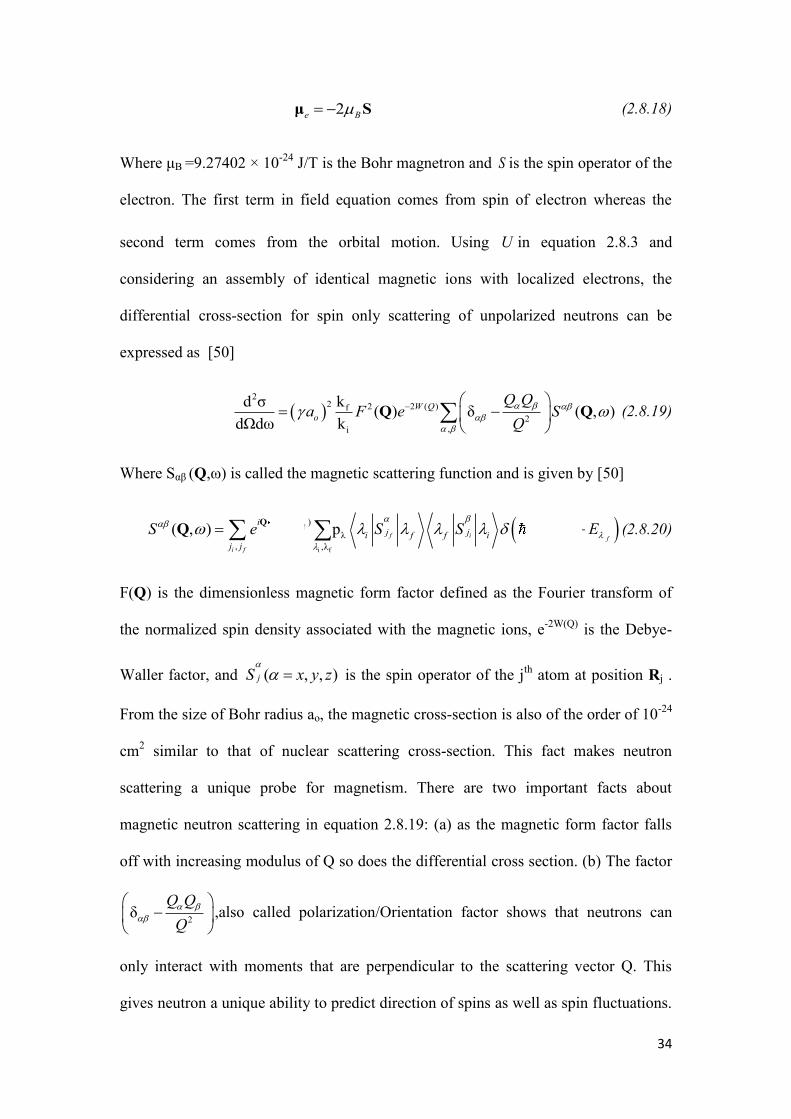
electron is given by
34
2 Be μ S (2.8.18)
Where μB =9.27402 × 10⁻²⁴
J/T is the Bohr magnetron and S is the spin operator of the
electron. The first term in field equation comes from spin of electron whereas the
second term comes from the orbital motion. Using U in equation 2.8.3 and
considering an assembly of identical magnetic ions with localized electrons, the
differential cross-section for spin only scattering of unpolarized neutrons can be
expressed as [50]
2
2 2 2 ( )f
2,i
kd σ( ) δ ( , )
dΩdω k
W Q
o
Q Qa F e S
Q
Q Q (2.8.19)
Where Sαβ (Q,ω) is called the magnetic scattering function and is given by [50]
i f
( )
λ
, ,λ
( , ) pf i
i
i f
fj ji f f
i
j j
iS S E ES e
j ji fQ R -R
Q (2.8.20)
F(Q) is the dimensionless magnetic form factor defined as the Fourier transform of
the normalized spin density associated with the magnetic ions, e-2W(Q)
is the Debye-
Waller factor, and ( , , )jS x y z
is the spin operator of the jth
atom at position Rj .
From the size of Bohr radius ao, the magnetic cross-section is also of the order of 10-24
cm2 similar to that of nuclear scattering cross-section. This fact makes neutron
scattering a unique probe for magnetism. There are two important facts about
magnetic neutron scattering in equation 2.8.19: (a) as the magnetic form factor falls
off with increasing modulus of Q so does the differential cross section. (b) The factor
2δ
Q Q
Q
,also called polarization/Orientation factor shows that neutrons can
only interact with moments that are perpendicular to the scattering vector Q. This
gives neutron a unique ability to predict direction of spins as well as spin fluctuations.
35
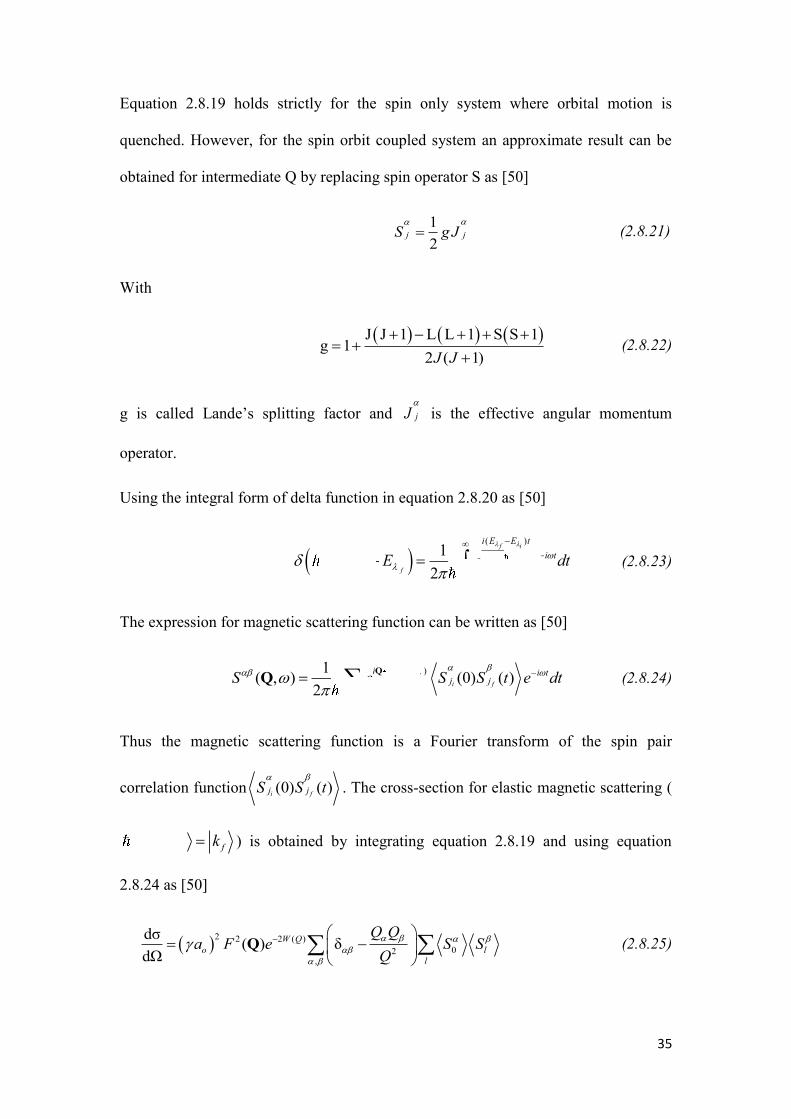
Equation 2.8.19 holds strictly for the spin only system where orbital motion is
quenched. However, for the spin orbit coupled system an approximate result can be
obtained for intermediate Q by replacing spin operator S as [50]
1
2j jS g J
(2.8.21)
With
J J 1 L L 1 S S 1
g 12 ( 1)J J
(2.8.22)
g is called Lande’s splitting factor and jJ
is the effective angular momentum
operator.
Using the integral form of delta function in equation 2.8.20 as [50]
( )
1
2
f i
i f
i E E t
i tE E e e dt
(2.8.23)
The expression for magnetic scattering function can be written as [50]
( )
,
1( , ) (0) ( )
2i f
i f
i i tj j
j j
S e S S t e dt
j ji fQ R -R
Q (2.8.24)
Thus the magnetic scattering function is a Fourier transform of the spin pair
correlation function (0) ( )i fj jS S t
. The cross-section for elastic magnetic scattering (
0, i fk k ) is obtained by integrating equation 2.8.19 and using equation
2.8.24 as [50]
2 2 2 ( )
02,
dσ( ) δ
dΩ
W Q
o l
l
Q Qa F e S S
Q
Q (2.8.25)
36
Where l = Rji – R jf.
The expression for the cross-section of inelastic magnetic scattering involves
additional steps and will not be presented here, though it can be found elsewhere
[50,52].
2.8.3 Polarized Neutron Scattering
Polarized neutron scattering is the confirmatory experiment to distinguish between
either a magnetic or structural origin of some superlattice peak. This technique takes
the advantage of the fact that neutron can only be scattered by the moments that are
perpendicular to scattering vector Q. A neutron is a spin ½ fermion having two
possible spin states (i) up or or (ii) down or or These states are the
Eigen states of the Pauli spin operator z (taking z axis as the polarization direction)
with eigenvalues +1 and -1 respectively. During the scattering process the neutron
scattering cross-section can be split into four parts [50].
1.
2.
3.
4.
The first two are Non Spin Flip (NSF) scattering and the last two are Spin Flip (SF)
scattering. Considering the spin states during the scattering process the interaction
operator U in equation 2.8.3 can be written as [50]
U b A B I σ m σ (2.8.26)
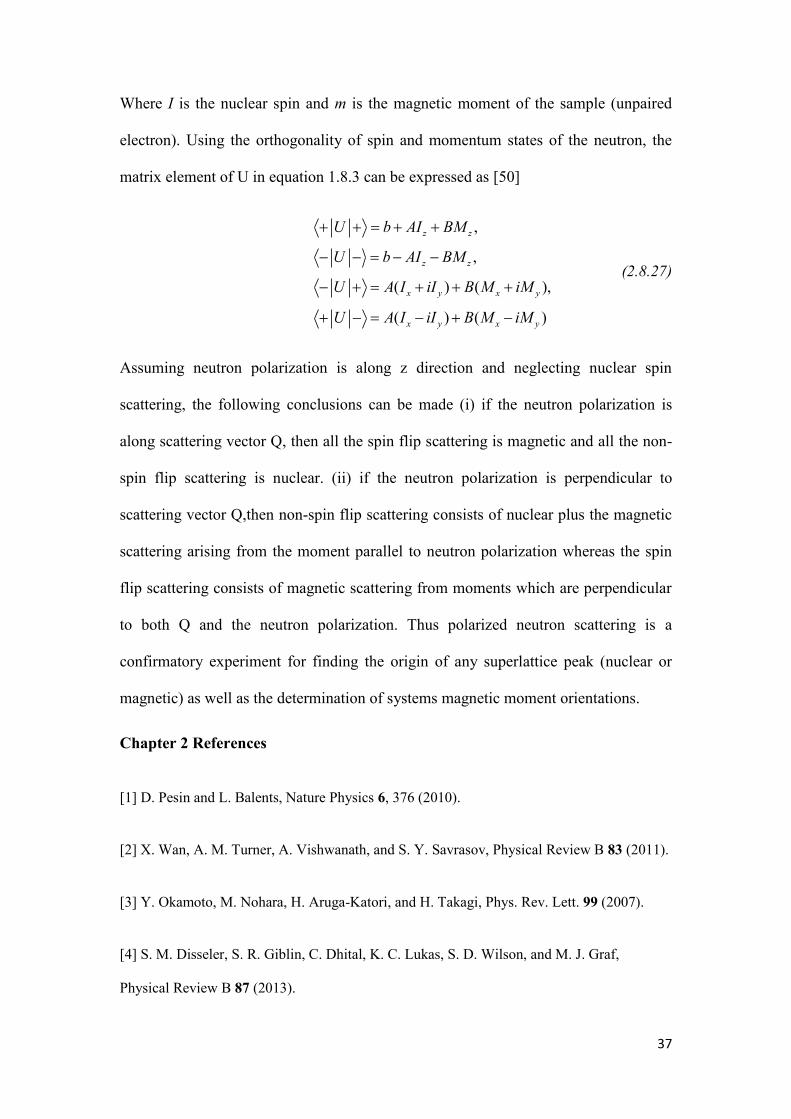
37
Where I is the nuclear spin and m is the magnetic moment of the sample (unpaired
electron). Using the orthogonality of spin and momentum states of the neutron, the
matrix element of U in equation 1.8.3 can be expressed as [50]
,
,
( ) ( ),
( ) ( )
z z
z z
x y x y
x y x y
U b AI BM
U b AI BM
U A I iI B M iM
U A I iI B M iM
(2.8.27)
Assuming neutron polarization is along z direction and neglecting nuclear spin
scattering, the following conclusions can be made (i) if the neutron polarization is
along scattering vector Q, then all the spin flip scattering is magnetic and all the non-
spin flip scattering is nuclear. (ii) if the neutron polarization is perpendicular to
scattering vector Q,then non-spin flip scattering consists of nuclear plus the magnetic
scattering arising from the moment parallel to neutron polarization whereas the spin
flip scattering consists of magnetic scattering from moments which are perpendicular
to both Q and the neutron polarization. Thus polarized neutron scattering is a
confirmatory experiment for finding the origin of any superlattice peak (nuclear or
magnetic) as well as the determination of systems magnetic moment orientations.
Chapter 2 References
[1] D. Pesin and L. Balents, Nature Physics 6, 376 (2010).
[2] X. Wan, A. M. Turner, A. Vishwanath, and S. Y. Savrasov, Physical Review B 83 (2011).
[3] Y. Okamoto, M. Nohara, H. Aruga-Katori, and H. Takagi, Phys. Rev. Lett. 99 (2007).
[4] S. M. Disseler, S. R. Giblin, C. Dhital, K. C. Lukas, S. D. Wilson, and M. J. Graf,
Physical Review B 87 (2013).
38
[5] J. Chaloupka, G. Jackeli, and G. Khaliullin, Phys. Rev. Lett. 105, 027204 (2010).
[6] Y. Machida, S. Nakatsuji, Y. Maeno, T. Tayama, and T. Sakakibara, J Magn Magn Mater
310, 1079 (2007).
[7] B. J. Kim, H. Ohsumi, T. Komesu, S. Sakai, T. Morita, H. Takagi, and T. Arima, Science
323, 1329 (2009).
[8] G. Jackeli and G. Khaliullin, Phys. Rev. Lett. 102 (2009).
[9] B. J. Kim, H. Jin, S. J. Moon, et al, Phys. Rev. Lett. 101 (2008).
[10] F. Wang and T. Senthil, Phys. Rev. Lett. 106 (2011).
[11] R. Arita, J. Kunes, A. V. Kozhevnikov, A. G. Eguiluz, and M. Imada, Phys. Rev. Lett.
108 (2012).
[12] Q. Huang, J. L. Soubeyroux, O. Chmaissem, I. Natalisora, A. Santoro, R. J. Cava, J. J.
Krajewski, and W. F. Peck, Journal of Solid State Chemistry 112, 355 (1994).
[13] N. S. Kini, A. M. Strydom, H. S. Jeevan, C. Geibel, and S. Ramakrishnan, Journal of
Physics-Condensed Matter 18, 8205 (2006).
[14] M. K. Crawford, M. A. Subramanian, R. L. Harlow, J. A. Fernandezbaca, Z. R. Wang,
and D. C. Johnston, Physical Review B 49, 9198 (1994).
[15] G. Cao, J. Bolivar, S. McCall, J. E. Crow, and R. P. Guertin, Physical Review B 57,
11039 (1998).
[16] J. P. Clancy, N. Chen, C. Y. Kim, W. F. Chen, K. W. Plumb, B. C. Jeon, T. W. Noh, and
Y. Kim, Physical Review B 86 (2012).
39
[17] D. Hsieh, F. Mahmood, D. H. Torchinsky, G. Cao, and N. Gedik, Physical Review B 86
(2012).
[18] F. Ye, S. Chi, B. C. Chakoumakos, J. A. Fernandez-Baca, T. Qi, and G. Cao, Physical
Review B 87 (2013).
[19] S. Boseggia, R. Springell, H. C. Walker, A. T. Boothroyd, D. Prabhakaran, S. P. Collins,
and D. F. McMorrow, Journal of Physics-Condensed Matter 24 (2012).
[20] G. Cao, Y. Xin, C. S. Alexander, J. E. Crow, P. Schlottmann, M. K. Crawford, R. L.
Harlow, and W. Marshall, Physical Review B 66 (2002).
[21] J. W. Kim, Y. Choi, J. Kim, J. F. Mitchell, G. Jackeli, M. Daghofer, J. van den Brink, G.
Khaliullin, and B. J. Kim, Phys. Rev. Lett. 109 (2012).
[22] J. Kim, A. H. Said, D. Casa, M. H. Upton, T. Gog, M. Daghofer, G. Jackeli, J. van den
Brink, G. Khaliullin, and B. J. Kim, Phys. Rev. Lett. 109 (2012).
[23] P. D. C. King, T. Takayama, A. Tamai, et al, Physical Review B 87 (2013).
[24] I. Nagai, Y. Yoshida, S. I. Ikeda, H. Matsuhata, H. Kito, and M. Kosaka, Journal of
Physics-Condensed Matter 19 (2007).
[25] M. A. Subramanian, M. K. Crawford, and R. L. Harlow, Mater. Res. Bull. 29, 645
(1994).
[26] Q. Wang, Y. Cao, J. A. Waugh, S. R. Park, T. F. Qi, O. B. Korneta, G. Cao, and D. S.
Dessau, Physical Review B 87 (2013).
[27] S. Blundell and D. Thouless, Magnetism in condensed matter (Oxford University Press
New York, 2001), 1.
[28] N. Ashcroft and N. Mermin, Holt-Saunders, Philadelphia 16 (1976).
40
[29] M. M. Sala, S. Boseggia, D. McMorrow, and G. Monaco, Phys. Rev. Lett. 112, 026403
(2014).
[30] S. Ruddlesden and P. Popper, Acta Crystallogr. 10, 538 (1957).
[31] S. Ruddlesden and P. Popper, Acta Crystallogr. 11, 54 (1958).
[32] K. Momma and F. Izumi, Journal of Applied Crystallography 44, 1272 (2011).
[33] F. Gebhard, Metal—Insulator Transitions (Springer, 1997).
[34] P. W. Anderson, Science 235, 1196 (1987).
[35] J. Slater, Physical Review 82, 538 (1951).
[36] J. Hubbard, Proceedings of the Royal Society of London.Series A.Mathematical and
Physical Sciences 276, 238 (1963).
[37] N. Mott, Journal of Solid State Chemistry 88, 5 (1990).
[38] M. Imada, A. Fujimori, and Y. Tokura, Reviews of Modern Physics 70, 1039 (1998).
[39] V. K. Shante and S. Kirkpatrick, Adv. Phys. 20, 325 (1971).
[40] J. Wu and C. Leighton, Physical Review B 67, 174408 (2003).
[41] J. Bass, W. P. Pratt Jr, and P. A. Schroeder, Reviews of modern physics 62, 645 (1990).
[42] U. Mizutani, Introduction to the electron theory of metals (Cambridge University Press,
2001).
[43] S. Cheong and M. Mostovoy, Nature materials 6, 13 (2007).
[44] T. Moriya, Physical Review 120, 91 (1960).
41
[45] H. Diep, Frustrated spin systems (World Scientific, 2005).
[46] K. H. Fischer and J. A. Hertz, Spin glasses (Cambridge University Press, 1993), 1.
[47] F. Nori and A. Tonomura, Science 311, 344 (2006).
[48] E. Dagotto, Nanoscale phase separation and colossal magnetoresistance: the physics of
manganites and related compounds (Springer, 2003).
[49] J. Kim, D. Casa, M. Upton, T. Gog, Y. Kim, J. Mitchell, M. Van Veenendaal, M.
Daghofer, J. van Den Brink, and G. Khaliullin, Phys. Rev. Lett. 108, 177003 (2012).
[50] A. Furrer, J. Mesot, T. Strässle, and J. Mesot, Neutron scattering in condensed matter
physics (World Scientific Singapore, 2009).
[51] S. W. Lovesey and S. Lovesey, Theory of neutron scattering from condensed matter
(Clarendon Press Oxford, 1984), 1.
[52] S. W. Lovesey and S. Lovesey, Theory of neutron scattering from condensed matter
(Clarendon Press Oxford, 1984), 1.
[53] http://2012books.lardbucket.org/books/principles-of-general-chemistry-v1.0m/s27-05-
crystal-field-theory.html
[54] N. Ashcroft and N. Mermin, Holt-Saunders, Philadelphia 16 (1976).

42
Chapter 3: Experimental Techniques
3.1 Crystal Growth
A single crystal is defined as a periodic spatial arrangement of atoms, ions or
groups of ions in 3 dimensions [1]. The repeating periodic distance along certain
direction is called the lattice parameter and the smallest repeating unit is called unit
cell. For inorganic crystals, the lattice parameter may extend up to 30 nm while for
organic crystals it can extend even up to hundreds of nanometers. In an ideal single
crystal, the long range periodic order should extend to infinity. However, in a real
crystal, due to presence of finite surfaces and defects, the long range periodic order is
finite. Therefore, truly speaking a single crystal is defined as such by comparison to
polycrystalline and amorphous materials. For a scientific study and technological
applications, a single crystal is usually preferred over a polycrystalline sample due to
the following reasons: (i) Single crystals carry information about anisotropy of
physical properties which otherwise average out to zero in polycrystals (ii) They are
relatively free from grain boundary scatterings which is often the case in
polycrystalline samples (iii) In polycrystals, typically, there exist large internal
stresses.(iv) single crystals are relatively free of impurities compared to polycrystals.
There are four main categories of crystal growth techniques (i) Solid growth (ii)
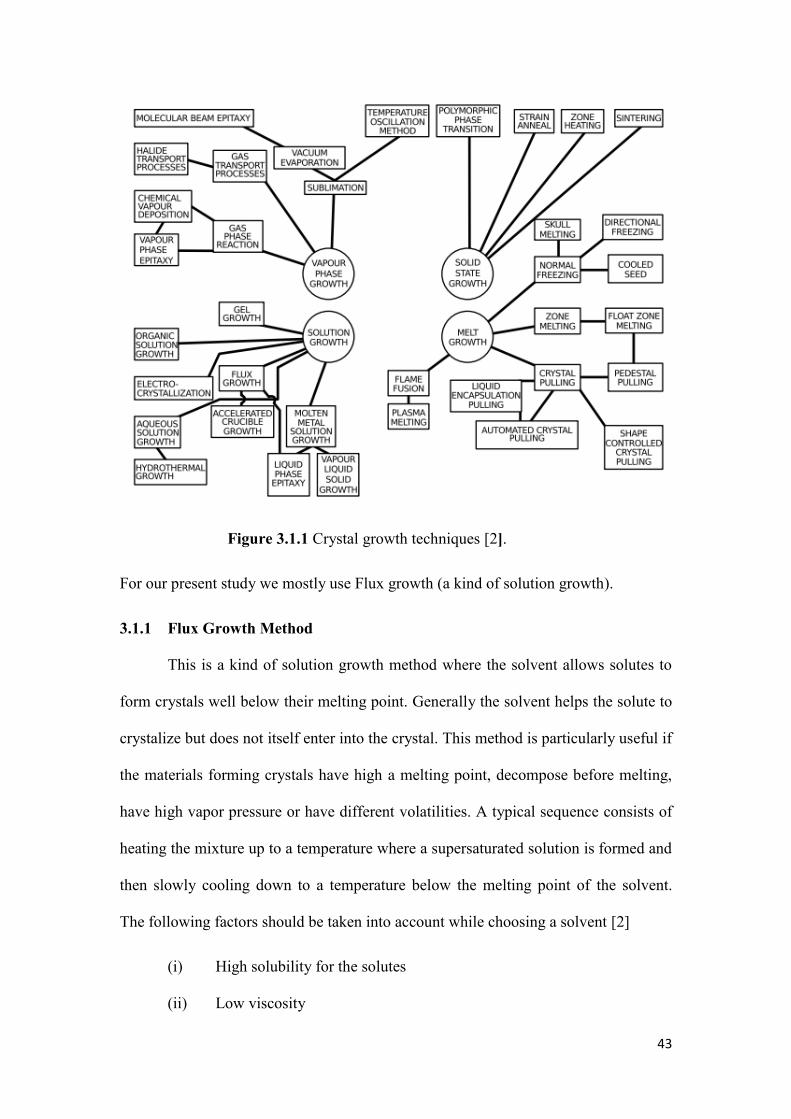
Vapor growth (iii) Melt growth (iv) Solution growth. Figure 3.1.1 shows the summary
of crystal growth techniques [2].
43
Figure 3.1.1 Crystal growth techniques [2].
For our present study we mostly use Flux growth (a kind of solution growth).
3.1.1 Flux Growth Method
This is a kind of solution growth method where the solvent allows solutes to
form crystals well below their melting point. Generally the solvent helps the solute to
crystalize but does not itself enter into the crystal. This method is particularly useful if
the materials forming crystals have high a melting point, decompose before melting,
have high vapor pressure or have different volatilities. A typical sequence consists of
heating the mixture up to a temperature where a supersaturated solution is formed and
then slowly cooling down to a temperature below the melting point of the solvent.
The following factors should be taken into account while choosing a solvent [2]
(i) High solubility for the solutes
(ii) Low viscosity
44
(iii) Low melting point
(iv) Low toxicity
(v) High purity at low cost
(vi) Easy to remove by dissolving
In the present work I studied Sr2IrO4, Sr3Ir2O7 and Sr3(Ir1-xRux)2O7 single
crystals. For all crystals, we used SrCl2 as solvent and stoichiometric ratios of IrO2,
SrCO3 and RuO2 as solute. The materials were put layer by layer (in the increasing
order of melting point from the top) with the solvent at the top layer in a platinum
crucible. The mixture was heated up to 13000C-1400
0C using Sentrotech high
temperature (16000C max.) furnaces and then slowly cooled down to melting point of
SrCl2 (8500C). The details of the crystal preparation methods are given in [3].
3.2 X-ray Diffraction
X-rays have wavelengths comparable to the typical interatomic distance (10-10
m) in a crystal so they can be used to study the crystal structures. When a
monochromatic/polychromatic beam of X-rays hits the sample, it interacts with the
sample (actually the outer electron clouds) and gets scattered. In diffraction, we are
concerned only with the elastic interaction. The scattered X-rays from different planes
can interfere constructively to give maximum intensity if their path difference is
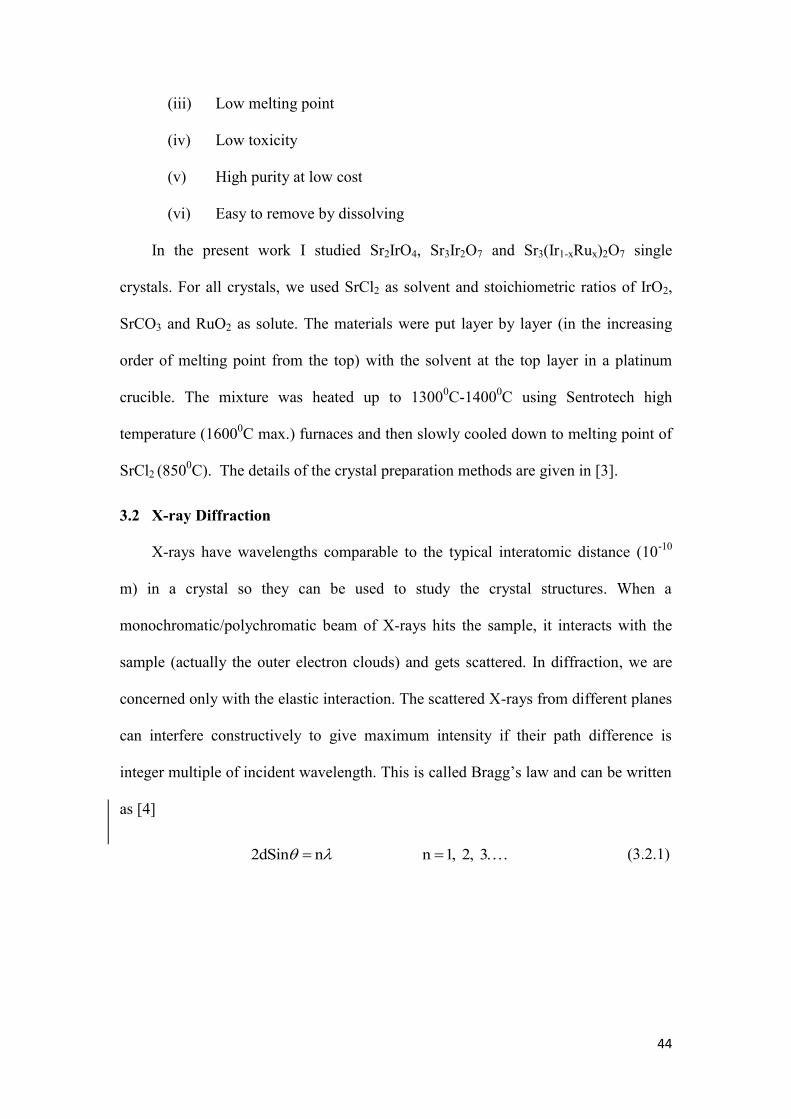
integer multiple of incident wavelength. This is called Bragg’s law and can be written
as [4]
2dSin n n 1, 2, 3 . (3.2.1)
45
Figure 3.2.1 Bragg’s reflection from a particular family of lattice planes
separated by distance d
The most important point about X-ray diffraction is that each material has its own
unique diffraction pattern. At a fixed wavelength, the position of intensity maxima is
determined by the interplanar spacing (d) or, in other words, the symmetry group of
the crystal and the lattice parameters of the crystal. The intensity of scattering
maxima is determined by the actual scattering elements, their positions within the unit
cell, the absorption coefficient of the material and the sample temperature. For X-rays
the scattering power of elements depends directly upon their atomic numbers. Even a
slight change in crystal structure or change in atomic position gives different
scattering pattern. Generally X-ray diffraction is used to identify structural/chemical
phase, to determine lattice parameters, to determine the residual stress and
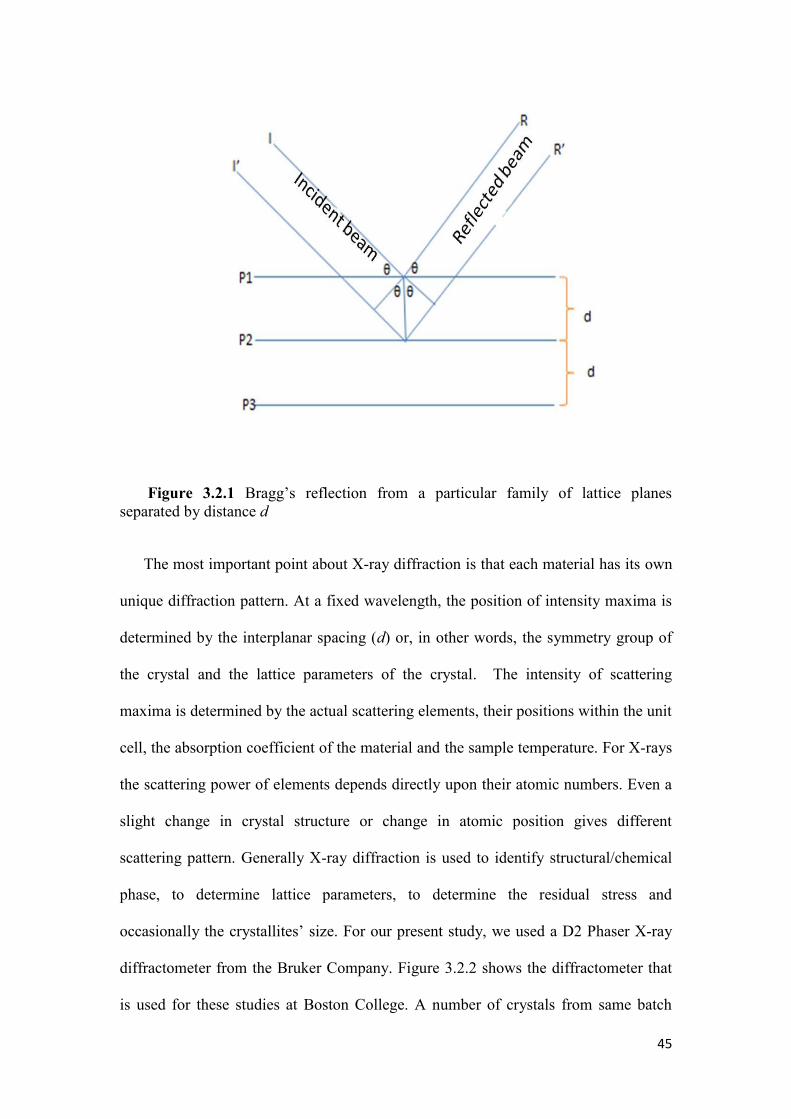
occasionally the crystallites’ size. For our present study, we used a D2 Phaser X-ray
diffractometer from the Bruker Company. Figure 3.2.2 shows the diffractometer that
is used for these studies at Boston College. A number of crystals from same batch
46
were ground and then powder diffraction patterns were taken. The powder pattern
thus obtained was matched with the standard powder pattern to check for the phase
purity. The lattice parameters of the samples were determined by refining the powder
data using software such as FullProf.
Figure 3.2.2 (a) Bruker X-ray diffractometer in Wilson lab at Boston College (b)
Inner part of diffractometer S1=source, S2=sample, D=detector and red arrows
represent incident and scattered X-rays.
3.3 Energy Dispersive Spectroscopy (EDS)
This technique takes advantage of the fact that when an energetic electron beam
hits the sample surface, X-rays are emitted. The frequency of these X-rays is
characteristics of the elements present in the sample. The energy spectra of emitted x-
rays help to identify the elemental makeup whereas the intensity of the peak in the
characteristic spectrum gives the compositional concentration of that element. The
energy of the emitted x-ray is given by Mosley’s law [5]: , where E
is the energy of emitted X-rays, Z is the atomic number of emitter and C1 and C2 are
constants. Similarly, the peak to background ratio (P/B) of the characteristic X-ray is
given by [5]
47
1
01n
C
C
E EP
B Z E
(3.3.1)
Where EC is critical ionization energy, Eo is the accelerating voltage, Z the atomic
number and N is a constant. For the elemental analysis of our samples, we used an
EDS system connected to a JEOL scanning electron microscope at Boston College.
Further details concerning scanning electron microscopy can be found in Joseph et.al
[5]
3.4 Resistivity Measurement
All the resistivity measurements were carried out using a standard four probe
technique. The resistivity measurements in presence of magnetic field were carried
out using Quantum Design Physical Property Measurement System (PPMS) in up to
9T (located in the laboratory of Professor Opeil at Boston College). The zero field
measurements were carried out using Keithley 6220 and 6221 current sources and
Keithley 2182 nanovoltmeter and Lakeshore Model 370 AC Resistance Bridge inside
an Advanced Research Systems cryostat down to 4K (Wilson Lab, Boston College).
The temperature was controlled using Lakeshore Model 335 temperature controller
and DT670 thermometers. Figure 3.4.1 shows the ARS cryostat setup in the Wilson
lab during this work.
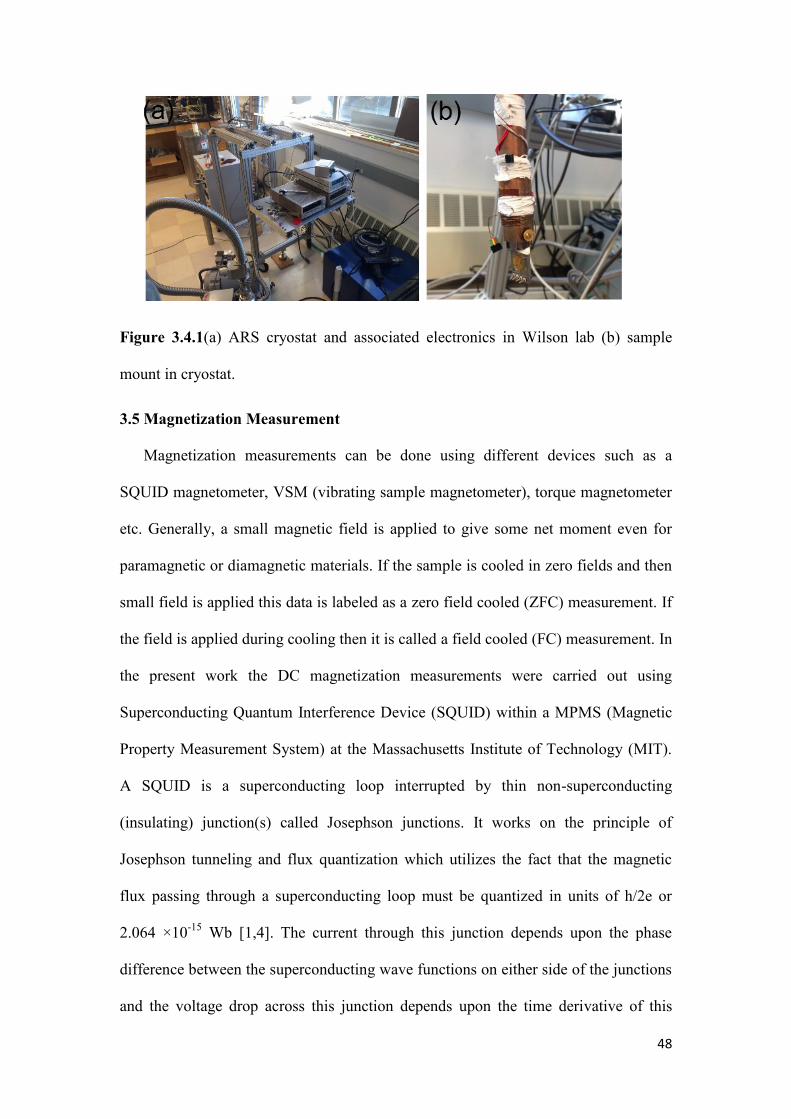
48
Figure 3.4.1(a) ARS cryostat and associated electronics in Wilson lab (b) sample
mount in cryostat.
3.5 Magnetization Measurement
Magnetization measurements can be done using different devices such as a
SQUID magnetometer, VSM (vibrating sample magnetometer), torque magnetometer
etc. Generally, a small magnetic field is applied to give some net moment even for
paramagnetic or diamagnetic materials. If the sample is cooled in zero fields and then
small field is applied this data is labeled as a zero field cooled (ZFC) measurement. If
the field is applied during cooling then it is called a field cooled (FC) measurement. In
the present work the DC magnetization measurements were carried out using
Superconducting Quantum Interference Device (SQUID) within a MPMS (Magnetic
Property Measurement System) at the Massachusetts Institute of Technology (MIT).
A SQUID is a superconducting loop interrupted by thin non-superconducting
(insulating) junction(s) called Josephson junctions. It works on the principle of
Josephson tunneling and flux quantization which utilizes the fact that the magnetic
flux passing through a superconducting loop must be quantized in units of h/2e or
2.064 ×10⁻¹⁵
Wb [1,4]. The current through this junction depends upon the phase
difference between the superconducting wave functions on either side of the junctions
and the voltage drop across this junction depends upon the time derivative of this
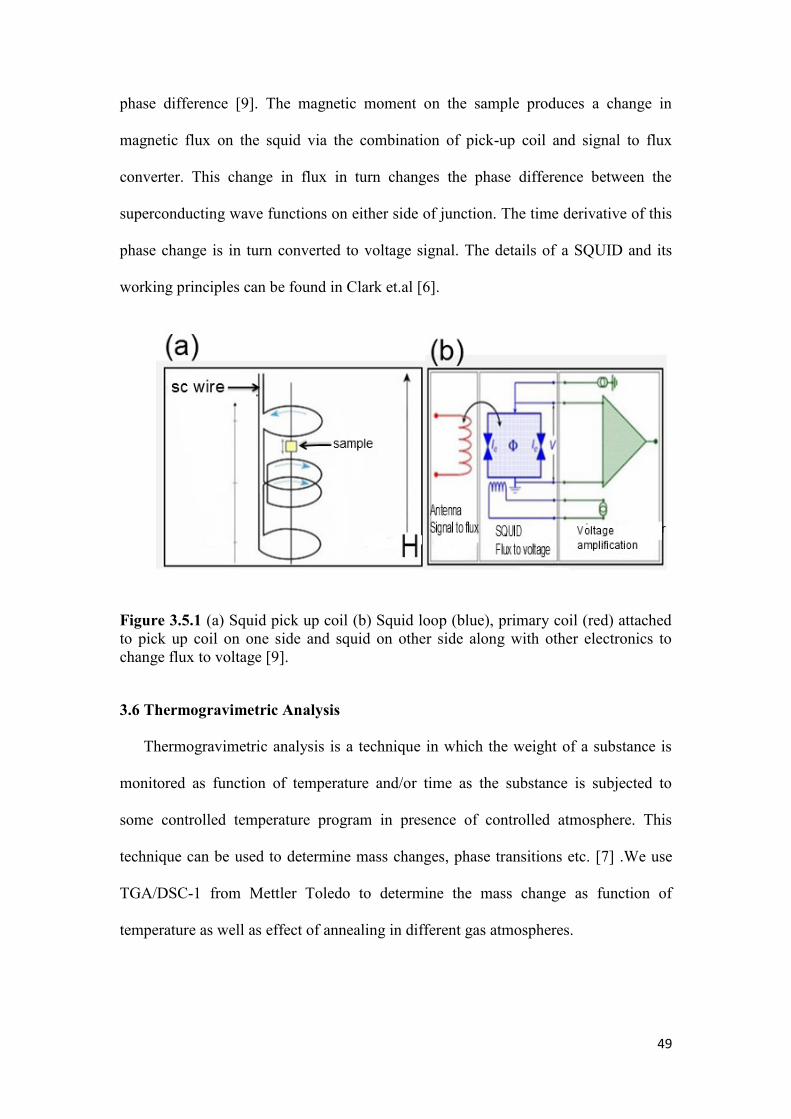
49
phase difference [9]. The magnetic moment on the sample produces a change in
magnetic flux on the squid via the combination of pick-up coil and signal to flux
converter. This change in flux in turn changes the phase difference between the
superconducting wave functions on either side of junction. The time derivative of this
phase change is in turn converted to voltage signal. The details of a SQUID and its
working principles can be found in Clark et.al [6].
Figure 3.5.1 (a) Squid pick up coil (b) Squid loop (blue), primary coil (red) attached
to pick up coil on one side and squid on other side along with other electronics to
change flux to voltage [9].
3.6 Thermogravimetric Analysis
Thermogravimetric analysis is a technique in which the weight of a substance is
monitored as function of temperature and/or time as the substance is subjected to
some controlled temperature program in presence of controlled atmosphere. This
technique can be used to determine mass changes, phase transitions etc. [7] .We use
TGA/DSC-1 from Mettler Toledo to determine the mass change as function of
temperature as well as effect of annealing in different gas atmospheres.
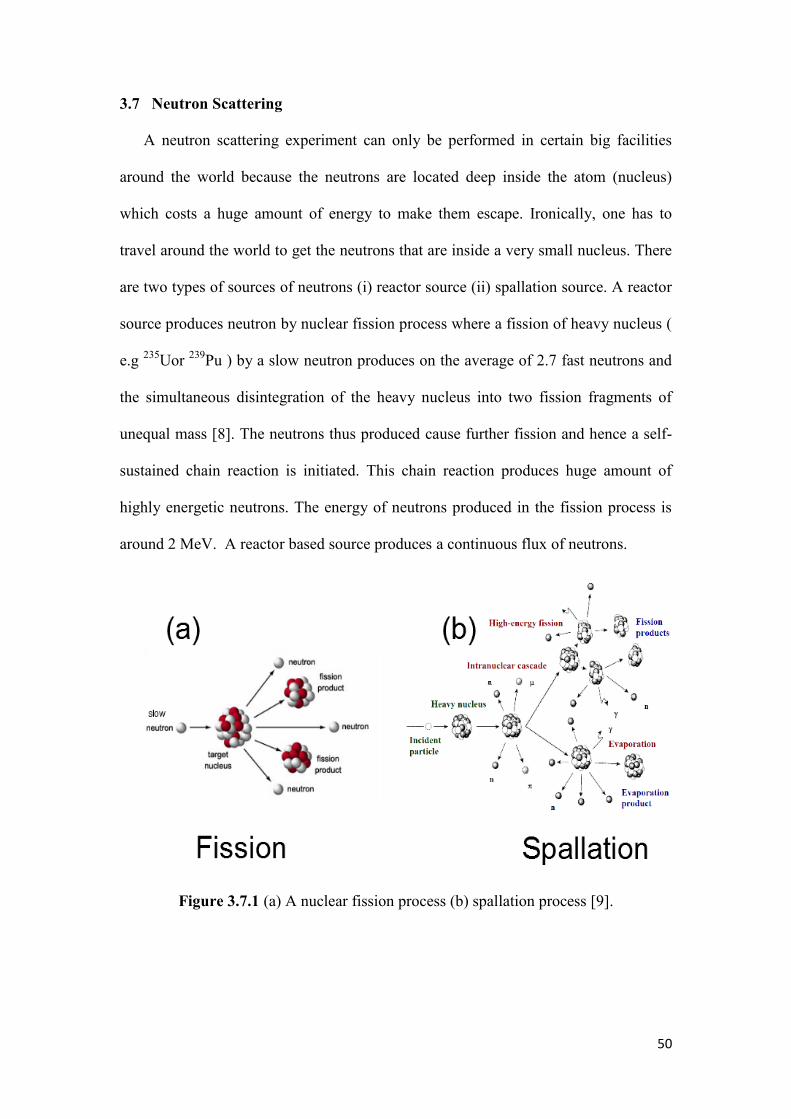
50
3.7 Neutron Scattering
A neutron scattering experiment can only be performed in certain big facilities
around the world because the neutrons are located deep inside the atom (nucleus)
which costs a huge amount of energy to make them escape. Ironically, one has to
travel around the world to get the neutrons that are inside a very small nucleus. There
are two types of sources of neutrons (i) reactor source (ii) spallation source. A reactor
source produces neutron by nuclear fission process where a fission of heavy nucleus (
e.g 235
Uor 239
Pu ) by a slow neutron produces on the average of 2.7 fast neutrons and
the simultaneous disintegration of the heavy nucleus into two fission fragments of
unequal mass [8]. The neutrons thus produced cause further fission and hence a self-
sustained chain reaction is initiated. This chain reaction produces huge amount of
highly energetic neutrons. The energy of neutrons produced in the fission process is
around 2 MeV. A reactor based source produces a continuous flux of neutrons.
Figure 3.7.1 (a) A nuclear fission process (b) spallation process [9].
51
In the spallation source, the target nuclei are bombarded with highly energetic beam
(GeV range) of protons. For highly energetic particle, the de Broglie wavelength
√ , becomes shorter than the linear dimension of the nucleus [8]. Thus the energetic
particle can directly interact with the nuclides inside the nucleus of target. This makes
target nuclei highly unstable ultimately causing a cascade process with release of
neutrons as shown in Figure 3.7.1 (b). The release of spallation neutrons takes place
within less than 10-15
s after the nucleus was hit, so that the time distribution of
spallation neutrons is determined exclusively from the time distribution of driving
particle pulse [8]. The energy of neutrons released from both sources is in the order of
MeV whereas the interatomic distances and elementary excitations fall in the meV
range. Thus the fast neutrons should be moderated using moderator substance. The
moderator should be such that it gives highest possible flux of required energy in the
shortest possible time (in pulsed sources) or in the largest possible volume (in
continuous sources) [8].The moderation can be achieved by using moderators made of
light atoms such as H2O or D2O. The time for slowing down the neutrons is of the
order of 10-6
s after which the neutrons are in thermal equilibrium with the moderator.
For a moderator at temperature T, the flux of neutrons is given by the Maxwellian
distribution [8]
. At room temperature the flux is maximum
for neutrons with wavelength of about 1 Å. For other wavelengths the flux is
maximized either by heating or cooling the moderator.
All the unpolarized neutron scattering experiments included in this work were
performed using constant wavelength triple axis spectrometers either at Oakridge
National Laboratory (HB1-A and HB1) or at Canadian Neutron Beam Center (CNBC)
(N-5 and C-5). Figure 3.6.7 shows a schematic for typical triple-axis spectrometer.

52
The triple-axis refers to 3 independent axis of rotation of monochromator, sample and
the analyzer. A polychromatic beam of neutrons from the reactor source is incident on
a monochromator crystal. The choice of monochromator crystal depends upon the
energy and wavelength that we want to use in the experiment. For energies below
35meV, generally (002) reflection (d=3.35A) of highly oriented pyrolytic graphite
(HOPG) is used, because, for this energy range, the flux is maximized with this
crystal. But at higher energies, the energy resolution of PG002 crystal becomes worse
and different crystals like Be002, Be110, Cu220 are used. Even after reflection from
monochromator crystal, the neutron beam is not truly monochromatic but contains
higher harmonics with wavelengths λ/2, λ/4 ……,depending on the spacegroup
symmetry of the monochromating crystal.To get rid of these higher harmonics, filters
are used which allow neutrons with wavelength λ±dλ (with dλ< λ/2) to transmit easily
while the higher harmonic neutrons are scattered out of the beam by Bragg reflection.
Generally a PG002 filter is used with its c axis along the direction of neutron beam.
After the neutrons are filtered out, they are collimated before they hit the sample to
make sure that they hit the sample with same energy/angle. The sample itself can be
rotated independently so that its different scattering planes satisfy Bragg condition
with the same incident wavelength. The scattered beam from the sample is further
filtered and collimated before it hits the analyzer crystal. The analyzer crystal can be
rotated independently so that it scatters neutrons of some fixed energy and momentum
toward the detector. Finally, the detector counts the number of neutrons within a
given solid angle as function of energy and momentum transfer.
The polarized neutron experiment included in this thesis was carried out on the
BT-7 triple axis spectrometer at NIST. There are different ways of polarizing neutrons
like use of polarizing crystals or polarizing mirror or polarizing filters. Out of them,

53
we used He3 polarizing filter to define the polarization of both the incoming and
outgoing neutrons. First He3 gas is spin polarized by pumping with the Rubidium
vapor and kept in a cell in the path of the unpolarized neutron beam. This spin
polarized He3 gas has very large capture cross section for neutrons with opposite spin
but almost zero capture cross section for neutrons with parallel spin. Thus the neutron
coming out of the He3 cell is spin polarized with its spin parallel to spins of He
3
molecules. These polarized neutrons are then oriented along certain direction by using
an adiabatically varying magnetic field. In our experiments, we applied the guide
magnetic field such that the neutron spin is either along the scattering vector or
perpendicular to the scattering vector.
Fig. 3.6.1 Schematic of triple axis spectrometer [10]
Chapter 3 References
[1] C. Kittel and P. McEuen, Introduction to solid state physics (Wiley New York,
1996), 7.

54
[2] B. R. Pamplin, Crystal growth (Pergamon Press, 1980), 16.
[3] C. Dhital, S. Khadka, Z. Yamani, C. de la Cruz, T. Hogan, S. Disseler, M.
Pokharel, K. Lukas, W. Tian, and C. Opeil, Physical Review B 86, 100401 (2012).
[4] N. Ashcroft and N. Mermin, Holt-Saunders, Philadelphia 16 (1976).
[5] J. Goldstein, D. E. Newbury, D. C. Joy, C. E. Lyman, P. Echlin, E. Lifshin, L.
Sawyer, and J. R. Michael, Scanning electron microscopy and X-ray microanalysis
(Springer, 2003).
[6] J. Clarke and A. I. Braginski, (2004).
[7] C. Duval, Inorganic thermogravimetric analysis (Houston, Elsevier Pub. Co,
Amsterdam, 1953).
[8] A. Furrer, J. Mesot, T. Strässle, and J. Mesot, Neutron scattering in condensed
matter physics (World Scientific Singapore, 2009).
[9] A. Krása, .
[10] Z. Yamani, Z. Tun, and D. Ryan, Can. J. Phys. 88, 771 (2010).
[11] http://squid.iitd.ernet.in/Basic_Literature.htm
55
Chapter 4: Correlated Phase Behavior of Sr2IrO4
(In this chapter I am going to present magnetic and crystal structure analysis of single
layer compound Sr2IrO4 using neutron diffraction. Most of the work described in this
chapter is published in an article by Dhital et.al “Neutron scattering study of
correlated phase behavior in Sr2IrO4” Phys. Rev. B 87, 144405 (2013). After or in
parallel to this study there are similar/different studies exploring the crystal and
magnetic structure of this compound which I already discussed in Chapter 2
(Introduction)).
4.1 Motivation
Within the Ruddelsden-Popper series, a picture of a Jeff = ½ Mott insulating phase
has been proposed to explain the antiferromagnetically ordered, insulating ground
states of its two members n = 1 (Sr2IrO4) and n = 2 (Sr3Ir2O7) [1--3]. Within this
picture, a cooperative interplay of spin-orbit-induced band-width narrowing and on-
site Coulomb interactions generates the necessary Mott insulating ground state. An
alternate interpretation, however, has also been proposed that, instead, models the
insulating ground states of these systems as arising from a weakly correlated band
insulator in which the formation of magnetic order continuously builds the band gap
and where the effects of electron-electron correlations are secondary [4,5]. The
insulating ground state in the Sr2n+1IrnO3n+1 series is destabilized as the dimensionality
is increased with increasing n [6] however, the relative changes in the electronic and
magnetic properties as the materials transition from the n = 1 single-layer Sr2IrO4 (Sr-
214) to the n = 2 bilayer Sr3Ir2O7 (Sr-327) remain poorly understood. The room-
temperature resistivity of Sr-214 and Sr-327 reflect the notion of a reduced electronic
band gap with increased dimensionality [7,8] however, their low-temperature
properties differ substantially [7,9]. While charge transport in Sr-214 does not directly
couple to the onset of magnetic order, Arrhenius-activated transport appears below
230 K, which then transitions to a variable range-hopping regime at low temperatures
56
[10]. In contrast to this, no simple model for the low-temperature transport applies
[9,11] to transport of Sr-327. However, the resistivity couples to the onset of
antiferromagnetic (AF) order below 280 K via an enhanced spin-charge coupling
mechanism, and a proposed second phase transition appears below T* =70 K [9,11].
While both systems are canted G-type antiferromagnets [3,9,12] the moments in
Sr-214 orient within the basal plane, whereas those for Sr-327 orient predominantly
along the c axis. The driving force behind this reorientation stems from the enhanced
inter plane coupling of the bilayer compound; however, the evolution of the effective
ordered moment and magnetism as a function of increasing dimensionality remains
largely unexplored. Historical comparisons in the literature rely on saturated net
moments as observed via bulk magnetization [7,11,13,14]. This is very imprecise
given that these materials are canted antiferromagnets with entirely different moment
orientations and hence vastly different pictures of ferromagnetic moments generated
via in-plane canting. Given that the relative ordered moment size constitutes one
traditional metric for ascertaining the relative strength of correlations between two
materials in similar electronic environments, a precise determination of the relative
values of their ordered moments is particularly germane.
4.2 Crystal Growth and Preliminary Characterization
For our experiments, we grew single crystals of Sr2IrO4 using established SrCl2-
flux techniques [3]. The stoichiometry of the resulting Sr-214 crystals was confirmed
via energy dispersive spectroscopy measurements, and a number of Sr-214 crystals
were also ground into a powder and checked via x-ray diffraction in a Bruker D2
phaser system. Within resolution, all x-ray peaks were indexed to the reported
tetragonal structure (space group I41/acd, a = b = 5.48 A°, and c = 25.8 A°). For this

57
sample we focused our study only on the determination of spin structure and the
ordered moment using neutron scattering.
4.3 Neutron Scattering of Sr2IrO4 Single Crystal
Neutron diffraction experiments were performed on a 5-mg crystal with a
resolution-limited mosaic of 0.40◦ at the C-5 triple-axis spectrometer at the Canadian
Neutron Beam Center at Chalk River Laboratories. A fixed final energy EF =14.5
meV setup was used with a vertically focusing pyrolytic graphite (PG) crystal (PG-
002) as the monochromator and a flat PG-002 analyzer. Collimations were 33’, 48’,
51’, and 144’ before the monochromator, sample, analyzer, and detector, respectively,
along with two PG filters after the sample. The single crystal was mounted within the
[H, 0, L] scattering plane within a closed-cycle refrigerator.
Figure 4.3.1 shows the results of neutron scattering measurements through the
magnetic wave vectors of Sr-214. Specifically, radial scans through the Q = (1, 0, L)
positions show that for L = even, magnetic reflections appear below 230 K; consistent
with the known TN of this system [7,15]. The correlated order is three-dimensional,
with a minimum in-plane spin-spin correlation length of ξL= 130 ± 8 °A calculated
using the relation ξL = √2ln(2)w−1
(w is the Gaussian width of the peak in Å-1
).
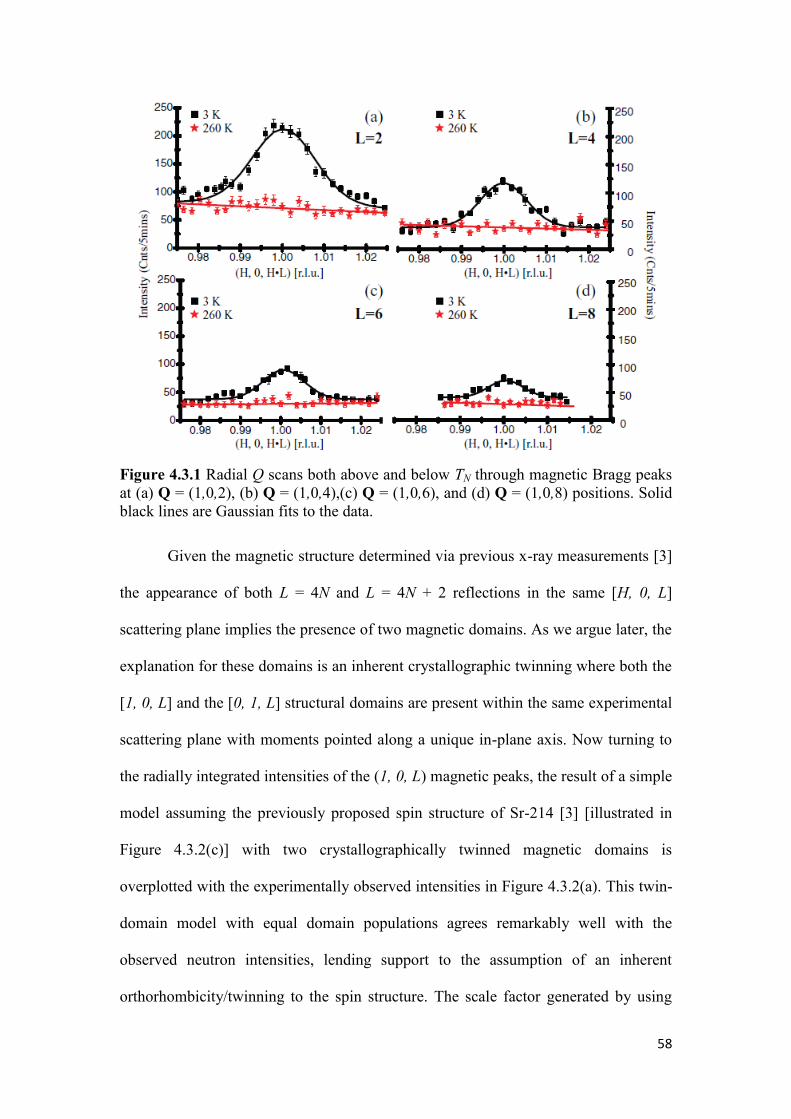
58
Figure 4.3.1 Radial Q scans both above and below TN through magnetic Bragg peaks
at (a) Q = (1,0,2), (b) Q = (1,0,4),(c) Q = (1,0,6), and (d) Q = (1,0,8) positions. Solid
black lines are Gaussian fits to the data.
Given the magnetic structure determined via previous x-ray measurements [3]
the appearance of both L = 4N and L = 4N + 2 reflections in the same [H, 0, L]
scattering plane implies the presence of two magnetic domains. As we argue later, the
explanation for these domains is an inherent crystallographic twinning where both the
[1, 0, L] and the [0, 1, L] structural domains are present within the same experimental
scattering plane with moments pointed along a unique in-plane axis. Now turning to
the radially integrated intensities of the (1, 0, L) magnetic peaks, the result of a simple
model assuming the previously proposed spin structure of Sr-214 [3] [illustrated in
Figure 4.3.2(c)] with two crystallographically twinned magnetic domains is
overplotted with the experimentally observed intensities in Figure 4.3.2(a). This twin-
domain model with equal domain populations agrees remarkably well with the
observed neutron intensities, lending support to the assumption of an inherent
orthorhombicity/twinning to the spin structure. The scale factor generated by using
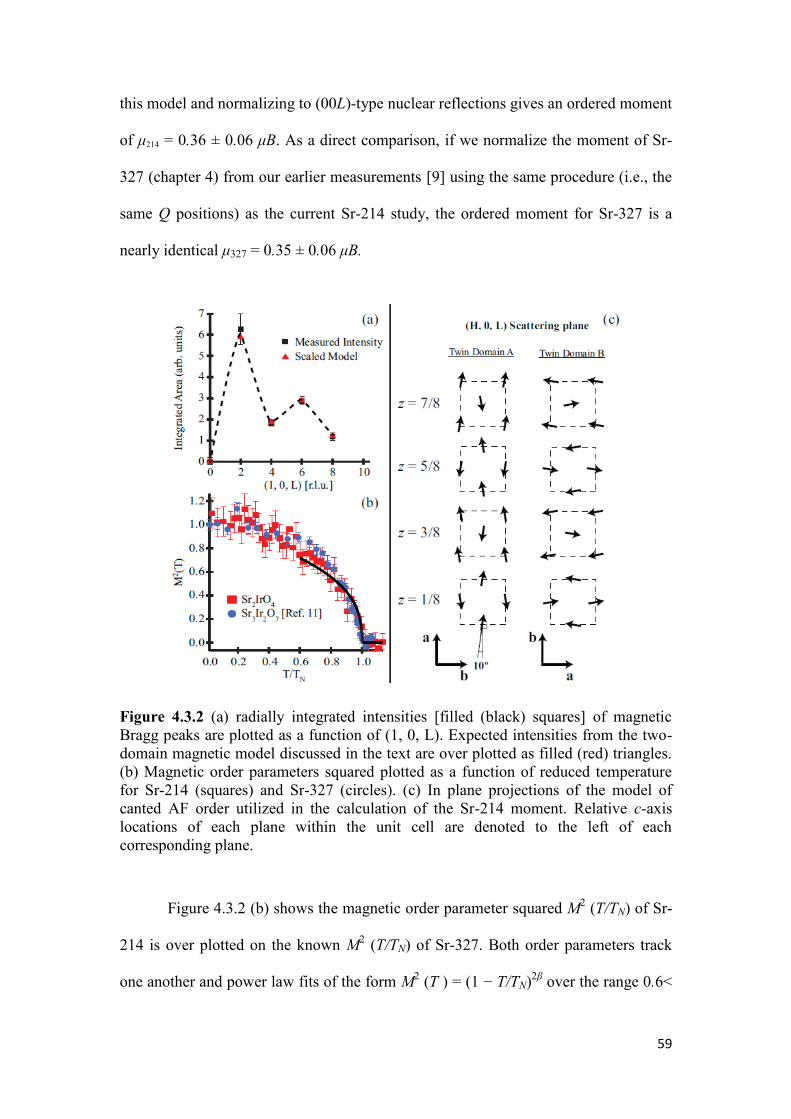
59
this model and normalizing to (00L)-type nuclear reflections gives an ordered moment
of μ214 = 0.36 ± 0.06 μB. As a direct comparison, if we normalize the moment of Sr-
327 (chapter 4) from our earlier measurements [9] using the same procedure (i.e., the
same Q positions) as the current Sr-214 study, the ordered moment for Sr-327 is a
nearly identical μ327 = 0.35 ± 0.06 μB.
Figure 4.3.2 (a) radially integrated intensities [filled (black) squares] of magnetic
Bragg peaks are plotted as a function of (1, 0, L). Expected intensities from the two-
domain magnetic model discussed in the text are over plotted as filled (red) triangles.
(b) Magnetic order parameters squared plotted as a function of reduced temperature
for Sr-214 (squares) and Sr-327 (circles). (c) In plane projections of the model of
canted AF order utilized in the calculation of the Sr-214 moment. Relative c-axis
locations of each plane within the unit cell are denoted to the left of each
corresponding plane.
Figure 4.3.2 (b) shows the magnetic order parameter squared M2 (T/TN) of Sr-
214 is over plotted on the known M2 (T/TN) of Sr-327. Both order parameters track
one another and power law fits of the form M2 (T ) = (1 − T/TN)
2β over the range 0.6<
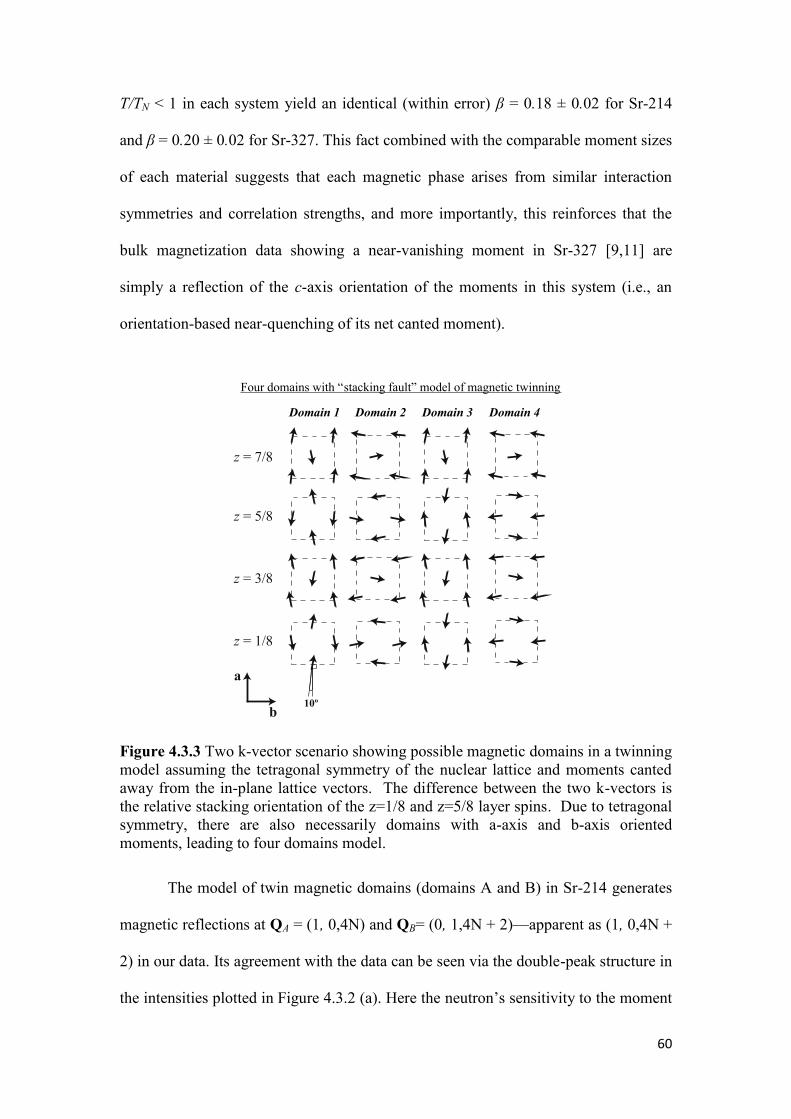
60
T/TN < 1 in each system yield an identical (within error) β = 0.18 ± 0.02 for Sr-214
and β = 0.20 ± 0.02 for Sr-327. This fact combined with the comparable moment sizes
of each material suggests that each magnetic phase arises from similar interaction
symmetries and correlation strengths, and more importantly, this reinforces that the
bulk magnetization data showing a near-vanishing moment in Sr-327 [9,11] are
simply a reflection of the c-axis orientation of the moments in this system (i.e., an
orientation-based near-quenching of its net canted moment).
Figure 4.3.3 Two k-vector scenario showing possible magnetic domains in a twinning
model assuming the tetragonal symmetry of the nuclear lattice and moments canted
away from the in-plane lattice vectors. The difference between the two k-vectors is
the relative stacking orientation of the z=1/8 and z=5/8 layer spins. Due to tetragonal
symmetry, there are also necessarily domains with a-axis and b-axis oriented
moments, leading to four domains model.
The model of twin magnetic domains (domains A and B) in Sr-214 generates
magnetic reflections at QA = (1, 0,4N) and QB= (0, 1,4N + 2)—apparent as (1, 0,4N +
2) in our data. Its agreement with the data can be seen via the double-peak structure in
the intensities plotted in Figure 4.3.2 (a). Here the neutron’s sensitivity to the moment
z = 1/8
z = 3/8
z = 5/8
z = 7/8
a
b10º
Four domains with “stacking fault” model of magnetic twinning
Domain 1 Domain 2 Domain 3 Domain 4
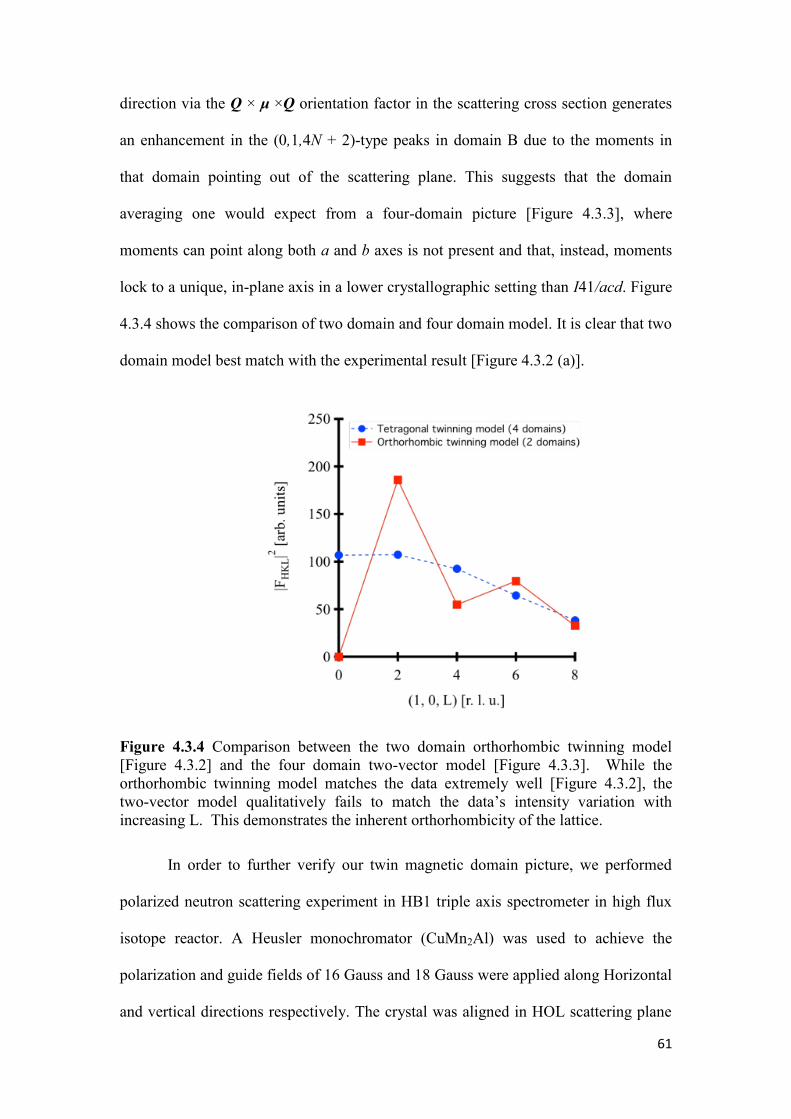
61
direction via the Q × μ ×Q orientation factor in the scattering cross section generates
an enhancement in the (0,1,4N + 2)-type peaks in domain B due to the moments in
that domain pointing out of the scattering plane. This suggests that the domain
averaging one would expect from a four-domain picture [Figure 4.3.3], where
moments can point along both a and b axes is not present and that, instead, moments
lock to a unique, in-plane axis in a lower crystallographic setting than I41/acd. Figure
4.3.4 shows the comparison of two domain and four domain model. It is clear that two
domain model best match with the experimental result [Figure 4.3.2 (a)].
Figure 4.3.4 Comparison between the two domain orthorhombic twinning model
[Figure 4.3.2] and the four domain two-vector model [Figure 4.3.3]. While the
orthorhombic twinning model matches the data extremely well [Figure 4.3.2], the
two-vector model qualitatively fails to match the data’s intensity variation with
increasing L. This demonstrates the inherent orthorhombicity of the lattice.
In order to further verify our twin magnetic domain picture, we performed
polarized neutron scattering experiment in HB1 triple axis spectrometer in high flux
isotope reactor. A Heusler monochromator (CuMn2Al) was used to achieve the
polarization and guide fields of 16 Gauss and 18 Gauss were applied along Horizontal
and vertical directions respectively. The crystal was aligned in HOL scattering plane

62
and cooled inside a cryostat. For this measurement we focused only on (102)
magnetic peak. We measured four cross sections (i) Horizontal field (field along Q)
non spin flip (HF-NSF) (ii) Horizontal field spin flip (HF-SF) (iii) Vertical field
(field perpendicular to Q) non spin flip (VF-NSF) (ii) vertical field spin flip (VF-SF).
Figure 4.3.5 Simplified picture of two domain (A and B) models where the arrows
represent the direction of moment as well as a axis for that domain. Here vector (1, 0,
2) is out of the plane making angle 23 degree with a axis
Now if the crystal having all these domains is aligned in the HOL scattering plane
with horizontal scattering geometry then only one domain (domain A) lies in the
scattering plane. With unpolarized neutrons, the magnetic scattering from domain A
gives peak at (1, 0,4L ) positions whereas that from domain B gives peak at
(0,1,4L+2) position which we see as (1,0,4L+2). Thus the peak coming at position (1,
0 4L+2) is coming only from domain B. Note here that Q=(1,0,2) makes an angle of
23 degree with a axis i.e with direction of moment in domain A. However the domain
giving intensity at (1,0,2) position (domain B) is always perpendicular to (1,0,2)
direction. Now if a beam of neutron with its spin polarized along horizontal direction
(i.e along Q= (1, 0, 2)) hits the sample then one should get the intensity only in the
23
0
(1,0,0)
(1,0,2)
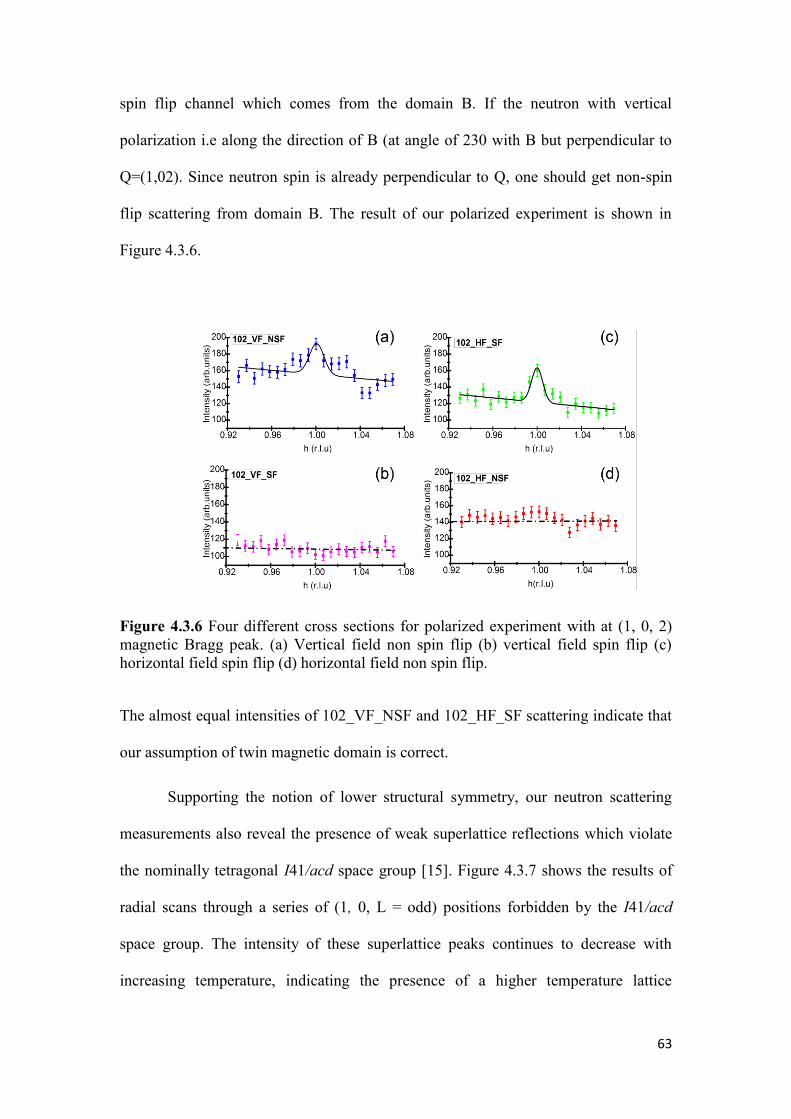
63
spin flip channel which comes from the domain B. If the neutron with vertical
polarization i.e along the direction of B (at angle of 230 with B but perpendicular to
Q=(1,02). Since neutron spin is already perpendicular to Q, one should get non-spin
flip scattering from domain B. The result of our polarized experiment is shown in
Figure 4.3.6.
Figure 4.3.6 Four different cross sections for polarized experiment with at (1, 0, 2)
magnetic Bragg peak. (a) Vertical field non spin flip (b) vertical field spin flip (c)
horizontal field spin flip (d) horizontal field non spin flip.
The almost equal intensities of 102_VF_NSF and 102_HF_SF scattering indicate that
our assumption of twin magnetic domain is correct.
Supporting the notion of lower structural symmetry, our neutron scattering
measurements also reveal the presence of weak superlattice reflections which violate
the nominally tetragonal I41/acd space group [15]. Figure 4.3.7 shows the results of
radial scans through a series of (1, 0, L = odd) positions forbidden by the I41/acd
space group. The intensity of these superlattice peaks continues to decrease with
increasing temperature, indicating the presence of a higher temperature lattice
64
distortion similar to the case of Sr-327 [9]. While the precise onset temperature of this
distortion is unclear, at a minimum, the presence of these forbidden peaks implies a
structural symmetry lower than that commonly reported and suggests the notion of
magnetic domains arising via crystallographic twinning. A simple survey of likely
orthorhombic subgroups of I41/acd suggests the candidate space groups of I212121 or
Pnn2; however, several tetragonal subgroups are also consistent with these
reflections. Further experiments are clearly required to fully understand the final
lattice symmetry and to ultimately discern the role of potential oxygen
vacancy/defects in the resulting structure and symmetry breaking. Same superlattice
peaks were also seen in parallel study by Feng Ye et.al [16]
As a further check of magnetic order in Sr-214, we searched for the presence
of (0, 0, L) peaks arising from the correlated in-plane canting sequence modulated
along the c axis. Q scans in Figure 4.3.8 through the magnetic peak position Q = (0, 0,
3) show the presence of two components of scattering along L. The first is a weak
magnetic peak centered at (0, 0, 3) due to the c-axis modulated in-plane canting
orientations in Sr-214. The second component, however, is a broad short-range
scattering signal that is uncorrelated along L and short-range along H. The in-plane
correlation length of this underlying broad line shape is only ξL = 4 ± 1 A° , reflective
of in-plane correlations spanning the length of one unit cell and completely disordered
out of the IrO2 plane.
The intensity of this diffuse rod of scattering drops rapidly with increasing L
as shown in Figure 4.3.8 (a). Here the background at Q = (0.6, 0, L) has been
subtracted from the diffuse signal, and the signal vanishing is demonstrated explicitly
by H scans at increasing L values plotted in Figure 4.3.6 (b). Furthermore, an
extended H scan at the noninteger Q = (0, 0, 3.3) position [Figure 4.3.8(b)] shows that
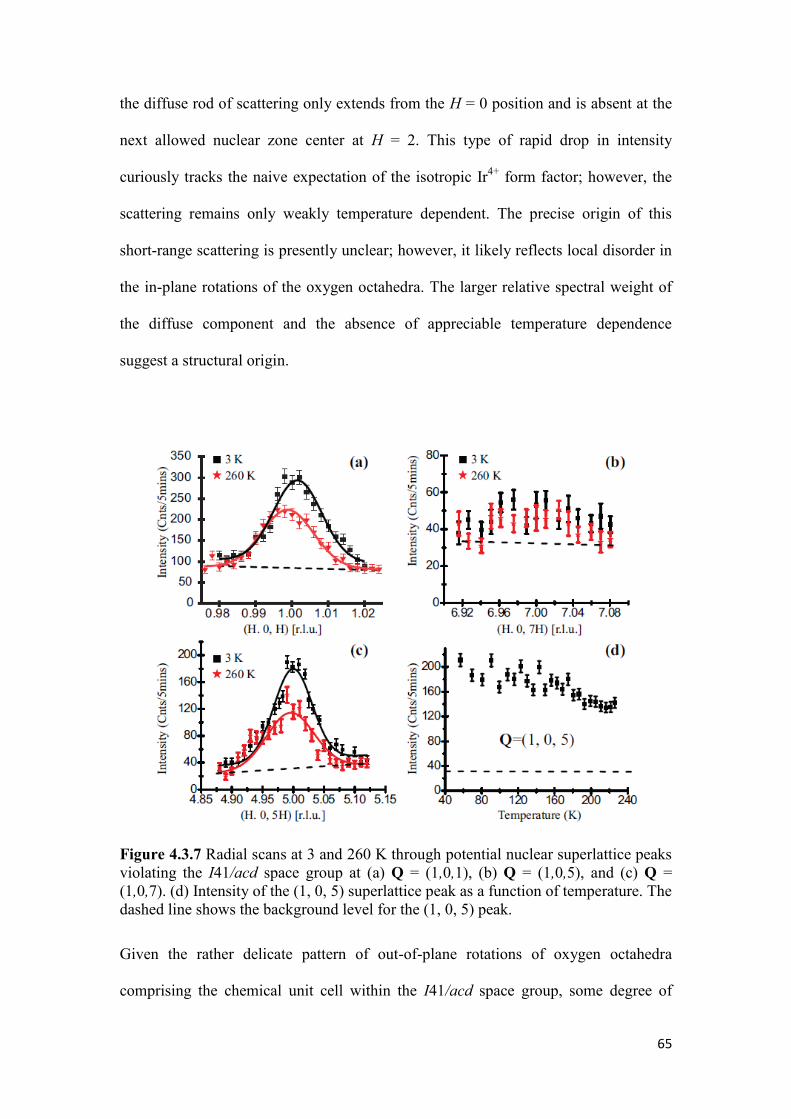
65
the diffuse rod of scattering only extends from the H = 0 position and is absent at the
next allowed nuclear zone center at H = 2. This type of rapid drop in intensity
curiously tracks the naive expectation of the isotropic Ir4+
form factor; however, the
scattering remains only weakly temperature dependent. The precise origin of this
short-range scattering is presently unclear; however, it likely reflects local disorder in
the in-plane rotations of the oxygen octahedra. The larger relative spectral weight of
the diffuse component and the absence of appreciable temperature dependence
suggest a structural origin.
Figure 4.3.7 Radial scans at 3 and 260 K through potential nuclear superlattice peaks
violating the I41/acd space group at (a) Q = (1,0,1), (b) Q = (1,0,5), and (c) Q =
(1,0,7). (d) Intensity of the (1, 0, 5) superlattice peak as a function of temperature. The
dashed line shows the background level for the (1, 0, 5) peak.
Given the rather delicate pattern of out-of-plane rotations of oxygen octahedra
comprising the chemical unit cell within the I41/acd space group, some degree of
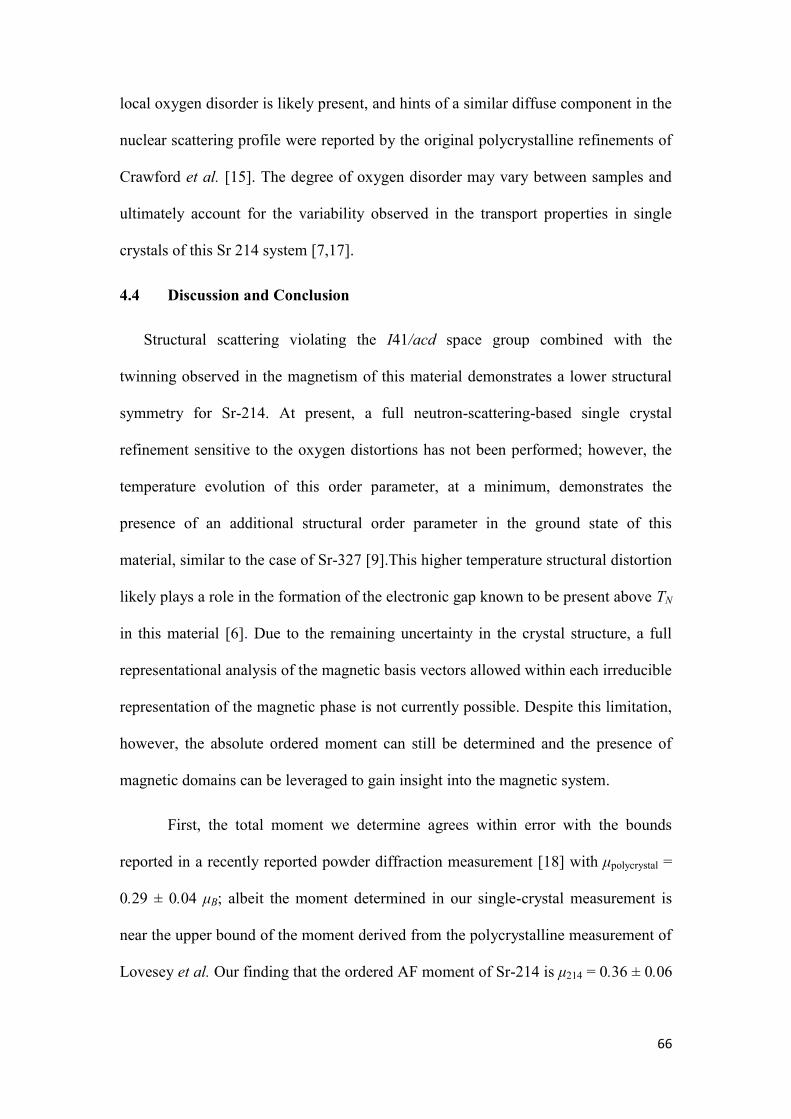
66
local oxygen disorder is likely present, and hints of a similar diffuse component in the
nuclear scattering profile were reported by the original polycrystalline refinements of
Crawford et al. [15]. The degree of oxygen disorder may vary between samples and
ultimately account for the variability observed in the transport properties in single
crystals of this Sr 214 system [7,17].
4.4 Discussion and Conclusion
Structural scattering violating the I41/acd space group combined with the
twinning observed in the magnetism of this material demonstrates a lower structural
symmetry for Sr-214. At present, a full neutron-scattering-based single crystal
refinement sensitive to the oxygen distortions has not been performed; however, the
temperature evolution of this order parameter, at a minimum, demonstrates the
presence of an additional structural order parameter in the ground state of this
material, similar to the case of Sr-327 [9].This higher temperature structural distortion
likely plays a role in the formation of the electronic gap known to be present above TN
in this material [6]. Due to the remaining uncertainty in the crystal structure, a full
representational analysis of the magnetic basis vectors allowed within each irreducible
representation of the magnetic phase is not currently possible. Despite this limitation,
however, the absolute ordered moment can still be determined and the presence of
magnetic domains can be leveraged to gain insight into the magnetic system.
First, the total moment we determine agrees within error with the bounds
reported in a recently reported powder diffraction measurement [18] with μpolycrystal =
0.29 ± 0.04 μB; albeit the moment determined in our single-crystal measurement is
near the upper bound of the moment derived from the polycrystalline measurement of
Lovesey et al. Our finding that the ordered AF moment of Sr-214 is μ214 = 0.36 ± 0.06
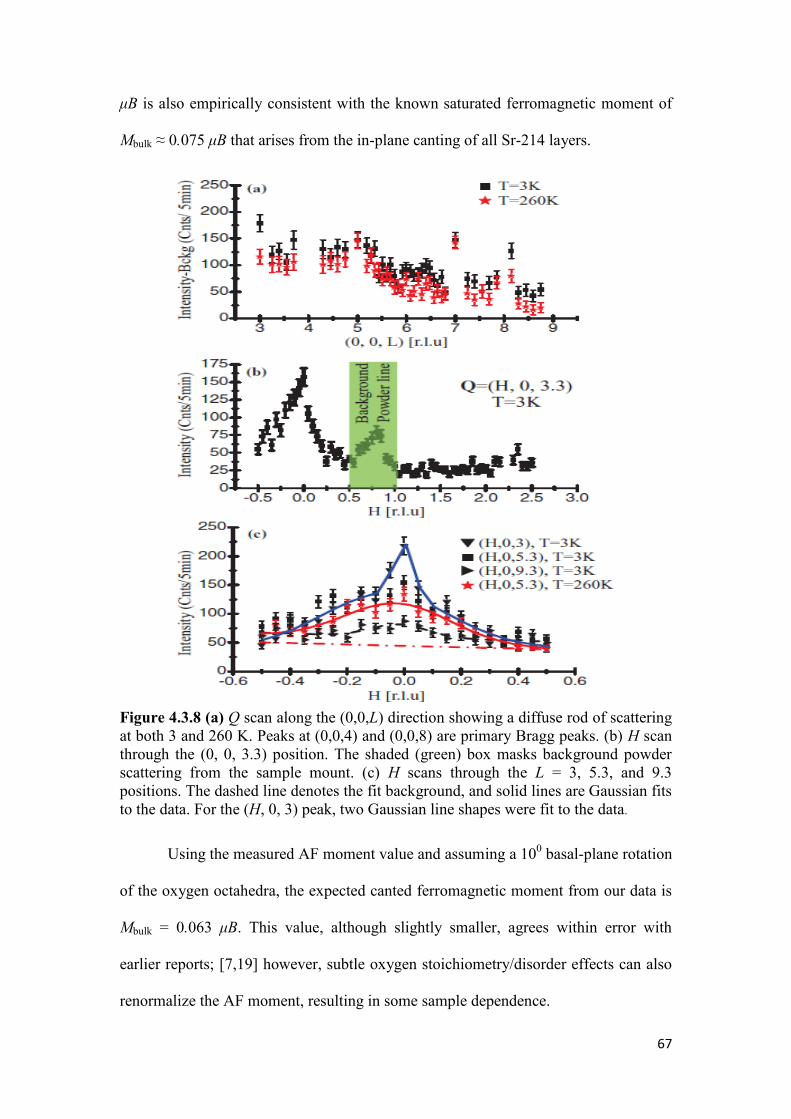
67
μB is also empirically consistent with the known saturated ferromagnetic moment of
Mbulk ≈ 0.075 μB that arises from the in-plane canting of all Sr-214 layers.
Figure 4.3.8 (a) Q scan along the (0,0,L) direction showing a diffuse rod of scattering
at both 3 and 260 K. Peaks at (0,0,4) and (0,0,8) are primary Bragg peaks. (b) H scan
through the (0, 0, 3.3) position. The shaded (green) box masks background powder
scattering from the sample mount. (c) H scans through the L = 3, 5.3, and 9.3
positions. The dashed line denotes the fit background, and solid lines are Gaussian fits
to the data. For the (H, 0, 3) peak, two Gaussian line shapes were fit to the data.
Using the measured AF moment value and assuming a 100 basal-plane rotation
of the oxygen octahedra, the expected canted ferromagnetic moment from our data is
Mbulk = 0.063 μB. This value, although slightly smaller, agrees within error with
earlier reports; [7,19] however, subtle oxygen stoichiometry/disorder effects can also
renormalize the AF moment, resulting in some sample dependence.
68
The moment determined in our study is also in agreement with early local
density approximation theoretical estimates. The near-identical ordered moments of
Sr-214 (μ214 =0.36 μB) and Sr-327 (μ327 =0.35 μB) reflect the comparable correlation
strengths between the two systems. This result stands in stark contrast to recent RXS
studies which claim a substantially smaller moment within Sr-327 relative to Sr-214
[14] .Neutron scattering, however, provides a more quantitative assessment of the
ordered moment size relative to the second-order RXS process, where recent work has
theorized that the RXS signal is potentially comprised of only the orbital component
of the total angular momentum [20].The intensity variation of magnetic scattering at
the (1,0,L) positions plotted in Figure 4.3.2(a) surprisingly suggests that, between
magnetic domains, moments point along the same unique in-plane axis plus a small
degree of canting. Our two-domain picture of domain formation is presently modeled
as stemming from crystallographic twinning and we have assumed the same relative
orientations between Ir-site spins in each domain. This two domain scenario also can
be explained in terms of polarized data shown in Figure 4.3.6. If we maintain this
assumption of fixed relative spin orientations in all domains and now consider a more
general scenario with tetragonal symmetry, a four-domain picture with
crystallographically twinned domains whose moments point along the a axis in two of
the domains and along the b axis in the other two can be envisioned. However, due to
the neutron orientation factor, in Sr-214 the domain averaged intensities generated at
each magnetic reflection differ between these two pictures of domain creation—most
notably through the absence of the (1,0,0) magnetic reflection and only the two-
domain scenario with moments oriented along one unique in-plane direction matches
the observed data in Figure 43.2(a). This further suggests the notion of an underlying
orthorhombic structural symmetry or, alternatively, more exotic means of symmetry

69
breaking that bias the in-plane moment orientation such as single-ion anisotropy
effects or an in-plane electronic nematicity.
We note here that in our four-domain models of magnetism in this system, we
assumed that the orientations of the in-plane moments can be uniformly rotated from
a predominantly a-axis orientation to a b-axis orientation using basis vectors within a
single irreducible representation of the magnetic order. This is not allowed using the
irreducible representations resulting from the decomposition of the magnetic phase
using the I41/acd structural symmetry as shown by Lovesey et al [18].
However, given that our present measurements show that the true crystal
structure possesses a lower symmetry; such a uniform rotation does become possible
in lower candidate symmetries. We also did consistency check of our two and four
domain model using representational analysis. Table 4.4.1 shows the representational
analysis using I41/acd structural symmetry. Using the second table setting (origin
choice 2), the Ir moments sit on the 8a Wyckoff position in the zeroth unit cell and a
magnetic propagation wave vector of k = (1, 1, 1) as shown by Lovesey et al [18].
This gives four Ir atoms at the (1/2, 1/4, 1/8), (0, 3/4, 1/8), (1/2, 3/4, 3/8), and (0, 1/4,
3/8) positions. Another four positions can be generated via the body centering vector
lb=(1/2, 1/2, 1/2).Here, using the BasIreps program, the magnetic representation
breaks down into four irreducible representations (IRs) where:
. Within this decomposition and can be excluded since their
basis vectors direct the moment orientation out of the IrO2-plane in disagreement with
experimental data. and both possess basis vectors with moments oriented
within the plane, and a linear combination of basis vectors within can describe the
data. As mentioned already, in using this decomposition a model of magnetic domains
cannot naively rotate the moment direction 90 degrees to point predominantly from
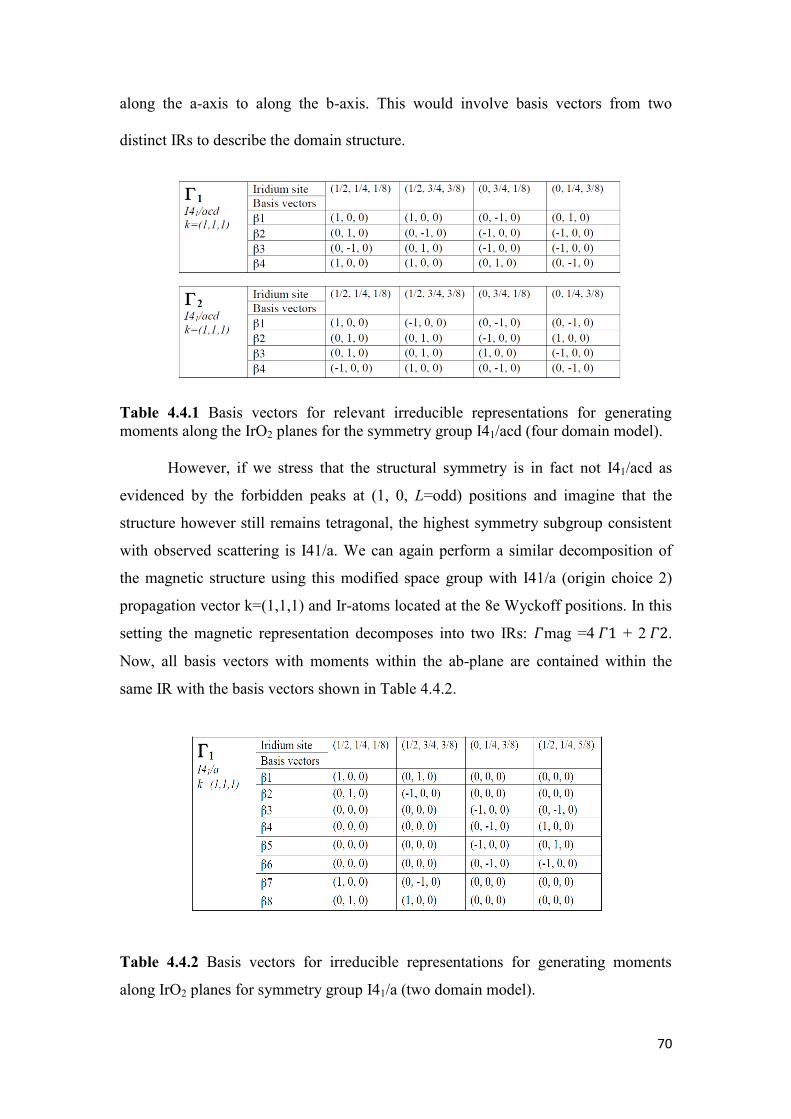
70
along the a-axis to along the b-axis. This would involve basis vectors from two
distinct IRs to describe the domain structure.
Table 4.4.1 Basis vectors for relevant irreducible representations for generating
moments along the IrO2 planes for the symmetry group I41/acd (four domain model).
However, if we stress that the structural symmetry is in fact not I41/acd as
evidenced by the forbidden peaks at (1, 0, L=odd) positions and imagine that the
structure however still remains tetragonal, the highest symmetry subgroup consistent
with observed scattering is I41/a. We can again perform a similar decomposition of
the magnetic structure using this modified space group with I41/a (origin choice 2)
propagation vector k=(1,1,1) and Ir-atoms located at the 8e Wyckoff positions. In this
setting the magnetic representation decomposes into two IRs: mag =4 + 2 .
Now, all basis vectors with moments within the ab-plane are contained within the
same IR with the basis vectors shown in Table 4.4.2.
Table 4.4.2 Basis vectors for irreducible representations for generating moments
along IrO2 planes for symmetry group I41/a (two domain model).
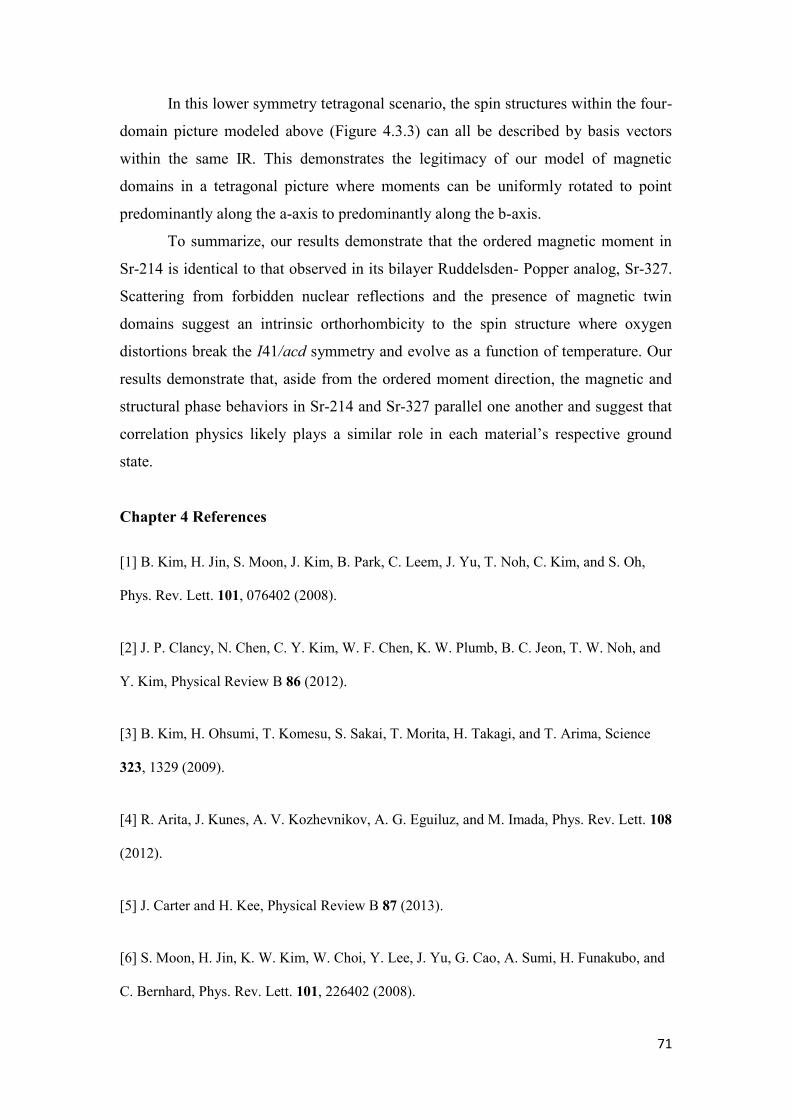
71
In this lower symmetry tetragonal scenario, the spin structures within the four-
domain picture modeled above (Figure 4.3.3) can all be described by basis vectors
within the same IR. This demonstrates the legitimacy of our model of magnetic
domains in a tetragonal picture where moments can be uniformly rotated to point
predominantly along the a-axis to predominantly along the b-axis.
To summarize, our results demonstrate that the ordered magnetic moment in
Sr-214 is identical to that observed in its bilayer Ruddelsden- Popper analog, Sr-327.
Scattering from forbidden nuclear reflections and the presence of magnetic twin
domains suggest an intrinsic orthorhombicity to the spin structure where oxygen
distortions break the I41/acd symmetry and evolve as a function of temperature. Our
results demonstrate that, aside from the ordered moment direction, the magnetic and
structural phase behaviors in Sr-214 and Sr-327 parallel one another and suggest that
correlation physics likely plays a similar role in each material’s respective ground
state.
Chapter 4 References
[1] B. Kim, H. Jin, S. Moon, J. Kim, B. Park, C. Leem, J. Yu, T. Noh, C. Kim, and S. Oh,
Phys. Rev. Lett. 101, 076402 (2008).
[2] J. P. Clancy, N. Chen, C. Y. Kim, W. F. Chen, K. W. Plumb, B. C. Jeon, T. W. Noh, and
Y. Kim, Physical Review B 86 (2012).
[3] B. Kim, H. Ohsumi, T. Komesu, S. Sakai, T. Morita, H. Takagi, and T. Arima, Science
323, 1329 (2009).
[4] R. Arita, J. Kunes, A. V. Kozhevnikov, A. G. Eguiluz, and M. Imada, Phys. Rev. Lett. 108
(2012).
[5] J. Carter and H. Kee, Physical Review B 87 (2013).
[6] S. Moon, H. Jin, K. W. Kim, W. Choi, Y. Lee, J. Yu, G. Cao, A. Sumi, H. Funakubo, and
C. Bernhard, Phys. Rev. Lett. 101, 226402 (2008).
72
[7] G. Cao, J. Bolivar, S. McCall, J. Crow, and R. Guertin, Physical Review B 57, R11039
(1998).
[8] G. Cao, Y. Xin, C. S. Alexander, J. E. Crow, P. Schlottmann, M. K. Crawford, R. L.
Harlow, and W. Marshall, Physical Review B 66 (2002).
[9] C. Dhital, S. Khadka, Z. Yamani, et al, Physical Review B 86 (2012).
[10] N. S. Kini, A. M. Strydom, H. S. Jeevan, C. Geibel, and S. Ramakrishnan, Journal of
Physics-Condensed Matter 18, 8205 (2006).
[11] G. Cao, Y. Xin, C. Alexander, J. Crow, P. Schlottmann, M. Crawford, R. Harlow, and
W. Marshall, Physical Review B 66, 214412 (2002).
[12] S. Fujiyama, H. Ohsumi, T. Komesu, J. Matsuno, B. J. Kim, M. Takata, T. Arima, and H.
Takagi, Phys. Rev. Lett. 108 (2012).
[13] S. Boseggia, R. Springell, H. C. Walker, A. T. Boothroyd, D. Prabhakaran, D.
Wermeille, L. Bouchenoire, S. P. Collins, and D. F. McMorrow, Physical Review B 85
(2012).
[14] S. Fujiyama, K. Ohashi, H. Ohsumi, K. Sugimoto, T. Takayama, T. Komesu, M. Takata,
T. Arima, and H. Takagi, Physical Review B 86 (2012).
[15] M. K. Crawford, M. A. Subramanian, R. L. Harlow, J. A. Fernandezbaca, Z. R. Wang,
and D. C. Johnston, Physical Review B 49, 9198 (1994).
[16] F. Ye, S. Chi, B. C. Chakoumakos, J. A. Fernandez-Baca, T. Qi, and G. Cao, Physical
Review B 87 (2013).
[17] O. B. Korneta, T. Qi, S. Chikara, S. Parkin, L. E. De Long, P. Schlottmann, and G. Cao,
Physical Review B 82 (2010).

73
[18] S. W. Lovesey, D. D. Khalyavin, P. Manuel, L. C. Chapon, G. Cao, and T. F. Qi, Journal
of Physics-Condensed Matter 24 (2012).
[19] B. J. Kim, H. Ohsumi, T. Komesu, S. Sakai, T. Morita, H. Takagi, and T. Arima, Science
323, 1329 (2009).
[20] L. C. Chapon and S. W. Lovesey, Journal of Physics-Condensed Matter 23 (2011).

74
Chapter 5: Electronic and Magnetic Phase Behavior of Sr3Ir2O7
(In this Chapter I am going to present our study on the electronic/spin behavior of
bilayer parent compound Sr3Ir2O7.Most of the work described in this chapter is
published in an article by Dhital et al “Spin ordering and electronic texture in the
bilayer iridate Sr3Ir2O7” PHYSICAL REVIEW B86, 100401(R) (2012). After or in
parallel to this work there are similar/different works exploring the electronic
behavior of this compound which I already discussed in Chapter 2 (Introduction)).
5.1 Motivation
Recently, there has been considerable interest in studying the phase behavior
of correlated 5d-electron transition metal oxides due to the potential of realizing
electronic phenomena possible only when electron hopping, spin-orbit coupling, and
Coulomb interaction energy scales are almost equivalent [1--4].Of particular focus
has been members of the iridium oxide Ruddelsden-Popper (RP) [5] series
Srn+1IrnO3n+1, where an experimental picture of a spin-orbit induced Jeff = 1/2 Mott
insulating state has been proposed [6,7]. Upon increasing the dimensionality of the
iridate RP series to higher n, optical [2] and transport measurements [8,9] have shown
that the effective bandwidth increases and the system transitions from a quasi-two-
dimensional insulating state to a metallic phase in the three-dimensional limit.
Specifically, the reported optical gap in the n = 2 member Sr3Ir2O7 (Sr-327) shifts
considerably downward relative to the n = 1 Sr2IrO4 system into what should be a
weakly insulating phase [2],demonstrating that Sr-327 occupies a unique position in
the iridate RP phase diagram near the boundary of the metal to insulator phase
transition in the RP series. Given this framework, Sr3Ir2O7 exhibits a number of
anomalous features in its magnetic properties: Bulk magnetization measurements of
Sr-327 reveal a rich behavior possessing three distinct energy scales [9,10] and recent
muon spin rotation (μSR) measurements have revealed the presence of highly
disordered local spin behavior [11] both supporting the notion of multiple coexisting
75
or competing magnetic phases. With these existing situations, I am going to present
our study using neutron scattering, transport and magnetization techniques on this
bilayer compound.
5.2 Crystal Growth and Preliminary Characterization
Crystals were grown using flux techniques in platinum crucibles using IrO2
(99.98%, Alfa Aesar), SrCO3 (99.99%, Alfa Aesar), and anhydrous SrCl2 (99.5%,
Alfa Aesar) in a 2:3:15 molar ratio. Starting powders were sealed inside the crucible
with a Pt lid and further contained inside alumina crucibles to limit volatility.
Mixtures were heated to 13000C, slowly cooled to 850
0 C at a rate of 3.5 C/hr, and
then furnace cooled to room temperature. The resulting boule was etched with
deionized water and black Sr3Ir2O7 crystals with typical dimensions 2 mm x 2 mm x
0.1 mm were removed. The resulting Sr:Ir ratio was confirmed to be 3:2 via energy
dispersive spectroscopy (EDS) measurements, and a number of Sr-327 crystals were
also ground into a powder and checked via x-ray diffraction in Bruker D2 Phaser
system. No coexisting Sr2IrO4 phase was observed and the resulting pattern was
refined to the originally reported I4/mmm structure—we note, however, that, due to
the small scattering signal from oxygen, we are unable to distinguish between this and
the various reported orthorhombic symmetries. For the remainder of this thesis, we
will index the unit cell using the pseudo tetragonal unit cell with a = b = 5.50 A˚, c =
20.86 A˚ .Figure 5.2.1 shows a typical crystal and powder pattern for Sr3Ir2O7 refined
using FullProf software package [12].

76
Figure 5.2.1 (a) A single piece of Sr3Ir2O7 crystal (b) Powder pattern for Sr3Ir2O7
crystals grounded together obtained using Bruker X-ray diffractometer [13].
5.3 Resistivity of Sr3Ir2O7
Resistivity data for Sr3Ir2O7 was collected in a series of four-wire setups: (1)
Zero field resistance from 300 K to 12 K was collected with a Keithley 2182A
voltmeter, (2) data from 12 to 0.3 K was collected in a He3 absorption refrigerator
with an Keithley Model 617 electrometer, and (3) magnetoresistance data was
collected in a 9 T Quantum Design PPMS. Looking first at the results of our ab-plane
transport measurements under low (1 μA) current, Figure 5.3.1 (a) shows the zero
field resistivity as a function of temperature. The sample’s resistivity increases from
several mΩ cm at room temperature to beyond 10 MΩ cm below 20 K, and begins to
show saturation behavior below 2 K. There is no substantial interval of constant
activation energy, as illustrated by the overplot of ∂ lnρ/∂(1/T ) versus T in this same
panel. Instead, ∂ lnρ/∂(1/T ) shows two peaks suggestive of two phase transitions
coupling to charge carriers: the first near the known magnetic phase transition at TAF
= 280 K [9,13] and the second indicating a lower temperature phase formation at T∗ ≈
70 K.
In order to investigate further the transport properties of this lower
temperature, T* phase, the charge transport was characterized via a voltage driven I -
V sweep at 300 mK shown in Figure 5.3.1 (b). A pronounced nonlinearity appears,

77
where with increasing field strength the system switches from a linear, Ohmic regime
with near zero conductance into highly non-Ohmic field enhanced conductivity (FEC)
regime. To determine the temperature evolution of this FEC feature, a separate sample
was mounted and probed with 600 μs current pulses to minimize heating effects
[Figure 5.3.1 (c)]. While it is difficult to completely preclude all heating effects within
the rise and sample time of the pulse, these pulsed measurements show that the
nonlinear bend in the I -V curve persists and eventually vanishes below resolution at T
≈ 60 K. A separate (rough) check for discriminating the nonlinear conduction from
simple Joule heating can be performed by looking at the 30 K data in Figure 5.3.1 (c).
The Ohmic regime R (30 K) = 42 kΩ and the maximum pulsed current (2 mA) during
the 600 μs pulse delivers a maximum ∆Q = 10.1 × 10⁻⁵
J. While low temperature heat
capacity data are needed for Sr-327, as a lower estimate, the heat capacity of Sr2IrO4
at 30 K can be used (≈14 J/K) [14] giving a maximum ∆T = 5.5 K (for a 1.32 × 10⁻⁶
mol sample). In carrying out a similar analysis for each current value pulsed at 30 K
and assuming perfect thermal isolation, the measured Ohmic R(T ) can be used to
determine the lowest fields possible due to pure Joule heating as a function of the
pulsed current density. This limiting case is plotted as a dashed line in Figure 5.3.1
(c), demonstrating that the nonlinear feature at 30 K is intrinsic.
In looking at the magnetoresistance of the same sample plotted in the Figure
5.3.1 (d), the MR = [R(9 T) − R(0 T)]/R(0 T) ratio is negative and shows two minima
at T* ≈ 70 K and TAF = 280 K. The lower minimum appears approximately at the
temperature where the onset of FEC emerges and coincides with the low-T peak in
(1 )/
ln
T
. The origin of the negative magnetoresistance is likely the removal of spin
disorder scattering due to biased magnetic domain populations and the inflection
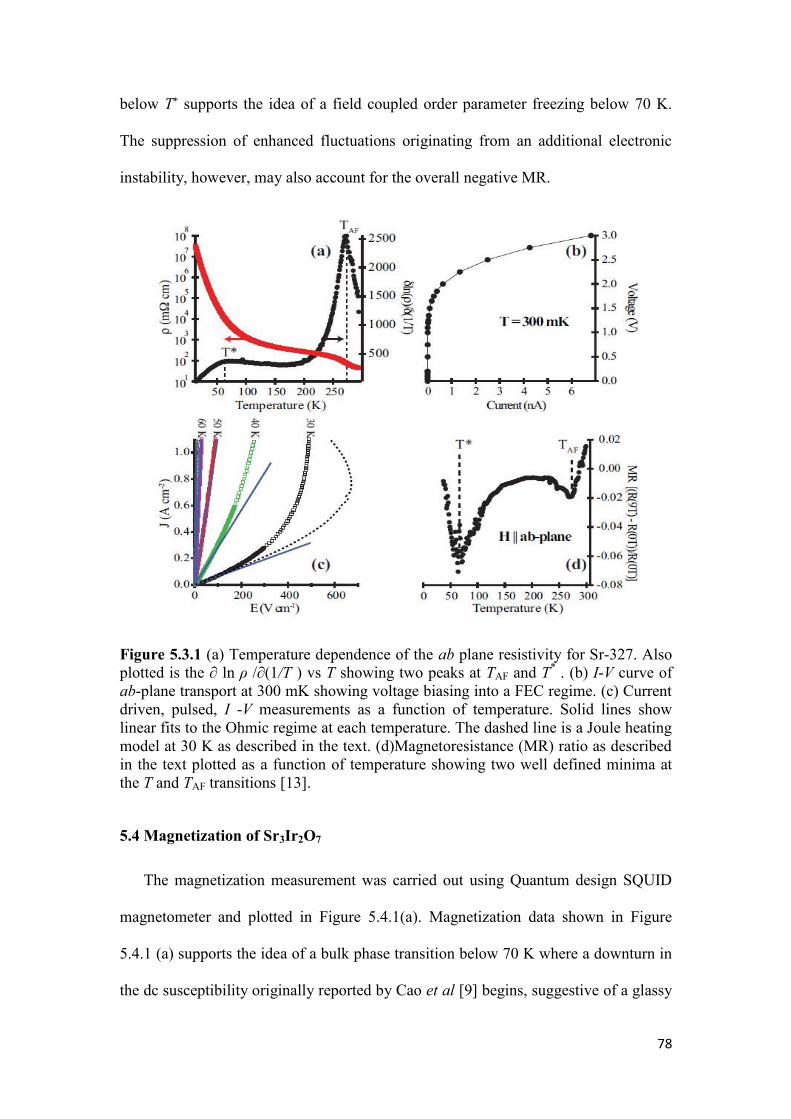
78
below T* supports the idea of a field coupled order parameter freezing below 70 K.
The suppression of enhanced fluctuations originating from an additional electronic
instability, however, may also account for the overall negative MR.
Figure 5.3.1 (a) Temperature dependence of the ab plane resistivity for Sr-327. Also
plotted is the ∂ ln ρ /∂(1/T ) vs T showing two peaks at TAF and T* . (b) I-V curve of
ab-plane transport at 300 mK showing voltage biasing into a FEC regime. (c) Current
driven, pulsed, I -V measurements as a function of temperature. Solid lines show
linear fits to the Ohmic regime at each temperature. The dashed line is a Joule heating
model at 30 K as described in the text. (d)Magnetoresistance (MR) ratio as described
in the text plotted as a function of temperature showing two well defined minima at
the T and TAF transitions [13].
5.4 Magnetization of Sr3Ir2O7
The magnetization measurement was carried out using Quantum design SQUID
magnetometer and plotted in Figure 5.4.1(a). Magnetization data shown in Figure
5.4.1 (a) supports the idea of a bulk phase transition below 70 K where a downturn in
the dc susceptibility originally reported by Cao et al [9] begins, suggestive of a glassy
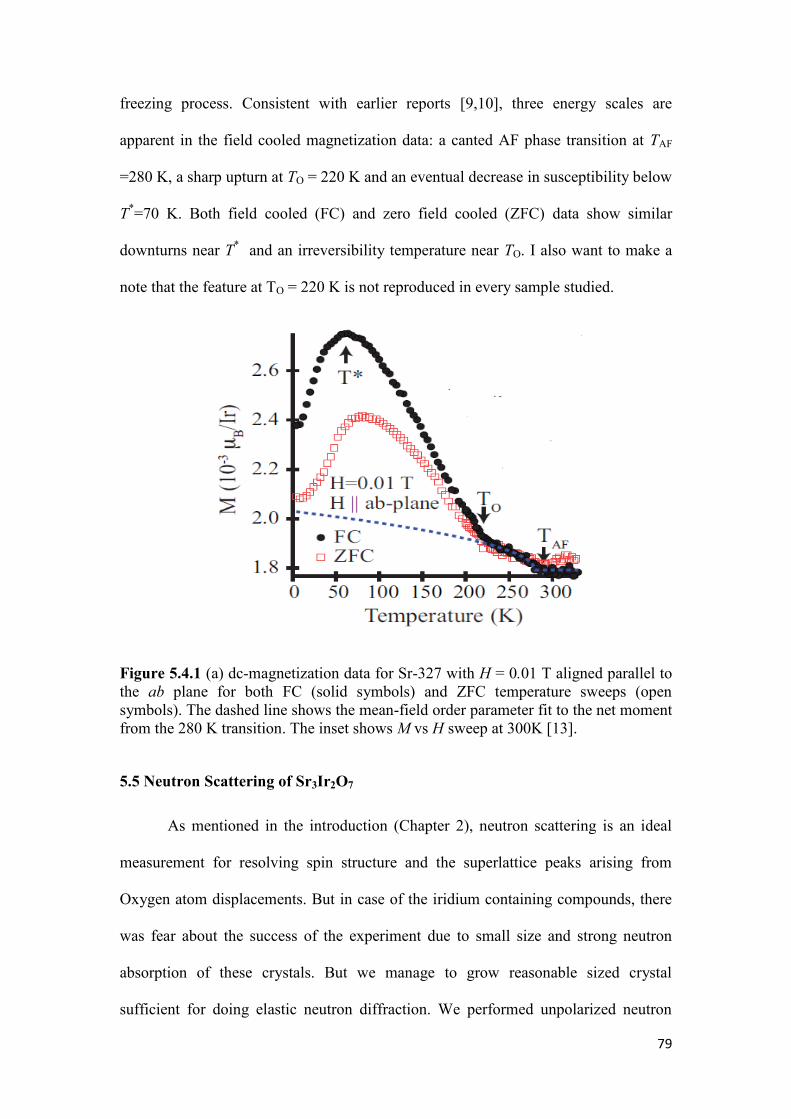
79
freezing process. Consistent with earlier reports [9,10], three energy scales are
apparent in the field cooled magnetization data: a canted AF phase transition at TAF
=280 K, a sharp upturn at TO = 220 K and an eventual decrease in susceptibility below
T*=70 K. Both field cooled (FC) and zero field cooled (ZFC) data show similar
downturns near T* and an irreversibility temperature near TO. I also want to make a
note that the feature at TO = 220 K is not reproduced in every sample studied.
Figure 5.4.1 (a) dc-magnetization data for Sr-327 with H = 0.01 T aligned parallel to
the ab plane for both FC (solid symbols) and ZFC temperature sweeps (open
symbols). The dashed line shows the mean-field order parameter fit to the net moment
from the 280 K transition. The inset shows M vs H sweep at 300K [13].
5.5 Neutron Scattering of Sr3Ir2O7
As mentioned in the introduction (Chapter 2), neutron scattering is an ideal
measurement for resolving spin structure and the superlattice peaks arising from
Oxygen atom displacements. But in case of the iridium containing compounds, there
was fear about the success of the experiment due to small size and strong neutron
absorption of these crystals. But we manage to grow reasonable sized crystal
sufficient for doing elastic neutron diffraction. We performed unpolarized neutron

80
diffraction measurements on a 7 mg single crystal Sr-327 sample with the results
plotted in Figure 5.5.1 and 5.5.2. As an starting point all three scattering planes:
[H,0,L], [H,K,0], and [H,H,L] were explored and magnetic reflections were observed
only at the (1,0,L) positions for L = 1,2,3,4,5,6,….The correlated order is three
dimensional with ξL =√2 ln(2) × 1/w = 147 ± 10 A˚ ,where w(˚A-1
) is the peak’s
Gaussian width [Figure 5.5.1(a)]. The appearance of both L = even and L = odd
reflections in a simple collinear picture of the spin structure is therefore consistent
with recent x-ray results resolving the presence of two magnetic domains [10]
attributable to in-plane structural twinning in an orthorhombic symmetry1. Looking at
the order parameters for both the L = 3 and L = 2 reflections in Figure 5.5.1 (f), the
magnetic intensities show that the L = 2 peak disappears at TAF while substantial
intensity remains at 280 K in the L = 3 reflection. Q scans plotted in Figure 5.5.1(b)
demonstrate this more explicitly. The peak remaining above 280 K is long-range
ordered with a minimum correlation length of 93 ± 18 A˚, comparable to the
correlation length observed at 10 K (97 ± 5 A˚). Due to the rather coarse collimations
used, both these values and those of all magnetic Bragg reflections are resolution
limited. At 300 K peaks remain at the (1, 0, L) L = 1, 3, 4 positions, all forbidden in
the reported structural space groups to date. This same crystal was then loaded into a
furnace and measured at higher temperatures, where, upon warming, the remnant
peaks continue to decrease in intensity as illustrated in Figure 5.5.1(d); however, they
notably remain present beyond 600 K. To confirm the presence of high temperature
peak we performed rocking scan at different temperatures in different instrument
which is plotted in Figure 5.5.1 (e). This verifies that the presence of superlattice peak
1 The same group, however, reported twin domains but with moments pointing along c
axis [15] in place of moment in ab plane which was described in reference [10]

81
at high temperature is reproducible. The persistent temperature dependence of these
peaks beyond 300 K, and the absence of peaks at higher order L and H gave us a
reason to doubt the possibility of its magnetic origin with additional order parameter.
However, with polarized neutron diffraction we ruled out the possibility of high
temperature magnetic phase which I will discuss in subsequent section.

82
Figure 5.5.1 (a) Radial Q-scans at 100 K and 315 K through the (a) Q= (1, 0, 2) (b)
and Q= (1, 0, 3) reflections. Solid lines are Gaussian fits to the data. (c) L-scans
across the (1, 0, 3) point showing 3D AF at 100 K and 315 K. (d) Q-scans showing
the temperature dependence of the (1, 0, 3) peak above 300 K (e) Rocking scans on a
separate crystal showing the temperature dependence of the (1,0,3) peak above 300 K.
(f) Temperature dependence of the peak intensities at (1,0,3) and (1,0,2) magnetic
reflections. The solid line is a power law fit to the (1, 0, 2) order parameter [13].
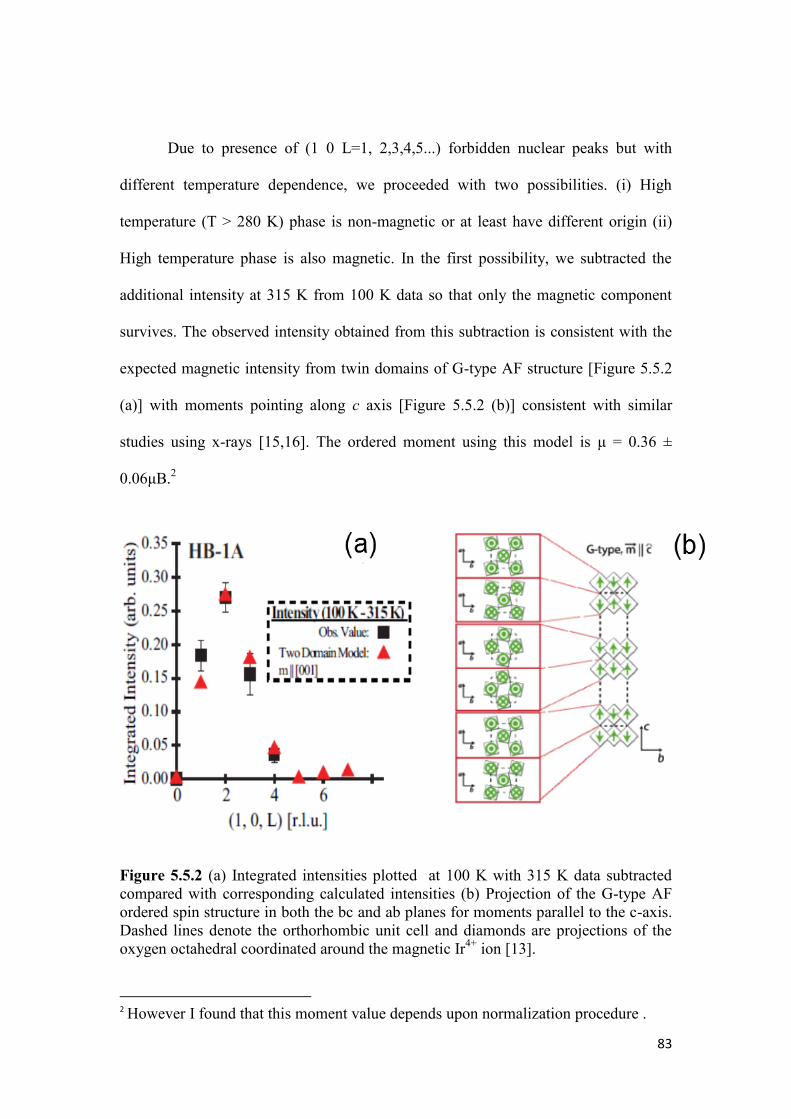
83
Due to presence of (1 0 L=1, 2,3,4,5...) forbidden nuclear peaks but with
different temperature dependence, we proceeded with two possibilities. (i) High
temperature (T > 280 K) phase is non-magnetic or at least have different origin (ii)
High temperature phase is also magnetic. In the first possibility, we subtracted the
additional intensity at 315 K from 100 K data so that only the magnetic component
survives. The observed intensity obtained from this subtraction is consistent with the
expected magnetic intensity from twin domains of G-type AF structure [Figure 5.5.2
(a)] with moments pointing along c axis [Figure 5.5.2 (b)] consistent with similar
studies using x-rays [15,16]. The ordered moment using this model is μ = 0.36 ±
0.06μB.2
Figure 5.5.2 (a) Integrated intensities plotted at 100 K with 315 K data subtracted
compared with corresponding calculated intensities (b) Projection of the G-type AF
ordered spin structure in both the bc and ab planes for moments parallel to the c-axis.
Dashed lines denote the orthorhombic unit cell and diamonds are projections of the
oxygen octahedral coordinated around the magnetic Ir4+
ion [13].
2 However I found that this moment value depends upon normalization procedure .

84
If we consider the second possibility and use the total integrated intensity at 100 K
then the integrated intensity variation looks like in Figure 5.5.3 (b) (black square).If
we again assume a twinned G-type aligned spin structure now with two magnetic
domains, then a second domain added to the previous model [Figure 5.5.2 (b)] with
moments directed along the (1, 0, 0) [Figure 5.5.3 (a)] axis roughly fits the data
[Figure 5.5.3 (b)].
Figure 5.5.3 (a) Projection of the G-type AF ordered spin structure in both the bc and
ab planes for moments parallel to the a-axis. Dashed lines denote the orthorhombic
unit cell and diamonds are projections of the oxygen octahedral coordinated around
the magnetic Ir4+
ion (b) the total integrated intensity at 100 K and compared with
corresponding model [13].
However, as I mentioned before, we were not fully convinced with the
magnetic behavior persisting above nominal TAF, so we performed polarized neutron
diffraction measurements with the results plotted in Figure 5.5.4. Radial scans through
Q= (1,0,3) show that the (1, 0, L)-type superlattice reflections appear only in the non-
spin-flip channel with the neutron guide field applied parallel to Q. This demonstrates
the structural origin of the superlattice peak and mandates a space group symmetry
lower than Bbcb. The high temperature (1, 0, L)-type peaks argue for oxygen
octahedral tilting as well as in-plane rotation in this system. Such a tilt necessarily
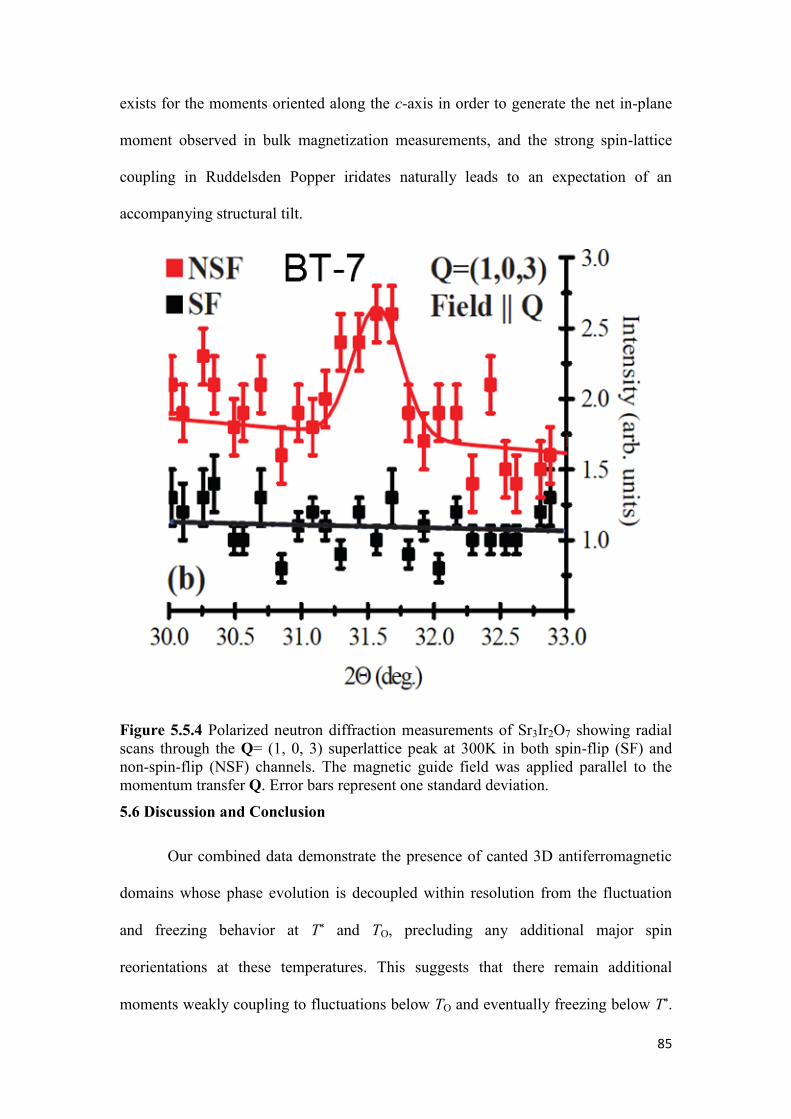
85
exists for the moments oriented along the c-axis in order to generate the net in-plane
moment observed in bulk magnetization measurements, and the strong spin-lattice
coupling in Ruddelsden Popper iridates naturally leads to an expectation of an
accompanying structural tilt.
Figure 5.5.4 Polarized neutron diffraction measurements of Sr3Ir2O7 showing radial
scans through the Q= (1, 0, 3) superlattice peak at 300K in both spin-flip (SF) and
non-spin-flip (NSF) channels. The magnetic guide field was applied parallel to the
momentum transfer Q. Error bars represent one standard deviation.
5.6 Discussion and Conclusion
Our combined data demonstrate the presence of canted 3D antiferromagnetic
domains whose phase evolution is decoupled within resolution from the fluctuation
and freezing behavior at T* and TO, precluding any additional major spin
reorientations at these temperatures. This suggests that there remain additional
moments weakly coupling to fluctuations below TO and eventually freezing below T*.
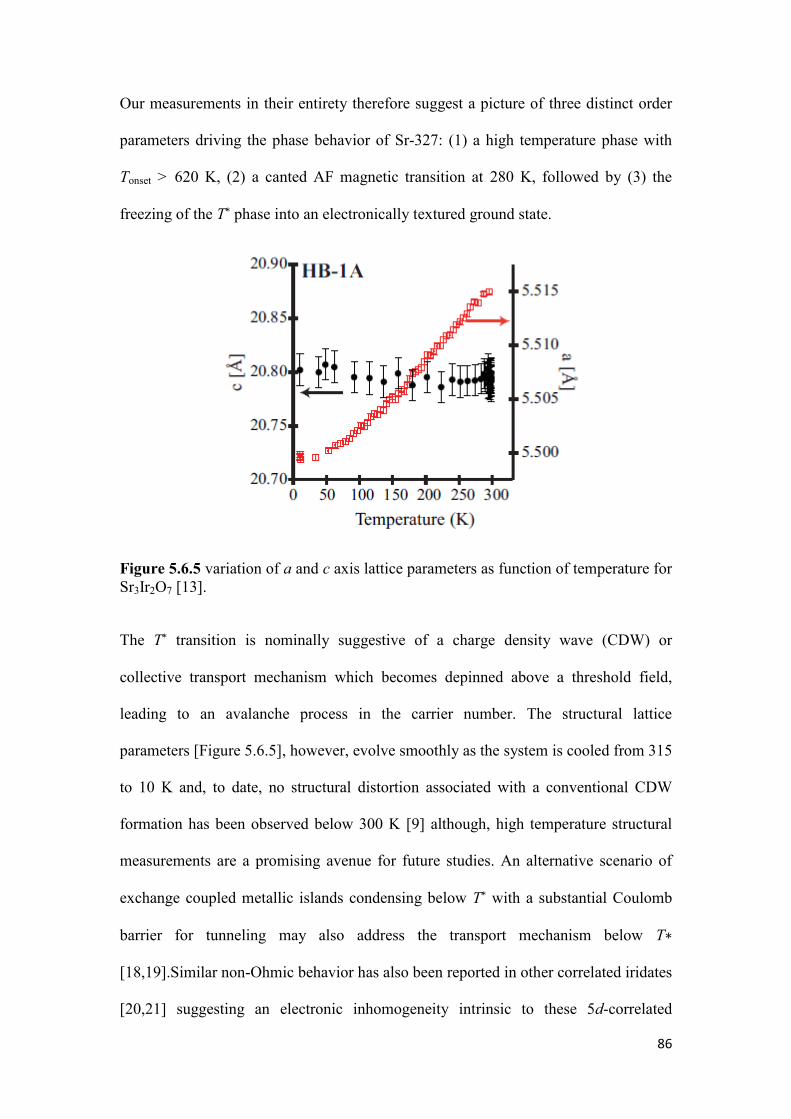
86
Our measurements in their entirety therefore suggest a picture of three distinct order
parameters driving the phase behavior of Sr-327: (1) a high temperature phase with
Tonset > 620 K, (2) a canted AF magnetic transition at 280 K, followed by (3) the
freezing of the T* phase into an electronically textured ground state.
Figure 5.6.5 variation of a and c axis lattice parameters as function of temperature for
Sr3Ir2O7 [13].
The T* transition is nominally suggestive of a charge density wave (CDW) or
collective transport mechanism which becomes depinned above a threshold field,
leading to an avalanche process in the carrier number. The structural lattice
parameters [Figure 5.6.5], however, evolve smoothly as the system is cooled from 315
to 10 K and, to date, no structural distortion associated with a conventional CDW
formation has been observed below 300 K [9] although, high temperature structural
measurements are a promising avenue for future studies. An alternative scenario of
exchange coupled metallic islands condensing below T* with a substantial Coulomb
barrier for tunneling may also address the transport mechanism below T∗
[18,19].Similar non-Ohmic behavior has also been reported in other correlated iridates
[20,21] suggesting an electronic inhomogeneity intrinsic to these 5d-correlated
87
materials. Curiously x-ray measurements on a Sr-327 sample with a qualitatively
similar bulk spin susceptibility have reported the onset of AF order at TO [22].This
resonant x-ray scattering (RXS) study speculated about the presence of short-range
order setting in at TAF and diverging at TO as the reason for the discrepancy [10],
however, our measurements reveal no appreciable change in the correlation length
upon cooling through TO. Given that more recent RXS measurements show the onset
of magnetism at the expected TAF = 285 K, variation in sample quality is likely the
cause for the variance reported between these two RXS studies.
To summarize, our studies have illustrated a complex electronic ground state
in the Sr3Ir2O7 system with multiple electronic order parameters. Although our
unpolarized experiment was not conclusive, the polarized experiment performed later
indicated that the origin of high temperature peak above nominal TAF is nonmagnetic.
This indicates that the two domain model with G-type structure with moment along c
axis is the correct model rather than four domain models. But still there may be some
canting of that moment due to rotation of octahedra. Below TAF =280 K, the system
exhibits multiple magnetic domains or alternatively non-collinear spin order in its
ground state. The spin order appears decoupled from two additional energy scales
appearing in transport and bulk susceptibility measurements, suggesting a fluctuating
charge/orbital state that freezes into an inhomogeneous electronic ground state where
tunneling and sliding effects manifest under increasing electric field strength.
Chapter 5 References
[1] F. Wang and T. Senthil, Phys. Rev. Lett. 106, 136402 (2011).
[2] S. Moon, H. Jin, K. W. Kim, W. Choi, Y. Lee, J. Yu, G. Cao, A. Sumi, H.
Funakubo, and C. Bernhard, Phys. Rev. Lett. 101, 226402 (2008).
88
[3] D. Pesin and L. Balents, Nature Physics 6, 376 (2010).
[4] B. Yang and Y. B. Kim, Physical Review B 82, 085111 (2010).
[5] S. Ruddlesden and P. Popper, Acta Crystallogr. 11, 54 (1958).
[6] B. Kim, H. Ohsumi, T. Komesu, S. Sakai, T. Morita, H. Takagi, and T. Arima,
Science 323, 1329 (2009).
[7] B. Kim, H. Jin, S. Moon, J. Kim, B. Park, C. Leem, J. Yu, T. Noh, C. Kim, and S.
Oh, Phys. Rev. Lett. 101, 076402 (2008).
[8] J. Longo, J. Kafalas, and R. Arnott, Journal of Solid State Chemistry 3, 174
(1971).
[9] G. Cao, Y. Xin, C. Alexander, J. Crow, P. Schlottmann, M. Crawford, R. Harlow,
and W. Marshall, Physical Review B 66, 214412 (2002).
[10] S. Boseggia, R. Springell, H. Walker, A. Boothroyd, D. Prabhakaran, D.
Wermeille, L. Bouchenoire, S. Collins, and D. McMorrow, Physical Review B 85,
184432 (2012).
[11] I. Franke, P. Baker, S. Blundell, T. Lancaster, W. Hayes, F. Pratt, and G. Cao,
Physical Review B 83, 094416 (2011).
[12] J. Rodriguez-Carvajal, in satellite meeting on powder diffraction of the XV
congress of the IUCr (Toulouse, France:[sn], 1990).
[13] C. Dhital, S. Khadka, Z. Yamani, et al, Physical Review B 86 (2012).
89
[14] N. Kini, A. Strydom, H. Jeevan, C. Geibel, and S. Ramakrishnan, Journal of
Physics: Condensed Matter 18, 8205 (2006).
[15] S. Boseggia, R. Springell, H. C. Walker, A. T. Boothroyd, D. Prabhakaran, S. P.
Collins, and D. F. McMorrow, Journal of Physics-Condensed Matter 24 (2012).
[16] J. W. Kim, Y. Choi, J. Kim, J. F. Mitchell, G. Jackeli, M. Daghofer, J. van den
Brink, G. Khaliullin, and B. J. Kim, Phys. Rev. Lett. 109 (2012).
[17] C. Dhital, T. Hogan, Z. Yamani, C. de la Cruz, X. Chen, S. Khadka, Z. Ren, and
S. D. Wilson, Physical Review B 87, 144405 (2013).
[18] D. Arovas, F. Guinea, C. Herrero, and P. S. Jose, arXiv preprint cond-
mat/0211686 (2002).
[19] P. San-Jose, C. P. Herrero, F. Guinea, and D. P. Arovas, The European Physical
Journal B-Condensed Matter and Complex Systems 54, 309 (2006).
[20] G. Cao, J. Bolivar, S. McCall, J. Crow, and R. Guertin, Physical Review B 57,
R11039 (1998).
[21] G. Cao, J. Crow, R. Guertin, P. Henning, C. Homes, M. Strongin, D. Basov, and
E. Lochner, Solid State Commun. 113, 657 (2000).
[22] G. Cao, Y. Xin, C. S. Alexander, J. E. Crow, P. Schlottmann, M. K. Crawford, R.
L. Harlow, and W. Marshall, Physical Review B 66 (2002).
Chapter 6: Electronic/magnetic Phase Diagram of Sr3(Ir1-x Rux)2O7
90
(In this chapter I am going to present our comprehensive study on the
electronic/magnetic phase behavior of doped system Sr3 (Ir1-xRux) 2O7.Most of the
work presented in this chapter is published in an article by Dhital et.al “Carrier
localization and electronic phase separation in a doped spin-orbit driven Mott phase in
Sr3(Ir1-xRux)2O7” Nature Communications 5, 3377 (2014).
6.1 Motivation
Iridium4+
ions with a half-filled 5d shell in a cubic octahedral oxygen
coordination occupy a unique region in relative energy scales: one where a model of
crystal field splitting combined with strong spin-orbit coupling (SOC) breaks the five-
fold degeneracy of electronic states into fully occupied Jeff=3/2 and half-filled Jeff=1/2
bands [1,2]. The resulting bandwidth-narrowed Jeff=1/2 states allow the relatively
modest U (~1.5-2 eV) [3] inherent to these 5d-transition metal elements to split the
band and generate a charge-gap. A SOC-assisted Mott phase results, allowing an
unexpected manifestation of correlation-driven physics in materials with extended 5d-
electron wave functions. Doping this spin-orbit Mott phase has since generated
predictions of stabilizing states analogous to those found in doped strongly correlated
3d-electron Mott insulators such as the high temperature cuprate superconductors [4].
To date however, the role of Coulomb interactions in the doped Jeff=1/2 Mott phase
remains contentious with no direct observations of correlated electronic phase
behavior. Two prototypical Jeff=1/2 Mott materials are the n=1 and n=2 members of
the iridate Ruddelsden-Popper series Srn+1IrnO3n+1 [5,6]. Here the bilayer system
Sr3Ir2O7 (Sr-327) possesses a low temperature charge-gap of Eg=130 meV [7]
roughly reduced by a factor of four from the gap of its single layer cousin Sr2IrO4
[8]. This reduced gap renders the Sr-327 system a fortuitous starting point for
perturbing the Jeff=1/2 Mott phase and exploring carrier-induced electronic phase
behavior as the system is driven toward the metallic regime. In this chapter we
describe the electronic phase behavior of Sr-327 as it is driven from a Jeff=1/2 Mott
91
insulator into the metallic regime via hole-doping in an effort to understand the role
that electron-electron correlations play once free charge carriers are introduced.
6.2 Crystal Growth and Preliminary Characterization
The single crystals of Sr3(Ir1-xRux)2O7 were grown by conventional flux
methods similar to earlier reports [1] using a SrCl2 flux. Crystals were grown in
platinum crucibles using IrO2 (99.98%, Alfa Aesar), RuO2 (99.98%, Alfa Aesar),
SrCO3 (99.99%, Alfa Aesar), and anhydrous SrCl2 (99.5%, Alfa Aesar) in a 2:3:15
molar ratio. Starting powders were partially sealed inside the crucible with a Pt lid
and further contained inside alumina crucibles. Mixtures were heated up to 1380 °C,
cooled to 850 °C at a rate of 3.5 °C/hr, and then furnace cooled to room temperature.
The resulting boule was etched with deionized water and shiny, black Sr3(Ir1-xRux)2O7
crystals with typical dimensions 2 mm x 2 mm x 0.1 mm were removed. Energy
Dispersive Spectroscopy (EDS) measurements were performed on numerous samples
across different regions of samples from each growth batch, and measurements were
also collected across different length scales to verify chemical homogeneity. Multiple
crystals were tested from every batch, and from point to point on a given sample. We
were able to resolve a Ru distribution homogenous within a central value +/- 1% (2%
spread). The central value of Ru-concentrations between crystals from a single
growth batch would vary no more than +/- 2% from a central value (4% spread). The
same crystals measured via transport and magnetization measurements (only the
x=0.20 and x=0.15 samples were not, although crystals from the same batch were)
were used for the neutron diffraction study. Single crystals from a single batch of each
concentration were ground into a powder and measured via x-ray powder diffraction
within a Bruker D2 Phaser diffractometer. Lattice parameters were refined within the
I4/mmm space group using the FullProf Rietveld refinement program [9]. Within our
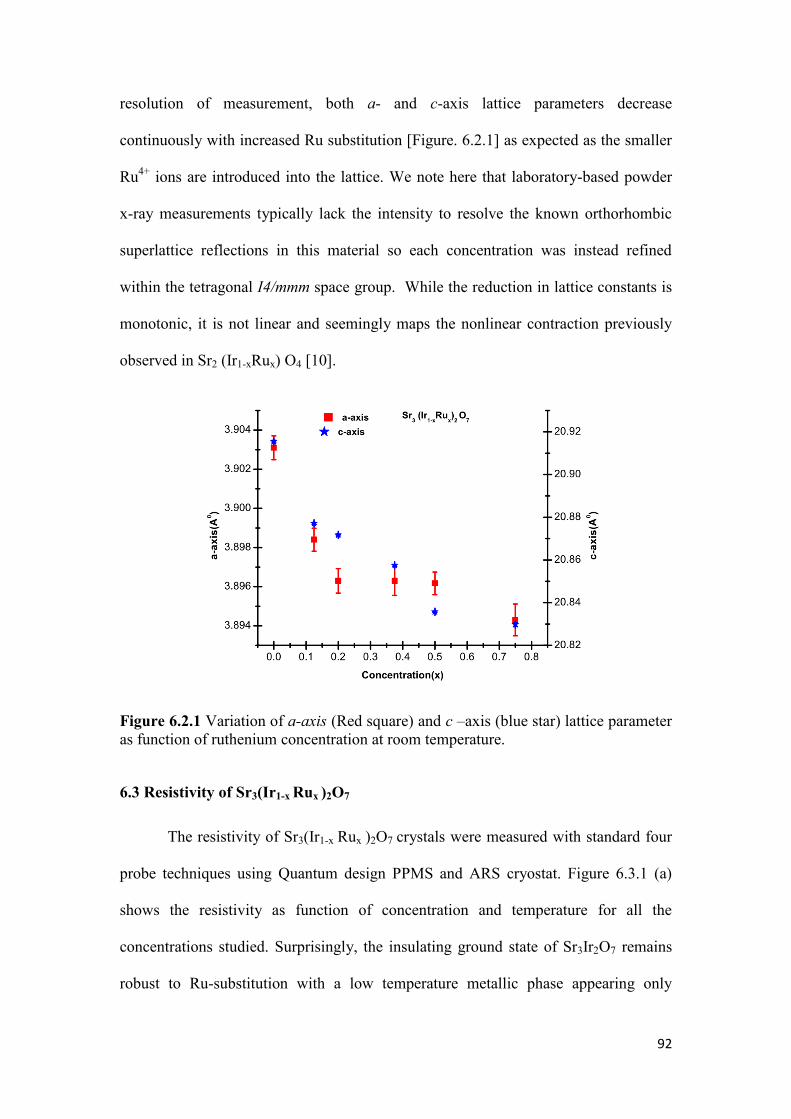
92
resolution of measurement, both a- and c-axis lattice parameters decrease
continuously with increased Ru substitution [Figure. 6.2.1] as expected as the smaller
Ru4+
ions are introduced into the lattice. We note here that laboratory-based powder
x-ray measurements typically lack the intensity to resolve the known orthorhombic
superlattice reflections in this material so each concentration was instead refined
within the tetragonal I4/mmm space group. While the reduction in lattice constants is
monotonic, it is not linear and seemingly maps the nonlinear contraction previously
observed in Sr2 (Ir1-xRux) O4 [10].
Figure 6.2.1 Variation of a-axis (Red square) and c –axis (blue star) lattice parameter
as function of ruthenium concentration at room temperature.
6.3 Resistivity of Sr3(Ir1-x Rux )2O7
The resistivity of Sr3(Ir1-x Rux )2O7 crystals were measured with standard four
probe techniques using Quantum design PPMS and ARS cryostat. Figure 6.3.1 (a)
shows the resistivity as function of concentration and temperature for all the
concentrations studied. Surprisingly, the insulating ground state of Sr3Ir2O7 remains
robust to Ru-substitution with a low temperature metallic phase appearing only

93
beyond the critical concentration of x=0.33.Concentrations near the phase boundary
show a thermally-driven MIT as illustrated in the inset of Figure 6.3.1(a) for x=0.33
with TMIT=135 K. As one initial window into the corresponding evolution of the
magnetic order, the high temperature inflection in ρ(T) in the x=0 parent compound is
known to identify the onset of canted AF order at TAF = 280 K. This feature in ρ(T) is
gradually suppressed to lower temperatures upon Ru-doping, where the anomaly
vanishes in the metallic regime suggesting either that the spin-charge coupling is
substantially weakened in the metallic regime or that the AF order itself is
substantially suppressed. We also tracked the thermally driven MIT for samples with
0.17 ≤x ≤ 0.35. Figure 6.3.2 (a,b,c,d) show the thermally driven MIT for
x=0.35,0.32,0.30 and 0.17 respectively.
Figure 6.3.1 (a) Resistivity plotted as a function of temperature for Ru concentrations
spanning the MIT. Inset shows thermally driven transition at TMIT = 135 K for x=0.33.
(b) 4 K magnetoresistance plotted as a function of applied field for Ru concentrations
spanning the MIT.
Supporting the notion of suppressed magnetism, low temperature magnetoresistance
(MR) data with the magnetic field applied perpendicular to the ab-plane are plotted in
Figure. 6.3.1(b). The negative magnetoresistance previously reported in the parent
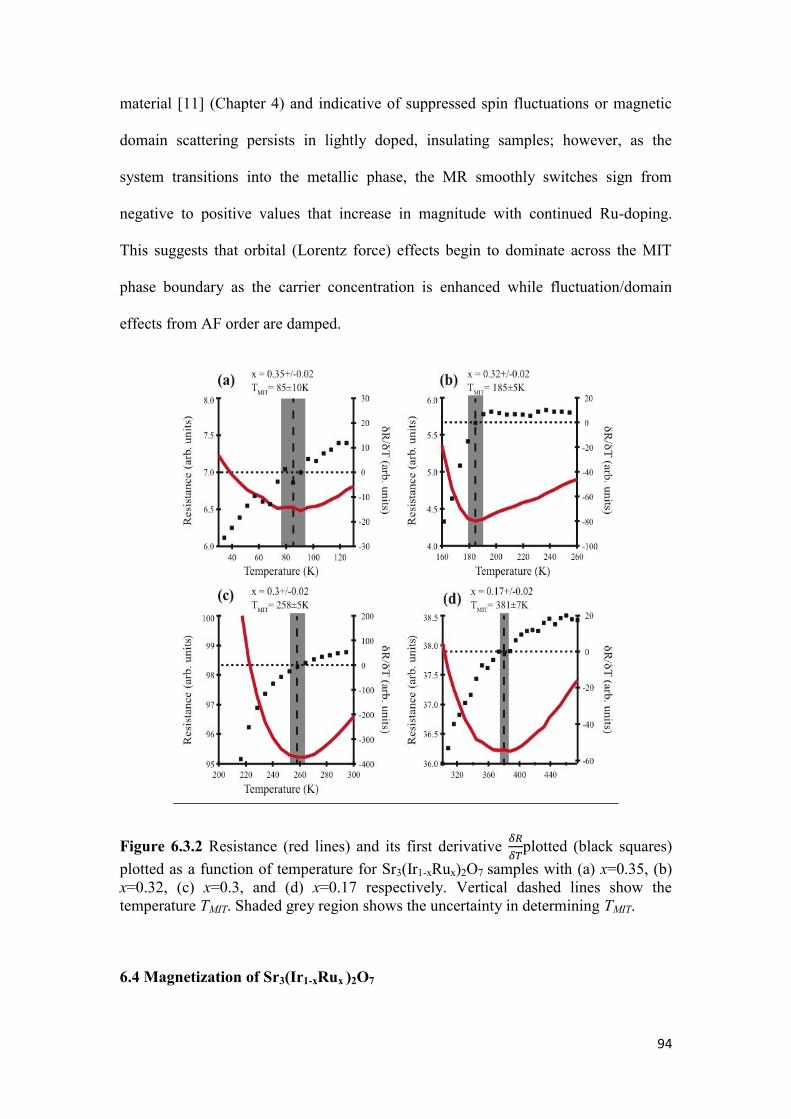
94
material [11] (Chapter 4) and indicative of suppressed spin fluctuations or magnetic
domain scattering persists in lightly doped, insulating samples; however, as the
system transitions into the metallic phase, the MR smoothly switches sign from
negative to positive values that increase in magnitude with continued Ru-doping.
This suggests that orbital (Lorentz force) effects begin to dominate across the MIT
phase boundary as the carrier concentration is enhanced while fluctuation/domain
effects from AF order are damped.
Figure 6.3.2 Resistance (red lines) and its first derivative
plotted (black squares)
plotted as a function of temperature for Sr3(Ir1-xRux)2O7 samples with (a) x=0.35, (b)
x=0.32, (c) x=0.3, and (d) x=0.17 respectively. Vertical dashed lines show the
temperature TMIT. Shaded grey region shows the uncertainty in determining TMIT.
6.4 Magnetization of Sr3(Ir1-xRux )2O7
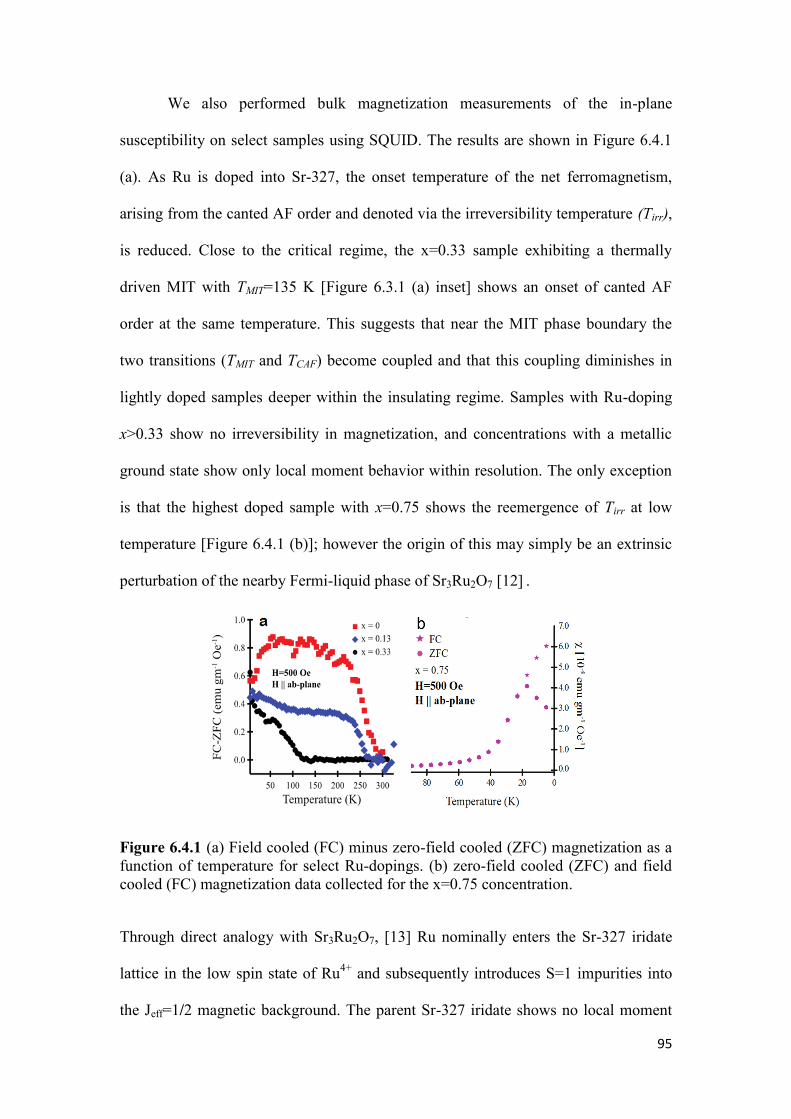
95
We also performed bulk magnetization measurements of the in-plane
susceptibility on select samples using SQUID. The results are shown in Figure 6.4.1
(a). As Ru is doped into Sr-327, the onset temperature of the net ferromagnetism,
arising from the canted AF order and denoted via the irreversibility temperature (Tirr),
is reduced. Close to the critical regime, the x=0.33 sample exhibiting a thermally
driven MIT with TMIT=135 K [Figure 6.3.1 (a) inset] shows an onset of canted AF
order at the same temperature. This suggests that near the MIT phase boundary the
two transitions (TMIT and TCAF) become coupled and that this coupling diminishes in
lightly doped samples deeper within the insulating regime. Samples with Ru-doping
x>0.33 show no irreversibility in magnetization, and concentrations with a metallic
ground state show only local moment behavior within resolution. The only exception
is that the highest doped sample with x=0.75 shows the reemergence of Tirr at low
temperature [Figure 6.4.1 (b)]; however the origin of this may simply be an extrinsic
perturbation of the nearby Fermi-liquid phase of Sr3Ru2O7 [12] .
Figure 6.4.1 (a) Field cooled (FC) minus zero-field cooled (ZFC) magnetization as a
function of temperature for select Ru-dopings. (b) zero-field cooled (ZFC) and field
cooled (FC) magnetization data collected for the x=0.75 concentration.
Through direct analogy with Sr3Ru2O7, [13] Ru nominally enters the Sr-327 iridate
lattice in the low spin state of Ru4+
and subsequently introduces S=1 impurities into
the Jeff=1/2 magnetic background. The parent Sr-327 iridate shows no local moment
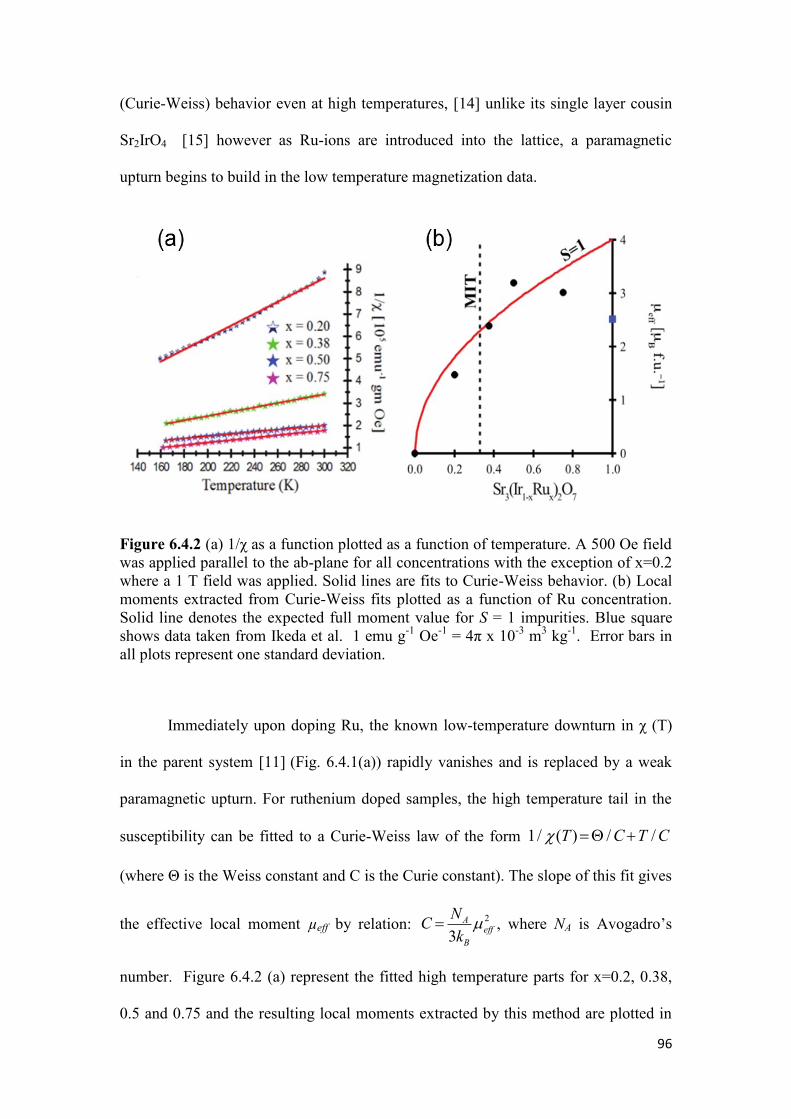
96
(Curie-Weiss) behavior even at high temperatures, [14] unlike its single layer cousin
Sr2IrO4 [15] however as Ru-ions are introduced into the lattice, a paramagnetic
upturn begins to build in the low temperature magnetization data.
Figure 6.4.2 (a) 1/χ as a function plotted as a function of temperature. A 500 Oe field
was applied parallel to the ab-plane for all concentrations with the exception of x=0.2
where a 1 T field was applied. Solid lines are fits to Curie-Weiss behavior. (b) Local
moments extracted from Curie-Weiss fits plotted as a function of Ru concentration.
Solid line denotes the expected full moment value for S = 1 impurities. Blue square
shows data taken from Ikeda et al. 1 emu g-1
Oe-1
= 4π x 10-3
m3 kg
-1. Error bars in
all plots represent one standard deviation.
Immediately upon doping Ru, the known low-temperature downturn in χ (T)
in the parent system [11] (Fig. 6.4.1(a)) rapidly vanishes and is replaced by a weak
paramagnetic upturn. For ruthenium doped samples, the high temperature tail in the
susceptibility can be fitted to a Curie-Weiss law of the form
(where Θ is the Weiss constant and C is the Curie constant). The slope of this fit gives
the effective local moment µeff by relation:
, where NA is Avogadro’s
number. Figure 6.4.2 (a) represent the fitted high temperature parts for x=0.2, 0.38,
0.5 and 0.75 and the resulting local moments extracted by this method are plotted in
1/ c(T)=Q /C+T /C
C =NA
3kBmeff
2
97
Figure 6.4.2(b). For low dopant levels, the effective local moments extracted from
each concentration track the expectation for contributions solely arising from local
S=1 impurities which build continuously across the MIT. This suggests Ru-ions
remain largely localized at low Ru-dopings within the insulating background of
Sr3Ir2O7 and that their survival unperturbed into the metallic regime demonstrates
robust correlation effects on either side of the MIT. For doping levels beyond x=0.5,
the local moments of the d-electron site ions are screened and smoothly connect to the
known local moment value of metallic Sr3Ru2O7 [13].
6.5 Neutron Scattering of Sr3(Ir1-xRux)2O7
We also performed neutron diffraction experiments on HB1-A triple axis
spectrometer at the High Flux Isotope Reactor (HFIR) at Oak Ridge National
Laboratory (ORNL) and at N-5 triple axis spectrometer at Canadian Neutron Beam
Center, Chalk River Canada. For HB1-A the incident beam was monochromated by
the (0, 0, 2) reflection of a double-bounce pyrolitic-graphite (PG) monochromator
with a fixed incident energy of Ei=14.65 meV, and a PG(002) analyzer crystal was
used on the scattered side. Two PG filters were placed before the sample, and
collimations of 40´-40´-40´-80´ were used before the monochromator, sample,
analyzer, and detector respectively. Experiments on N5 were performed with a PG
monochomator and Ei = 14.5 meV and PG analyzer with one PG filter placed after the
sample. Collimations of 30´-60´-33´-144´ were used before the monochromator,
sample, analyzer, and detector respectively. For all experiments, the crystals were
aligned in HOL scattering plane. The results of the neutron scattering experiments are
plotted in Figure 6.5.2. Figure 6.5.2(a) shows that, for insulating samples, the onset of
long-range AF order coincides with the Tirr determined via the magnetization curves
in Figure 6.4.1(a). Upon increased doping, however, the AF phase surprisingly
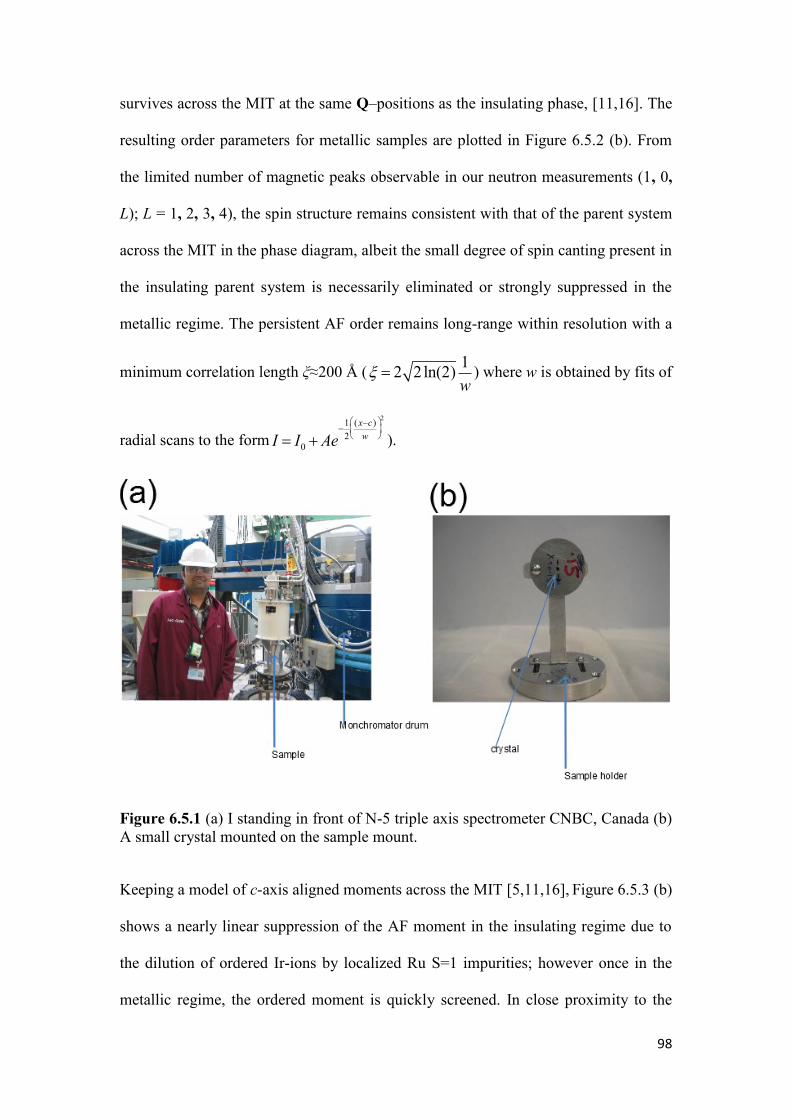
98
survives across the MIT at the same Q–positions as the insulating phase, [11,16]. The
resulting order parameters for metallic samples are plotted in Figure 6.5.2 (b). From
the limited number of magnetic peaks observable in our neutron measurements (1, 0,
L); L = 1, 2, 3, 4), the spin structure remains consistent with that of the parent system
across the MIT in the phase diagram, albeit the small degree of spin canting present in
the insulating parent system is necessarily eliminated or strongly suppressed in the
metallic regime. The persistent AF order remains long-range within resolution with a
minimum correlation length ξ≈200 Å ( ) where w is obtained by fits of
radial scans to the form ).
Figure 6.5.1 (a) I standing in front of N-5 triple axis spectrometer CNBC, Canada (b)
A small crystal mounted on the sample mount.
Keeping a model of c-axis aligned moments across the MIT [5,11,16], Figure 6.5.3 (b)
shows a nearly linear suppression of the AF moment in the insulating regime due to
the dilution of ordered Ir-ions by localized Ru S=1 impurities; however once in the
metallic regime, the ordered moment is quickly screened. In close proximity to the
x = 2 2ln(2)1
w
I = I0 + Ae-
1
2
(x-c)
w
æ
èç
ö
ø÷
2
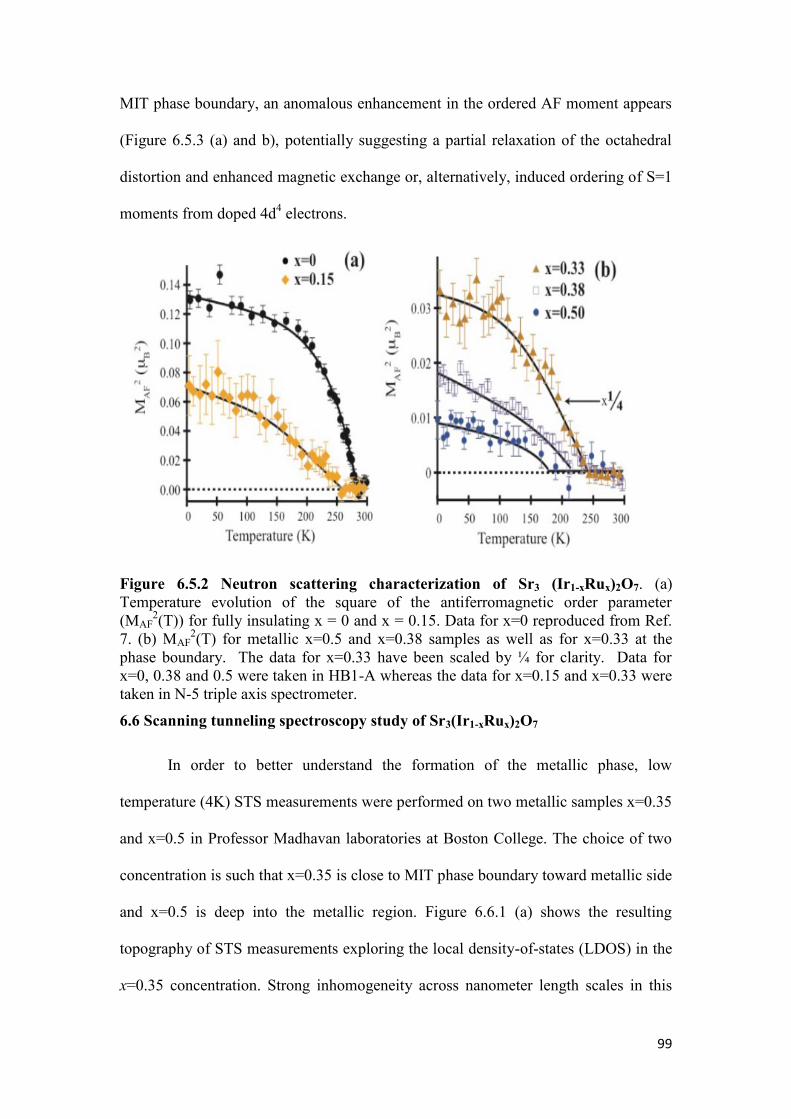
99
MIT phase boundary, an anomalous enhancement in the ordered AF moment appears
(Figure 6.5.3 (a) and b), potentially suggesting a partial relaxation of the octahedral
distortion and enhanced magnetic exchange or, alternatively, induced ordering of S=1
moments from doped 4d4 electrons.
Figure 6.5.2 Neutron scattering characterization of Sr3 (Ir1-xRux)2O7. (a)
Temperature evolution of the square of the antiferromagnetic order parameter
(MAF2(T)) for fully insulating x = 0 and x = 0.15. Data for x=0 reproduced from Ref.
7. (b) MAF2(T) for metallic x=0.5 and x=0.38 samples as well as for x=0.33 at the
phase boundary. The data for x=0.33 have been scaled by ¼ for clarity. Data for
x=0, 0.38 and 0.5 were taken in HB1-A whereas the data for x=0.15 and x=0.33 were
taken in N-5 triple axis spectrometer.
6.6 Scanning tunneling spectroscopy study of Sr3(Ir1-xRux)2O7
In order to better understand the formation of the metallic phase, low
temperature (4K) STS measurements were performed on two metallic samples x=0.35
and x=0.5 in Professor Madhavan laboratories at Boston College. The choice of two
concentration is such that x=0.35 is close to MIT phase boundary toward metallic side
and x=0.5 is deep into the metallic region. Figure 6.6.1 (a) shows the resulting
topography of STS measurements exploring the local density-of-states (LDOS) in the
x=0.35 concentration. Strong inhomogeneity across nanometer length scales in this
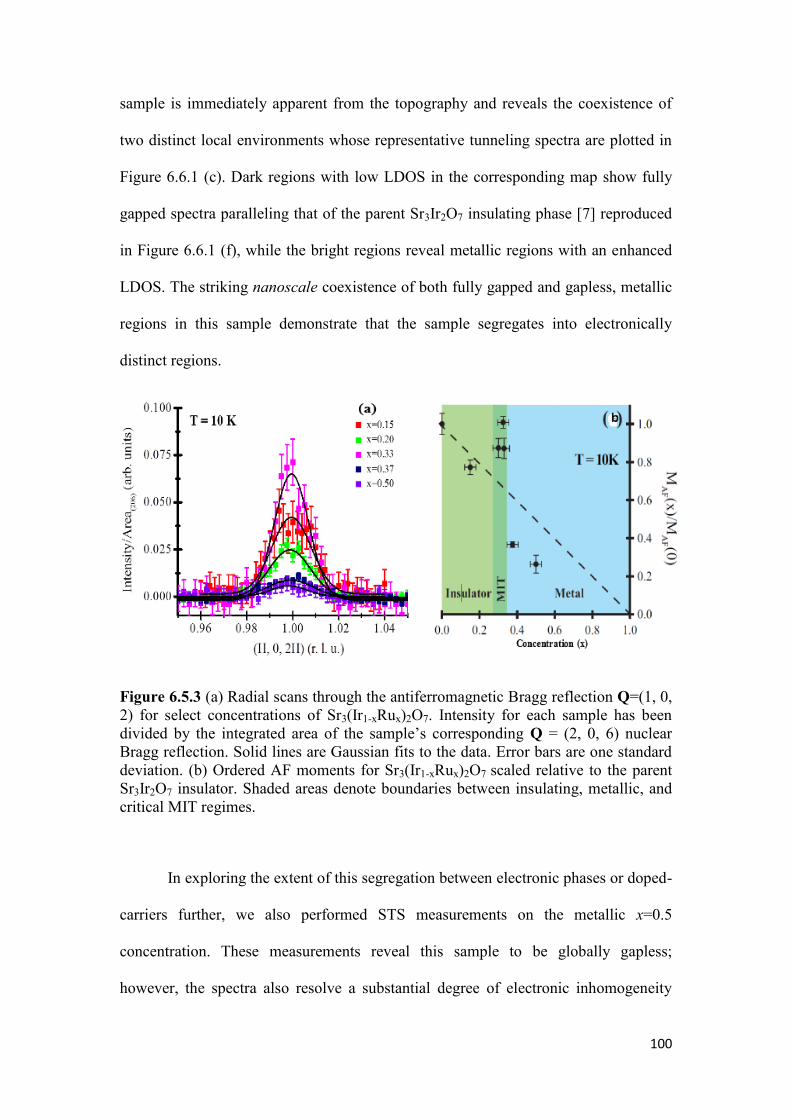
100
sample is immediately apparent from the topography and reveals the coexistence of
two distinct local environments whose representative tunneling spectra are plotted in
Figure 6.6.1 (c). Dark regions with low LDOS in the corresponding map show fully
gapped spectra paralleling that of the parent Sr3Ir2O7 insulating phase [7] reproduced
in Figure 6.6.1 (f), while the bright regions reveal metallic regions with an enhanced
LDOS. The striking nanoscale coexistence of both fully gapped and gapless, metallic
regions in this sample demonstrate that the sample segregates into electronically
distinct regions.
Figure 6.5.3 (a) Radial scans through the antiferromagnetic Bragg reflection Q=(1, 0,
2) for select concentrations of Sr3(Ir1-xRux)2O7. Intensity for each sample has been
divided by the integrated area of the sample’s corresponding Q = (2, 0, 6) nuclear
Bragg reflection. Solid lines are Gaussian fits to the data. Error bars are one standard
deviation. (b) Ordered AF moments for Sr3(Ir1-xRux)2O7 scaled relative to the parent
Sr3Ir2O7 insulator. Shaded areas denote boundaries between insulating, metallic, and
critical MIT regimes.
In exploring the extent of this segregation between electronic phases or doped-
carriers further, we also performed STS measurements on the metallic x=0.5
concentration. These measurements reveal this sample to be globally gapless;
however, the spectra also resolve a substantial degree of electronic inhomogeneity
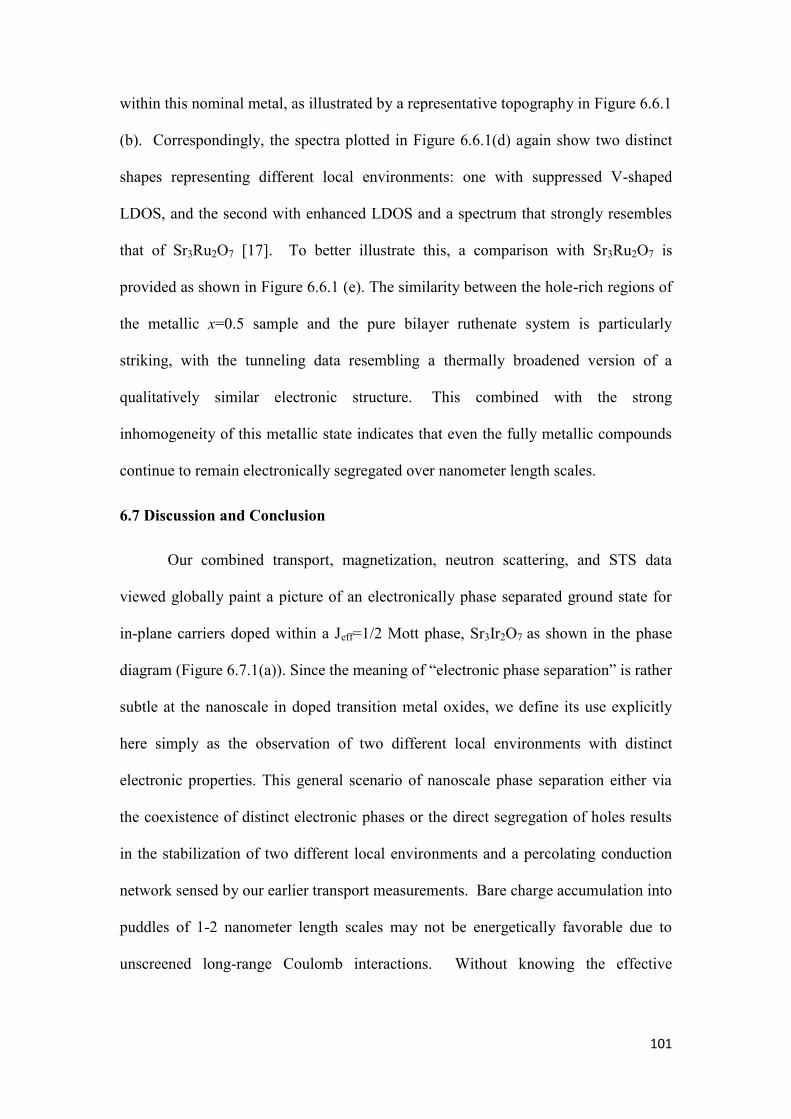
101
within this nominal metal, as illustrated by a representative topography in Figure 6.6.1
(b). Correspondingly, the spectra plotted in Figure 6.6.1(d) again show two distinct
shapes representing different local environments: one with suppressed V-shaped
LDOS, and the second with enhanced LDOS and a spectrum that strongly resembles
that of Sr3Ru2O7 [17]. To better illustrate this, a comparison with Sr3Ru2O7 is
provided as shown in Figure 6.6.1 (e). The similarity between the hole-rich regions of
the metallic x=0.5 sample and the pure bilayer ruthenate system is particularly
striking, with the tunneling data resembling a thermally broadened version of a
qualitatively similar electronic structure. This combined with the strong
inhomogeneity of this metallic state indicates that even the fully metallic compounds
continue to remain electronically segregated over nanometer length scales.
6.7 Discussion and Conclusion
Our combined transport, magnetization, neutron scattering, and STS data
viewed globally paint a picture of an electronically phase separated ground state for
in-plane carriers doped within a Jeff=1/2 Mott phase, Sr3Ir2O7 as shown in the phase
diagram (Figure 6.7.1(a)). Since the meaning of “electronic phase separation” is rather
subtle at the nanoscale in doped transition metal oxides, we define its use explicitly
here simply as the observation of two different local environments with distinct
electronic properties. This general scenario of nanoscale phase separation either via
the coexistence of distinct electronic phases or the direct segregation of holes results
in the stabilization of two different local environments and a percolating conduction
network sensed by our earlier transport measurements. Bare charge accumulation into
puddles of 1-2 nanometer length scales may not be energetically favorable due to
unscreened long-range Coulomb interactions. Without knowing the effective
102
screening length for the Coulomb interaction and the pinning potential for carriers, it
is hard to quantify what the length scale should be in Sr3Ir2O7.
Figure 6.6.1 (STM measurements of Sr3(Ir1-xRux)2O7. (a) Topography at a bias
voltage of -100 mV for the x=0.35 concentration near the MIT. (b) Topography at a
bias voltage of -100 mV for the x=0.5 metallic concentration. Intensity scales for
topography in panels (a) and (b) are unique to each plot and their relative variation is
shown via the color bar below the panels. White bars in each plot denote the length
scale of 3 nm. (c) Tunneling spectra collected in gapped and gapless electronically
phase separated regions denoted by blue and yellow curves collected at white and
black crosses in the corresponding map (d) Spectra for x=0.5 within two electronically
phase separated regions denoted by yellow and blue curves collected at black and
white crosses respectively in the topography. (e) High resolution tunneling data
collected within a bright region of the x=0.5 sample in panel (b). Dashed line is low
temperature STM data for Sr3Ru2O7 reproduced from Iwaya et.al [17]. (d) Spectra
collected for Sr3Ir2O7 in regions with enhanced LDOS due to oxygen defects (yellow
curves) and spectra collected away from defects showing the full charge gap (red
curves). We note here that the inhomogeneity observed within the parent insulating
system stems from relatively rare regions of oxygen defects and that the majority of
the surface showed fully gapped behavior (red curves), whereas for the x=0.35 and
x=0.5 systems the entirety of the samples showed strong electronic inhomogeneity
across nanometer length scales.
An alternative phase separation into electrically neutral, yet electronically
distinct, phases separated by a first order phase transition is instead a likely
mechanism; however we are unable to differentiate this from the pure carrier
103
segregation scenario. Regardless of which scenario dominates, the carriers within
metallic patches remain initially localized across ~1-2 nm length scales, and at the
critical concentration where transport measurements show a MIT (x~0.35), this leads
to the formation of metallic patches percolating within the fully gapped, spin-orbit
Mott insulating background. At Ru-substitution levels below x=0.35, the thermally
driven MIT is therefore the likely result of the expansion of these metallic puddles
due to thermal shifts in their free energy relative to insulating host phase. Phase
inhomogeneity continues deep into the metallic regime, where our STS data directly
demonstrate nm-scale texture in metallic Sr3IrRuO7 comprised of two distinct regions:
(1) Large LDOS regions with an electronic response mirroring the 4d4 electronic
spectrum of isostructural Sr3Ru2O7 [17] and (2) Regions with V-shaped spectra with
LDOS suppressed close to the Fermi energy. Since their valence states are rather far
from the Fermi-level, A-site doping in perovskite oxides is historically envisioned as
controlling the filling of d-bands on the B-sites by donating their valence electrons to
the entire system. The resulting doping mechanism gives rise to a rapid suppression of
the Mott phase such as in A-site doped Sr2IrO4 [18] and Sr3Ir2O7. Our B-site doping
in Sr-327, however, reveals that holes nominally added via Ru-substitution remain
localized within the IrO2-planes until nearly 35% of the Ir 5d ions have been replaced,
close to the classical 2D percolation threshold of 41% [19].Even beyond this
threshold at 50% replacement; hole-rich regions remain phase separated. Given that
Ru-doping is nominally a strong perturbation to the weakly insulating ground state of
Sr-327, this observation is striking and suggests that Coulomb interactions and
correlation effects remain essential across the majority of the phase diagram of this
system.

104
Fig 6.7.1 Electronic phase diagram of Sr3(Ir1-xRux)2O7 (a) Evolution of electronic
phases of Sr3(Ir1-xRux)2O7 as a function of Ru concentration. CAF-I denotes the
insulating canted antiferromagnetic phase, PM-I denotes the paramagnetic insulating
phase, AF-M denotes the AF ordered metallic state, and PM-M indicates the
paramagnetic metallic regime. Squares indicate the onset of canted AF order
determined with bulk susceptibility measurements, circles denote the onset of AF
order as observed via neutron direction measurements, and triangles indicate the
transition temperatures for thermally driven MITs near the phase boundary. (b)
Illustration of the basal-plane showing electronically phase separated holes near the
percolative threshold, which nucleate within the spin-orbit Mott insulating
background of Sr3Ir2O7. Error bars in all plots represent one standard deviation.
Our combined neutron scattering and STS data reveal that the AF ordered state
that survives across the MIT has a spin-spin correlation length (ξ>200 Å) that spans
across the phase separated puddles of gapped and metallic regions—revealing a
globally AF ordered phase. Furthermore in concentrations doped close to the MIT, the
recovery of the ordered AF moment to values nearly equaling that of the undoped
parent Sr3Ir2O7 rules out any trivial superposition of chemically distinct phases. A
magnetically ordered, metallic state beyond the MIT is reminiscent of the phase
diagrams of (Ca1-xSrx)3Ru2O7 [20] and Ca2-xSrxRuO4 [21]; however, from our current
measurements of Sr3(Ir1-xRux)2O7 the critical point is not directly tied to a structural
phase transition. AF metallic states have also been proposed in disordered and binary
alloy Mott phases as an intermediate state prior to the onset of Anderson localization
[22, 23]. The global picture our data provide show that the physics here is more
105
complex than that of a trivially diluted AF system with percolative transport. The
percolating metallic network seemingly can be induced to order by the host AF
matrix, which may explain why the ordered AF moment is actually enhanced near the
region of maximum heterogeneous interface area at the MIT as well as why AF order
survives across the percolation threshold where no infinite domain of the AF host
persists. Local antiferromagnetism does however naively persist across the critical
concentration and can continue to influence the metallic phase into the heavily Ru-
doped regime. Eventually this gives way to a globally gapless AF phase in the x=0.5
sample. We propose the following picture of magnetic interactions within this system:
When they are dilute within the matrix, Ru-doped holes behave in a manner consistent
with isolated ions in the S=1 low spin state giving rise to the local moment response;
however, increasing the Ru-doping level increases the density of these isolated
magnetic impurities, eventually nucleating clusters of metallic regions (resolved
directly in our STS measurements). Within these metallic puddles, whose percolation
generates the MIT, the local moment should be quenched at low temperatures in a
Fermi-liquid ground state; however, these puddles may still be magnetically ordered
due to proximity of local AF order in neighboring regions and a large spin
susceptibility arising from their nested Fermi surface pockets. Such an instability is
indeed known to be present along the Q=(π, π) in-plane wave vectors of Sr3Ru2O7
[24] where an enhanced density of states is nested at the Fermi level due to the
structural zone folding. In this regard, this suggests similarities to the
thermally driven MIT in the prototypical Mott system VO2, where percolating
metallic puddles display significant correlation effects [25]. More broadly, the
survival of an ordered magnetic moment into the metallic state of the system
demonstrates that electron-electron correlations remain relevant across the MIT of this
2 ´ 2

106
system and argues against the picture of Sr3Ir2O7 as a trivial band-insulator simply
driven by the zone-folding that occurs at the onset of AF order. The evolution of AF
order across the MIT in the phase diagram of this hole-doped spin-orbit Mott insulator
demonstrates that a rich interplay can be realized at the boundary between a novel
Jeff=1/2 insulator and a correlated metal. The localization of Ru-doped carriers into a
phase separated ground state surprisingly parallels the strongly correlated phase
behavior of 3d-transition metal oxide systems such as the B-site doped correlated
manganites [26--29] and reveals that correlation physics can play a dominant role in
the electronic phase formation of a doped spin-orbit Mott insulator. Our findings
demonstrate that correlation effects felt by carriers introduced within in a 5d Mott
phase remain robust enough to drive electron localization, a key ingredient in
emergent phenomena such as high temperature superconductivity and enhanced
ferroic behavior. This opens up a new frontier for exploring correlated electron
phases within the presence of strong spin-orbit coupling effects inherent to a 5d-
electron setting.
Chapter 6 References
[1] B. J. Kim, H. Ohsumi, T. Komesu, S. Sakai, T. Morita, H. Takagi, and T. Arima,
Science 323, 1329 (2009).
[2] B. J. Kim, H. Jin, S. J. Moon, et al, Phys. Rev. Lett. 101 (2008).
[3] Q. Wang, Y. Cao, J. Waugh, S. Park, T. Qi, O. Korneta, G. Cao, and D. Dessau,
Physical Review B 87, 245109 (2013).
[4] F. Wang and T. Senthil, Phys. Rev. Lett. 106, 136402 (2011).

107
[5] J. Kim, Y. Choi, J. Kim, J. Mitchell, G. Jackeli, M. Daghofer, J. van den Brink, G.
Khaliullin, and B. Kim, Phys. Rev. Lett. 109, 037204 (2012).
[6] S. Moon, H. Jin, K. W. Kim, W. Choi, Y. Lee, J. Yu, G. Cao, A. Sumi, H.
Funakubo, and C. Bernhard, Phys. Rev. Lett. 101, 226402 (2008).
[7] Y. Okada, D. Walkup, H. Lin, C. Dhital, T. Chang, S. Khadka, W. Zhou, H. Jeng,
M. Paranjape, and A. Bansil, Nature materials (2013).
[8] J. Dai, E. Calleja, G. Cao, and K. McElroy, arXiv preprint arXiv:1303.3688
(2013).
[9] J. Rodriguez-Carvajal, in satellite meeting on powder diffraction of the XV
congress of the IUCr (Toulouse, France:[sn], 1990).
[10] R. Cava, B. Batlogg, K. Kiyono, H. Takagi, J. Krajewski, W. Peck Jr, L. Rupp Jr,
and C. Chen, Physical Review B 49, 11890 (1994).
[11] C. Dhital, S. Khadka, Z. Yamani, et al, Physical Review B 86 (2012).
[12] S. Grigera, R. Perry, A. Schofield, M. Chiao, S. Julian, G. Lonzarich, S. Ikeda,
Y. Maeno, A. Millis, and A. Mackenzie, Science 294, 329 (2001).
[13] S. Ikeda, Y. Maeno, S. Nakatsuji, M. Kosaka, and Y. Uwatoko, Physical Review
B 62, R6089 (2000).
[14] G. Cao, Y. Xin, C. Alexander, J. Crow, P. Schlottmann, M. Crawford, R.
Harlow, and W. Marshall, Physical Review B 66, 214412 (2002).

108
[15] N. Kini, A. Strydom, H. Jeevan, C. Geibel, and S. Ramakrishnan, Journal of
Physics: Condensed Matter 18, 8205 (2006).
[16] S. Boseggia, R. Springell, H. C. Walker, A. T. Boothroyd, D. Prabhakaran, S. P.
Collins, and D. F. McMorrow, Journal of Physics-Condensed Matter 24 (2012).
[17] K. Iwaya, S. Satow, T. Hanaguri, N. Shannon, Y. Yoshida, S. Ikeda, J. He, Y.
Kaneko, Y. Tokura, and T. Yamada, Phys. Rev. Lett. 99, 057208 (2007).
[18] M. Ge, T. Qi, O. Korneta, D. De Long, P. Schlottmann, W. Crummett, and G.
Cao, Physical Review B 84, 100402 (2011).
[19] V. K. Shante and S. Kirkpatrick, Adv. Phys. 20, 325 (1971).
[20] Z. Qu, L. Spinu, H. Yuan, V. Dobrosavljević, W. Bao, J. W. Lynn, M. Nicklas, J.
Peng, T. Liu, and D. Fobes, Physical Review B 78, 180407 (2008).
[21] S. Nakatsuji, D. Hall, L. Balicas, Z. Fisk, K. Sugahara, M. Yoshioka, and Y.
Maeno, Phys. Rev. Lett. 90, 137202 (2003).
[22] D. Heidarian and N. Trivedi, Phys. Rev. Lett. 93, 126401 (2004).
[23] N. Paris, A. Baldwin, and R. Scalettar, Physical Review B 75, 165113 (2007).
[24] A. Tamai, M. Allan, J. Mercure, W. Meevasana, R. Dunkel, D. Lu, R. Perry, A.
Mackenzie, D. J. Singh, and Z. Shen, Phys. Rev. Lett. 101, 026407 (2008).
[25] M. M. Qazilbash, M. Brehm, B. Chae, P. Ho, G. O. Andreev, B. Kim, S. J. Yun,
A. Balatsky, M. Maple, and F. Keilmann, Science 318, 1750 (2007).
109
[26] A. Machida, Y. Moritomo, K. Ohoyama, T. Katsufuji, and A. Nakamura,
Physical Review B 65, 064435 (2002).
[27] E. Dagotto, T. Hotta, and A. Moreo, Physics Reports 344, 1 (2001).
[28] K. Pradhan, A. Mukherjee, and P. Majumdar, EPL (Europhysics Letters) 84,
37007 (2008).
[29] M. Uehara, S. Mori, C. Chen, and S. Cheong, Nature 399, 560 (1999).
110
Chapter 7: Iron Based Superconductors
(In this chapter I will present results of our neutron diffraction experiment revealing
the effect of uniaxial pressure on the structural and magnetic phase behavior of the
parent and electron (Co) doped compound Ba (Fe1-xCox) 2As2. Most of the work
described in this chapter is published in an article by Dhital et al “Effect of uniaxial
strain on the structural and magnetic phase transitions in BaFe2As2” Phys. Rev. Lett.
108, 087001 (2012)).
7. 1 Introduction
Iron based superconductors are a class of high temperature superconducting
materials having iron as one of the constituent elements. The name begins with the
discovery of superconductivity in LaO1-xFxFeAs at a temperature of 26 K in February
2008 [1]. This work has invited many researchers to focus on different iron based
compounds resulting in the discovery many different families of iron based
superconductors with TC as high as 56 K like: 1111 families, 122 families, 111
families, 11 families, 21311 families, 32522 families etc. Figure 7.1.1 shows the
different families of compounds with highlighted FePn/Ch plane.
There are some obvious reasons why these compounds are interesting systems
to study, the first reason being the coexistence of superconductivity and magnetism
[2]. Second reason is the existence of wide variety of compounds that provide a
playground for research. A third reason is the multiband nature of the Fermi surface
which adds additional complexity to the problem. They also have high critical current
and critical fields compared to cuprates which may be useful in power engineering
[2]. More than that, the coexistence of magnetism and superconductivity may find its
application in spintronics. All these families of superconductors share some common
properties (certainly with some exceptions) which can be summarized as below [3].
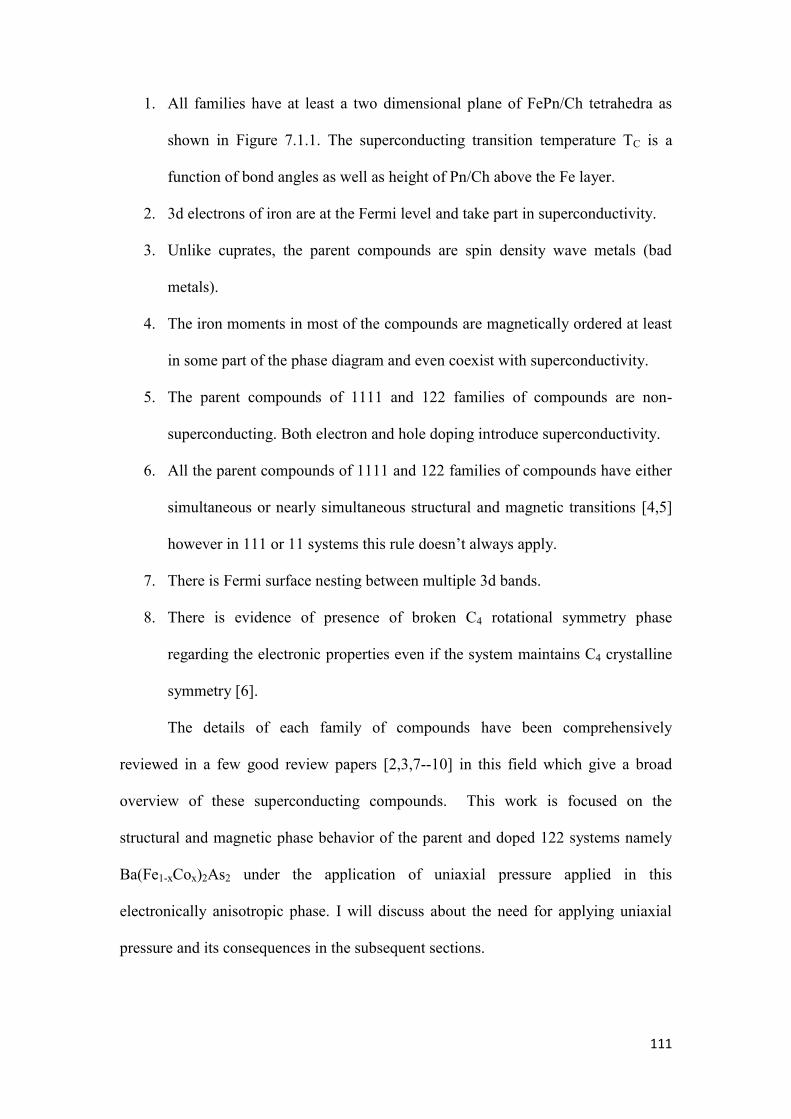
111
1. All families have at least a two dimensional plane of FePn/Ch tetrahedra as
shown in Figure 7.1.1. The superconducting transition temperature TC is a
function of bond angles as well as height of Pn/Ch above the Fe layer.
2. 3d electrons of iron are at the Fermi level and take part in superconductivity.
3. Unlike cuprates, the parent compounds are spin density wave metals (bad
metals).
4. The iron moments in most of the compounds are magnetically ordered at least
in some part of the phase diagram and even coexist with superconductivity.
5. The parent compounds of 1111 and 122 families of compounds are non-
superconducting. Both electron and hole doping introduce superconductivity.
6. All the parent compounds of 1111 and 122 families of compounds have either
simultaneous or nearly simultaneous structural and magnetic transitions [4,5]
however in 111 or 11 systems this rule doesn’t always apply.
7. There is Fermi surface nesting between multiple 3d bands.
8. There is evidence of presence of broken C4 rotational symmetry phase
regarding the electronic properties even if the system maintains C4 crystalline
symmetry [6].
The details of each family of compounds have been comprehensively
reviewed in a few good review papers [2,3,7--10] in this field which give a broad
overview of these superconducting compounds. This work is focused on the
structural and magnetic phase behavior of the parent and doped 122 systems namely
Ba(Fe1-xCox)2As2 under the application of uniaxial pressure applied in this
electronically anisotropic phase. I will discuss about the need for applying uniaxial
pressure and its consequences in the subsequent sections.
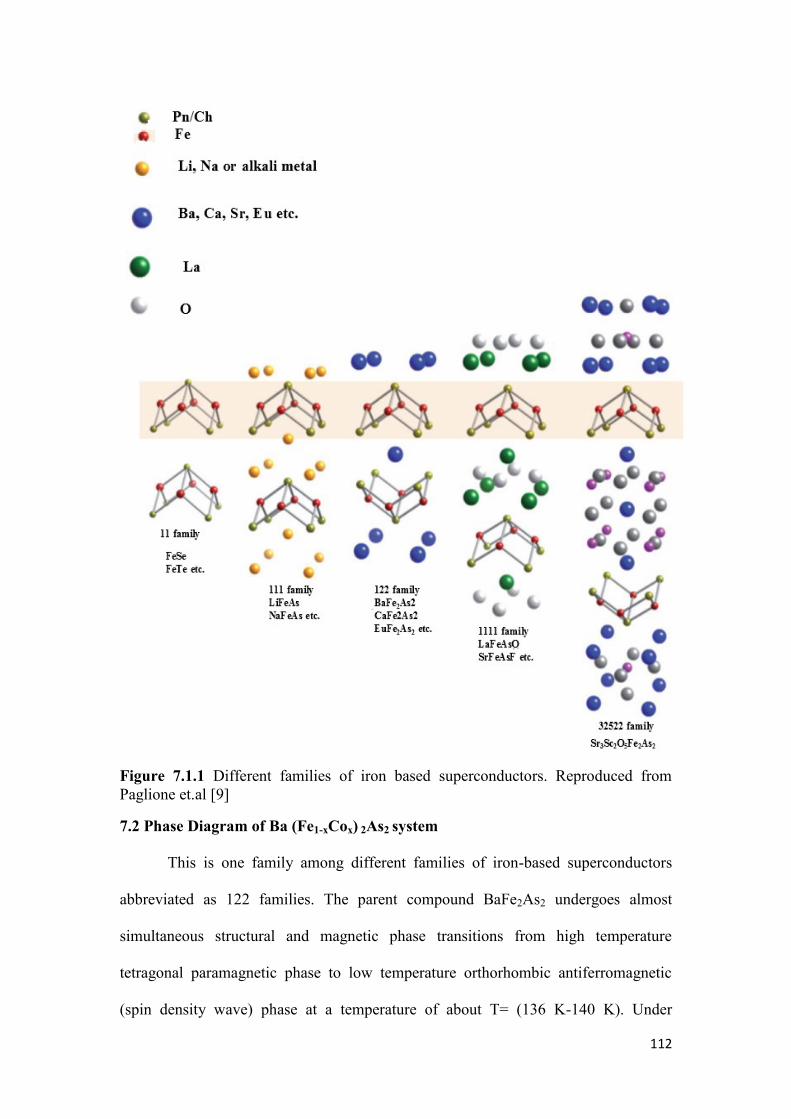
112
Figure 7.1.1 Different families of iron based superconductors. Reproduced from
Paglione et.al [9]
7.2 Phase Diagram of Ba (Fe1-xCox) 2As2 system
This is one family among different families of iron-based superconductors
abbreviated as 122 families. The parent compound BaFe2As2 undergoes almost
simultaneous structural and magnetic phase transitions from high temperature
tetragonal paramagnetic phase to low temperature orthorhombic antiferromagnetic
(spin density wave) phase at a temperature of about T= (136 K-140 K). Under

113
ambient conditions, the electron doping (Co doping) introduces following effects as
shown in the phase diagram [Figure7.2.1].
1. The structural transition temperature (TS) and magnetic transition temperature
(TN) are lowered.
2. The splitting of these two transitions TS-TN increases progressively with
increasing dopant concentration.
3. The magnetic transition changes its nature from almost first order to
continuous about the tricritical point x=0.22.
4. Superconductivity and magnetism coexist in the underdoped side of the phase
diagram but the magnetism vanishes completely at the optimal doping where
TC is maximum (xop=0.6, TCmax=22K). The magnitude of the ordered moment
decreases monotonically from about 1μB/Fe in parent compound to
immeasurably small value in the optimally doped compounds.
5. The orthorhombicity defined by:( )
( )
o o
o o
a b
a b
(where ao and bo are
orthorhombic a and b axis lattice parameters) decreases progressively with
doping and becomes immeasurably small upon optimal doping.
6. The superconducting dome is anisotropic. The rate of increase of TC in
underdoped region is higher than rate of decrease of TC in overdoped region
because the superconductivity and magnetism compete with each other in the
underdoped region for the same electrons.
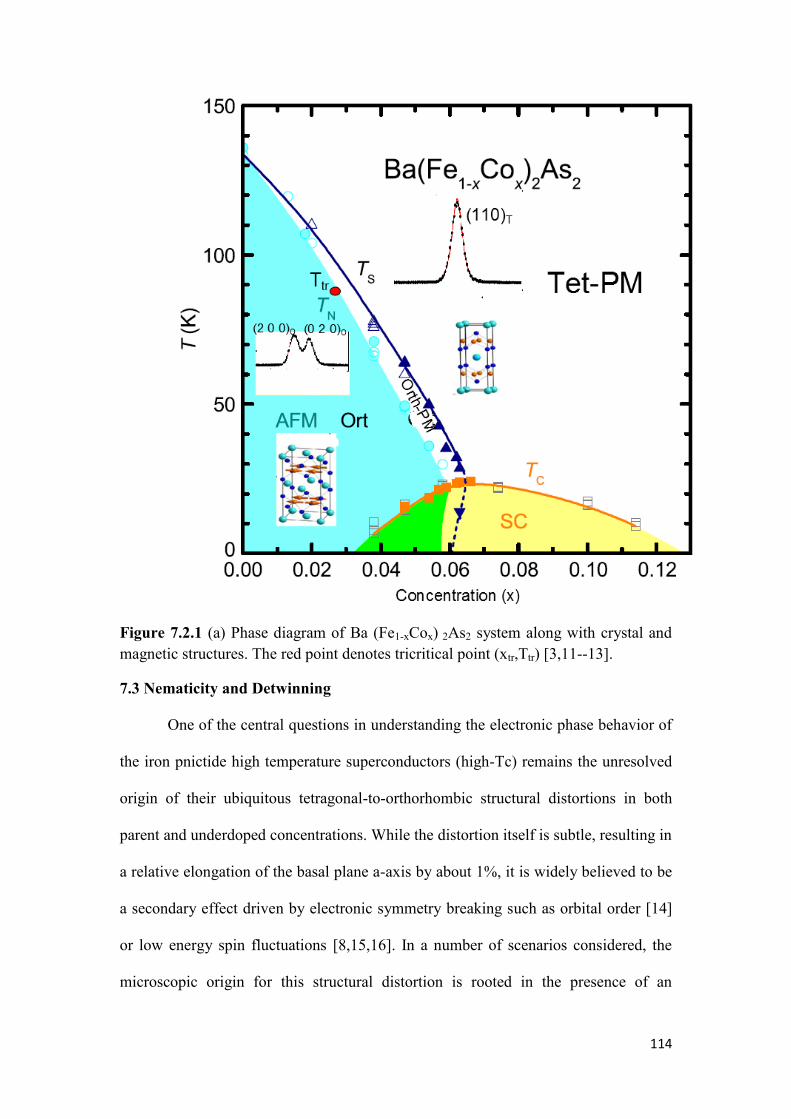
114
Figure 7.2.1 (a) Phase diagram of Ba (Fe1-xCox) 2As2 system along with crystal and
magnetic structures. The red point denotes tricritical point (xtr,Ttr) [3,11--13].
7.3 Nematicity and Detwinning
One of the central questions in understanding the electronic phase behavior of
the iron pnictide high temperature superconductors (high-Tc) remains the unresolved
origin of their ubiquitous tetragonal-to-orthorhombic structural distortions in both
parent and underdoped concentrations. While the distortion itself is subtle, resulting in
a relative elongation of the basal plane a-axis by about 1%, it is widely believed to be
a secondary effect driven by electronic symmetry breaking such as orbital order [14]
or low energy spin fluctuations [8,15,16]. In a number of scenarios considered, the
microscopic origin for this structural distortion is rooted in the presence of an
115
otherwise hidden, electronic, nematic [6,17,18] phase whose fluctuations are
ultimately suggested to play a role within the superconducting pairing mechanism. To
date, however, this scenario remains a subject of active investigation. As part of this,
one of the key metrics sought as a signature of nematicity (broken rotational
symmetry while preserving discrete translational symmetry) is an indication of C4-
symmetry breaking within the electronic properties of the iron pnictides in an
otherwise nominally paramagnetic, tetragonal (C4-symmetric) phase. Numerous
experimental probes such as dc-transport [6,19,20], optical conductivity [21],
scanning tunneling microscopy [22], angle-resolved photoemission [23], neutron
scattering [24], and magnetic torque [18] measurements have either directly or
indirectly resolved the presence of the electronic behavior violating the C4 rotational
symmetry within the FeAs planes of different families of iron pnictide high-Tc
systems. Initial studies relied on bulk probes of crystals which manifested twin
structural domains below their tetragonal-to-orthorhombic structural distortion
temperatures (TS) [Figure 7.3.1]. These bulk studies necessarily rely on a symmetry
breaking field [6,25] which biases twin domain formation and allows uniquely
defined directions within the basal planes of these systems. The symmetry breaking
fields are typically comprised of simple uniaxial strain applied to the underlying
crystalline lattice; however magnetic fields [6] are also utilized. In both cases, the
strong spin-lattice coupling inherent to these materials necessarily results in the
perturbation of both the underlying nuclear lattice and the antiferromagnetic order as
the system are prepared for study. Correspondingly, the core observation of the
nematic behavior inherent to these systems, as seen via bulk probes, stems from their
dramatic susceptibility to the perturbations brought on by these external symmetry
breaking fields, which ultimately allow the nematic order parameter to develop. A
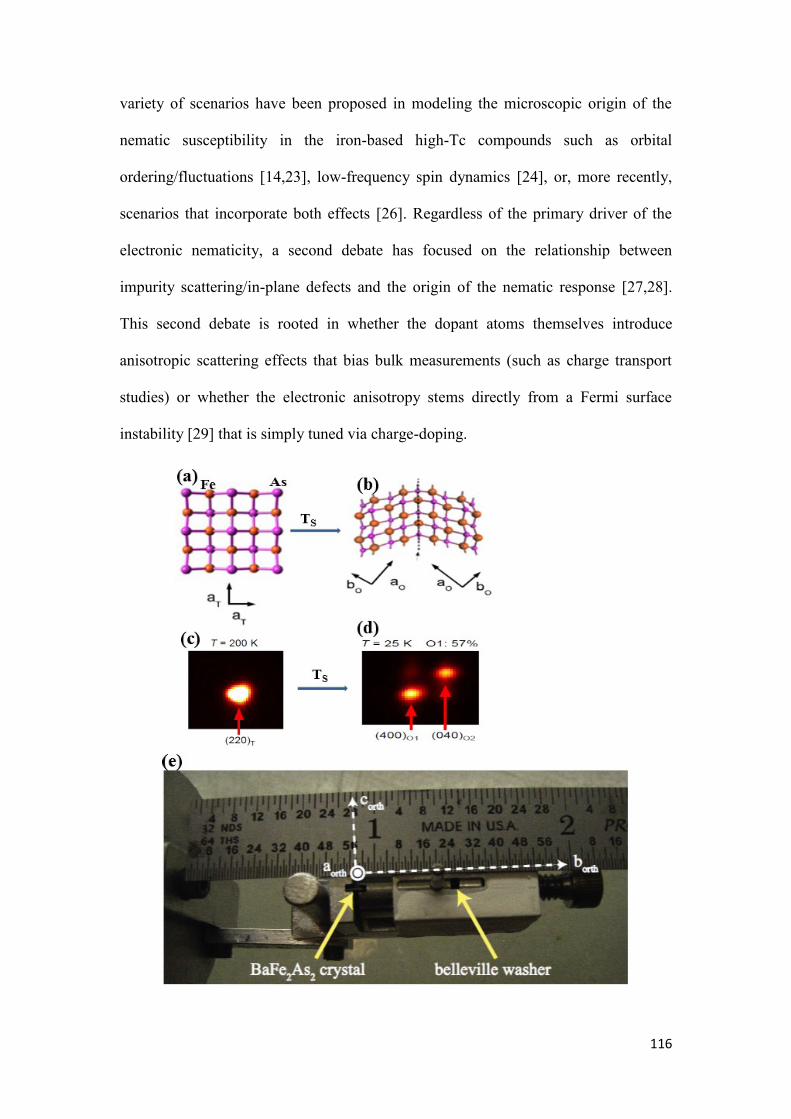
116
variety of scenarios have been proposed in modeling the microscopic origin of the
nematic susceptibility in the iron-based high-Tc compounds such as orbital
ordering/fluctuations [14,23], low-frequency spin dynamics [24], or, more recently,
scenarios that incorporate both effects [26]. Regardless of the primary driver of the
electronic nematicity, a second debate has focused on the relationship between
impurity scattering/in-plane defects and the origin of the nematic response [27,28].
This second debate is rooted in whether the dopant atoms themselves introduce
anisotropic scattering effects that bias bulk measurements (such as charge transport
studies) or whether the electronic anisotropy stems directly from a Fermi surface
instability [29] that is simply tuned via charge-doping.
117
Figure 7.3.1 Illustration of twinning [6] (a) tetragonal single domain (b)
Orthorhombic twin domains formed after structural distortion. (c) X-ray diffraction
peak for (220)T domain (d) X-ray diffraction peaks for twin orthorhombic domains (e)
small aluminum device (detwinner) designed for applying uniaxial pressure [30].
The application of external uniaxial pressure to define unique crystallographic
direction for the measurement of electronic properties is called detwinning (stop twin
domain formation). But this uniaxial pressure itself can bring a change in the
structural and spin behavior of the system because of the spin-lattice and orbital-
lattice coupling inherent in these systems. In the following sections I will discuss
about our experiments focusing on the effect of uniaxial pressure on the structural and
spin behavior of the parent and underdoped system.
7.4 Effect of Uniaxial Pressure on Structural and Magnetic Phase Behavior of Ba
(Fe1-xCox) 2As2
The bilayer pnictide system Ba (Fe1-xCox) 2As2 has proven a well-studied
platform for exploring the above mentioned scenarios of electronic anisotropy [20]. In
seminal charge transport studies, data showed that in-plane transport anisotropy
surprisingly persisted well above the nominal tetragonal-to-orthorhombic transition
temperature and the extent of this high temperature transport anisotropy evolved as a
function of electron-doping [20]. Subsequent studies, however, reported that post-
growth annealing and alternative means of doping dramatically dampen this
anisotropy, suggesting the dominant role of an anisotropic scattering mechanism
driven by in-plane dopant impurities [28,31]. Adding to the debate, recent results have
shown that, above the nominal TS, strain-induced anisotropy is independent of relative
levels of disorder in samples with similar antiferromagnetic (AF) ordering
temperatures (TN) [29]. Strain-induced anisotropy in this high-temperature,

118
paramagnetic regime is widely interpreted as directly resulting from incipient nematic
order; however direct measurements of the strain-induced response of correlated
magnetic order and its evolution upon doping in this regime are notably lacking. In
this thesis, I will focus first on the structural and magnetic phase behavior of parent
BaFe2As2 under different level of uniaxial pressure and then subsequently on the
magnetic phase behavior of the Co doped system in presence of same level of uniaxial
pressure.
7.5 Experimental Details
The single crystal samples were grown in Oak Ridge National Laboratory
(Athena Sefat’s group) using standard self-flux techniques [32]. The samples were cut
along either orthorhombic a-axis [1 0 0] or b-axis [0 1 0] and mounted on a small
aluminum device in [H O L] scattering plane. The force was applied along
orthorhombic b-axis [0 1 0] (except one case where force was applied along
tetragonal b axis) and the pressure was monitored using Belleville washer as shown in
Figure 7.3.1(e). Assuming the Belleville washer is within the elastic limit, the
pressure was calculated using relation P = -kx/A, where k is the elastic constant of
washer, x the displacement from the initial position and A is the area of cross-section
of the crystal. The pressure was applied at room temperature and kept fixed and the
sample was loaded into the closed cycle refrigerator with He-exchange gas. We label
all the lattice vectors and momentum transfers using reciprocal lattice units (r.l.u) in
orthorhombic settings. Neutron scattering experiments were carried out on C-5 triple
axis spectrometer and N-5 triple axis spectrometer in Canadian Neutron Beam Center
Chalkriver, Canada and HB-1 and HB1-A triple axis spectrometers in High Flux
Isotope Reactor (HFIR), Oakridge. Experiments on N-5 and C-5 were performed with
a pyrolitic graphite (PG) monochromator and analyzer (Ei=14.5 meV) with a PG filter
119
placed after the sample and collimations of 30’-60’-sample-33’-144’. The HB1 and
HB1-A setup consisted of a double-bounce monochromator (Ei=14.64 meV), PG
analyzer with a PG filter before the sample collimations of 48’-80’-sample-80’-240’.
In our experiments, we identify the onset of the structural distortion (TS) via
radial scans through the nuclear Q= (2, 0, 0) reflection. In the nominal case (without
uniaxial pressure) the structural distortion is identified by significant change in the
Gaussian width of this radial scan due to the formation of twin orthorhombic domains.
The center of (2, 0, 0) peak however corresponds to a domain-weighted average
lattice parameter, and this lattice value also shifts as the system distorts through TS
due to the inequivalent expansion/contraction of the in-plane a/b-axes. We simply
label this value as the “a-axis" lattice constant since it is the apparent value in our
scattering experiments. For the magnetic order parameter, we record the Q = (1, 0, 3)
peak intensity as function of temperature. The temperature at which the peak intensity
exceeds the background level is roughly defined as the onset of antiferromagnetic
ordering temperature (TN). In the following sections, the study is divided into two
cases: (a) response of TS and TN to different levels of uniaxial strain in parent
compound (ii) Effect on TS and TN for different doping for the same level of uniaxial
pressure.
7.6 Effect of Uniaxial Pressure on TS and TN for Parent BaFe2As2
As mentioned earlier, the measurement of structural distortion temperature
(TS) requires radial scans along Q= (2, 0, 0) direction. We performed radial scans
under 3 different conditions of uniaxial pressure: P=0 MPa, P=0.5 MPa, and P=0.7
MPa.
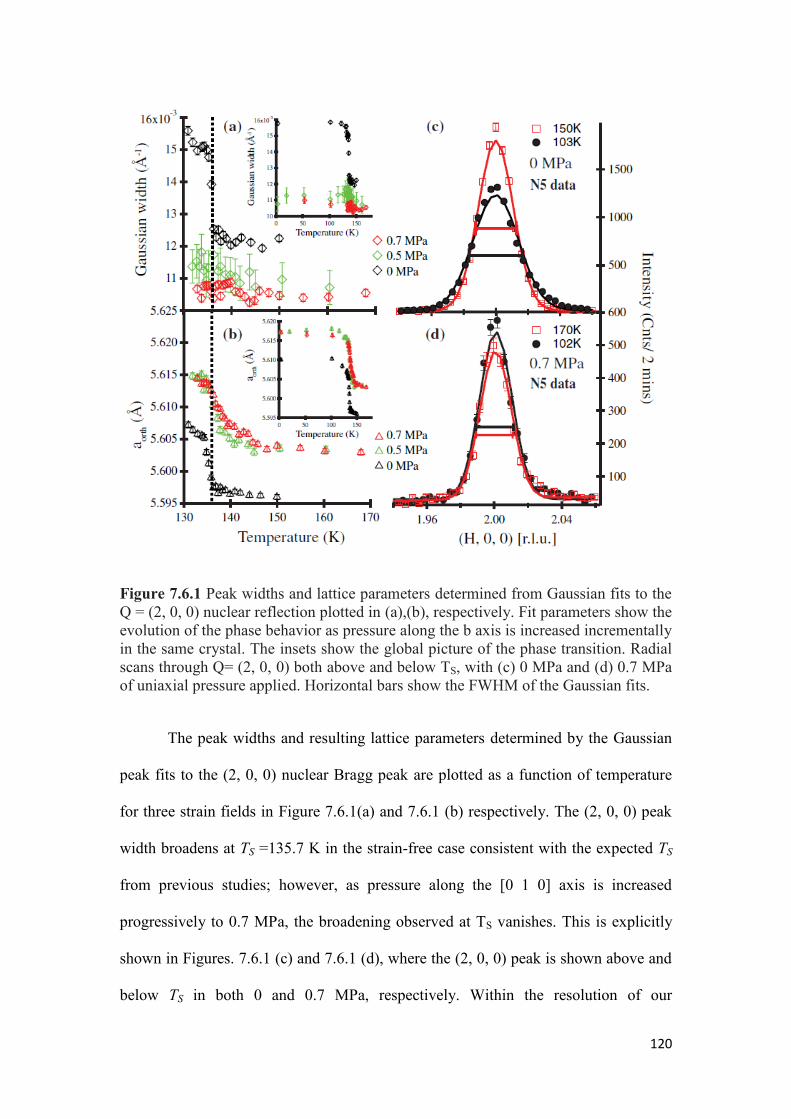
120
Figure 7.6.1 Peak widths and lattice parameters determined from Gaussian fits to the
Q = (2, 0, 0) nuclear reflection plotted in (a),(b), respectively. Fit parameters show the
evolution of the phase behavior as pressure along the b axis is increased incrementally
in the same crystal. The insets show the global picture of the phase transition. Radial
scans through Q= (2, 0, 0) both above and below TS, with (c) 0 MPa and (d) 0.7 MPa
of uniaxial pressure applied. Horizontal bars show the FWHM of the Gaussian fits.
The peak widths and resulting lattice parameters determined by the Gaussian
peak fits to the (2, 0, 0) nuclear Bragg peak are plotted as a function of temperature
for three strain fields in Figure 7.6.1(a) and 7.6.1 (b) respectively. The (2, 0, 0) peak
width broadens at TS =135.7 K in the strain-free case consistent with the expected TS
from previous studies; however, as pressure along the [0 1 0] axis is increased
progressively to 0.7 MPa, the broadening observed at TS vanishes. This is explicitly
shown in Figures. 7.6.1 (c) and 7.6.1 (d), where the (2, 0, 0) peak is shown above and
below TS in both 0 and 0.7 MPa, respectively. Within the resolution of our

121
measurements, there is no resolvable width change in peak line shape once 0.7 MPa is
applied, suggesting that the crystal has been substantially detwinned. In order to
resolve the onset of the structural phase transition as the crystal is progressively
detwinned, the longer in-plane lattice parameter a is plotted as a function of
temperature in Figure. 7.6.1(b) for the three different applied pressures. Here, the shift
in the average in-plane lattice parameter for the strain-free crystal simply reflects the
asymmetric splitting between a and b axes as the structural phase transition sets in;
however, under 0.7 MPa of pressure, it is immediately apparent that the onset of TS
has shifted upward in temperature to TS =147 K. Figure 7.6.1 (b) explicitly
demonstrates that, as pressure is increased, the onset temperature for TS shifts
systematically upward as strain fields approaching the detwinning threshold are
approached.
Figure 7.6.2 (a) Intensity (I∝ M2) at the Q= (1, 0, 3) AF peak position normalized by
the (0, 0, 4) nuclear peak plotted as a function of temperature for different pressures
applied along the b axis. The inset shows the magnetic phase transition over the entire
temperature range. Dashed lines are power-law fits, as described in the text. (b) Scan
Q = (1, 0, 3) at T =142 K with nonmagnetic background subtracted. Horizontal bar
indicates the FWHM of the (1, 0, 3) reflection measured at 3 K.
We also tracked down the effect of uniaxial pressure on the spin behavior of
this parent system. As mentioned already, the peak intensity of Q= (1, 0, 3) magnetic
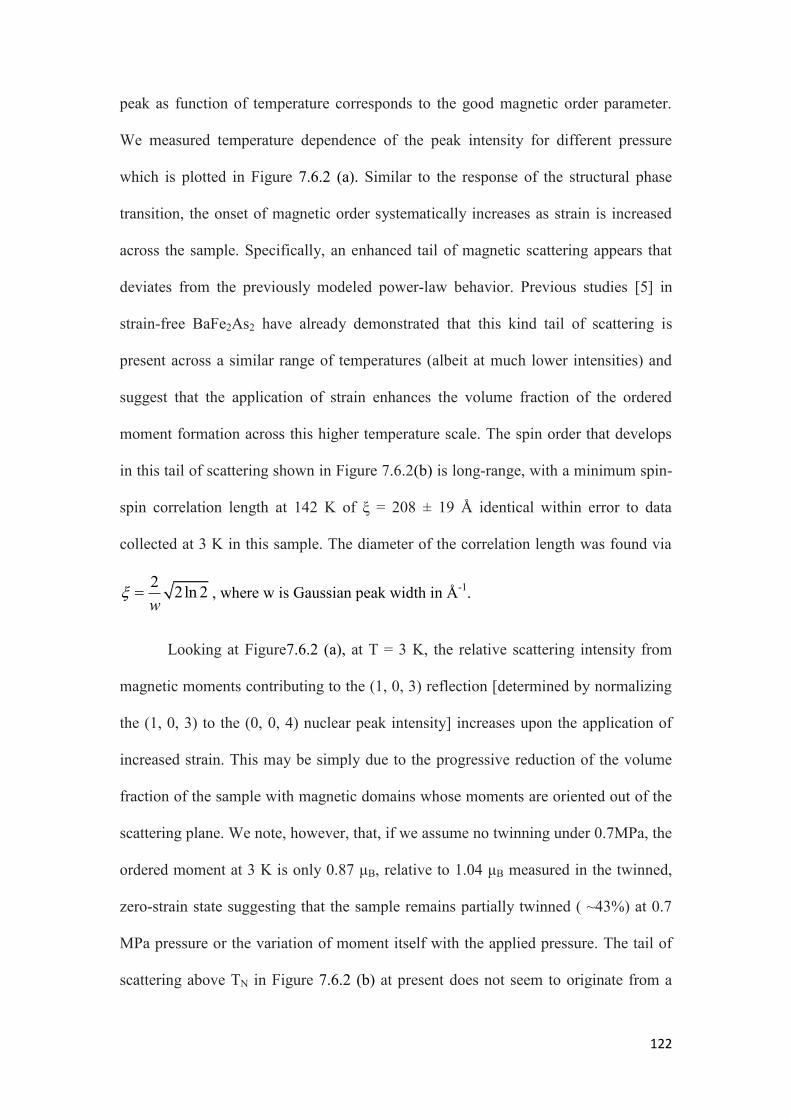
122
peak as function of temperature corresponds to the good magnetic order parameter.
We measured temperature dependence of the peak intensity for different pressure
which is plotted in Figure 7.6.2 (a). Similar to the response of the structural phase
transition, the onset of magnetic order systematically increases as strain is increased
across the sample. Specifically, an enhanced tail of magnetic scattering appears that
deviates from the previously modeled power-law behavior. Previous studies [5] in
strain-free BaFe2As2 have already demonstrated that this kind tail of scattering is
present across a similar range of temperatures (albeit at much lower intensities) and
suggest that the application of strain enhances the volume fraction of the ordered
moment formation across this higher temperature scale. The spin order that develops
in this tail of scattering shown in Figure 7.6.2(b) is long-range, with a minimum spin-
spin correlation length at 142 K of ξ = 208 ± 19 Å identical within error to data
collected at 3 K in this sample. The diameter of the correlation length was found via
22ln 2
w , where w is Gaussian peak width in Å
-1.
Looking at Figure7.6.2 (a), at T = 3 K, the relative scattering intensity from
magnetic moments contributing to the (1, 0, 3) reflection [determined by normalizing
the (1, 0, 3) to the (0, 0, 4) nuclear peak intensity] increases upon the application of
increased strain. This may be simply due to the progressive reduction of the volume
fraction of the sample with magnetic domains whose moments are oriented out of the
scattering plane. We note, however, that, if we assume no twinning under 0.7MPa, the
ordered moment at 3 K is only 0.87 μB, relative to 1.04 μB measured in the twinned,
zero-strain state suggesting that the sample remains partially twinned ( ~43%) at 0.7
MPa pressure or the variation of moment itself with the applied pressure. The tail of
scattering above TN in Figure 7.6.2 (b) at present does not seem to originate from a

123
simple picture of critical fluctuations above a second-order phase transition, given the
lack of a resolvable divergence in the 3D spin-spin correlation length; rather, the
enhanced magnetic scattering seems to stabilize over large domains within the sample
as strain is increased.
As an approach to understand the mechanism behind this large shift in TS and
TN, we applied relatively large strain field of ≈2.2 MPa along b axis i.e. [0 1 0]
direction in a different piece of parent compound. The results are plotted in Figure
7.6.3. Consistent with our first sample, there is a sizeable shift in TN, onset which is
almost same as the TN, onset of the previous sample with relatively low pressure of
0.7 MPa. This may indicate that the shift in TN is locked irrespective of the pressure
value. Similar to the previous sample, the apparent intensity of the magnetic peak
increases due to the detwinning effect of the uniaxial pressure which rotates a larger
volume fraction of the magnetic domains into the scattering plane. Naively, one
would expect apparently doubled magnetic intensity once the sample is completely
detwinned, however we only observe about 50% increase in the magnetic intensity
despite the fact that the in-plane nuclear reflections no longer exhibit any broadening
at the structural distortion as plotted in Figure 7.6.3 (b). Regarding the structural
response at this high strain field, the sample is completely detwinned by 2.2 MPa
which is evident from the absence of broadening of Gaussian width of (2, 0, 0) radial
scans as shown in Figure 7.6.3 (b). Although the structural distortion temperature (TS)
is not rigorously defined due to presence of symmetry breaking field, we define a
temperature TS,onset where sample’s phase transition is detectable above any subtle
distortion induced via strain as shown in Figure 7.6.3 (c). This temperature
(TS,onset=157 K) is clearly decoupled from the onset of antiferromagnetic ordering
temperature which was not clear in our previous study [30].
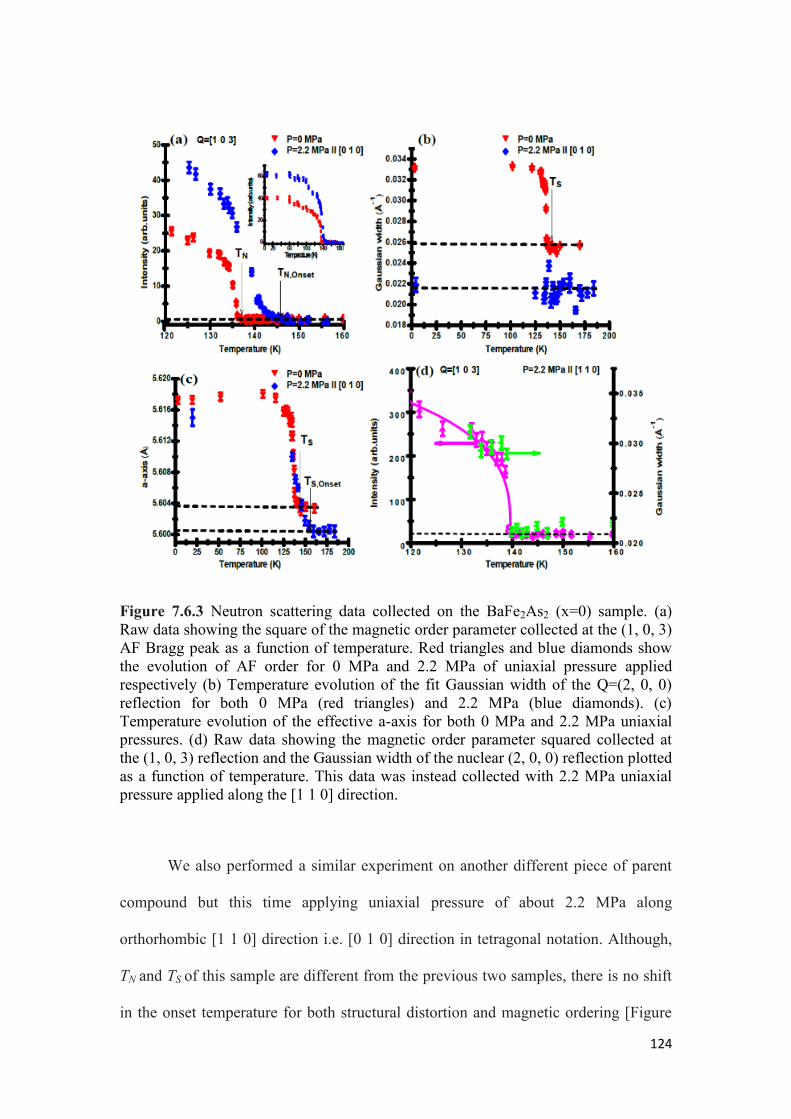
124
Figure 7.6.3 Neutron scattering data collected on the BaFe2As2 (x=0) sample. (a)
Raw data showing the square of the magnetic order parameter collected at the (1, 0, 3)
AF Bragg peak as a function of temperature. Red triangles and blue diamonds show
the evolution of AF order for 0 MPa and 2.2 MPa of uniaxial pressure applied
respectively (b) Temperature evolution of the fit Gaussian width of the Q=(2, 0, 0)
reflection for both 0 MPa (red triangles) and 2.2 MPa (blue diamonds). (c)
Temperature evolution of the effective a-axis for both 0 MPa and 2.2 MPa uniaxial
pressures. (d) Raw data showing the magnetic order parameter squared collected at
the (1, 0, 3) reflection and the Gaussian width of the nuclear (2, 0, 0) reflection plotted
as a function of temperature. This data was instead collected with 2.2 MPa uniaxial
pressure applied along the [1 1 0] direction.
We also performed a similar experiment on another different piece of parent
compound but this time applying uniaxial pressure of about 2.2 MPa along
orthorhombic [1 1 0] direction i.e. [0 1 0] direction in tetragonal notation. Although,
TN and TS of this sample are different from the previous two samples, there is no shift
in the onset temperature for both structural distortion and magnetic ordering [Figure

125
7.6.3 (d)]. The absence of a high-temperature tail within the AF order parameter for
this case of [1 1 0]-oriented pressure explicitly demonstrates that the strain-induced
enhancement of AF order in this system stems solely from uniaxial strain fields
oriented parallel to the in-plane orthorhombic [0 1 0] axes. This fact directly parallels
charge transport anisotropy effects and suggests that the enhancement of AF order and
the large lattice response to the uniaxial strain stem from the same susceptibility.
7.7 Evolution of Spin Susceptibility with doping in Ba(Fe1-xCox)2As2 under
Uniaxial Pressure
We now turn our attention to the underdoped side of the phase diagram that
covers the entire region corresponding to first order magnetic transition as well as
second order magnetic transition [11]. Similar measurements across Q= (1, 0, 3) and
Q = (0, 0, 4) were performed with pressure applied along orthorhombic b axis i.e. [0 1
0] direction. Figure 7.7.1 shows the response of AF order parameter under
comparable levels of uniaxial strain ≈2 MPa. There is upward shift in the AF order in
all samples similar to the parent system. For, x=0.015 concentration, the first order
magnetic phase transition develops a prominent strain-induced tail, mirroring the
parent phase behavior; however, unlike the parent material, the apparent magnetic
intensity fully doubles in this sample under applied pressure. This may suggest a
complete detwinning of the sample, although the behavior of the parent crystal
(discussed earlier) suggests that the ordered moment may also evolve under uniaxial
pressure. For the two concentrations on the second order side of tricritical point
(x=0.030 and x=0.040), applied pressure also manifests a similar high-temperature tail
in the AF order which convolves with the power law behavior of the order parameter.
We also measured near optimally doped sample (x=0.06) with the same
procedure. This sample nominally lacks long-range AF order, and the goal here was
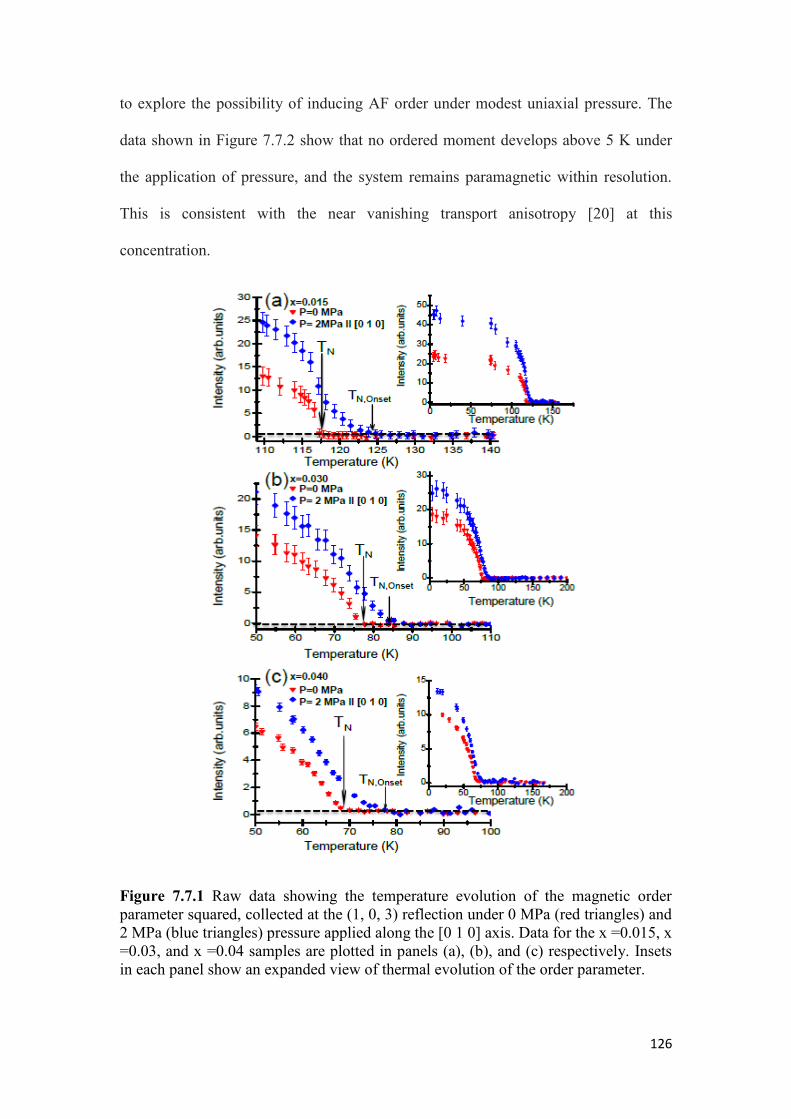
126
to explore the possibility of inducing AF order under modest uniaxial pressure. The
data shown in Figure 7.7.2 show that no ordered moment develops above 5 K under
the application of pressure, and the system remains paramagnetic within resolution.
This is consistent with the near vanishing transport anisotropy [20] at this
concentration.
Figure 7.7.1 Raw data showing the temperature evolution of the magnetic order
parameter squared, collected at the (1, 0, 3) reflection under 0 MPa (red triangles) and
2 MPa (blue triangles) pressure applied along the [0 1 0] axis. Data for the x =0.015, x
=0.03, and x =0.04 samples are plotted in panels (a), (b), and (c) respectively. Insets
in each panel show an expanded view of thermal evolution of the order parameter.
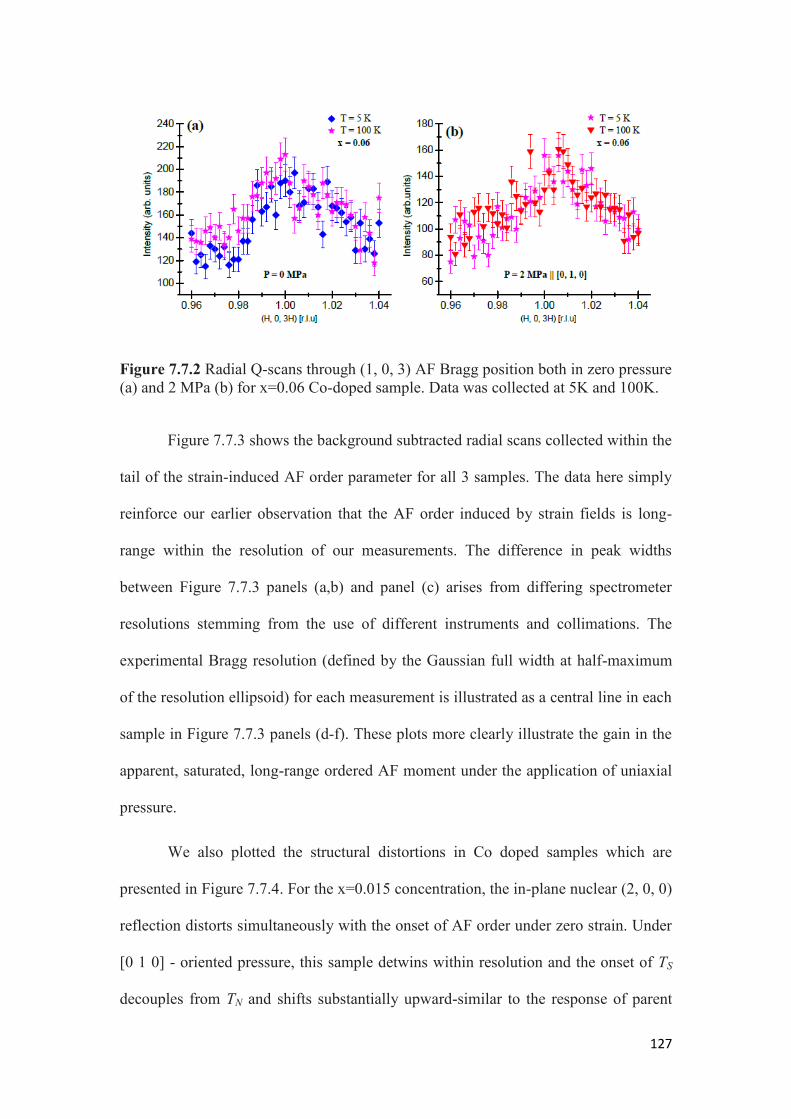
127
Figure 7.7.2 Radial Q-scans through (1, 0, 3) AF Bragg position both in zero pressure
(a) and 2 MPa (b) for x=0.06 Co-doped sample. Data was collected at 5K and 100K.
Figure 7.7.3 shows the background subtracted radial scans collected within the
tail of the strain-induced AF order parameter for all 3 samples. The data here simply
reinforce our earlier observation that the AF order induced by strain fields is long-
range within the resolution of our measurements. The difference in peak widths
between Figure 7.7.3 panels (a,b) and panel (c) arises from differing spectrometer
resolutions stemming from the use of different instruments and collimations. The
experimental Bragg resolution (defined by the Gaussian full width at half-maximum
of the resolution ellipsoid) for each measurement is illustrated as a central line in each
sample in Figure 7.7.3 panels (d-f). These plots more clearly illustrate the gain in the
apparent, saturated, long-range ordered AF moment under the application of uniaxial
pressure.
We also plotted the structural distortions in Co doped samples which are
presented in Figure 7.7.4. For the x=0.015 concentration, the in-plane nuclear (2, 0, 0)
reflection distorts simultaneously with the onset of AF order under zero strain. Under
[0 1 0] - oriented pressure, this sample detwins within resolution and the onset of TS
decouples from TN and shifts substantially upward-similar to the response of parent

128
material. For x=0.030 and x=0.040 concentrations, similar levels of uniaxial pressure
also shift the onset of TS upward; however neither of these samples are appreciably
detwinned under this same level of pressure. This is consistent with higher Co-
impurity concentrations pinning domain boundaries that subsequently require a higher
strain field to bias through TS. While the precise pressure necessary to detwinn a
sample is largely an extrinsic quantity, to best of our knowledge there has been no
systematic study reporting the evolution of the pressures necessary to detwinn Co-
doped Ba-122 in similar quality samples.
An alternative means of analyzing the AF order parameter under strain is to fit
AF order parameters as simple power laws broadened by a distribution of ordering
temperatures within the sample. This broadening would potentially be due to an
inhomogeneous strain field imposed across the crystal that nucleates AF order across
a distribution of temperatures. The presence of a severely inhomogeneous strain field
would naively be unable to account for the sharp nuclear (2, 0, 0) peak throughout the
structural phase transition in the parent and x=0.015 samples; however, if the volume
fraction of high strain regions is small enough, it is conceivable the expected
structural broadening may be diminished below experimental resolution. In either
case, fitting the magnetic order parameter to a Gaussian broadened power law
behavior generates an alternative metric for assessing the influence of uniaxial strain
on the development of AF order.
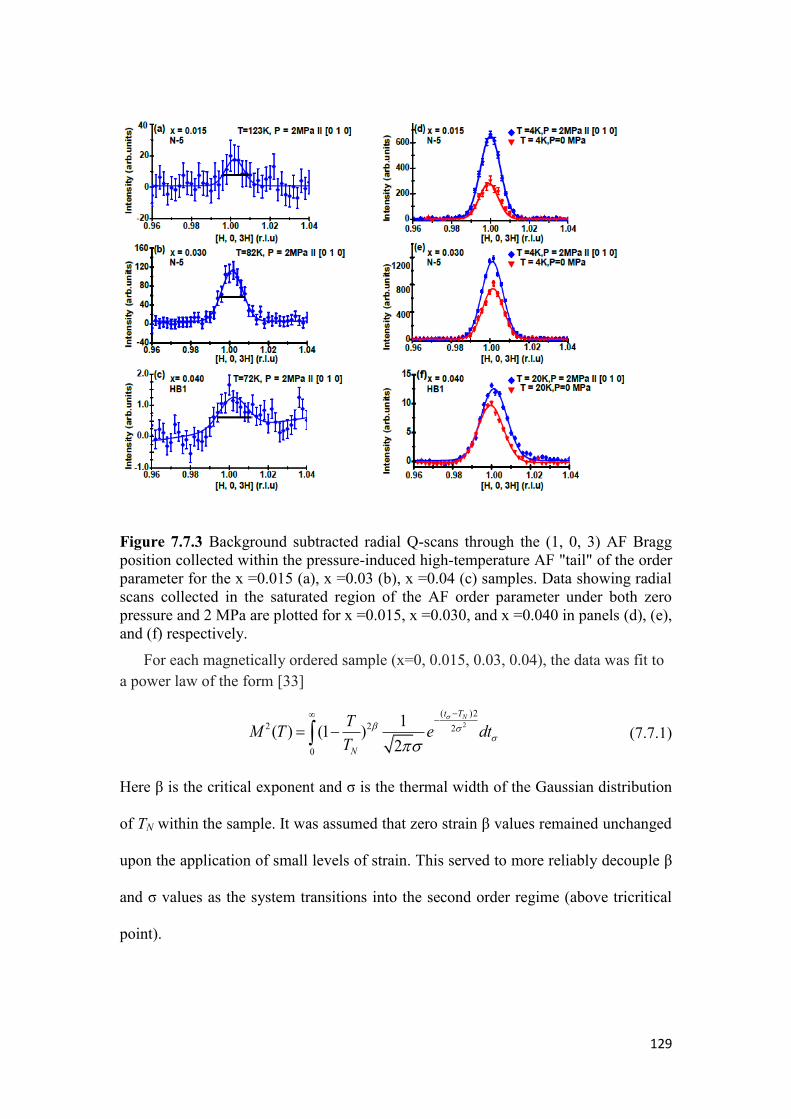
129
Figure 7.7.3 Background subtracted radial Q-scans through the (1, 0, 3) AF Bragg
position collected within the pressure-induced high-temperature AF "tail" of the order
parameter for the x =0.015 (a), x =0.03 (b), x =0.04 (c) samples. Data showing radial
scans collected in the saturated region of the AF order parameter under both zero
pressure and 2 MPa are plotted for x =0.015, x =0.030, and x =0.040 in panels (d), (e),
and (f) respectively.
For each magnetically ordered sample (x=0, 0.015, 0.03, 0.04), the data was fit to
a power law of the form [33]
2
( )2
2 2 2
0
1( ) (1 )
2
Nt T
N
TM T e dt
T
(7.7.1)
Here β is the critical exponent and σ is the thermal width of the Gaussian distribution
of TN within the sample. It was assumed that zero strain β values remained unchanged
upon the application of small levels of strain. This served to more reliably decouple β
and σ values as the system transitions into the second order regime (above tricritical
point).
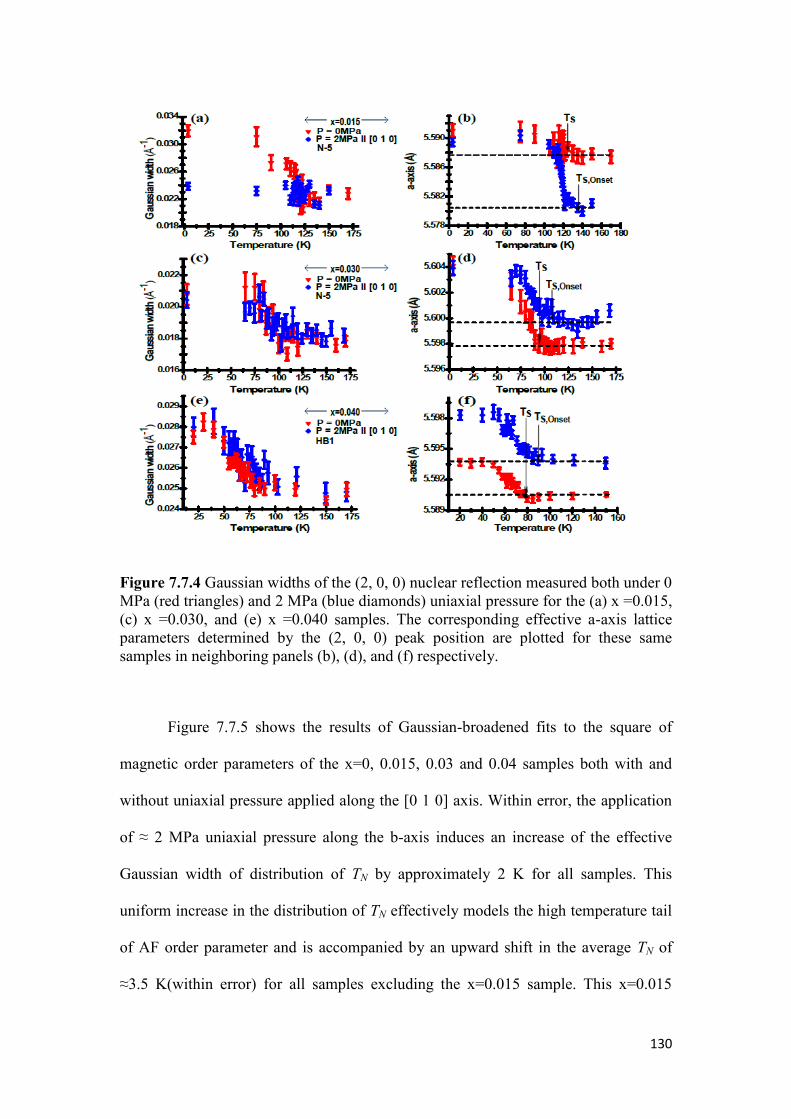
130
Figure 7.7.4 Gaussian widths of the (2, 0, 0) nuclear reflection measured both under 0
MPa (red triangles) and 2 MPa (blue diamonds) uniaxial pressure for the (a) x =0.015,
(c) x =0.030, and (e) x =0.040 samples. The corresponding effective a-axis lattice
parameters determined by the (2, 0, 0) peak position are plotted for these same
samples in neighboring panels (b), (d), and (f) respectively.
Figure 7.7.5 shows the results of Gaussian-broadened fits to the square of
magnetic order parameters of the x=0, 0.015, 0.03 and 0.04 samples both with and
without uniaxial pressure applied along the [0 1 0] axis. Within error, the application
of ≈ 2 MPa uniaxial pressure along the b-axis induces an increase of the effective
Gaussian width of distribution of TN by approximately 2 K for all samples. This
uniform increase in the distribution of TN effectively models the high temperature tail
of AF order parameter and is accompanied by an upward shift in the average TN of
≈3.5 K(within error) for all samples excluding the x=0.015 sample. This x=0.015
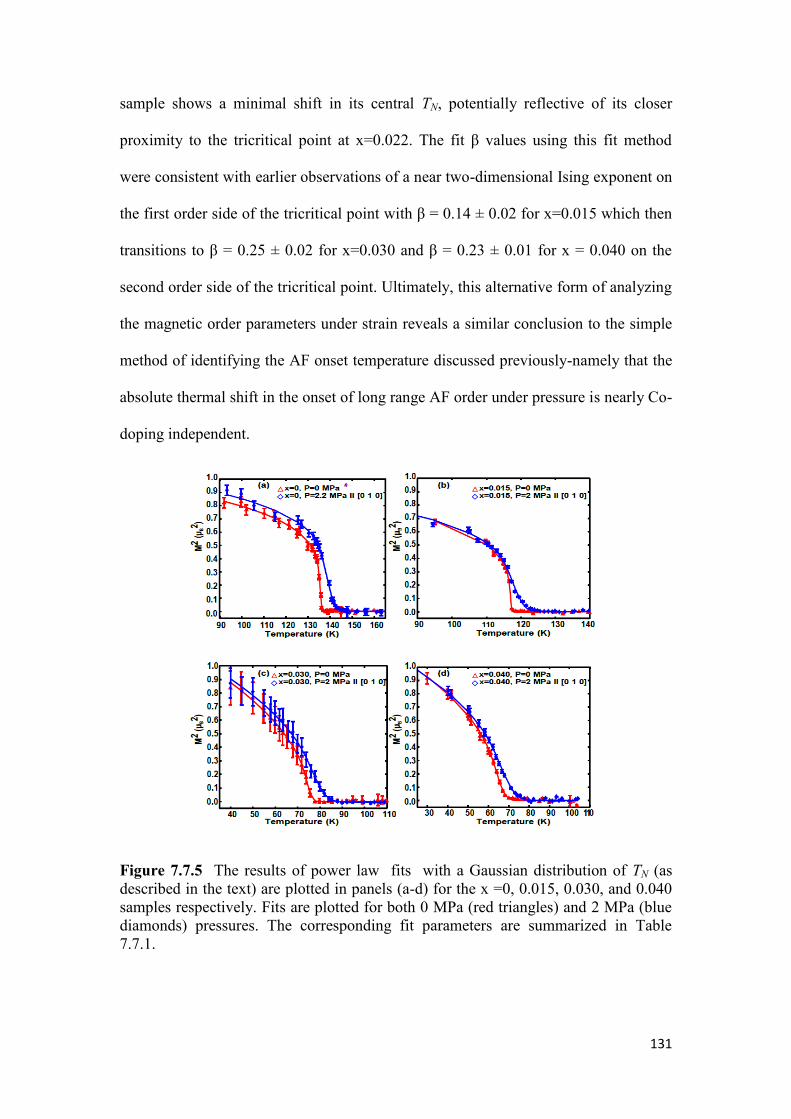
131
sample shows a minimal shift in its central TN, potentially reflective of its closer
proximity to the tricritical point at x=0.022. The fit β values using this fit method
were consistent with earlier observations of a near two-dimensional Ising exponent on
the first order side of the tricritical point with β = 0.14 ± 0.02 for x=0.015 which then
transitions to β = 0.25 ± 0.02 for x=0.030 and β = 0.23 ± 0.01 for x = 0.040 on the
second order side of the tricritical point. Ultimately, this alternative form of analyzing
the magnetic order parameters under strain reveals a similar conclusion to the simple
method of identifying the AF onset temperature discussed previously-namely that the
absolute thermal shift in the onset of long range AF order under pressure is nearly Co-
doping independent.
Figure 7.7.5 The results of power law fits with a Gaussian distribution of TN (as
described in the text) are plotted in panels (a-d) for the x =0, 0.015, 0.030, and 0.040
samples respectively. Fits are plotted for both 0 MPa (red triangles) and 2 MPa (blue
diamonds) pressures. The corresponding fit parameters are summarized in Table
7.7.1.
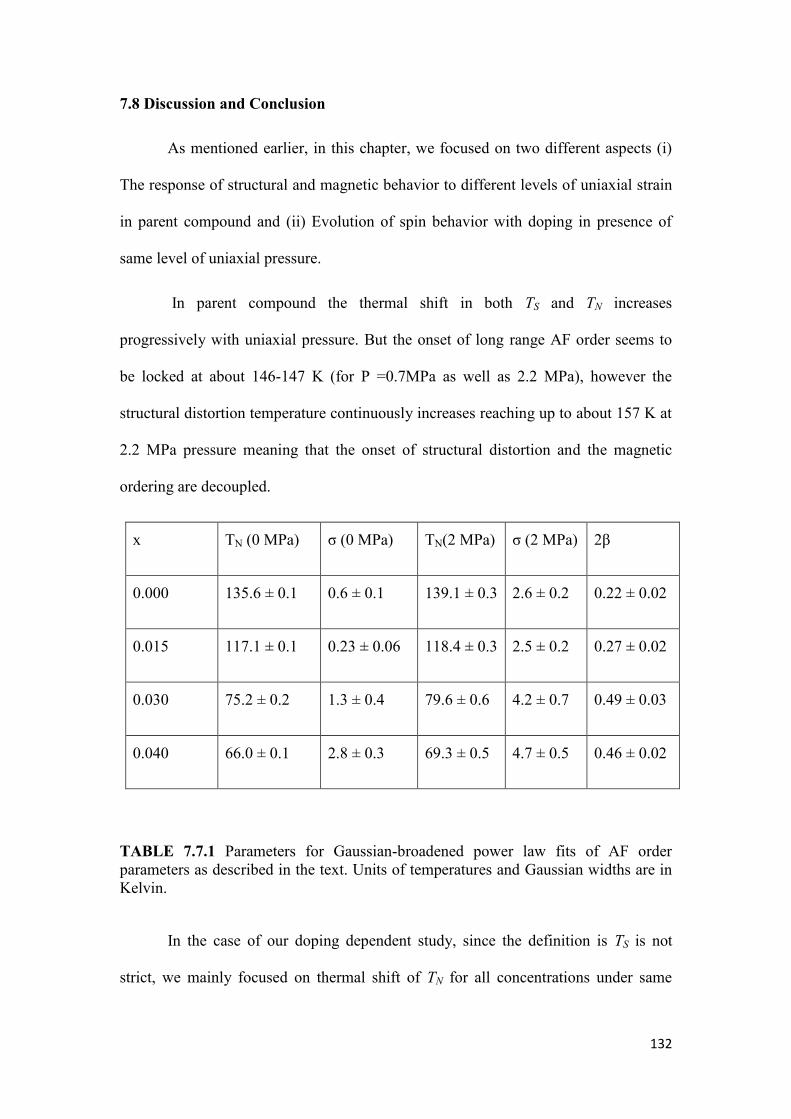
132
7.8 Discussion and Conclusion
As mentioned earlier, in this chapter, we focused on two different aspects (i)
The response of structural and magnetic behavior to different levels of uniaxial strain
in parent compound and (ii) Evolution of spin behavior with doping in presence of
same level of uniaxial pressure.
In parent compound the thermal shift in both TS and TN increases
progressively with uniaxial pressure. But the onset of long range AF order seems to
be locked at about 146-147 K (for P =0.7MPa as well as 2.2 MPa), however the
structural distortion temperature continuously increases reaching up to about 157 K at
2.2 MPa pressure meaning that the onset of structural distortion and the magnetic
ordering are decoupled.
x TN (0 MPa) σ (0 MPa) TN(2 MPa) σ (2 MPa) 2β
0.000 135.6 ± 0.1 0.6 ± 0.1 139.1 ± 0.3 2.6 ± 0.2 0.22 ± 0.02
0.015 117.1 ± 0.1 0.23 ± 0.06 118.4 ± 0.3 2.5 ± 0.2 0.27 ± 0.02
0.030 75.2 ± 0.2 1.3 ± 0.4 79.6 ± 0.6 4.2 ± 0.7 0.49 ± 0.03
0.040 66.0 ± 0.1 2.8 ± 0.3 69.3 ± 0.5 4.7 ± 0.5 0.46 ± 0.02
TABLE 7.7.1 Parameters for Gaussian-broadened power law fits of AF order
parameters as described in the text. Units of temperatures and Gaussian widths are in
Kelvin.
In the case of our doping dependent study, since the definition is TS is not
strict, we mainly focused on thermal shift of TN for all concentrations under same

133
level of strain field. Figure 7.8.1 (a) shows the pressure normalized shift in the onset
of TN,onset upon applying pressure along the [0 1 0] axis i.e. the plotted quantity is
,( , ( ) (0))[ ]
N Onset N OnsetNOnset
T P TdT
P P
. Here TN,onset is determined empirically at the
first temperature at which long-range AF order is observed above the background and
P is the applied pressure. The second panel in Figure 7.8.1 (b) plots the shift in the
mean distribution of TN plus the increase in half-width at half maximum of the
modeled distribution of TN using the Gaussian-broadened power law fits plotted in
Figure 7.7.5.
Figure 7.8.1 The shift in the empirically observed onset of TN,Onset normalized by the
applied pressure is plotted as a function of doping in panel (a). The doping dependent
shift in the average TN;Avg determined by the fitting parameters of Table 7.7.1 and
defined in the text is normalized by the applied pressure and plotted in (b).
Explicitly, we defined a quantity , 2ln 2N Avg NT T to define effective
shift in the leading edge of the tail of the AF order parameter using this alternative
metric and the corresponding relation , ,( ) (0)[ ]
N Avg N AvgNAvg
T P TdT
P P
. In both ways
of defining the pressure normalized thermal shift, the thermal shift of onset
temperature seems to be independent of the doping concentration for same level of
strain field. However, it corrrespondingly diverges as a fraction of TN as Co-doping
suppresses AF order as shown in Figure 7.8.2. This finding is seemingly at odds with
the previous phenomenological models which predict a decrease in the strain response

134
of AF order as the structural and AF transitions are decoupled upon electron doping.
For instance, a previous analysis based on Ginzberg-Landau treatment of the
magnetoelastic coupling of the structural and magnetic order parameters predicts that
the shift in TN under uniaxial stress should vary as 1/ ( )N S NT T T [34] .
Similarly, a minimal microscopic J1-J2-JZ model with nearest neighbor biquadratic
coupling suggests that the shift in TN should scale as ( )S NT T with an exponent
γ>2 [35]. Recent Monte Carlo simulations simultaneously treating both the spin-
lattice and orbital-lattice couplings within the Hamiltonian [26] suggest that additional
degrees of complexity such as modified orbital lattice coupling upon electron-doping
will likely need to be accounted for in future theoretical efforts to model AF order’s
response to symmetry breaking strain fields in Co-doped Ba-122.
Figure 7.8.1 Shift of TN as a fraction of TN and applied pressure.
Generally, in the presence of strain, C4 symmetry is broken, and we don’t
expect a sharp structural transition in our measurements. For the scenario in which
orbital ordering drives the underlying lattice instability, the onset of the C4 symmetry
breaking structural orthorhombicity due to the applied strain field lifts the degeneracy
of the dxz and dyz orbitals and rounds off the orbital ordering transition. This enables a
small but non-zero orbital imbalance at higher temperatures over the regime where the
orthorhombic structure distortion is observed. This orbital configuration potentially
135
promotes AF SDW order and increases the transition temperature TN below which the
required time reversal symmetry breaking takes place.
Our data suggest a reduction in the AF ordered moment of parent BaFe2As2
under uniaxial pressure which is consistent with recent predictions from ab initio
density functional theory (DFT) [36]. Pressure induced changes in pnictogen height
are predicted to modify the resulting ordered moment as in-plane stress is applied;
however we note here that the effect we observe occurs at significantly lower
pressures than those modeled in Ref [36]. It is difficult to completely preclude the
effect of remanant twin domains changing the apparent moment value, but to provide
an estimate, we can simply assume that the structural peaks serve as a reliable
indicator for when the sample has been completely detwinned. Using this assumption,
the ordered moment has been reduced by 12% relative to its stress free value under
the application of ≈2 MPa. Upon doping a slight amount of Co-impurities however,
this effect seems to diminish and the 1% Co-doped sample shows complete
detwinning without an effective AF moment change under similar level of pressure.
The decoupling of TS and TN under uniaxial pressure suggests that the
magnetic order parameter shifts upward in temperature as a secondary effect driven
by the pressure enhanced orthorhombicity of the lattice. This decoupling occurs for
both Co-concentrations measured below the magnetostructural tricritical point in the
electronic phase diagram (x=0, x=0.015), and more generally the separation between
TN and TS appears to depend on the magnitude of applied uniaxial pressure. From
phenomenological models, the differing response of both TS and TN to strain can
readily be explained via the magnetoelastic coupling constant which necessarily
dampens the shift of AF order relative to the shifted temperature at which significant
orthorhombic distortion sets in. Another possible explanation may arise from a
136
varying response of spin-lattice and orbital-lattice coupling strengths which
respectively tune the relative response of AF and structural order parameter to the
applied pressure.
Chapter 7 References
[1] Y. Kamihara, T. Watanabe, M. Hirano, and H. Hosono, J. Am. Chem. Soc. 130,
3296 (2008).
[2] A. Kordyuk, Low Temp. Phys. 38, 888 (2012).
[3] G. Stewart, Reviews of Modern Physics 83, 1589 (2011).
[4] C. de La Cruz, Q. Huang, J. Lynn, J. Li, W. Ratcliff II, J. L. Zarestky, H. Mook,
G. Chen, J. Luo, and N. Wang, Nature 453, 899 (2008).
[5] S. D. Wilson, Z. Yamani, C. Rotundu, B. Freelon, E. Bourret-Courchesne, and R.
Birgeneau, Physical review.B, Condensed matter and materials physics 79, 184519
(2009).
[6] I. R. Fisher, L. Degiorgi, and Z. Shen, Reports on Progress in Physics 74, 124506
(2011).
[7] P. Hirschfeld, M. Korshunov, and I. Mazin, Reports on Progress in Physics 74,
124508 (2011).
[8] P. Dai, J. Hu, and E. Dagotto, Nature Physics 8, 709 (2012).
[9] J. Paglione and R. L. Greene, Nature Physics 6, 645 (2010).
[10] H. Wen and S. Li, Annu.Rev.Condens.Matter Phys. 2, 121 (2011).
137
[11] M. Kim, R. Fernandes, A. Kreyssig, J. Kim, A. Thaler, S. Bud’ko, P. Canfield, R.
McQueeney, J. Schmalian, and A. Goldman, Physical Review B 83, 134522 (2011).
[12] J. Teng, C. Chen, Y. Xiong, J. Zhang, R. Jin, and E. Plummer, Proceedings of the
National Academy of Sciences 110, 898 (2013).
[13] S. Nandi, M. Kim, A. Kreyssig, R. Fernandes, D. Pratt, A. Thaler, N. Ni, S.
Bud’Ko, P. Canfield, and J. Schmalian, Phys. Rev. Lett. 104, 057006 (2010).
[14] W. Lee and C. Wu, Phys. Rev. Lett. 103 (2009).
[15] M. D. Lumsden and A. D. Christianson, Journal of Physics: Condensed Matter
22, 203203 (2010).
[16] J. T. Park, D. S. Inosov, A. Yaresko, et al, Physical Review B 82 (2010).
[17] R. M. Fernandes, A. V. Chubukov, J. Knolle, I. Eremin, and J. Schmalian,
Physical Review B 85 (2012).
[18] S. Kasahara, H. J. Shi, K. Hashimoto, et al, Nature 486, 382 (2012).
[19] E. C. Blomberg, A. Kreyssig, M. A. Tanatar, et al, Physical Review B 85 (2012).
[20] J. Chu, J. G. Analytis, K. De Greve, P. L. McMahon, Z. Islam, Y. Yamamoto,
and I. R. Fisher, Science 329, 824 (2010).
[21] A. Dusza, A. Lucarelli, A. Sanna, S. Massidda, J. Chu, I. R. Fisher, and L.
Degiorgi, New Journal of Physics 14 (2012).
[22] M. Allan, T. Chuang, F. Massee, Y. Xie, N. Ni, S. Bud’ko, G. Boebinger, Q.
Wang, D. Dessau, and P. Canfield, Nature Physics 9, 220 (2013).
138
[23] M. Yi, D. Lu, J. Chu, J. G. Analytis, A. P. Sorini, A. F. Kemper, B. Moritz, S.
Mo, R. G. Moore, and M. Hashimoto, Proceedings of the National Academy of
Sciences 108, 6878 (2011).
[24] L. W. Harriger, H. Q. Luo, M. S. Liu, C. Frost, J. P. Hu, M. R. Norman, and P.
Dai, Physical Review B 84 (2011).
[25] E. C. Blomberg, M. A. Tanatar, A. Kreyssig, N. Ni, A. Thaler, R. Hu, S. L.
Bud'ko, P. C. Canfield, A. I. Goldman, and R. Prozorov, Physical Review B 83
(2011).
[26] S. Liang, A. Moreo, and E. Dagotto, arXiv preprint arXiv:1305.1879 (2013).
[27] M. Nakajima, S. Ishida, Y. Tomioka, K. Kihou, C. Lee, A. Iyo, T. Ito, T.
Kakeshita, H. Eisaki, and S. Uchida, Phys. Rev. Lett. 109, 217003 (2012).
[28] S. Ishida, M. Nakajima, T. Liang, K. Kihou, C. Lee, A. Iyo, H. Eisaki, T.
Kakeshita, Y. Tomioka, and T. Ito, J. Am. Chem. Soc. 135, 3158 (2013).
[29] H. -. Kuo, J. G. Analytis, J. -. Chu, R. M. Fernandes, J. Schmalian, and I. R.
Fisher, Physical Review B 86 (2012).
[30] C. Dhital, Z. Yamani, W. Tian, J. Zeretsky, A. S. Sefat, Z. Wang, R. J.
Birgeneau, and S. D. Wilson, Phys. Rev. Lett. 108 (2012).
[31] Y. Song, S. V. Carr, X. Lu, C. Zhang, Z. C. Sims, N. Luttrell, S. Chi, Y. Zhao, J.
W. Lynn, and P. Dai, Physical Review B 87, 184511 (2013).
[32] A. S. Sefat, R. Jin, M. A. McGuire, B. C. Sales, D. J. Singh, and D. Mandrus,
Phys. Rev. Lett. 101, 117004 (2008).

139
[33] R. Birgeneau, J. Skalyo, and G. Shirane, J. Appl. Phys. 41, 1303 (1970).
[34] A. Cano and I. Paul, Physical Review B 85, 155133 (2012).
[35] J. Hu, C. Setty, and S. Kivelson, Physical Review B 85 (2012).
[36] M. Tomic, H. O. Jeschke, R. M. Fernandes, and R. Valentí, Physical Review B
87, 174503 (2013).

140
Chapter 8: Conclusion and Future Works
The results presented in chapter 4 to 6 helped to increase the present
understanding regarding the electronic/magnetic behavior of the single layer and
bilayer compounds of the Ruddelsden-Popper series oxides. Chapter 4 presents the
result of the neutron scattering study on the single layer compound Sr2IrO4. This
study reveals an antiferromagnetic spin structure lying in the ab plane and oriented
along a unique axis with the ordered moment of 0.36 µB/Ir. This moment is
comparable to that of bilayer compound Sr3Ir2O7. Our results also reveal the presence
of previously unreported structural superlattice peaks suggesting a discrepancy with
the previously reported crystal structures.
In chapter 5, I presented a detailed study of bilayer parent compound Sr3Ir2O7
using magnetotransport, magnetization and neutron scattering studies. My studies of
this bilayer iridate reveal an electronically textured, G-type antiferromagnetic (m // c)
ground state with non-Ohmic behavior at temperature below 70 K with ordered
moment of 0.35 µB/Ir. Neutron diffraction measurements also indicate the presence of
previously unreported structural superlattice peaks persisting at least up to 620 K.
In chapter 6, the results of our comprehensive study on the doped system
Sr3(Ir1-xRux)2O7 using magnetotransport, magnetization, scanning tunneling
microscopy, and neutron scattering are presented. Here, we are able to map out the
complete electronic/magnetic phase diagram with identification of multiple phases
coexisting together. Our study gives a detailed picture of how the electronic/magnetic
behavior of this system evolves as the system is doped progressively from AF
insulator (Sr3Ir2O7) to a Fermi liquid metal (Sr3Ru2O7). Given the doubt about the
importance of electronic correlations in this bilayer parent material, our results argue
141
for the substantial role of electronic correlations in this otherwise weakly correlated
insulating compound.
Our neutron scattering studies exploring the effect of uniaxial pressure on the
structural and magnetic phase behaviors of parent and underdoped high temperature
superconducting system Ba (Fe1-xCox) 2As2 were discussed in Chapter 7. We found a
dramatic, upward thermal shift in both TS and TN upon the application of the uniaxial
pressure. Curiously, the upward shift of TN remains almost independent of doping for
the same level of uniaxial pressure.
In this work, we found two problems regarding the discrepancy in the reported
iridate crystal structures but we do not have the solutions yet. The future work should
be focused on the detailed single crystal structural analysis of both the single layer
and bilayer compound. In our doping studies, various factors may come into play at
the same time e.g change in disorder, change in spin-orbit interactions, change in
carrier density etc. A systematic study can be done by varying only one parameter
keeping others fixed which may be done by doping other candidates cation elements
e.g Rh, Os, Pt etc.
In iron based superconductors, similar pressure studies can be done either with
other dopants on the same site (Fe site) or to the different site (As or Ba site).
Furthermore, there is some debate about the nature of this effect whether that is
intrinsic or extrinsic. This can be done by doing thorough annealing studies.
Although, the definition of TS becomes unclear in presence of symmetry breaking
uniaxial pressure, inelastic scattering measurements can also be performed to look for
the phonon softening in presence of uniaxial pressure. With alignment of many
pressurized crystals together, similar studies can also be performed exploring the low
energy spin dynamics of this system in the presence of uniaxial pressure.
142
Appendix
A.Some Facts about Magnetic Neutron Scattering
Neutron scattering is an ideal method for magnetic structure and ordered moment
determination. The prediction of moment direction and the ordered moment depends
upon following key facts about the magnetic neutron scattering.
(1) Neutrons can only measure the component of ordered moment that is
perpendicular to the scattering vector Q. If the moments are pointing along the
scattering vector then the intensity of magnetic scattering is zero.
(2) The magnetic scattering generally decreases with increasing Q due to decrease
in the magnetic form factor. Depending upon the lattice parameters of the
crystal, a right instrument has to be chosen so that one cannot miss the
magnetic scattering present at low Q. The magnetic scattering also decreases
with increasing temperature (in general). But the most definitive way to
distinguish magnetic and nuclear scattering is by doing polarized neutron
experiment.
(3) The identification of magnetic propagation vector K which defines the relative
orientation of the moments in the lattice. For two sites m and n, the spin in site
n is related to that in site m by a relation Sn=Sm exp (iK.R), where R is the
vector connecting two sites.
(4) The size of magnetic unit cell which can be same as the crystallographic unit
cell or different from crystallographic unit cell. For example in case of
ferromagnetic structure with magnetic wave vector K = (0, 0, 0) the magnetic
and crystallographic unit cell will be same. For antiferromagnetic structure
with magnetic wave vector (0.5, 0, 0), the magnetic unit cell will be doubled

143
along a axis whereas it is same as crystallographic unit cell along b and c axis.
Similarly for antiferromagnetic spin arrangement with (0.5, 0.5, 0), the
magnetic unit cell is doubled along a and b axis but remains same along c axis.
But in this case, the common practice is to use the orthorhombic unit cell
2 2a b as the magnetic unit cell where the volume of magnetic unit cell is
two times ( 2 2 ) the crystallographic unit cell. This is the case in our
moment calculation for Sr3Ir2O7 where we assumed orthorhombic unit cell as
the magnetic unit cell. For Sr2IrO4, the crystal structure I41/acd is already a
distorted tetragonal structure thus we assumed this unit cell as the magnetic
unit cell.
(5) The occupancy of each magnetic atom in the unit cell e.g for a cubic or
tetragonal or orthorhombic system, if the magnetic atom is fully inside the unit
cell then the occupancy is 1. If it is at the center of face then occupancy is 2. If
it is at the center of edge then occupancy is 4 and if it is at the corner then
occupancy is 8.
(6) The fractional coordinates of all the magnetic atoms in the unit cell which can
be obtained by visualization of the magnetic structure using crystal structure
analysis software. The crystal and magnetic structure analysis software can
also be used.
(7) In neutron scattering experiment, the observed intensity is the final result after
considering several different instrumental (collimation, masking, detector
efficiency, filtering, background, incident flux etc.) and sample parameters
(absorption, extinction, mosaic, volume/mass of sample, temperature etc).
Thus, rather than defining the absolute intensity, only relative intensity is a
meaningful quantity. In nuclear scattering, the expected intensity for a certain

144
Q position can be calculated using different structural analysis software like
Fullprof or GSAS. Thus, in practice, the nuclear scattering intensity is
measured at different Q positions and comparing them with the expected
intensity a scale factor is defined. This scale factor is in turn used for scaling
magnetic intensity.
B. Calculation of the Scale Factor (S):
(In this section the temperature factor and the absorption effects are not taken into
account)
For single crystal diffraction using the triple axis spectrometer, the scale factor (S) is
defined by the relation [1]
22
2
( )( )
1 ( )
Nobs
N
N
S F QF Q
B F Q
(B1)
Where B is the extinction factor. 2
( ) ( )sin(2 )obs
N NF Q I Q . IN(Q) is the integrated
intensity (integrated over Q) of nuclear peak at position Q and θ is the Bragg angle
for that nuclear peak. 2
( )NF Q is the expected square of structure factor for the
corresponding nuclear peak . The structure factor FN can be calculated using the
relation
( ) exp( . )N j j j
j
F Q O b i Q d (B2)
Where sum is over all j atoms in the crystallographic unit cell, bj is the coherent
nuclear scattering length for atom j which can be found in different data bases and Oj
is the fractional occupancy of jth
atom in the unit cell. Q = [2πH/a, 2πK/b, 2πL/c],
which a, b, c as the lattice parameters, H, K, L refer to the position of the peak in
reciprocal lattice unit. dj=[axj, byj,czj] is the vector connecting the jth
atom to the
origin of the unit cell and xj,yj, zj are the fractional coordinates of the jth
atom. During

145
an experiment a radial scan is performed across multiple nuclear peaks and hence the
integrated intensity IN(Q) is obtained. The scale factor S can be obtained by fitting
equation (B1). If there are not enough nuclear peaks to fit Equation (B1) then the best
way is to do the radial scan across a single nuclear peak that is very close to magnetic
peak in Q. In this case the scale factor S can be approximately defined using B=0 in
Equation (B1). This approximation works best if the extinction effect is small which
was in fact the case throughout the work described in this thesis.
C. Calculation of Magnetic Structure Factor and Ordered Moment
Now for the magnetic scattering, the magnetic structure factor is given by
15( ) 2.695 10 ( )( )exp( )mag j j j
j
F o f Q jj jQ μ ×Q×μ Q d (C1)
Where oj is the fractional occupancy of magnetic atom in the unit cell, μj is the
ordered moment of jth
atom, j
μ is the unit vector along jμ , Q is the unit vector along Q,
fj(Q) is the magnetic form factor for jth
atom. The sum is taken over all the magnetic
atoms in the unit cell. Now the integrated area of the observed magnetic peak is given
by
2
( )( )
sin(2 )
mag
mag
F QI S
Q (C2)
Using equations B1, B2, C1 and C2, the ordered magnetic moment μj of jth
atom can
be calculated. In our study for Sr3Ir2O7 and Sr2IrO4 there is only one kind of magnetic
atom Iridium (Ir4+
) whereas the magnetic atom in BaFe2As2 is iron (Fe2+
).The form
factor for iridium was obtained by using Jo and J2 as described in paper by Koyabashi
et al [2] and for the iron the form factor was obtained by using coefficients given in
ref [3]. As an illustration here is a list of all the magnetic atoms in magnetic unit cell
(orthorhombic structure) along with their fractional occupancies in Sr3Ir2O7. a ≈ b ≈
5.5Å,c≈20.89Å.
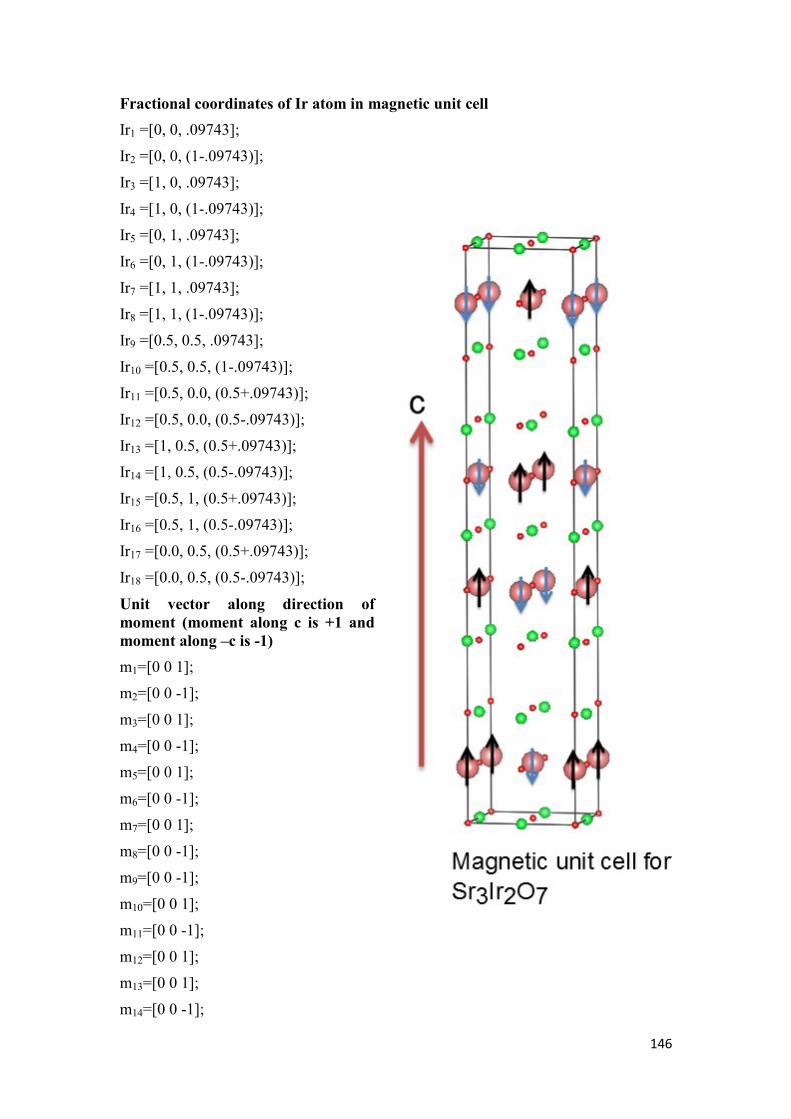
146
Fractional coordinates of Ir atom in magnetic unit cell
Ir1 =[0, 0, .09743];
Ir2 =[0, 0, (1-.09743)];
Ir3 =[1, 0, .09743];
Ir4 =[1, 0, (1-.09743)];
Ir5 =[0, 1, .09743];
Ir6 =[0, 1, (1-.09743)];
Ir7 =[1, 1, .09743];
Ir8 =[1, 1, (1-.09743)];
Ir9 =[0.5, 0.5, .09743];
Ir10 =[0.5, 0.5, (1-.09743)];
Ir11 =[0.5, 0.0, (0.5+.09743)];
Ir12 =[0.5, 0.0, (0.5-.09743)];
Ir13 =[1, 0.5, (0.5+.09743)];
Ir14 =[1, 0.5, (0.5-.09743)];
Ir15 =[0.5, 1, (0.5+.09743)];
Ir16 =[0.5, 1, (0.5-.09743)];
Ir17 =[0.0, 0.5, (0.5+.09743)];
Ir18 =[0.0, 0.5, (0.5-.09743)];
Unit vector along direction of
moment (moment along c is +1 and
moment along –c is -1)
m1=[0 0 1];
m2=[0 0 -1];
m3=[0 0 1];
m4=[0 0 -1];
m5=[0 0 1];
m6=[0 0 -1];
m7=[0 0 1];
m8=[0 0 -1];
m9=[0 0 -1];
m10=[0 0 1];
m11=[0 0 -1];
m12=[0 0 1];
m13=[0 0 1];
m14=[0 0 -1];
147
m15=[0 0 -1];
m16=[0 0 1];
m17=[0 0 1];
m18=[0 0 -1];
Fractional occupancies
O1=0.25;
O2=0.25;
O3=0.25;
O4=0.25;
O5=0.25;
O6=0.25;
O7=0.25;
O8=0.25;
O9=1;
O10=1;
O11=0.5;
O12=0.5;
O13=0.5;
O14=0.5;
O15=0.5;
O16=0.5;
O17=0.5;
O18=0.5;
Appendix References
[1] Z. Yamani, Z. Tun, and D. Ryan, Can. J. Phys. 88, 771 (2010).
[2] K. Kobayashi, T. Nagao, and M. Ito, Acta Crystallographica Section A:
Foundations of Crystallography 67, 473 (2011).
[3] https://www.ill.eu/sites/ccsl/ffacts/ffachtml.html
148
Publications List
[1] C. Dhital, D. L. Abernathy, G. Zhu, Z. Ren, D. Broido, and S. D. Wilson,
Physical Review B 86, 214303 (2012).
[2] C. Dhital, C. de La Cruz, C. Opeil, A. Treat, K. Wang, J. Liu, Z. Ren, and S. D.
Wilson, Physical Review B 84, 144401 (2011).
[3] C. Dhital, T. Hogan, Z. Yamani, C. de la Cruz, X. Chen, S. Khadka, Z. Ren, and
S. D. Wilson, Physical Review B 87, 144405 (2013).
[4] C. Dhital, T. Hogan, W. Zhou, X. Chen, Z. Ren, M. Pokharel, Y. Okada, M.
Heine, W. Tian, and Z. Yamani, Nature communications 5 (2014).
[5] C. Dhital, S. Khadka, Z. Yamani, C. de la Cruz, T. Hogan, S. Disseler, M.
Pokharel, K. Lukas, W. Tian, and C. Opeil, Physical Review B 86, 100401 (2012).
[6] C. Dhital, Z. Yamani, W. Tian, J. Zeretsky, A. Sefat, Z. Wang, R. Birgeneau, and
S. D. Wilson, Phys. Rev. Lett. 108, 087001 (2012).
[7] S. Disseler, C. Dhital, A. Amato, S. Giblin, C. de la Cruz, S. D. Wilson, and M.
Graf, Physical Review B 86, 014428 (2012).
[8] S. Disseler, C. Dhital, T. Hogan, A. Amato, S. Giblin, C. de la Cruz, A. Daoud-
Aladine, S. D. Wilson, and M. Graf, Physical Review B 85, 174441 (2012).
[9] S. Disseler, S. Giblin, C. Dhital, K. Lukas, S. D. Wilson, and M. Graf, Physical
Review B 87, 060403 (2013).
[10] Y. Okada, C. Dhital, W. Zhou, E. D. Huemiller, H. Lin, S. Basak, A. Bansil, Y.
Huang, H. Ding, and Z. Wang, Phys. Rev. Lett. 106, 206805 (2011).

149
[11] Y. Okada, D. Walkup, H. Lin, C. Dhital, T. Chang, S. Khadka, W. Zhou, H.
Jeng, M. Paranjape, and A. Bansil, Nature materials 12, 707 (2013).
[12] Y. Okada, W. Zhou, C. Dhital, D. Walkup, Y. Ran, Z. Wang, S. D. Wilson, and
V. Madhavan, Phys. Rev. Lett. 109, 166407 (2012).
[13] Y. Okada, W. Zhou, D. Walkup, C. Dhital, S. D. Wilson, and V. Madhavan,
Nature communications 3, 1158 (2012).
[14] Y. Okada, M. Serbyn, H. Lin, et al, Science 341, 1496 (2013).
[15] S. D. Wilson, Z. Yamani, C. Dhital, B. Freelon, P. Freeman, J. Fernandez-Baca,
K. Yamada, S. Wakimoto, W. Buyers, and R. Birgeneau, Physical Review B 85,
014507 (2012).
[16] D. DeMeo, C. Shemelya, C. Downs, A. Licht, E. S. Magden, T. Rotter, C.
Dhital, S. Wilson, G. Balakrishnan, and T. E. Vandervelde, J Electron Mater, 1
(2014).

150
VITA Chetan Was born in Bahundangi Nepal in September 1978. After passing SLC (School
leaving certificate) from Bhanu secondary school in his hometown, he joined Tribhuvan
university where he earned his intermediate and Bachelor in physical sciences and
finally Master in physics in 2005. He then taught physics to undergraduate students in
Damak Multiple Campus Jhapa for 3 years. He joined Boston college in 2008 and
received his PhD in Physics in May 2014.