correct interpretation of chemical diagrams requires transforming from one level of representation...
TRANSCRIPT
Correct Interpretation of Chemical Diagrams RequiresTransforming from One Level of Representationto Another
Gail Chittleborough & David Treagust
Published online: 30 September 2007# Springer Science + Business Media B.V. 2007
Abstract Volunteer non-major chemistry students taking an introductory universitychemistry course (n=17) were interviewed about their understanding of a variety ofchemical diagrams. All the students’ interviewed appreciated that diagrams of laboratoryequipment were useful to show how to set up laboratory equipment. However students’ability to explain specific diagrams at either the macroscopic or sub-microscopic levelvaried greatly. The results highlighted the poor level of understanding that some studentshad even after completing both exercises and experiments using the diagrams. Theconnection between the diagrams of the macroscopic level (equipment, chemicals), the sub-microscopic level (molecular) and the symbolic level (equations) was not alwaysconsidered explicitly by students. The results indicate a need for chemical diagrams to beused carefully and more explicitly to ensure learner understanding. Correspondingly,students need to interpret visual chemical diagrams using meta-visualization skills linkingthe various levels of representation, and appreciating the role of the diagrams inexplanations need to be developed.
Keywords Chemical diagrams . Chemistry . Representations . Explanations . Non-major .
First-year university
Introduction
Chemical diagrams were intentionally introduced into the pre-laboratory exercises in anintroductory university course to improve the pedagogical approach to teaching chemistry
Res Sci Educ (2008) 38:463–482DOI 10.1007/s11165-007-9059-4
G. Chittleborough (*)Deakin University, 221 Burwood Highway, Burwood, Victoria 3125, Australiae-mail: [email protected]
D. TreagustCurtin University of Technology, GPO Box U1987, Perth, WA 6845, Australiae-mail: [email protected]
based on the assumption that students would be better prepared for the laboratory activitiesthrough using and interpreting chemical drawings of the chemical equipment. Specifically,the study was designed to investigate how students with limited previous chemistryknowledge interpreted diagrams of chemical equipment at the macroscopic and sub-microscopic levels.
The objective of introducing online pre-laboratory exercises was to have studentsidentify the aim of the weekly experiments, to show students pictures and diagrams ofunfamiliar equipment, to outline the methods and the sequence of events, to encouragestudents to read the laboratory manual more carefully and to promote students’ confidencein the subject. Consequently, this paper reports on the introduction of the online pre-laboratory exercises with respect to students’ appreciation and interpretation of the chemicaldiagrams used in the exercises. Diagrams and illustrations are universally accepted asbeneficial learning tools in many disciplines (Stieff et al. 2005). The pedagogical value ofdiagrams can be considered with respect to the characteristic, purpose and use of thediagram.
A chemical diagram is a representation in one or more of a multitude of forms such as aschematic, illustrative or symbolic representation. Scientific diagrams are generally labelleddiagrams, often drawn to a scale, providing an accurate representation. The significantcharacteristics of chemical diagrams are in the visual impact provided by both themacroscopic and sub-microscopic levels. The visual impact of diagrams can enhance thedevelopment of mental models and lead to more connectedness in learning (Fiorea et al.2003). A chemical diagram can have one or more of a multitude of purposes, namely forexplanation, description, instruction and to provide a mental picture. A multi-modalapproach provides learners with the opportunity to synthesize their own mental model.
The value of a diagram in making the link with an abstract concept depends on it beingconsistent with the learners’ needs and being pitched at the learners’ level of understanding(Giordan 1991). Gobert and Clement (1999) suggest that diagrams can have more thanillustrative purposes, expanding the purpose of diagrams to model construction andreasoning. In this way, chemical diagrams serve as significant teaching tools; however, thevalue depends on the students’ understanding of the diagram.
While the characteristics and purpose of diagrams are important, the way the diagram isused in the instruction is equally important. Flow charts, Venn diagrams, Vee diagrams andconcept maps are examples of diagrams in which students diagrammatically represent theirunderstanding (Davidowitz and Rollnick 2003; Novak 1990; Novak and Gowin 1984).These diagrams are pedagogically powerful because students have to actively construct therepresentation of their understanding and strategies for using these active diagrams are welldocumented (Davidowitz and Rollnick 2003; Novak 1990; Novak and Gowin 1984). Bycontrast, diagrams of laboratory equipment are passive diagrams, presenting information tostudents. These traditional diagrams are consistent with transmission-style pedagogy whenit is assumed that no specific strategy is needed to ensure student understanding.
Chemistry is unique because of its dual characteristics: the real and visible characteristicsof the macroscopic level and the real and “invisible” characteristics of the sub-microscopiclevel. The sub-microscopic level is as real as the macroscopic level – it is only the scale thatdistinguishes it, and the fact that the sub-microscopic level cannot be seen makes it hard toaccept as real. Because these students were found to have poor mental models of the sub-microscopic level of matter, the addition of visual stimulus was provided to enhancestudents’ ability to construct their own mental model. Consequently, chemical diagrams atthe macroscopic and sub-microscopic level were intentionally included so that studentsexperienced a variety of chemical diagrams.
464 Res Sci Educ (2008) 38:463–482
Quality representations can promote engagement and motivation, but understanding isdependent on the user being able to map the target and the representation inherent in thevisual, relating to previous knowledge and being cognisant of the metaphors that are beingused (Skamp 1996).
Chemists are now able to observe atoms or molecules, using an electron microscope;however it is not possible to see how the atoms interact. For these interactions, chemistsrely on theories and in turn develop and utilise models that reveal and describe the theory.When “envisaging” an atom, chemists and students alike are picturing a model of an atomor a number of pictures of atoms based on various models (Taber 2003). In this way,chemical diagrams play a very important role in describing the models that are used torepresent chemical matter.
Johnstone (1982, 1993) distinguished three levels of chemical representation of matter:the macroscopic level – the visible chemicals, the sub-microscopic level – the particulatelevel and the symbolic level – including diagrams. Explanations of chemical phenomenausually rely on the behaviour of the sub-microscopic particles. Johnstone (1982) describesthe macroscopic level as descriptive and functional, and the sub-microscopic level asrepresentational and explanatory. Chemical diagrams commonly represent both themacroscopic and sub-microscopic representations, and therefore it is relevant to investigatestudents understanding of both levels of representation. The term visualization is usedextensively in chemical education research because of the need to provide a visual link tothe abstract particulate nature of matter (Balaban 1999). The sub-microscopic level cannotbe seen but it is an essential component of chemistry and in order to teach about it,representations such as chemical diagrams are utilised to achieve this. An explanatory toolsuch as a diagram or an image can provide the learner with a way of visualizing the conceptand hence developing a mental model for the concept (Gabel 1998).
A chemical diagram can include one or more levels of representation of matter: forexample, a chemical diagram of distillation equipment, includes chemicals represented atthe macroscopic level such as a liquid in the flask, and a diagram of a structural formula fora compound is a symbolic representation of the sub-microscopic level of matter. Gilbertproposes that using visual representations, such as chemical diagrams, involves more thanforming a mental image but rather involves metacognition, requiring the learner to navigatethrough multiple images, make assessments and interpretations of images. This skill Gilbert(2005) refers to as metavisualization that is “metacognition in respect of visualization”(p. 15). Because students’ visualization skills and their metavisual capacity impact on theirlearning, these need to be considered in pedagogical approaches (Kozma and Russell 2005).This concept of visual literacy is important for learning. Gilbert (2005) points out the needfor students to be aware of the conventions of diagrammatic representations and the scopeand limitations of each diagrammatic mode.
Objective of the Study
The overall objective of the research was to improve the learning situation for non majorchemistry students with weak chemistry backgrounds by introducing chemical diagramsinto the pre-laboratory exercises. This study investigated two research questions: What arestudents’ understandings of chemical diagrams? and, How do students’ understandings ofchemical diagrams influence their understanding of chemical concepts? The desiredoutcome was for students to be better prepared for laboratory sessions and improve their
Res Sci Educ (2008) 38:463–482 465
ability to understand experiments. By making students use diagrams in an active manner –that requires interpretation – students should become more familiar with diagrams and theirunderstandings of chemical diagrams should be improved. These outcomes are dependenton the diagrams being beneficial learning tools and on the students being able to fullyunderstand the diagrams.
Methodology
The university students involved in this study are generally “interested in their ownlearning, displaying qualities such as being discerning, pragmatic, critical and analytical intheir attitude towards their learning” (Chittleborough et al. 2005). While their knowledge ofchemistry is generally limited, their knowledge of the role of generic diagrams in theprocess of learning is typical of experienced learners (Chittleborough et al. 2005). Thisdegree of knowledge is relevant to their responses to questions about the role of diagramsof chemical equipment for their learning of chemistry (Bransford et al. 2000).
Design
When designing the pre-laboratory exercises, chemical diagrams were intentionallyincluded to provide learners with visual tools to help students become familiar withlaboratory equipment related to the weekly experiments and enhance explanations ofchemical concepts. Chemical diagrams of the sub-microscopic level of matter wereincluded to help students develop a mental model of the sub-microscopic level of matter.Students primarily used the laboratory notes and course notebook which were printed bythe university in an economical format – black and white print with very few diagrams.This meant that students did not use many diagrams. However, colour diagrams of themacroscopic and sub-microscopic levels of chemical representation displaying chemicalequipment and chemical explanations were included in the online pre-laboratoryexercises. The exercises required the students to make an interpretation using thediagram.
In this study, an intervention program was introduced whereby students had to completeonline pre-laboratory exercises before each of the 11 laboratory classes. In designing thepre-laboratory exercises, chemical diagrams of the laboratory equipment were includedwith the aim of improving familiarity with equipment, understanding how the equipmentfunctioned and improving the explanations of chemical phenomena. Students were requiredto interpret diagrams in order to complete the exercises using online pre-laboratoryexercises that provided immediate feedback on their response and an opportunity to redothe exercise if their response was incorrect. The students performed experiments thatcommonly used equipment that was portrayed in the diagrams.
Students’ ability to understand and learn chemistry was constrained by a lack of mentalmodel of the sub-microscopic level of matter, their prior knowledge of chemistry, theassessment style of the course, the small number of chemical representations encounteredby the student, the large amount of content, the speed with which the chemistry content hadto be assimilated by the learner and a lack of motivation by the student to understandchemistry at a deeper level (Chittleborough et al. 2002). Students intentions were common-ly to pass this course, a compulsory component of their science degree; not necessarilyhaving a desire or high motivation to learn chemistry. In meeting the needs of this cohort of
466 Res Sci Educ (2008) 38:463–482
students pedagogical changes were made in order to create a more interactive learningenvironment that provided greater visual stimulus and better explanations. To this end,weekly compulsory on-line pre-laboratory exercises were introduced to better preparestudents for the weekly experiment and provide basic information for students with little orno chemical background.
Students were required to access, complete and submit their answers to the pre-laboratory exercises electronically prior to the laboratory class each week. The exerciseswere deliberately designed to be straightforward and uncomplicated, endeavouring to helpthe students understand the practical and theoretical aspects of the experiment and toprovide positive feedback.
The online pre-laboratory exercises were designed to take approximately 10–20minutes per week to complete and were worth 2% of the students’ total marks. Eventhough the value of the task is very small, it was compulsory and designed to be alearning opportunity rather than an assessable task. Each week, there were on averageabout eight questions of varying formats including multiple-choice, short-answer ormatching. The web-based assessment provided students with immediate feedback. Thecorrect answers were positively reinforced and for incorrect answers hints were given tohelp students identify any misconceptions. The desired outcomes of this project were toimprove links between theory and practical work and provide immediate feedbackto students.
Participants
This study involved university students undertaking a non-major chemistry course whileenrolled in degree courses such as Environmental Biology, Health Sciences, HumanBiology, and Environmental Health. Of the 122 students enrolled in the introductory first-year university chemistry course, 17 students volunteered to be interviewed about thechemical diagrams. The selection was not random; rather volunteers were invited toparticipate. This interview sample group of six (35%) males and 11 (65%) females includedmore females than were representative in the enrolled population of 46% males and 54%females. The age range of the interview group comprised eight students who had attendedhigh school the previous year and nine who attended school from two to 15 years ago. Theage range of the enrolled students is not available. The academic ability of the interviewgroups was not ascertained, however all students taking this unit had limited or no chemicalbackground knowledge.
The tuition for the course consists of a one-hour lecture and a three-hour laboratorysession per week. The students are motivated to pass the course because it is a compulsorycomponent of the degree course, but they generally do not continue with chemistry afterfirst year and it is not their major area of study. Characteristically, students entering thiscourse have weak background knowledge in mathematics and chemistry (Chittleboroughet al. 2002).
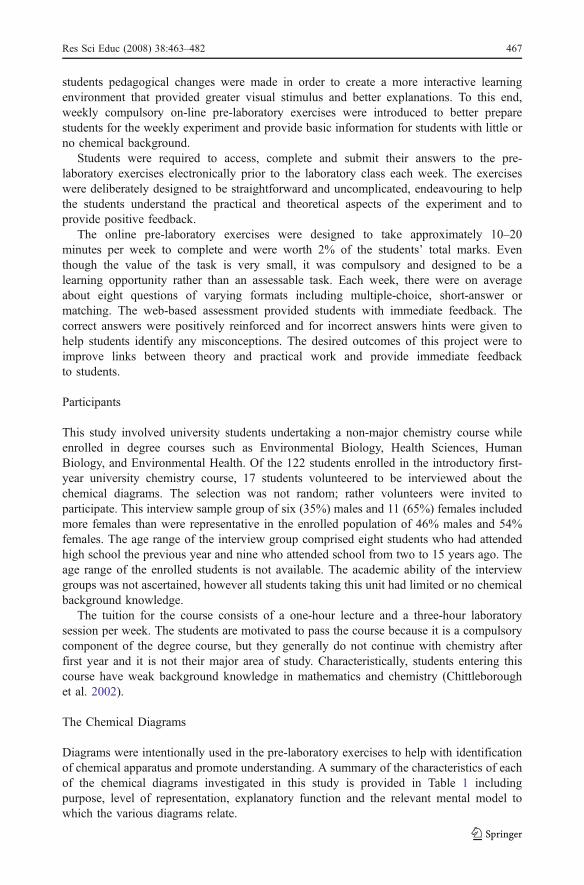
The Chemical Diagrams
Diagrams were intentionally used in the pre-laboratory exercises to help with identificationof chemical apparatus and promote understanding. A summary of the characteristics of eachof the chemical diagrams investigated in this study is provided in Table 1 includingpurpose, level of representation, explanatory function and the relevant mental model towhich the various diagrams relate.
Res Sci Educ (2008) 38:463–482 467
Tab
le1
Descriptio
nof
thelevelsof
representatio
nof
matterin
thechem
ical
diagramsinvestigated
inthestudy
Diagram
sDescriptio
n/Purpose
Levelsof
representatio
nExplanatio
nMentalmodel
ofchem
istry
Assertio
n
1Distillatio
nDescriptiv
eandillustrative–The
apparatusandtheirfunctio
nMacroscopic
Apparatus
createschangesin
state
from
liquid–
vapour–liquid
Sub-m
icroscopic
ofliq
uid–
vapour–
liquidstates.
1,2,
3
Fractionaldistillation
Descriptiv
eandExplanatory
and
Illustrativ
eMacroscopic
andsub-
microscopic
Apparatus
createschangesin
state
from
liquid–
vapour–liquid
Sub-m
icroscopic
ofliq
uid–
vapour–
liquidstates.
2,3,
4,,
2.Gravity
andvacuum
distillation
Filter
paperin
funnel,andBuchner
funnel
Macroscopic
Separationof
solid
material
Separatingsolid
from
liquidmaterials–
atamacroscopic
level.
1,2,
3
3.Colour
chromatography
Partsof
theapparatusandtheirfunctio
nMacroscopic
Variablerate
dependson
their
degree
ofsolubility
Molecular
movem
entdependson
itssolubility–lin
ksto
sub-microscopic
level
1,2,
3,
4.Equilibrium
Macroscopic
observations
Macroscopic
plus
annotatio
nsat
thesub-microscopic
level
Identifying
thereactio
nsand
responsesto
change
Sub-m
icroscopic
movem
ent
1,2,3,4
5.Statesof
matter
Representationof
threestates
ofmatter
usingspheres
Sym
bolic
representatio
nof
thesub-microscopic
level
Using
theparticulatenature
ofmatterto
explainchangesof
state
Linking
themacroscopic
levelwith
the
sub-microscopic
representatio
n1,3,
6.Refluxequipm
ent
(saponification)
Boilin
gandreflux
ofaliq
uid
Macroscopic
Changingfrom
liquidto
gasand
back
toliq
uid
Refluxing
processprovides
anopportunity
forthereactio
nto
occur
1,2,3,4,
7.Molecular
form
ula
Sym
bolic
representatio
nsSym
bolic
representatio
nof
themolecular
form
ula
Lim
itatio
nsof
thesymbolic
representatio
nNeedto
convertthemolecular
form
ula
into
structural
form
ula
2,3
8.Structuralform
ula
Sym
bolic
structural
representatio
nsSym
bolic
representatio
nof
thesub-microscopic
level
Lim
itatio
nsof
thesymbolic
representatio
nof
thesub-
microscopic
level
Picturing
adouble
bond
inamolecule
2,3
9.Titrationcurves
Graph
ofthechange
inpH
ofasolutio
nSym
bolic
representatio
nConnectingthechanging
pHto
the
changing
chem
ical
compositio
nReactionmechanism
occurring
2,3,4,
10.Indicators,salts
andbuffers
Picture
ofthecolour
ofan
indicatorin
solutio
nsof
varyingH+concentration
Macroscopic
Sym
bolic
level
Identifying
chem
ical
change
with
know
nindicators
+Chemical
reactio
nof
indicatorto
H+
concentration
1,2,3,4,
11.Alcoholsand
phenols
Various
symbolic
representatio
nsSym
bolic
representatio
nsof
thesub-microscopic
level
Recognising
chem
ical
characterand
linking
tothephysical
properties
Linking
atom
icstructurewith
chem
ical
properties
1,2,3
12.Aldehydes
and
ketones,
carboxylic
acids
Various
symbolic
representatio
nsSym
bolic
representatio
nsof
thesub-microscopic
level
Recognising
chem
ical
characterand
linking
tothephysical
properties
Linking
atom
icstructurewith
chem
ical
properties
1,2,3
468 Res Sci Educ (2008) 38:463–482
Data Sources
Enrolled Students
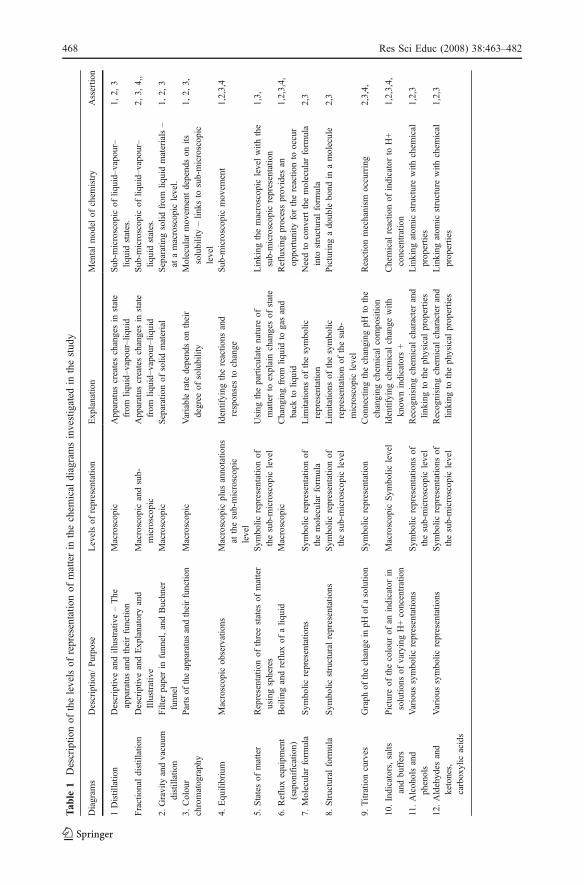
The weekly online pre-laboratory exercises included chemical diagrams which students hadto use to complete the exercises. The mean, standard deviation and item discriminationvalues for all the enrolled students’ responses to exercises (n=122) are shown in Tables 2,3, 4, 5, 6. The item discrimination refers to the ability of an item to differentiate amongstudents on the basis of their responses. The item discrimination index is a correlationbetween student responses to a particular item and total scores on all other items on theweekly exercises. Item discrimination is "good" if the index is above .30; “fair” if it isbetween .10 and .30; and “poor” if it is below .10. For most questions the itemdiscrimination values were good.
Volunteer Students
The volunteer students were interviewed in two series – after week 5 and week 12 of the12-week semester about their understanding of chemical diagrams from the pre-laboratoryexercises. The interviews for the first series (n=17) were conducted individually (n=5) andin groups, depending on students’ availability (4 pairs and one group of four). Theinterviews for the second series questioned students about diagrams from weeks 6–11. Thissmaller group of five students had some of the same students from the first series but somedifferent students. Some students were more comfortable being interviewed in a groupsituation and there is evidence from the data that they listened and learnt from each otherduring the interview. With group interviews, the interviewer attempted to elicit eachstudent’s opinions through directed questioning. Each interview took approximately onehour. In the interview, students were asked to relate the diagrams to their laboratoryexperience, for example: What does the diagram show? What is happening to the mixture inthe distilling flask? Has the image supported what you already know?
The number of students completing the first series of interviews fluctuated from 15 to 17with pressures of time and other commitments – with some interviews not completing the
Table 2 Results for the online pre-laboratory questions relating to the distillation diagram (n=122)
Question Discrimination Mean%
SD
Q1 Matching the names with the meanings of the parts of the distillation equipment 0.47 83.5 28.2Q2 How must the water flow through the condenser? 0.56 46.7 50.1Q3 Why is a heating mantle used? 0.36 63.1 48.4Q4 Where must the thermometer be placed in the distillation apparatus and why? 0.51 76.2 42.7
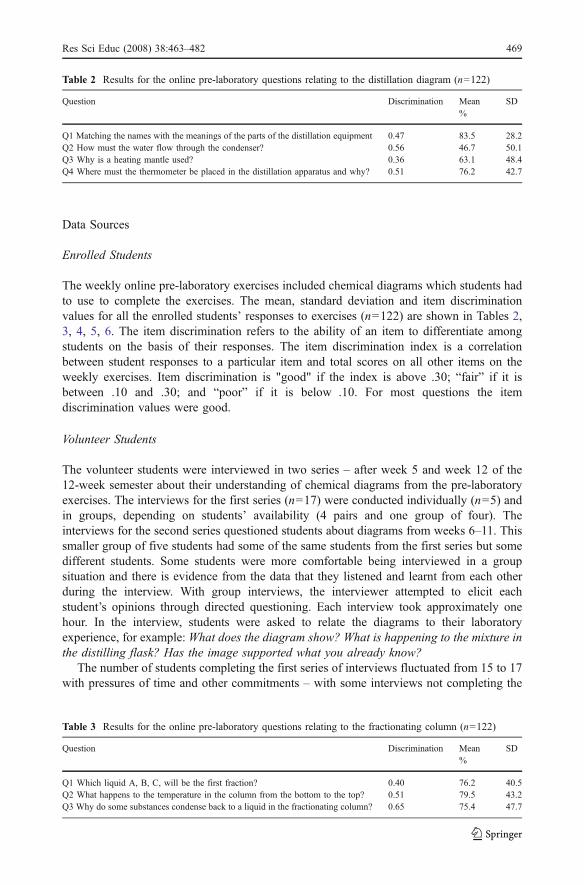
Table 3 Results for the online pre-laboratory questions relating to the fractionating column (n=122)
Question Discrimination Mean%
SD
Q1 Which liquid A, B, C, will be the first fraction? 0.40 76.2 40.5Q2 What happens to the temperature in the column from the bottom to the top? 0.51 79.5 43.2Q3 Why do some substances condense back to a liquid in the fractionating column? 0.65 75.4 47.7
Res Sci Educ (2008) 38:463–482 469
questions about all the diagrams. In the second series, the number of students participatingwas reduced to five because of exam pressures and difficulty in organising interview times.In reporting the results pseudonyms are used. The transcripts were coded using N-Vivo interms of relevant aspects of students’ understanding. An associate acted as an independentresearcher (Merriam 1998) crosschecking the coded categories and the coded text to verifycoding accuracy.
Analysis
The data for the enrolled students were considered alongside the interview data from thevolunteers when making inferences and drawing conclusions; however, the generalisabilityof the data was limited due to the small size of the interview sample and the variationwithin the interview sample compared with that of the enrolled class.
The analysis was based on multiple student responses to a variety of types ofdiagrammatic representations (see Table 1) (Chittleborough 2004). Direct and indirectquestions were used to delve into students’ understanding of both the chemical content andtheir learning. The interview responses provided data about the students’ perspective oftheir understanding of the chemical content and of the way they were interpreting and usingthe diagram to learn. All interviews were conducted by the first author, providing reliabilityto the qualitative data collection. Similarly, the analysis was conducted primarily by the firstauthor, with crosschecking by associates to reduce the influence of any biases.
Results
Selected representative research data are presented to respond to the research questions: Whatare students’ understandings of chemical diagrams, and, How does students’ understandings
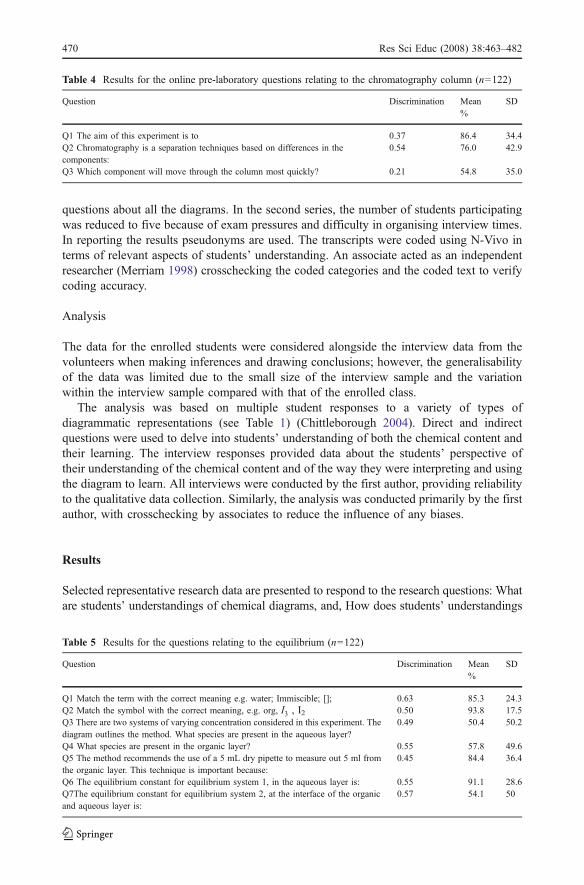
Table 4 Results for the online pre-laboratory questions relating to the chromatography column (n=122)
Question Discrimination Mean%
SD
Q1 The aim of this experiment is to 0.37 86.4 34.4Q2 Chromatography is a separation techniques based on differences in thecomponents:
0.54 76.0 42.9
Q3 Which component will move through the column most quickly? 0.21 54.8 35.0
Table 5 Results for the questions relating to the equilibrium (n=122)
Question Discrimination Mean%
SD
Q1 Match the term with the correct meaning e.g. water; Immiscible; []; 0.63 85.3 24.3Q2 Match the symbol with the correct meaning, e.g. org, I�3 , I2 0.50 93.8 17.5Q3 There are two systems of varying concentration considered in this experiment. Thediagram outlines the method. What species are present in the aqueous layer?
0.49 50.4 50.2
Q4 What species are present in the organic layer? 0.55 57.8 49.6Q5 The method recommends the use of a 5 mL dry pipette to measure out 5 ml fromthe organic layer. This technique is important because:
0.45 84.4 36.4
Q6 The equilibrium constant for equilibrium system 1, in the aqueous layer is: 0.55 91.1 28.6Q7The equilibrium constant for equilibrium system 2, at the interface of the organicand aqueous layer is:
0.57 54.1 50
470 Res Sci Educ (2008) 38:463–482
of chemical diagrams influence their understanding of chemical concepts? Both researchquestions are addressed simultaneously assuming that if students better understand thechemical drawing then their understanding of the chemical concept will also be better. Theresults of the data analysis are presented in terms of assertions (Erickson 1998).
There was a large variation in students’ level of understanding of the chemical diagramseven within the small interview sample group. This was unexpected and was attributed tothe weak background knowledge of the student, unfamiliarity with the nature of chemicaldrawings and the lack of practice in interpreting chemical diagrams.
Four assertions have been drawn from the data.
Assertion 1 All students interviewed appreciated that chemical diagrams may containinformation that is useful for purposes such as setting up laboratoryequipment and for explaining particular chemical phenomena.
Assertion 2 Students’ level of understanding of a chemical diagram varied greatly.Assertion 3 The connections between the diagrams of the macroscopic level (equipment),
the sub-microscopic level (molecular) and the symbolic level (equations) arenot always apparent to students.
Assertion 4 Chemical diagrams can introduce misconceptions of chemical concepts.
To illustrate students’ understanding and support for the assertions, data for five of thepossible thirteen chemical diagrams are presented. The diagrams show macroscopic, sub-microscopic and symbolic representations. They illustrate relevant assertions of all thediagrams as shown in Table 1. Data from each diagram was selected to best illustrate theassertions and consequently there is not an even distribution of data from each of the fivediagrams. The relevant assertion number is shown in brackets adjacent to the supporting data.
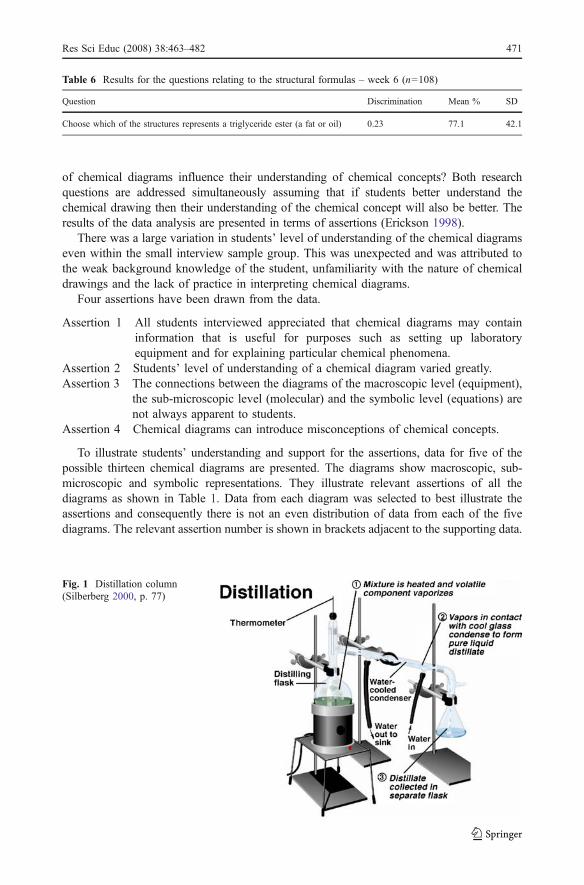
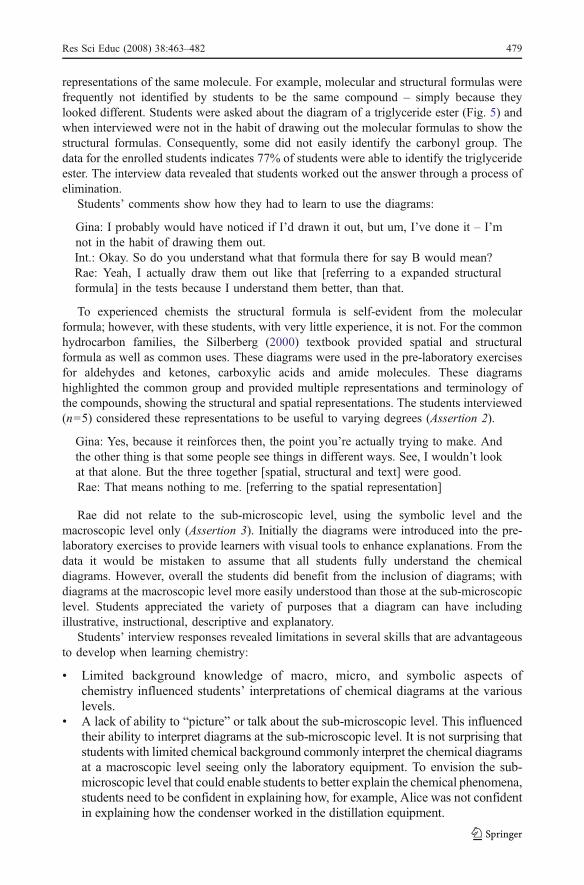
Fig. 1 Distillation column(Silberberg 2000, p. 77)
Table 6 Results for the questions relating to the structural formulas – week 6 (n=108)
Question Discrimination Mean % SD
Choose which of the structures represents a triglyceride ester (a fat or oil) 0.23 77.1 42.1
Res Sci Educ (2008) 38:463–482 471
Distillation Diagram
Student responses to the four questions in the pre-laboratory exercises about the distillationdiagram (see Fig. 1) are shown in Table 2. Not surprisingly all students interviewed (17/17,100%) agreed that the distillation diagram was useful in helping them setup equipment inthe laboratory (Assertion 1). Despite this, some students (5/17, 29%) could not explain theworkings of a condenser even though they had performed the experiment using theequipment in the diagram and answered questions using the diagram (Assertion 2). Forexample
Int.: Where does the water go in and out?Alice: In there, [pointing to the water-in tube in the diagram] And then it came outthe top bit? Didn’t it? Did it?Int.: What was the point of this condenser here? Do you remember what it does?Alice: Um. Not really.Int.: And the water in, the water from the tap, did that water mix up with thismixture in the distilling flask?Alice: No, I don’t think so. Did it? I don’t know. I don’t think so
This result is confirmed by the low results from the enrolled students to Question 2 with46.7% correctly describing how the water flow through the condenser (Table 2).
Generally students’ descriptions referred to the macroscopic level, which is consistentwith the diagram and their experience. Some students’ (4/17, 23%) had very poorknowledge of basic chemical terminology including the names of apparatus and changes ofstate. This is demonstrated in their responses, talking about evaporating liquid rather thanboiling, referring to all liquids as water, and using the terms vapour and steaminterchangeably (Assertions 2). For example:
Alice: The water turns everything into a vapour from this, and I don’t really know.Marc: It used to be like, steam or something.
One student pointed out that the distillation diagram is a replica of the apparatus:
Karen: It just tells you what each thing is. It doesn’t actually tell you how ithappens. Like I still don’t grasp how one long tube is a condenser.
From the interviews and observations in the laboratory, differences were identified inwhat people ‘see’. The macroscopic is what is visible, and the sub-microscopic view isenvisioned spontaneously by experienced learners, familiar with the particulate nature ofmatter. Learners who are not familiar with the particulate nature of matter see themacroscopic chemicals and equipment. And as Karen pointed out, the diagram does notexplain how the condenser works. For the experienced chemistry learner, the diagramincluded an implied explanation – one that is not necessarily visible, but is understood. Fornovices there is no explanation of how the distillation equipment works. All of the studentsconfirmed that the diagram did not show the molecular level, and it did not help themunderstand the molecular level (Assertion 3). So even though the students here havedescribed the diagram, the level at which they comprehended the diagram limits itseffectiveness. In order to explain the process of distillation, the sub-microscopic movementsneed to be included.
472 Res Sci Educ (2008) 38:463–482
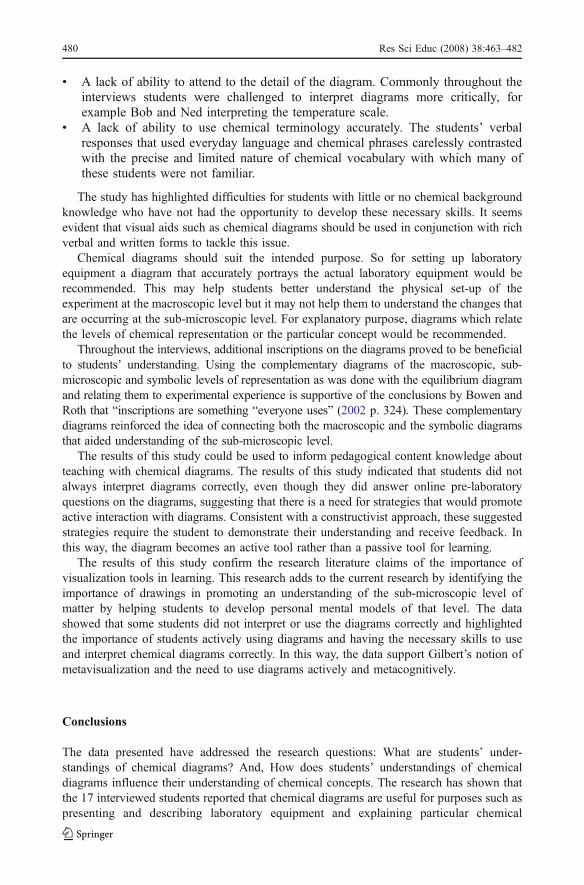
Fractionating Column Diagram
Figure 2 prompted students to examine how the fractionating column operated by examining themolecules of the three different liquids, A, B & C, present in the mixture. The diagram included awritten explanation that students could read to help them understand the process. The results to thequestions in the pre-laboratory exercises are shown in Table 3.
During the interviews only a minority of the students (4/17, 24%) expressed a clearunderstanding of the workings of the fractionating column diagram (Assertion 2). Whenasked “What is happening to the mixture in the fractionating column at the molecularlevel?” the responses revealed a lack of understanding, for example:
Karen: Well, as the temperature’s decreasing, molecules with less efficiency,I suppose are reaching the top.
Karen used everyday terminology, that is efficiency and associated it with temperature.
Betty: I’d probably say that these ones [referring to A] are smaller because theseones [referring to C] are too heavy... Because as it cools, they condense, and just fallback down to the bottom, but these ones [referring to A] aren’t, so they continue up.
Despite the diagram showing A, B and C as the same size circle, Betty associated sizeand weight with the progression of molecule A up the column. However, at the same timeBetty appeared to appreciate that condensation is a factor of temperature.
Sue: Maybe when they hit the certain temperature, it causes them to not fractionallydistillate?
Sue looked for a fact or property to explain the diagram.
The interview responses highlight the inability of some students to talk about chemistry,revealing a poor chemical vocabulary and a shallow understanding of the changes of state(6/17, 35%) occurring in the fractionating column (Assertion 2). A common misconceptionof associating mass and weight with the boiling point was evident in this excerpt:
Int.: What state are they in here in the column?Jen: They’re below the boiling point. I don’t know.Int.: So what do you think is happening? Why are some of them turning round andgoing back down the other way?Carol: They’re too heavy.Int.: They’re too heavy?Carol: Too dense.Int.: What changes in the column as the molecules are going up the column?Jen: The temperature decreases.Int.: So what’s the effect of that decrease in temperature?Jen: It would cause them to become more solid. Whatever the stuff was. So then,like Carol said, when they get too heavy they fall back down.
The comment above shows how the diagram may have caused a misconception of massinfluencing the change of state by students associating the movement in the column withthe effect of gravity (Assertion 4).
Beginning at a high temperature, the fractional distillation equipment vaporises allcomponents and then separates them on the basis of the temperature at which they condense
Res Sci Educ (2008) 38:463–482 473
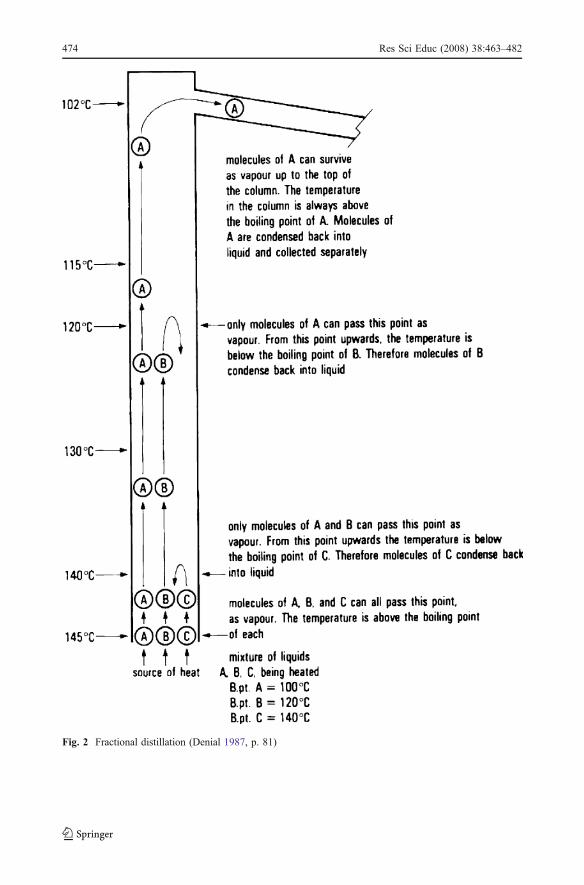
Fig. 2 Fractional distillation (Denial 1987, p. 81)
474 Res Sci Educ (2008) 38:463–482
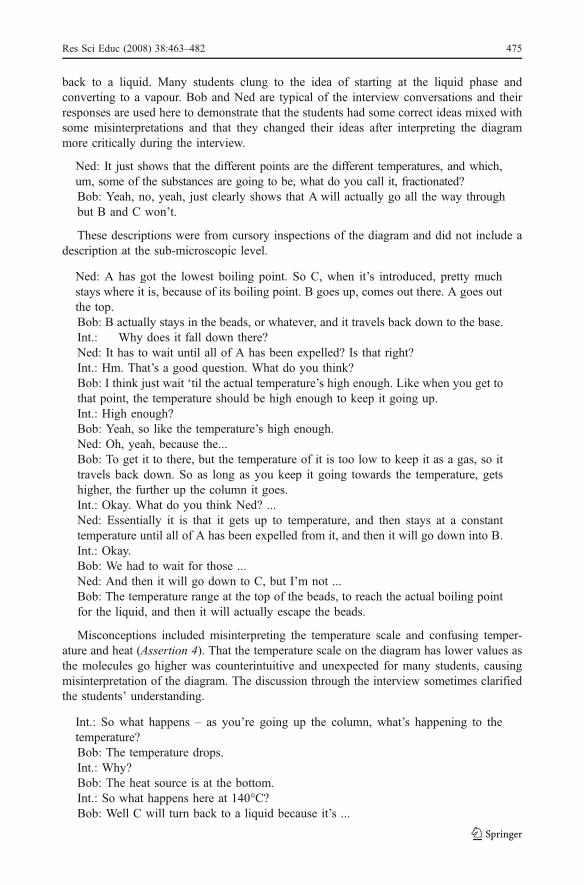
back to a liquid. Many students clung to the idea of starting at the liquid phase andconverting to a vapour. Bob and Ned are typical of the interview conversations and theirresponses are used here to demonstrate that the students had some correct ideas mixed withsome misinterpretations and that they changed their ideas after interpreting the diagrammore critically during the interview.
Ned: It just shows that the different points are the different temperatures, and which,um, some of the substances are going to be, what do you call it, fractionated?Bob: Yeah, no, yeah, just clearly shows that A will actually go all the way throughbut B and C won’t.
These descriptions were from cursory inspections of the diagram and did not include adescription at the sub-microscopic level.
Ned: A has got the lowest boiling point. So C, when it’s introduced, pretty muchstays where it is, because of its boiling point. B goes up, comes out there. A goes outthe top.Bob: B actually stays in the beads, or whatever, and it travels back down to the base.Int.: Why does it fall down there?Ned: It has to wait until all of A has been expelled? Is that right?Int.: Hm. That’s a good question. What do you think?Bob: I think just wait ‘til the actual temperature’s high enough. Like when you get tothat point, the temperature should be high enough to keep it going up.Int.: High enough?Bob: Yeah, so like the temperature’s high enough.Ned: Oh, yeah, because the...Bob: To get it to there, but the temperature of it is too low to keep it as a gas, so ittravels back down. So as long as you keep it going towards the temperature, getshigher, the further up the column it goes.Int.: Okay. What do you think Ned? ...Ned: Essentially it is that it gets up to temperature, and then stays at a constanttemperature until all of A has been expelled from it, and then it will go down into B.Int.: Okay.Bob: We had to wait for those ...Ned: And then it will go down to C, but I’m not ...Bob: The temperature range at the top of the beads, to reach the actual boiling pointfor the liquid, and then it will actually escape the beads.
Misconceptions included misinterpreting the temperature scale and confusing temper-ature and heat (Assertion 4). That the temperature scale on the diagram has lower values asthe molecules go higher was counterintuitive and unexpected for many students, causingmisinterpretation of the diagram. The discussion through the interview sometimes clarifiedthe students’ understanding.
Int.: So what happens – as you’re going up the column, what’s happening to thetemperature?Bob: The temperature drops.Int.: Why?Bob: The heat source is at the bottom.Int.: So what happens here at 140°C?Bob: Well C will turn back to a liquid because it’s ...
Res Sci Educ (2008) 38:463–482 475
Ned: So it actually travels back down again.Bob: Because it’s no longer a vapour, it’s actually started to liquefy and go backdown.Int.: Why does it liquefy?Bob: Because the temperature’s gone under the boiling point.Int.: Okay. What happens to B then?Ned: B goes back down because it hasn’t reached the yeah.Bob: The temperature ..... boiling.Int.: Okay. So same thing. And what about A?Ned: A’s got enough, so it’s expelled. It’s been boiled so it stays vapour and gone outInt.: At 102°C here, is it still going to be in one state.Ned: It’s still going to be a gas.Bob: It’s still a vapour, yeah.
Bob has connected the temperature with the boiling point and the change of state. Thedialogue demonstrated that Ned and Bob were deciphering what the diagram was trying tosay − being dissatisfied with their initial interpretation, and eventually, through someprompting by the interviewer and discussion, being able to explain what was happening atthe molecular level and why it was happening (Assertion 3). Indeed, the interviews revealedthat students were able to answer the questions on the pre-laboratory exercises (Table 3)correctly without really understanding the diagram, identifying the poor design of thequestions.
Bob and Ned drew on their laboratory experience when discussing the diagram as didCaz in the following excerpt from her interview.
Int.: You could actually see something going on?Caz: Yeah, you could see it condense and run back down.Doug, a mature-age student, commented on his approach with the fractionatingcolumn diagram.Doug: It took me a couple of minutes looking at it with the questions there, the A, Band C thing, there. It actually made me think about what was happening temperature-wise in the fraction column, as compared to the boiling point of the material.
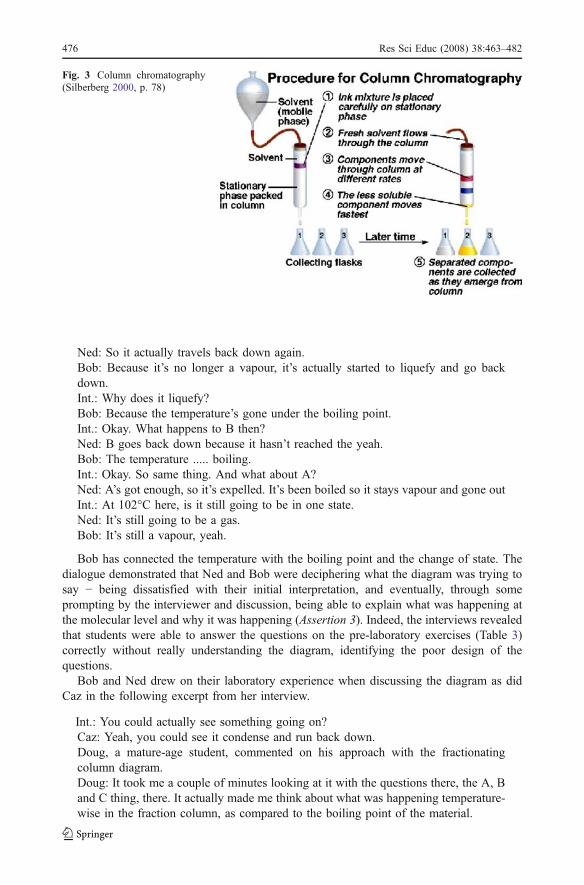
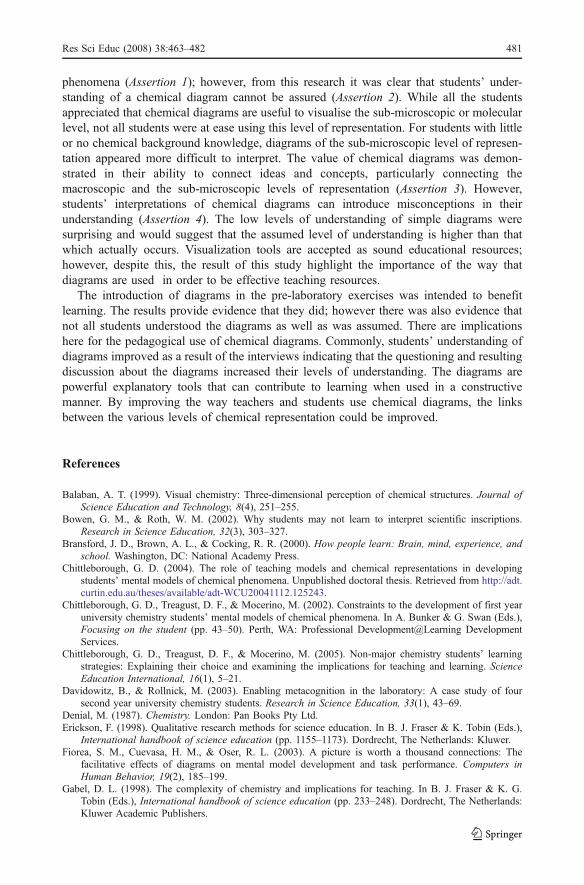
Fig. 3 Column chromatography(Silberberg 2000, p. 78)
476 Res Sci Educ (2008) 38:463–482
Explaining the distillation process in detail required thinking at the sub-microscopiclevel and the macroscopic level simultaneously and this could explain why the fractionaldistillation process proved to be difficult for students to grasp.
Column Chromatography
Nearly all the students interviewed (13/15, 87%) agreed that the diagram (Fig. 3) was useful inexplaining what was happening to the mixture in the chromatography column (Assertion 1).
Katrina: Yeah. I think it helped, ‘cause having no idea about it, it definitely helped. Itwas a little bit difficult to understand at first. When I looked at it first I really didn’tknow what was going on in it. But yeah when you went into the lab and you sawwhat you had to do, then you could figure out how to relate it back to the picture.
Because the diagram was not identical to the equipment actually used in the laboratory,some students interviewed considered that it was not as useful in helping them set upequipment in the laboratory. The data indicate that nearly all the interviewed students(n=15) distinguished diagrams that illustrate the experimental setup from those whichdescribe and explain the concept. Doug‘s comment about Fig. 3 indicated his ability torecognise the purpose of a diagram.
Doug: I find diagrams that actually show the set up of the equipment we are going touse in the lab far more instructional than conceptual diagrams, if you like. And Iwould regard that [Fig. 3] as a conceptual diagram, whereas where it came toactually setting up the lab equipment, I think a lot of people were having the problemof that, having to extrapolate and saying what we do with this.
Students’ understanding of the chemistry underlying the column chromatography varied(Assertion 2). Some students (5/17, 29%) regarded the size of the molecule to be thedetermining factor in its movement through the column. Only three of the studentsinterviewed (3/17, 18%) were able to describe correctly the movement of moleculesthrough the column (Assertion 3). The low number of correct responses by the interviewedstudents contrast with the high number of correct responses by the enrolled students(n=122). Table 4 shows that 86% of students were able to select the correct response toidentifying the aim of the column chromatography experiment. Only 55% were able tocorrectly identify “Which component will move through the column most quickly?” but thisitem has a poor item discrimination value and a corresponding high standard deviation.
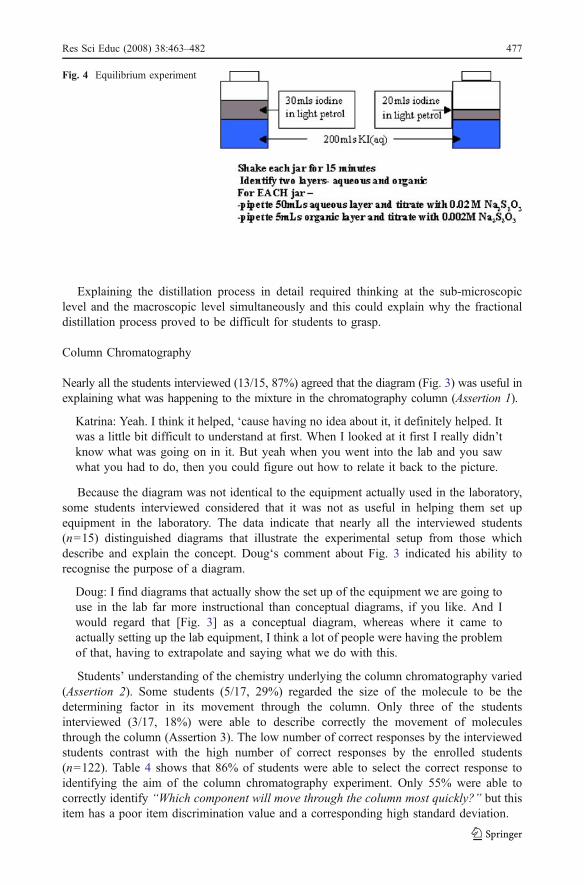
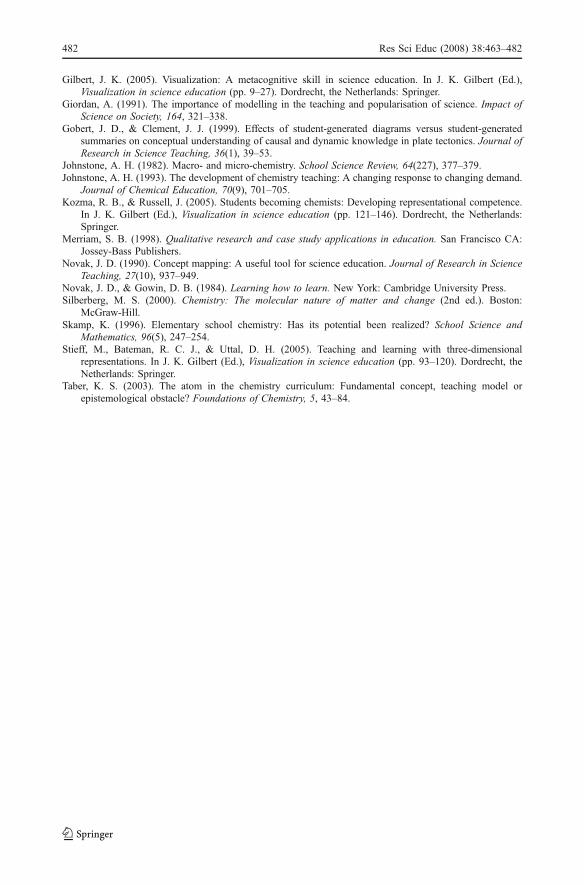
Fig. 4 Equilibrium experiment
Res Sci Educ (2008) 38:463–482 477
Students’ abilities to discuss the experiment and explain the process varied as illustratedin these responses during the interviews:
Doug: the movement of the solvent is dependent on its binding to the materialpacked in the column.Bobby: because of the size of the particles with the alumina and whatever, theytravelled through like, because it got, like there was the purple, yellow, you knowdifferent sizes, so that one travels through faster.Kenny: I think it shows, because the mixture’s got lots of different substances, so it kindof separates the substances, because each substance has a different solubility. So it’sdifferent rates, so this picture shows that collecting things that’s been timed. So kind ofdemonstrates how a solvent has a mixture and the column separates each mixture.
Students’ commonly used limited and everyday vocabulary in explaining theexperiment, after doing pre-laboratory exercises and conducting the experiment.
Chemical Equilibrium
Interview data confirmed that all students found Fig. 4 helpful in understanding the procedureof the experiment (Assertion 1). The percentage of correct responses to questions 3 and 4 inthe pre-laboratory online exercises (see Table 5), requiring students to identify the chemicalspecies were poor. Similarly, the interview data showed that some students (10/17, 59%) haddifficulty understanding the chemicals they started and ended with and were often confusedabout the species – iodine, iodide ion and tri-iodide ion – and the medium (Assertion 2).Many students (9/16, 56%) were not able to relate the equations to the macroscopic diagramsduring the interviews. The symbols and equations for the chemicals were drawn onto Fig. 4as part of the interview. In this way symbols and equations relating to the sub-microscopiclevel were transposed onto the drawing of the macroscopic level (Assertion 3).
Misunderstandings included students assuming that the equilibrium was only occurringat the interface; another student inferred that the two immiscible layers in the flaskcorresponded to the numerator and denominator of the equilibrium constant. Students weredrawn to the prominent macroscopic physical feature of the two immiscible layers becausethey could see it and assumed that this was a manifestation of the equilibrium situation.Other students interpreted the two separate layers as meaning that no reaction was occurringbecause the solutions did not mix (Assertion 4).
Structural Formulas
Chemical diagrams include structural formula representations. Those students with limitedbackground knowledge in chemistry did not easily connect alternative symbolic
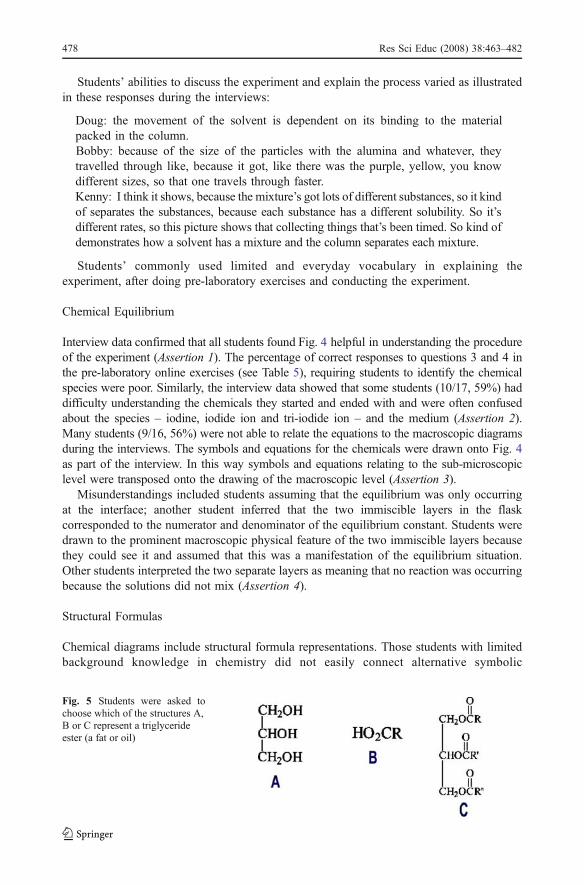
Fig. 5 Students were asked tochoose which of the structures A,B or C represent a triglycerideester (a fat or oil)
478 Res Sci Educ (2008) 38:463–482
representations of the same molecule. For example, molecular and structural formulas werefrequently not identified by students to be the same compound – simply because theylooked different. Students were asked about the diagram of a triglyceride ester (Fig. 5) andwhen interviewed were not in the habit of drawing out the molecular formulas to show thestructural formulas. Consequently, some did not easily identify the carbonyl group. Thedata for the enrolled students indicates 77% of students were able to identify the triglycerideester. The interview data revealed that students worked out the answer through a process ofelimination.
Students’ comments show how they had to learn to use the diagrams:
Gina: I probably would have noticed if I’d drawn it out, but um, I’ve done it – I’mnot in the habit of drawing them out.Int.: Okay. So do you understand what that formula there for say B would mean?Rae: Yeah, I actually draw them out like that [referring to a expanded structuralformula] in the tests because I understand them better, than that.
To experienced chemists the structural formula is self-evident from the molecularformula; however, with these students, with very little experience, it is not. For the commonhydrocarbon families, the Silberberg (2000) textbook provided spatial and structuralformula as well as common uses. These diagrams were used in the pre-laboratory exercisesfor aldehydes and ketones, carboxylic acids and amide molecules. These diagramshighlighted the common group and provided multiple representations and terminology ofthe compounds, showing the structural and spatial representations. The students interviewed(n=5) considered these representations to be useful to varying degrees (Assertion 2).
Gina: Yes, because it reinforces then, the point you’re actually trying to make. Andthe other thing is that some people see things in different ways. See, I wouldn’t lookat that alone. But the three together [spatial, structural and text] were good.Rae: That means nothing to me. [referring to the spatial representation]
Rae did not relate to the sub-microscopic level, using the symbolic level and themacroscopic level only (Assertion 3). Initially the diagrams were introduced into the pre-laboratory exercises to provide learners with visual tools to enhance explanations. From thedata it would be mistaken to assume that all students fully understand the chemicaldiagrams. However, overall the students did benefit from the inclusion of diagrams; withdiagrams at the macroscopic level more easily understood than those at the sub-microscopiclevel. Students appreciated the variety of purposes that a diagram can have includingillustrative, instructional, descriptive and explanatory.
Students’ interview responses revealed limitations in several skills that are advantageousto develop when learning chemistry:
& Limited background knowledge of macro, micro, and symbolic aspects ofchemistry influenced students’ interpretations of chemical diagrams at the variouslevels.
& A lack of ability to “picture” or talk about the sub-microscopic level. This influencedtheir ability to interpret diagrams at the sub-microscopic level. It is not surprising thatstudents with limited chemical background commonly interpret the chemical diagramsat a macroscopic level seeing only the laboratory equipment. To envision the sub-microscopic level that could enable students to better explain the chemical phenomena,students need to be confident in explaining how, for example, Alice was not confidentin explaining how the condenser worked in the distillation equipment.
Res Sci Educ (2008) 38:463–482 479
& A lack of ability to attend to the detail of the diagram. Commonly throughout theinterviews students were challenged to interpret diagrams more critically, forexample Bob and Ned interpreting the temperature scale.
& A lack of ability to use chemical terminology accurately. The students’ verbalresponses that used everyday language and chemical phrases carelessly contrastedwith the precise and limited nature of chemical vocabulary with which many ofthese students were not familiar.
The study has highlighted difficulties for students with little or no chemical backgroundknowledge who have not had the opportunity to develop these necessary skills. It seemsevident that visual aids such as chemical diagrams should be used in conjunction with richverbal and written forms to tackle this issue.
Chemical diagrams should suit the intended purpose. So for setting up laboratoryequipment a diagram that accurately portrays the actual laboratory equipment would berecommended. This may help students better understand the physical set-up of theexperiment at the macroscopic level but it may not help them to understand the changes thatare occurring at the sub-microscopic level. For explanatory purpose, diagrams which relatethe levels of chemical representation or the particular concept would be recommended.
Throughout the interviews, additional inscriptions on the diagrams proved to be beneficialto students’ understanding. Using the complementary diagrams of the macroscopic, sub-microscopic and symbolic levels of representation as was done with the equilibrium diagramand relating them to experimental experience is supportive of the conclusions by Bowen andRoth that “inscriptions are something “everyone uses” (2002 p. 324). These complementarydiagrams reinforced the idea of connecting both the macroscopic and the symbolic diagramsthat aided understanding of the sub-microscopic level.
The results of this study could be used to inform pedagogical content knowledge aboutteaching with chemical diagrams. The results of this study indicated that students did notalways interpret diagrams correctly, even though they did answer online pre-laboratoryquestions on the diagrams, suggesting that there is a need for strategies that would promoteactive interaction with diagrams. Consistent with a constructivist approach, these suggestedstrategies require the student to demonstrate their understanding and receive feedback. Inthis way, the diagram becomes an active tool rather than a passive tool for learning.
The results of this study confirm the research literature claims of the importance ofvisualization tools in learning. This research adds to the current research by identifying theimportance of drawings in promoting an understanding of the sub-microscopic level ofmatter by helping students to develop personal mental models of that level. The datashowed that some students did not interpret or use the diagrams correctly and highlightedthe importance of students actively using diagrams and having the necessary skills to useand interpret chemical diagrams correctly. In this way, the data support Gilbert’s notion ofmetavisualization and the need to use diagrams actively and metacognitively.
Conclusions
The data presented have addressed the research questions: What are students’ under-standings of chemical diagrams? And, How does students’ understandings of chemicaldiagrams influence their understanding of chemical concepts. The research has shown thatthe 17 interviewed students reported that chemical diagrams are useful for purposes such aspresenting and describing laboratory equipment and explaining particular chemical
480 Res Sci Educ (2008) 38:463–482
phenomena (Assertion 1); however, from this research it was clear that students’ under-standing of a chemical diagram cannot be assured (Assertion 2). While all the studentsappreciated that chemical diagrams are useful to visualise the sub-microscopic or molecularlevel, not all students were at ease using this level of representation. For students with littleor no chemical background knowledge, diagrams of the sub-microscopic level of represen-tation appeared more difficult to interpret. The value of chemical diagrams was demon-strated in their ability to connect ideas and concepts, particularly connecting themacroscopic and the sub-microscopic levels of representation (Assertion 3). However,students’ interpretations of chemical diagrams can introduce misconceptions in theirunderstanding (Assertion 4). The low levels of understanding of simple diagrams weresurprising and would suggest that the assumed level of understanding is higher than thatwhich actually occurs. Visualization tools are accepted as sound educational resources;however, despite this, the result of this study highlight the importance of the way thatdiagrams are used in order to be effective teaching resources.
The introduction of diagrams in the pre-laboratory exercises was intended to benefitlearning. The results provide evidence that they did; however there was also evidence thatnot all students understood the diagrams as well as was assumed. There are implicationshere for the pedagogical use of chemical diagrams. Commonly, students’ understanding ofdiagrams improved as a result of the interviews indicating that the questioning and resultingdiscussion about the diagrams increased their levels of understanding. The diagrams arepowerful explanatory tools that can contribute to learning when used in a constructivemanner. By improving the way teachers and students use chemical diagrams, the linksbetween the various levels of chemical representation could be improved.
References
Balaban, A. T. (1999). Visual chemistry: Three-dimensional perception of chemical structures. Journal ofScience Education and Technology, 8(4), 251–255.
Bowen, G. M., & Roth, W. M. (2002). Why students may not learn to interpret scientific inscriptions.Research in Science Education, 32(3), 303–327.
Bransford, J. D., Brown, A. L., & Cocking, R. R. (2000). How people learn: Brain, mind, experience, andschool. Washington, DC: National Academy Press.
Chittleborough, G. D. (2004). The role of teaching models and chemical representations in developingstudents’ mental models of chemical phenomena. Unpublished doctoral thesis. Retrieved from http://adt.curtin.edu.au/theses/available/adt-WCU20041112.125243.
Chittleborough, G. D., Treagust, D. F., & Mocerino, M. (2002). Constraints to the development of first yearuniversity chemistry students’ mental models of chemical phenomena. In A. Bunker & G. Swan (Eds.),Focusing on the student (pp. 43–50). Perth, WA: Professional Development@Learning DevelopmentServices.
Chittleborough, G. D., Treagust, D. F., & Mocerino, M. (2005). Non-major chemistry students’ learningstrategies: Explaining their choice and examining the implications for teaching and learning. ScienceEducation International, 16(1), 5–21.
Davidowitz, B., & Rollnick, M. (2003). Enabling metacognition in the laboratory: A case study of foursecond year university chemistry students. Research in Science Education, 33(1), 43–69.
Denial, M. (1987). Chemistry. London: Pan Books Pty Ltd.Erickson, F. (1998). Qualitative research methods for science education. In B. J. Fraser & K. Tobin (Eds.),
International handbook of science education (pp. 1155–1173). Dordrecht, The Netherlands: Kluwer.Fiorea, S. M., Cuevasa, H. M., & Oser, R. L. (2003). A picture is worth a thousand connections: The
facilitative effects of diagrams on mental model development and task performance. Computers inHuman Behavior, 19(2), 185–199.
Gabel, D. L. (1998). The complexity of chemistry and implications for teaching. In B. J. Fraser & K. G.Tobin (Eds.), International handbook of science education (pp. 233–248). Dordrecht, The Netherlands:Kluwer Academic Publishers.
Res Sci Educ (2008) 38:463–482 481
Gilbert, J. K. (2005). Visualization: A metacognitive skill in science education. In J. K. Gilbert (Ed.),Visualization in science education (pp. 9–27). Dordrecht, the Netherlands: Springer.
Giordan, A. (1991). The importance of modelling in the teaching and popularisation of science. Impact ofScience on Society, 164, 321–338.
Gobert, J. D., & Clement, J. J. (1999). Effects of student-generated diagrams versus student-generatedsummaries on conceptual understanding of causal and dynamic knowledge in plate tectonics. Journal ofResearch in Science Teaching, 36(1), 39–53.
Johnstone, A. H. (1982). Macro- and micro-chemistry. School Science Review, 64(227), 377–379.Johnstone, A. H. (1993). The development of chemistry teaching: A changing response to changing demand.
Journal of Chemical Education, 70(9), 701–705.Kozma, R. B., & Russell, J. (2005). Students becoming chemists: Developing representational competence.
In J. K. Gilbert (Ed.), Visualization in science education (pp. 121–146). Dordrecht, the Netherlands:Springer.
Merriam, S. B. (1998). Qualitative research and case study applications in education. San Francisco CA:Jossey-Bass Publishers.
Novak, J. D. (1990). Concept mapping: A useful tool for science education. Journal of Research in ScienceTeaching, 27(10), 937–949.
Novak, J. D., & Gowin, D. B. (1984). Learning how to learn. New York: Cambridge University Press.Silberberg, M. S. (2000). Chemistry: The molecular nature of matter and change (2nd ed.). Boston:
McGraw-Hill.Skamp, K. (1996). Elementary school chemistry: Has its potential been realized? School Science and
Mathematics, 96(5), 247–254.Stieff, M., Bateman, R. C. J., & Uttal, D. H. (2005). Teaching and learning with three-dimensional
representations. In J. K. Gilbert (Ed.), Visualization in science education (pp. 93–120). Dordrecht, theNetherlands: Springer.
Taber, K. S. (2003). The atom in the chemistry curriculum: Fundamental concept, teaching model orepistemological obstacle? Foundations of Chemistry, 5, 43–84.
482 Res Sci Educ (2008) 38:463–482