corporation financial results · accounting period*) • net sales ¥958.0 billion • net income...
TRANSCRIPT

0
INPEX CORPORATION
Financial Resultsfor the year ended March 31, 2019
INPEX CORPORATION
Financial Resultsfor the year ended March 31, 2019
May 14, 2019May 14, 2019

1
Agenda
Corporate Overview Progress of Medium‐term Business Plan 2018‐2022 and FY 2019/12 Outlook
Consolidated Financial Results for the year ended March 31, 2019
Consolidated Financial Forecasts for the year ending December 31, 2019

2
Cautionary Statement
This presentation includes forward‐looking information that reflects the plans and expectations of the Company. Such forward‐looking information is based on the current assumptions and judgments of the Company in light of the information currently available to it, and involves known and unknown risks, uncertainties, and other factors. Such risks, uncertainties and other factors may cause the Company’s performance, achievements or financial position to be materially different from any future results, performance, achievements or financial position expressed or implied by such forward‐looking information. Such risks, uncertainties and other factors include, without limitation: Price volatility and change in demand in crude oil and natural gas Foreign exchange rate volatility Change in costs and other expenses pertaining to exploration, development and production
The Company undertakes no obligation to publicly update or revise the disclosure of information in this presentation (including forward‐looking information) after the date of this presentation.

Corporate Overview
Takayuki UedaRepresentative Director, President & CEO
4
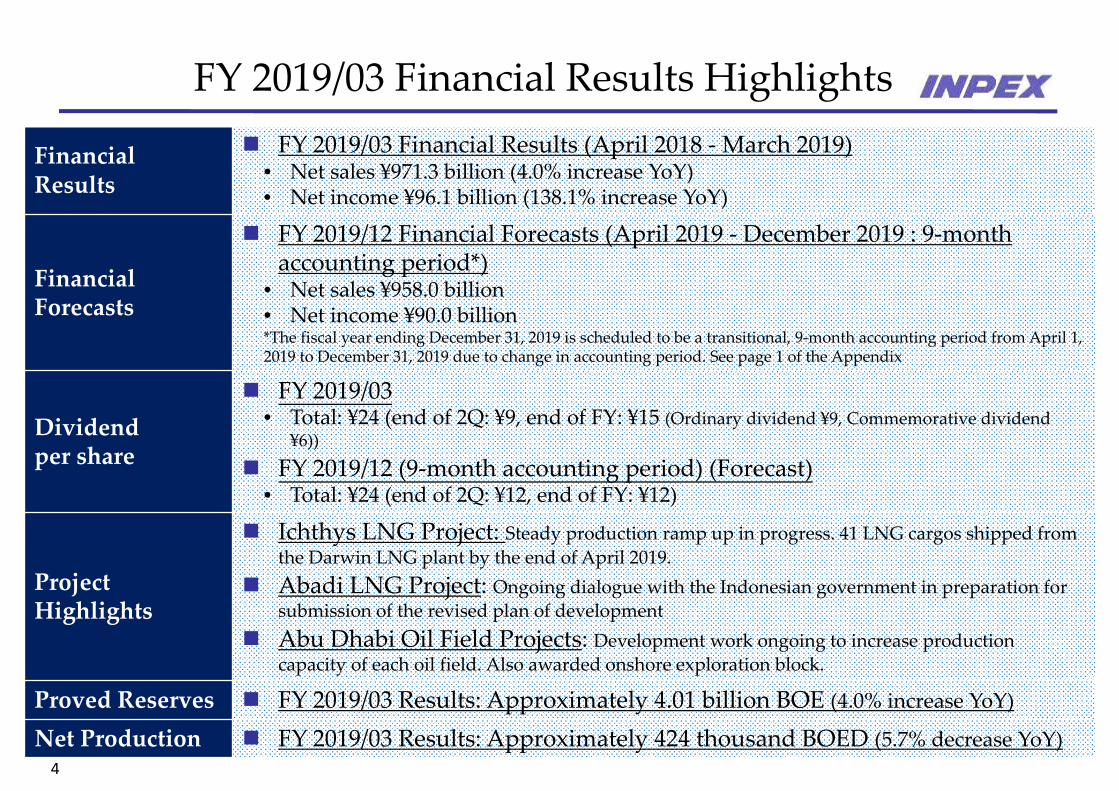
Financial Results
FY 2019/03 Financial Results (April 2018 ‐March 2019)• Net sales ¥971.3 billion (4.0% increase YoY)• Net income ¥96.1 billion (138.1% increase YoY)
FinancialForecasts
FY 2019/12 Financial Forecasts (April 2019 ‐ December 2019 : 9‐monthaccounting period*)
• Net sales ¥958.0 billion• Net income ¥90.0 billion*The fiscal year ending December 31, 2019 is scheduled to be a transitional, 9‐month accounting period from April 1,2019 to December 31, 2019 due to change in accounting period. See page 1 of the Appendix
Dividend per share
FY 2019/03• Total: ¥24 (end of 2Q: ¥9, end of FY: ¥15 (Ordinary dividend ¥9, Commemorative dividend
¥6))
FY 2019/12 (9‐month accounting period) (Forecast)• Total: ¥24 (end of 2Q: ¥12, end of FY: ¥12)
Project Highlights
Ichthys LNG Project: Steady production ramp up in progress. 41 LNG cargos shipped fromthe Darwin LNG plant by the end of April 2019.
Abadi LNG Project: Ongoing dialogue with the Indonesian government in preparation forsubmission of the revised plan of development
Abu Dhabi Oil Field Projects: Development work ongoing to increase productioncapacity of each oil field. Also awarded onshore exploration block.
Proved Reserves FY 2019/03 Results: Approximately 4.01 billion BOE (4.0% increase YoY)Net Production FY 2019/03 Results: Approximately 424 thousand BOED (5.7% decrease YoY)
FY 2019/03 Financial Results Highlights

5
FY 2019/03 Corporate HighlightsSustainable Growth of Oil and Natural Gas E&P Activities Appointed as Asset Leader for Lower Zakum Oil Field Offshore Abu Dhabi, UAE (April) Completed offshore preparations for production start‐up of Ichthys LNG Project in Australia (May) Commenced production at Ichthys LNG Project (July) Sold interest in Joslyn Oil Sands Project in Canada (September) Commenced condensate shipment from Ichthys LNG Project (October) Commenced LNG shipment from Ichthys LNG Project (October) Acquired additional participating interest in Ichthys LNG Project (December) Commenced production at Prelude FLNG facility in Australia (December) Awarded two exploration licenses in Norway’s awards in predefined areas (APA) 2018 (January) Acquired tight oil project in Texas, US from GulfTex Energy (March) Awarded Onshore Block 4 in Abu Dhabi licensing block bid 2018 (March) Made final investment decision on further development at ACG oil fields in Caspian Sea, Republic of Azerbaijan (April)
Development of Global Gas Value Chain Business First LNG shipment from Ichthys LNG project arrived at Naoetsu LNG Terminal in Japan (October) Signed a memorandum of understanding (MOU) on LNG bunkering partnership in UAE (December) LNG tanker “Oceanic Breeze” carrying Ichthys cargo made first call at Naoetsu LNG Terminal in Japan (February)
Reinforcement of Renewable Energy Initiatives Commenced commercial operations of 3rd unit of Sarulla geothermal IPP project in Indonesia (May) Established “Renewable Energy & Power Business Division” (May) Commenced environmental impact assessment on construction of geothermal power plant in Akita Prefecture in Japan
(December)

6
Production volume (Project 100%): Approximately 250 thousand BOED*
Upstream gas**: Approximately 1,100 million cf/D
Upstream condensate: Approximately 40 thousand BOED
Production ramp‐up Production scheduled to reach plateau in 2~3 years from
LNG production start‐up as expected
*Average daily rate from January to March 2019. Total of upstream gas and upstream condensate (BOED)**Volume not at the wellhead but corresponding to sales to downstream entity (Gas provided from upstream to LNG plant as a raw material for LNG, LPG and plant condensate)
LNG cargo 41 LNG cargoes shipped (cumulative shipments from the 1st shipment in
October 2018 to the end of April 2019)
An average of 7~8 LNG cargoes expected to be shipped on
a monthly basis in FY2019/12
Approximately 120 cargoes anticipated at peak production
Drilling of production wells Drilling and preparation completed on 16 wells
Drilling operations ongoing (approximately 50 wells in
total expected to be drilled)
*** Total of upstream gas and upstream condensate
Production volume***
Ramp‐up
CPF and FPSO at Ichthys Gas‐condensate Field LNG Carrier (Pacific Breeze)
Actual averagefrom January to March 2019
Ichthys LNG Project Progress after Production start‐up
Forecast of plateau production

7
Ichthys LNG ProjectExploration Blocks in Vicinity of Ichthys Field
N.T.
W.A.
200km100
INPEX 60%TOTAL 40%
WA‐343‐P
WA‐57‐R
WA‐44‐L (Prelude FLNG)Shell 67.5%INPEX 17.5% KOGAS 10.0%CPC 5.0%
AC/P36INPEX 50%Murphy 50%
INPEX 100%
WA‐494‐P
WA‐285‐P
INPEX 66.245%TOTAL 26.000%Tokyo Gas 1.575%, Osaka Gas 1.200%, JERA 0.735%, Toho Gas 0.420%, CPC 2.625%, Kansai Electric Power 1.200%
WA‐274‐P
WA‐74‐R
WA‐50‐L /WA‐51‐L
WA‐58‐R
SANTOS 30%CHEVRON 50%INPEX 20%
WA‐80‐R
SANTOS 47.83%CHEVRON 24.83%INPEX 20%BEACH 7.34%
WA‐532‐P
WA‐85‐R
0
Northern Territory
WA‐56‐R(Mimia, 2008)
WA‐281‐P(Burnside, 2009)
WA‐81‐R(Crown, 2012)
WA‐79‐R(Lasseter, 2014)
Ichthys
WA‐84‐R
SANTOS 60%INPEX 40%
WA‐86‐R
WA‐533‐P
62.245%30.000%1.575%, 1.200%, 0.735%, 0.420%, 2.625%, 1.200%
EP‐318INPEX 100%
Western AustraliaBroome
Darwin
Participating interests held in 18 exploration blocks in the vicinity of the Ichthys Field. To date, gas discoveries have been made in the Crown, Lasseter, Mimia and Burnside formations, etc. These discovered gas formations extend across at least 11 blocks.
Site for possible additional LNG trains in Darwin already secured.

8
Abadi LNG Project Current Progress
Conducted Pre‐FEED work based on an onshore LNG development scheme with an annual LNG production capacity of 9.5 million tons from March to October 2018.
Currently in dialogue with the Indonesian government in preparation for submission of the revised plan of development based on the results of Pre‐FEED work, etc.
Targeting production commencement in the latter half of the 2020s.
Pursuing efficient development leveraging the expertise and experience acquired through the Ichthys LNG project.
Project listed by the Indonesian government as a national strategic project in June 2017 and as a priority infrastructure project in September 2017.

9
ナダ
Kashagan Oil Field (In Production: Kazakhstan) ACG Oil Field (In Production: Azerbaijan)
Prelude FLNG Project (In Production: Australia) Tight Oil Project (In Production/under Development: Texas, US )
Areas of Progress Commenced the initial
phase of production in December 2018
Commenced condensate shipment in March 2019
Scheduled to start LNG shipment in the future
Production overview LNG: Approx. 3.6 million t/y LPG: Approx. 0.4 million t/y (at peak) Condensate: Approx. 36 thousand bbl/d (at peak)
Areas of Progress Current production
volume: Approx. 340 thousand bbl/d
Aiming to reach target production volume of 370 thousand bbl/d at an early stage
Areas of Progress Made final investment
decision on further development in April 2019
Areas of Progress Acquired multiple
development and production assets from GulfTex Energy in the Eagle Ford play in the Texas, U.S.
Production overview Approx. 17 thousand bbl/d (at peak)
Progress on other Projectsin Production / under Development
10
ナダ
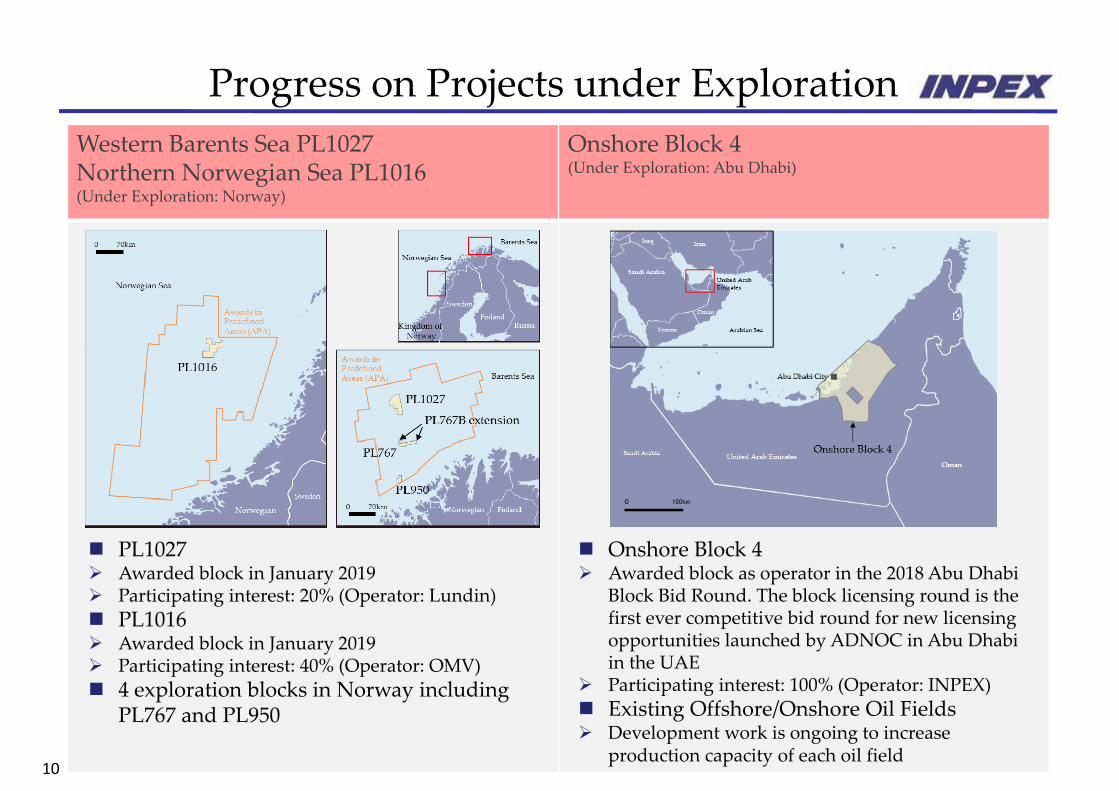
Western Barents Sea PL1027Northern Norwegian Sea PL1016(Under Exploration: Norway)
Onshore Block 4(Under Exploration: Abu Dhabi)
PL1027 Awarded block in January 2019 Participating interest: 20% (Operator: Lundin) PL1016 Awarded block in January 2019 Participating interest: 40% (Operator: OMV) 4 exploration blocks in Norway including
PL767 and PL950
Onshore Block 4 Awarded block as operator in the 2018 Abu Dhabi
Block Bid Round. The block licensing round is the first ever competitive bid round for new licensing opportunities launched by ADNOC in Abu Dhabi in the UAE
Participating interest: 100% (Operator: INPEX) Existing Offshore/Onshore Oil Fields Development work is ongoing to increase
production capacity of each oil field
Progress on Projects under Exploration

11
Natural Gas Business in Japanand Renewable Energy Initiatives
Sarulla Geothermal IPP Project
Natural Gas Business in Japan Renewable Energy Business
Natural Gas Sales FY 2019/03: approx. 2,170 million m3 * FY 2019/12 (9‐month accounting period) (estimated):
approx. 1,590 million m3 * Naoetsu LNG Terminal First LNG cargo (Pacific Breeze) from Ichthys LNG
Project arrived at Naoetsu LNG Terminal in October 2018
First call by Oceanic Breeze carrying Ichthys cargo in February 2019 *1m3 =41.8605MJ
Establishment of “Renewable Energy & Power Business Division” in June 2018
Indonesia: Sarulla Geothermal Independent Power Producer (IPP) Project
Total power generation volume of 330MW Japan: Geothermal Power Business Commenced environmental impact assessment at
geothermal power plant construction site in Akita Prefecture, Japan

12
Net Production* (FY 2019/03)
* The production volume of crude oil and natural gas under the production sharing contracts entered into by the INPEX Group corresponds to the net economic take of the INPEX Group.
7% 7%
20% 22%
10% 12%
57% 54%
6%5%
450 424
0
100
200
300
400
500
600
Mar. 18 Mar. 19
(ThousandBOED)
Japan Asia/OceaniaEurasia Middle East/AfricaAmericas
Production increase factors:• Ichthys Project
production start‐up• Kashagan oil field
production ramp‐up
Production decrease factor:• Expiration of Offshore
Mahakam Block PSC

13
2,4343,264 3,304
3,857 4,010
1,610
1,705 1,389
1,443 1,2024,044
4,9704,693
5,300 5,212
0
1,000
2,000
3,000
4,000
5,000
6,000
Mar.ʹ 15 Mar.ʹ 16 Mar.ʹ 17 Mar.ʹ 18 Mar.ʹ 19Million BO
EProvedReserves ProbableReserves
25.9years
Reserves toproduction ratio****
** ***
Production Cost, Proved + Probable Reserves* and Reserve Indices
* The reserves cover most of the INPEX Group projects including the portion attributable to non‐controllinginterests. The reserves of the large capital investment projects which should materially affect the company’sfuture results are evaluated by DeGolyer & MacNaughton, while the others are evaluated internally. Thereserves for Mar.’19 shown in this presentation are provisional.
** The proved reserves are evaluated in accordance with the SEC regulations. When probabilistic methods areemployed, there should be at least a 90% probability that the quantities actually recovered will equal to orexceed the estimated proved reserves.
*** The probable reserves are evaluated in accordance with the Petroleum Resources Management System(PRMS) of SPE etc. When probabilistic methods are employed, there should be at least a 50% probability thatthe quantities actually recovered will equal to or exceed the sum of estimated proved and probable reserves.Probable reserves do not guarantee production of the total reserves during a future production period withthe same certainty as proved reserves.
**** Reserves to production ratio = Reserves as of March 31, 2019 / Production for the year ended March 31, 2019***** Reserve Replacement Ratio = Proved reserves increase including acquisition / production in the fiscal year
246%
362%
246%
0%
100%
200%
300%
400%
Mar. ʹ17 Mar. ʹ18 Mar. ʹ19
Reserve Replacement Ratio (3‐year average)*****
Production Cost per BOE (Excl. Royalty)
5.9 5.95.7
4.0
5.0
6.0
7.0
Mar. ʹ17 Mar. ʹ18 Mar. ʹ19
US$/BOE
33.7years

Progress of Medium‐term Business Plan 2018‐2022and FY 2019/12 Outlook
Takayuki UedaRepresentative Director, President & CEO

15
Made steady progress toward achieving targets set in the medium‐term business plan by reaching important milestones, such as production start‐up and shipment of Ichthys LNG Project in FY 2019/03
Aiming for steady achievement of further milestones including rapid and steady ramp‐up of Ichthys LNG Project in FY 2019/12
FY 2019/03 Results (First Year of the Mid‐term Plan)
April 2018~March 2019
FY 2019/12 Initiatives & Outlook (Second Year of the Mid‐term Plan)
April 2019~December 2019: 9‐month accounting period
SustainableGrowth of Oil and Natural Gas E&P Activities
Ichthys LNG Project: Achieved production start‐up, shipments and steady ramp‐up
Abadi LNG Project: Conducted Pre‐FEED work Abu Dhabi Oil Fields: Appointed as Asset Leader for
Lower Zakum Oil Field Prelude FLNG Project: Achieved production start‐up Pursuing long‐term growth drivers: Awarded
exploration blocks in Norway. Acquired tight oil project in Texas, US
Ichthys LNG Project: Aim for rapid and steady ramp‐up Abadi LNG Project: Implement initiatives for FID at an
early stage Abu Dhabi Oil Fields: Continue development work to
increase production capacity of each oil field ACG Oil Fields: Made FID on further development Exploration activities: Drive exploration activities in Abu
Dhabi, Iraq, Norway and Gulf of Mexico etc. Continue studies in priority exploration areas
Development of Global Gas Value Chain Business
Domestic: Achieved approx. 2,170 million m3 of natural gas sales
Overseas: Conducted LNG/Gas marketing for FID on Abadi LNG Project. Implemented initiatives to create business for natural gas demand generation
Domestic: Expect approx. 1,590 million m3 of natural gas sales (9‐month accounting period)
Overseas: Continue LNG/Gas marketing for FID on AbadiLNG Project and initiatives to create business for natural gas demand generation
Reinforcement of Renewable Energy Initiatives
Commenced commercial operations of 3rd unit of Sarulla geothermal IPP project in Indonesia
Studying entry into domestic wind power generation business
Established “Renewable Energy & Power Business Division”
Promote geothermal power generation business. Proactively enter wind power generation business
Enhance R&D of renewable energy technologies
Progress of Medium‐term Business Plan 2018‐2022and FY 2019/12 Outlook①

16
FY 2019/03 Results (First Year of the Mid‐term Plan)
April 2018~March 2019
FY 2019/12 Initiatives & Outlook (Second Year of the Mid‐term Plan)
April 2019~December 2019: 9‐month accounting period
FY 2022/12 Targets(Final Year of the Mid‐term Plan)
Assumptions: crude oil price (Brent) and exchange rate
US$70.86/bbl ・ ¥110.93/US$(Actual) US$65 ・¥110/US$ US$60 ・¥110/US$
Investment for growth ¥488.4 billion ¥285.0 billion (9‐month accounting period) Around ¥1,700 billion for the 5‐year period
Net sales ¥971.3 billion ¥958.0 billion (9‐month accounting period) Around ¥1,300 billion
Net income ¥96.1 billion ¥90.0 billion (9‐month accounting period) Around ¥150 billion
Net production volume 424 KBOED 577 KBOED 700 KBOED
Shareholder return
Annual dividend: ¥24 per share(End of 2Q: ¥9 + End of FY: ¥15 (Ordinary dividend ¥9, Commemorative dividend ¥6))
Payout ratio: 36.5%
Annual dividend: ¥24 per share (End of 2Q: ¥12 + End of FY: ¥12)
Payout ratio: 38.9%
Maintain base dividend of at least¥24 per share
Enhance shareholder returns instages in accordance with theimprovement in the Company’sfinancial performance
Payout ratio: 30% or higher
In FY 2019/03, net sales and net income increased year‐on‐year driven by higher oil prices and contributionfrom the Ichthys LNG Project, among other factors.The company will aim for steady growth towards achieving the quantitative targets set in the medium‐termbusiness plan in FY 2019/12
In terms of shareholder returns, INPEX has set the year‐end dividend at ¥15 (adding a commemorativedividend of ¥6 to an ordinary dividend of ¥9) per common stock for the year ended March 31, 2019. Combinedwith the mid‐term dividend of ¥9 per common stock, the planned total dividends for the year ended March 31,2019 are ¥24 per common stock. The planned total dividends for the year ending December 31, 2019 are ¥24per common stock.
Progress of Medium‐term Business Plan 2018‐2022and FY 2019/12 Outlook②

Financial Results for the year ended March 31, 2019
Masahiro MurayamaDirector, Senior Managing Executive OfficerSenior Vice President, Finance & Accounting

18
Highlights of the Consolidated Financial Resultsfor the year ended March 31, 2019
Apr. ‘17 ‐Mar. ‘18 Apr. ‘18 ‐Mar. ‘19 Change %Change
Net sales (Billions of yen) 933.7 971.3 37.6 4.0%
Crude oil sales 710.2 782.6 72.4 10.2%
Natural gas sales (including LPG) 208.1 170.7 (37.3) (18.0%)
Others 15.3 17.9 2.6 17.4%
Operating income (Billions of yen) 357.3 474.2 116.9 32.7%
Ordinary income (Billions of yen) 387.2 519.2 132.0 34.1%
Net income attributable to owners of parent (Billions of yen) 40.3 96.1 55.7 138.1%
Net income per share (Yen) 27.64 65.81 38.17 138.1% Average number of INPEX shares issued and outstanding during the year ended March 31, 2019: 1,460,260,300
Average crude oil price (Brent) ($/bbl) 57.85 70.86 13.01 22.5%
Average exchange rate (¥/$) 110.86 110.93 0.07yen 0.1%
depreciation depreciation

19
Crude Oil Sales
Apr. ‘17 ‐Mar. ’18 Apr. ‘18 ‐Mar. ’19 Change %Change
Net sales (Billions of yen) 710.2 782.6 72.4 10.2%
Sales volume (thousand bbl) 112,882 100,503 (12,379) (11.0%)
Average unit price of overseas production ($/bbl) 56.30 70.30 14.00 24.9%
Average unit price of domestic production (¥/kl) 42,143 51,667 9,524 22.6%
Average exchange rate (¥/$) 111.35 110.73 0.62yen 0.6%Appreciation Appreciation
Sales volume by region Apr. ‘17 ‐Mar. ’18 Apr. ‘18 ‐Mar. ’19 Change %Change
(thousand bbl)
Japan 940 789 (151) (16.1%)(149.5 thousand kl) (125.4 thousand kl) (‐24.1 thousand kl)
Asia & Oceania 6,554 5,621 (932) (14.2%)
Eurasia (Europe & NIS) 13,266 15,115 1,849 13.9%
Middle East & Africa 90,412 78,048 (12,364) (13.7%)
Americas 1,710 930 (780) (45.6%)
Total 112,882 100,503 (12,379) (11.0%)
20
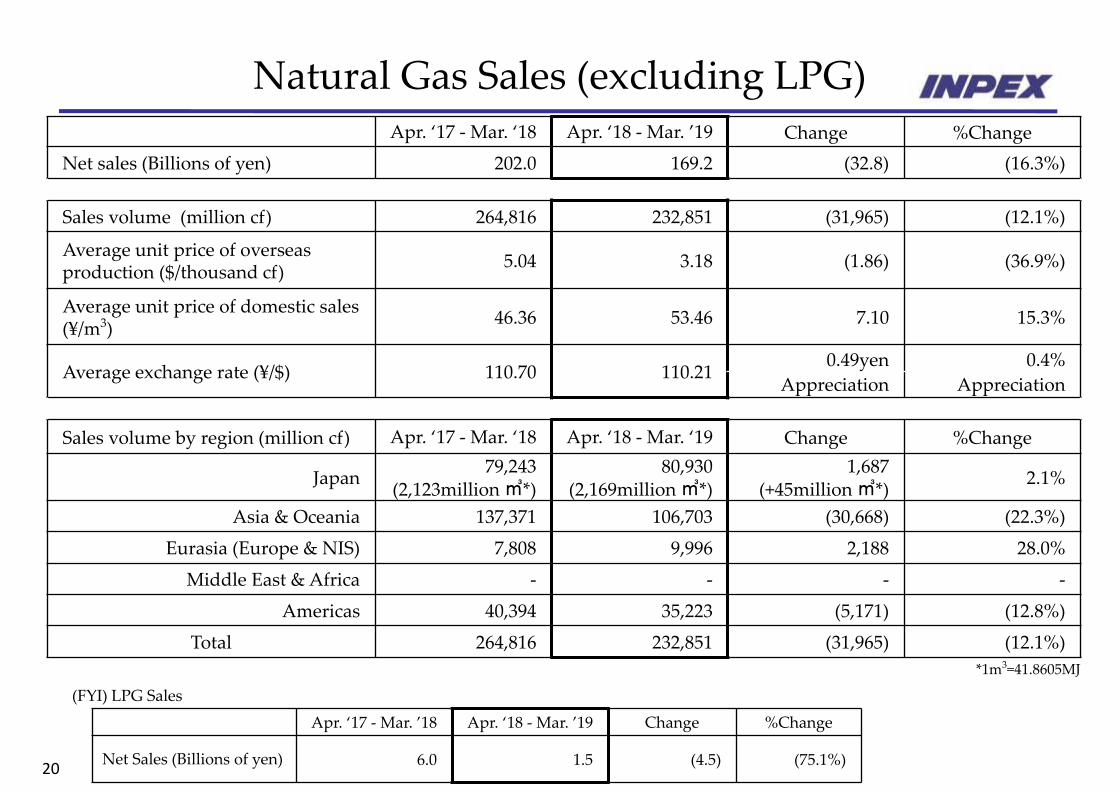
Natural Gas Sales (excluding LPG)
(FYI) LPG Sales
Apr. ‘17 ‐Mar. ’18 Apr. ‘18 ‐Mar. ’19 Change %Change
Net Sales (Billions of yen) 6.0 1.5 (4.5) (75.1%)
Apr. ‘17 ‐Mar. ‘18 Apr. ‘18 ‐Mar. ’19 Change %ChangeNet sales (Billions of yen) 202.0 169.2 (32.8) (16.3%)
Sales volume (million cf) 264,816 232,851 (31,965) (12.1%)
Average unit price of overseas production ($/thousand cf) 5.04 3.18 (1.86) (36.9%)
Average unit price of domestic sales (¥/m3) 46.36 53.46 7.10 15.3%
Average exchange rate (¥/$) 110.70 110.21 0.49yen 0.4%Appreciation Appreciation
Sales volume by region (million cf) Apr. ‘17 ‐Mar. ‘18 Apr. ‘18 ‐Mar. ‘19 Change %Change
Japan 79,243 80,930 1,687 2.1%(2,123million ㎥*) (2,169million ㎥*) (+45million ㎥*) Asia & Oceania 137,371 106,703 (30,668) (22.3%)
Eurasia (Europe & NIS) 7,808 9,996 2,188 28.0%
Middle East & Africa ‐ ‐ ‐ ‐
Americas 40,394 35,223 (5,171) (12.8%)
Total 264,816 232,851 (31,965) (12.1%)*1m3=41.8605MJ

21
Statement of Income(Billions of Yen) Apr. ‘17‐Mar. ’18 Apr. ‘18 ‐Mar. ’19 Change %Change
Net sales 933.7 971.3 37.6 4.0%
Cost of sales 498.0 413.3 (84.7) (17.0%)
Gross profit 435.6 558.0 122.4 28.1%
Exploration expenses 1.3 11.6 10.3 ‐
Selling, general and administrative expenses 76.9 72.1 (4.8) (6.3%)
Operating income 357.3 474.2 116.9 32.7%
Other income 55.2 70.9 15.6 28.3%
Other expenses 25.3 25.9 0.5 2.2%
Ordinary income 387.2 519.2 132.0 34.1%
Extraordinary loss(Impairment loss)
79.9 25.2 (54.7) (68.4%)
Total income taxes 309.3 397.2 87.8 28.4%
Net income (loss) attributable to non‐controlling interests (42.4) 0.6 43.1 ‐
Net income attributable to owners of parent 40.3 96.1 55.7 138.1%
Cost of sales for Crude Oil : 299.9(Change) (58.7)Cost of sales forNatural Gas* : 99.6(Change) (26.5)* Including LPG
Decrease in sales volume : (99.3)Increase in unit price : +139.1Exchange rate(Appreciation of yen) : (4.7)Others : +2.6
Main factors for change :Interest expense +10.2Foreign exchange loss (10.4)
Main factors for change :
Equity in earnings of affiliates +24.1
Main factor for change :Shale Gas Project in Canada (66.6)

22
40.3
(99.3)
(4.7)
2.6
84.7
(29.5)
4.8
34.2
54.7
96.1139.1
(87.8)
(43.1)
‐100
‐50
0
50
100
150
200
250
(億円)(億円)
Net income(loss)
attributable to non‐controlling
interests
Net income attributableto owners of parentApr.18 –Mar. ‘19
Net income attributableto owners of parentApr.17 –Mar. ‘18
Analysis of Net Income Increase
Decreasein Sales volume
Increase inUnit price
Decrease in Cost ofsales
Increase in Explorationexpenses andAllowance forexploration*
Decrease in
SG&A
Other income
and expenses
Net Sales
Increase in income
tax payable
OthersExchange rate(Appreciation
of yen)
(Billions of Yen)
Extraordinaryloss
(Impairmentloss)
*Provision for (gain on reversal of) allowance for recoverable accounts under production sharing and Provision for exploration projects
23
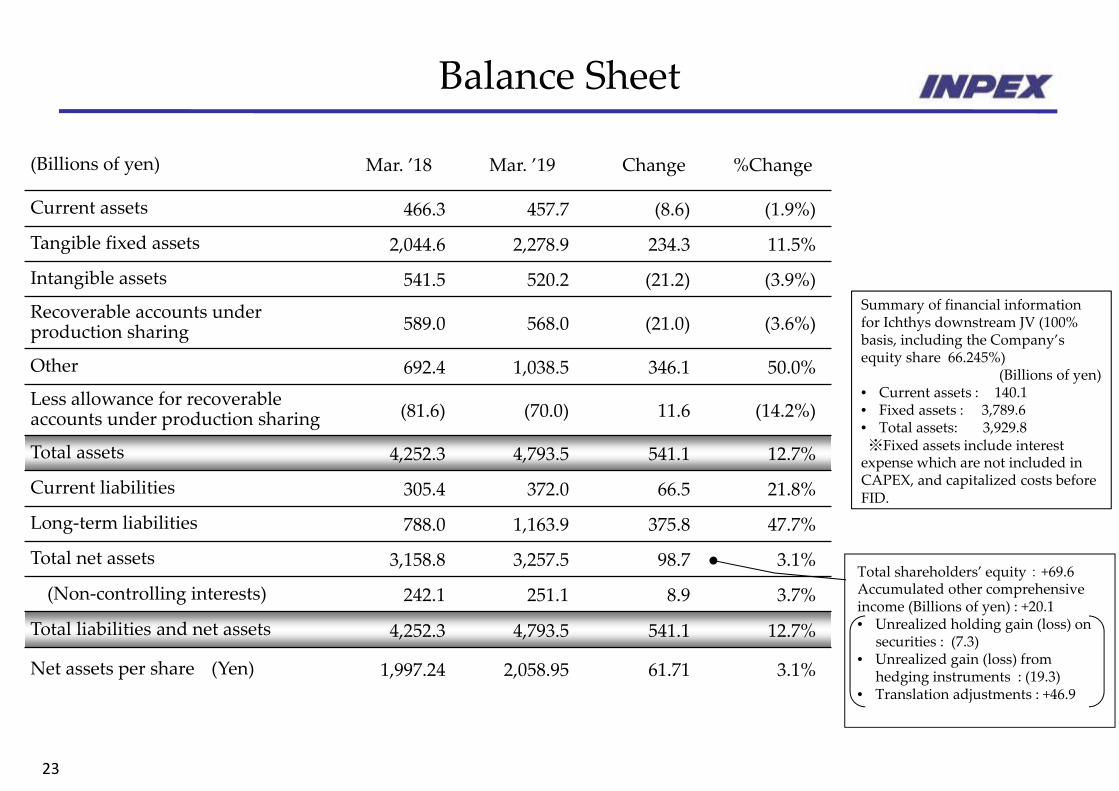
Balance Sheet
(Billions of yen) Mar. ’18 Mar. ’19 Change %Change
Current assets 466.3 457.7 (8.6) (1.9%)
Tangible fixed assets 2,044.6 2,278.9 234.3 11.5%
Intangible assets 541.5 520.2 (21.2) (3.9%)
Recoverable accounts under production sharing 589.0 568.0 (21.0) (3.6%)
Other 692.4 1,038.5 346.1 50.0%
Less allowance for recoverableaccounts under production sharing (81.6) (70.0) 11.6 (14.2%)
Total assets 4,252.3 4,793.5 541.1 12.7%
Current liabilities 305.4 372.0 66.5 21.8%
Long‐term liabilities 788.0 1,163.9 375.8 47.7%
Total net assets 3,158.8 3,257.5 98.7 3.1%
(Non‐controlling interests) 242.1 251.1 8.9 3.7%
Total liabilities and net assets 4,252.3 4,793.5 541.1 12.7%
Net assets per share (Yen) 1,997.24 2,058.95 61.71 3.1%
Summary of financial information for Ichthys downstream JV (100% basis, including the Company’s equity share 66.245%)
(Billions of yen) • Current assets : 140.1 • Fixed assets : 3,789.6 • Total assets: 3,929.8※Fixed assets include interest expense which are not included in CAPEX, and capitalized costs before FID.
Total shareholders’ equity : +69.6Accumulated other comprehensive income (Billions of yen) : +20.1 • Unrealized holding gain (loss) on
securities : (7.3)• Unrealized gain (loss) from
hedging instruments : (19.3)• Translation adjustments : +46.9

24
Statement of Cash Flows(Billions of Yen) Apr. ‘17 ‐Mar. ’18 Apr. ‘18 ‐Mar. ‘19 Change %Change
Income before income taxes 307.2 494.0 186.7 60.8%
Depreciation and amortization 92.8 106.8 14.0 15.2%
Impairment loss 79.9 25.2 (54.7) (68.4%)
Recovery of recoverable accounts under production sharing (capital expenditures) 53.4 33.1 (20.3) (38.0%)
Recoverable accounts under production sharing (operating expenditures) 9.6 4.6 (4.9) (51.8%)
Income taxes paid (329.2) (388.0) (58.8) 17.9%
Other 64.6 (37.2) (101.9) ‐
Net cash provided by (used in) operating activities 278.5 238.5 (39.9) (14.4%)
Payments for time deposits / Proceeds from time deposits 333.9 0.0 (333.9) (100.0%)
Payments for purchases of tangible fixed assets (271.3) (210.7) 60.5 (22.3%)
Payments for purchases of investment securities (127.7) (104.7) 23.0 (18.0%)
Investment in recoverable accounts under production sharing (capital expenditures) (24.1) (31.6) (7.4) 31.1%
Long‐term loans made / Collection of long‐term loans receivable (172.2) (262.4) (90.1) 52.3%
Payments for purchases of mining rights (100.9) (107.8) (6.9) 6.9%
Other 10.5 35.3 24.7 234.1%
Net cash provided by (used in) investing activities (351.9) (682.0) (330.0) 93.8%
Net cash provided by (used in) financing activities 34.7 405.1 370.4 ‐
Cash and cash equivalents at end of the period 276.0 239.6 (36.4) (13.2%)

Consolidated Financial Forecasts for the year ending December 31, 2019 (nine‐month accounting period)
Masahiro MurayamaDirector, Senior Managing Executive OfficerSenior Vice President, Finance & Accounting

26
Consolidated Financial Forecasts for the year ending December 31, 2019 (nine‐month accounting period)
Cash dividends per share (yen)
2Q End 9.0 12.0
FY End 15.0 12.0
TOTAL 24.0 24.0
Full YearMar. ‘19(Actual)
Mar. ‘19(Adjusted actual*)
Dec. ‘19(Forecasts) Change %
Change
Net Sales (Billions of yen) 971.3 800.1 958.0 157.9 19.7%
Operating Income (Billions of yen) 474.2 413.6 442.0 28.4 6.9%
Ordinary Income (Billions of yen) 519.2 445.6 430.0 (15.6) (3.5%)
Net income attributable to owners of parent (Billions of yen) 96.1 52.3 90.0 37.7 72.1%
1st Half (Apr. – Sep. ‘19) 2nd Half (Oct. – Dec. ‘19) Full year
Brent oil price ($/bbl) 65.0 65.0 65.0
Average exchange rate (¥/$) 110.0 110.0 110.0
Net Sales (Billions of yen) 438.2 438.2 549.0 110.8 25.3%
Operating Income (Billions of yen) 226.4 226.4 244.0 17.6 7.8%
Ordinary Income (Billions of yen) 246.9 246.9 228.0 (18.9) (7.7%)
Net income attributable to owners of parent (Billions of yen) 34.0 34.0 44.0 10.0 29.3%
1st Half
* As FY2019 (nine‐month period ending December 2019) is an irregular fiscal year, FY2018 (ended March 2019) has been adjusted based on the nine‐month accounting period accordingly (some subsidiaries follow a twelve‐month accounting period). See slide 1 of the Appendix for details.
FY 2019 dividend reference dates are September 30, 2019 for the mid‐term dividend and December 31, 2019 for the year‐end dividend.

27
Sales and Investment Plan for the year ending December 31, 2019 (nine‐month accounting period)
Mar. ’19(Actual)
Mar. ‘19(Adjusted actual*)
Dec. ’19 (Forecasts ) Change %
Change
Sales Volume
Crude oil (thousand bbl)1 100,503 85,138 102,695 17,557 20.6%
Natural gas (million cf)2 232,851 157,925 366,752 208,827 132.2%
Overseas 151,921 100,828 307,425 206,597 204.9%
Japan 80,930(2,168 million m3)
57,097(1,529 million m3)
59,327(1,589 million m3)
2,230(59 million m3)
3.9%
LPG (thousand bbl)3 204 203 435 232 114.3%
Note 1 CF for domestic crude oil sales and petroleum products : 1kl=6.29bbl2 CF for domestic natural gas sales : 1m3=37.32cf3 CF for domestic LPG sales : 1t=10.5bbl4 Includes Ichthys downstream and asset acquisition expenditures5 “Provision for allowance for recoverable accounts under production sharing” + ”Provision for exploration projects”, relating to exploration activities6 Capital increase from Non‐controlling interests, etc.* As FY2019 (nine‐month period ending December 2019) is an irregular fiscal year, FY2018 (ended March 2019) has been adjusted based on the nine‐month accounting period accordingly (some subsidiaries follow a
twelve‐month accounting period). See slide 1 of the Appendix for details.
(Billions of yen) Mar. ‘19(Actual)
Mar.’19(Adjusted actual*)
Dec. ‘19(Forecasts) Change %
ChangeDevelopment expenditureand others4 471.0 370.6 263.0 (107.6) (29.0%)
Exploration expenditure 13.7 6.4 18.0 11.6 181.3%
Other expenditure 3.7 2.6 4.0 1.4 53.8%
Exploration expenses and Provision for explorations5 13.3 6.3 19.3 13.0 206.3%
(Non‐controlling Interests Portion)6 1.8 1.5 5.3 3.8 253.3%
Exploration expenses 11.6Provision for explorations
1.6
Exploration expenses 3.5Provision for explorations
2.8
Exploration expenses 13.7Provision for explorations
5.6

28
Net Income Sensitivities
(Note1) The sensitivities represent the impact on net income for the year ending December 31, 2019 (nine‐month accounting period) against a $1 /bbl increase (decrease) in the Brent crude oil price on average and a ¥ 1 depreciation (appreciation) against the U.S. dollar. These are based on the financial situation mainly of existing production projects at the beginning of the fiscal year. These are for reference purposes only and the actual impact may change due to fluctuations in production volumes, capital expenditures and cost recoveries, and may not be constant, depending on crude oil prices and exchange rates.
(Note2) This is a sensitivity on net income determined by fluctuations in the oil price and is subject to the average price of crude oil (Brent). As part of the sales price has been finalized at the beginning of each quarter, the sensitivity breakdown for each quarter is estimated taking into account the percentage of the finalized sales price as follows; At the beginning of the 1Q : +3.8 billions of yen (1Q : +0.7 billions of yen, 2Q : +1.2 billions of yen, 3Q : +1.9 billions of yen) At the beginning of the 2Q : +1.9 billions of yen (1Q : --------, 2Q : +0.7 billions of yen, 3Q : +1.2 billions of yen) At the beginning of the 3Q : +0.7 billions of yen (1Q : --------, 2Q : --------, 3Q : +0.7 billions of yen)
(Note3) This is a sensitivity on net income determined by fluctuation of the yen against the U.S. dollar and is subject to the average exchange rate. On the other hand, a sensitivity related to valuation for assets and liabilities denominated in the U.S. dollar on net income incurred by foreign exchange differences between the exchange rate at the end of the fiscal year and the end of the previous fiscal year is almost neutralized.
Sensitivities of crude oil price and foreign exchange fluctuation on consolidated net income attributable to owners of parent for the year ending December 31, 2019 (nine‐month accounting period) (Note 1) (Billions of yen)
Brent Crude Oil Price; $1/bbl increase (decrease) (Note 2)
At the Beginning of the 1Q : +3.8 (‐3.8)The impact on net income will change in FY2019 as below;
At the beginning of the 2Q : +1.9 (‐1.9)At the beginning of the 3Q : +0.7 (‐0.7)
Exchange Rate; ¥1 depreciation (appreciation) against the U.S. dollar (Note 3)
+1.8 (‐1.8)