corporate structure - listed companykencana.listedcompany.com/misc/ar2015.pdf · annual report 2015...
TRANSCRIPT
KENCANA AGRI LIMITEDANNUAL REPORT 2015
SINGAPORE36 Armenian Street
#03-02Singapore 179934
INDONESIAKencana Tower 9th Floor
Business Park Kebon JerukJalan Raya Meruya Ilir No. 88
Jakarta Barat 11620Indonesia
KENCANA AGRI LIMITEDRegistration No. 200717793E
www.kencanaagri.com
KENCANA
AGRI
LIMITED
ANNUAL
REPORT
2015
COMPANY SECRETARY
Mr. Phillip Lim Lian Teng
SHARE REGISTRAR AND SHARE TRANSFER AGENT
Boardroom Corporate & AdvisoryServices Pte. Ltd.
AUDITORS
RSM Chio Lim LLPPublic Accountants and Chartered Accountants8 Wilkie Road,#03-08, Wilkie Edge,Singapore 228095
Partner in Charge: Mr. Kaka Singh
INDEPENDENT VALUER (Biological Assets)
KJPP Benedictus Darmapuspita dan RekanProperty & Business Appraisal,Feasibility Study, AdvisoryJalan Musi 38Jakarta 10150, Indonesia
PRINCIPAL BANKERS
PT Bank Negara Indonesia (Persero) Tbk PT Bank Mandiri (Persero) Tbk PT Bank OCBC NISP Tbk
BOARD OF DIRECTORS
Mr. Henry Maknawi Chairman and CEO
Tengku Alwin Aziz Vice Chairman andIndependent Director
Ms. Ratna MaknawiDeputy CEO
Mr. Kent Surya Finance Director
Mr. Soh Yew Hock Lead Independent Director
Mr. Sim Idrus Munandar Independent Director
Mr. Darwin Indigo Non-Executive andNon-Independent Director
AUDIT & RISK MANAGEMENT COMMITTEE
Mr. Soh Yew Hock Chairman
Tengku Alwin Aziz
Mr. Sim Idrus Munandar
REMUNERATION COMMITTEE
Mr. Sim Idrus Munandar Chairman
Tengku Alwin Aziz
Mr. Soh Yew Hock
NOMINATING COMMITTEE
Tengku Alwin Aziz Chairman
Mr. Soh Yew Hock
Mr. Henry Maknawi
COMPANY REGISTRATION NUMBER
Kencana Agri LimitedRegistration Number: 200717793EIncorporated in the Republic of Singapore
REGISTERED OFFICE
36 Armenian Street#03-02Singapore 179934
PRINCIPAL OFFICE
Kencana Tower, 9th FloorBusiness Park Kebon JerukJalan Raya Meruya llir No. 88Jakarta Barat 11620Indonesia
CONTENTS01 Corporate Profile04 Business and Operations 08 Chairman’s Statement 10 Financial and Operational Highlights15 Key Milestones 18 Sustainability and
Corporate Responsibility
22 Board of Directors24 Key Management Team 25 Corporate Governance 40 Financial Contents
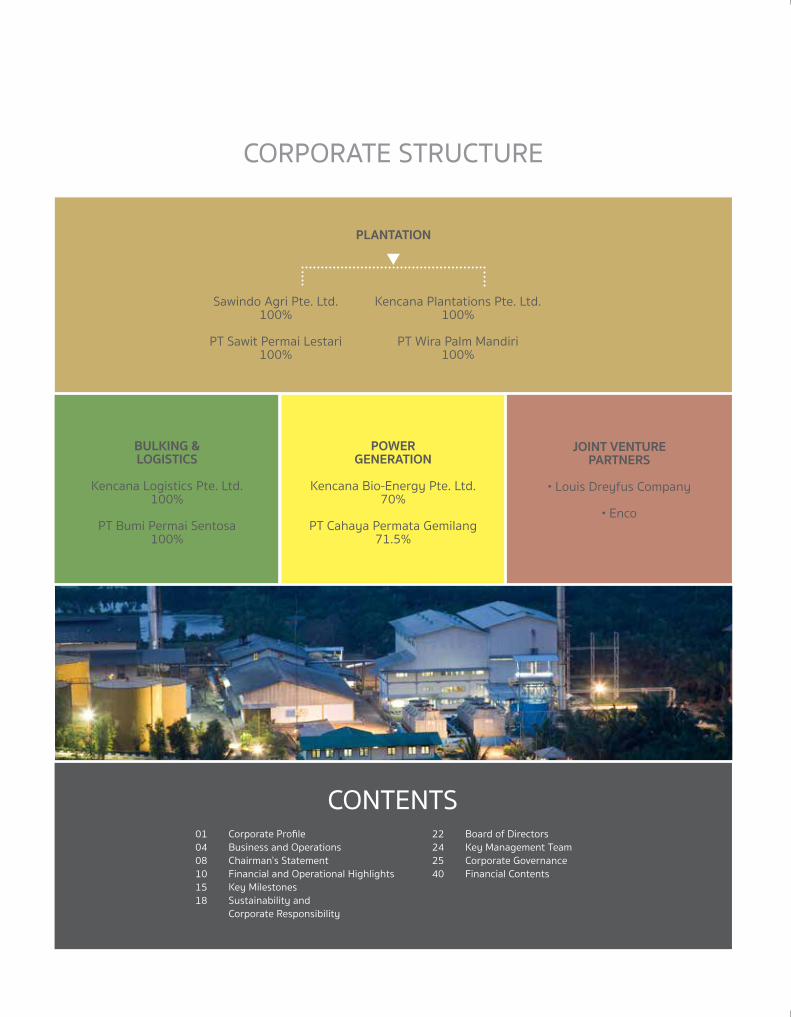
PLANTATION
Sawindo Agri Pte. Ltd. Kencana Plantations Pte. Ltd.100% 100%
PT Sawit Permai Lestari PT Wira Palm Mandiri100% 100%
POWERGENERATION
Kencana Bio-Energy Pte. Ltd.70%
PT Cahaya Permata Gemilang71.5%
JOINT VENTUREPARTNERS
• Louis Dreyfus Company
• Enco
BULKING & LOGISTICS
Kencana Logistics Pte. Ltd.100%
PT Bumi Permai Sentosa100%
▼
CORPORATE INFORMATIONCORPORATE STRUCTURE
KENCANA AGRI LIMITED ANNUAL REPORT 201501
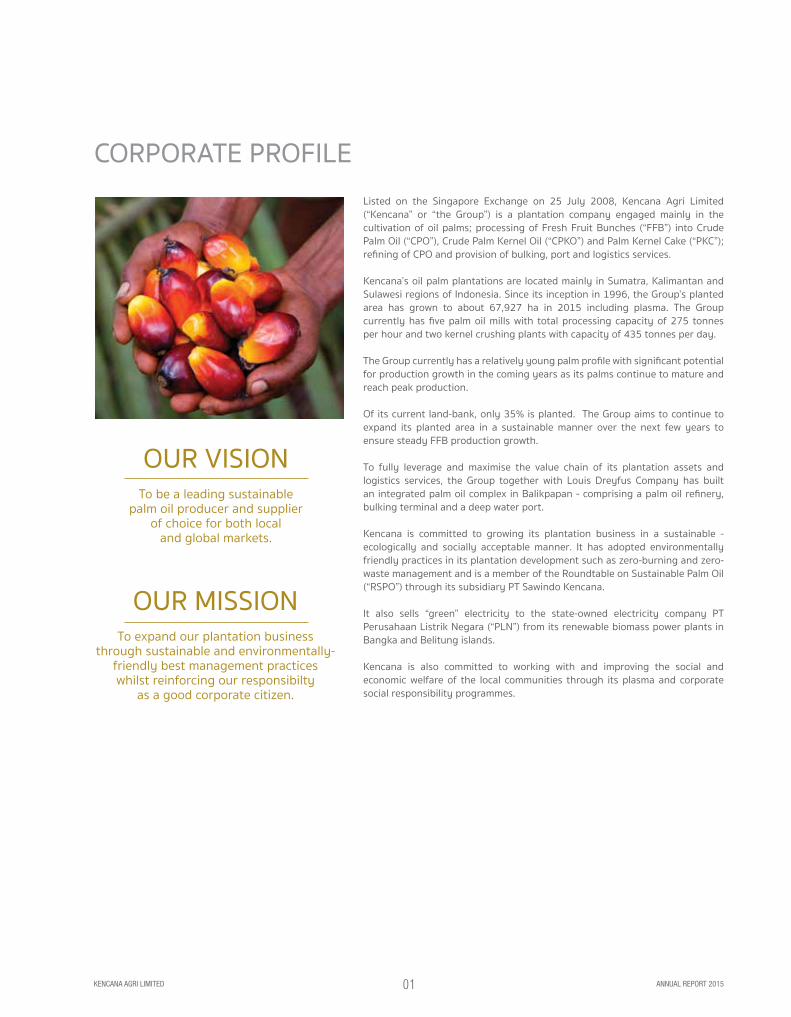
CORPORATE PROFILEListed on the Singapore Exchange on 25 July 2008, Kencana Agri Limited (“Kencana” or “the Group”) is a plantation company engaged mainly in the cultivation of oil palms; processing of Fresh Fruit Bunches (“FFB”) into Crude Palm Oil (“CPO”), Crude Palm Kernel Oil (“CPKO”) and Palm Kernel Cake (“PKC”); refining of CPO and provision of bulking, port and logistics services.
Kencana’s oil palm plantations are located mainly in Sumatra, Kalimantan and Sulawesi regions of Indonesia. Since its inception in 1996, the Group’s planted area has grown to about 67,927 ha in 2015 including plasma. The Group currently has five palm oil mills with total processing capacity of 275 tonnes per hour and two kernel crushing plants with capacity of 435 tonnes per day.
The Group currently has a relatively young palm profile with significant potential for production growth in the coming years as its palms continue to mature and reach peak production.
Of its current land-bank, only 35% is planted. The Group aims to continue to expand its planted area in a sustainable manner over the next few years to ensure steady FFB production growth.
To fully leverage and maximise the value chain of its plantation assets and logistics services, the Group together with Louis Dreyfus Company has built an integrated palm oil complex in Balikpapan - comprising a palm oil refinery, bulking terminal and a deep water port.
Kencana is committed to growing its plantation business in a sustainable - ecologically and socially acceptable manner. It has adopted environmentally friendly practices in its plantation development such as zero-burning and zero-waste management and is a member of the Roundtable on Sustainable Palm Oil (“RSPO”) through its subsidiary PT Sawindo Kencana.
It also sells “green” electricity to the state-owned electricity company PT Perusahaan Listrik Negara (“PLN”) from its renewable biomass power plants in Bangka and Belitung islands.
Kencana is also committed to working with and improving the social and economic welfare of the local communities through its plasma and corporate social responsibility programmes.
OUR VISIONTo be a leading sustainable
palm oil producer and supplier of choice for both local
and global markets.
OUR MISSIONTo expand our plantation business
through sustainable and environmentally-friendly best management practiceswhilst reinforcing our responsibilty
as a good corporate citizen.


Sunrise at Kalimantan Estate
KENCANA AGRI LIMITED ANNUAL REPORT 201504
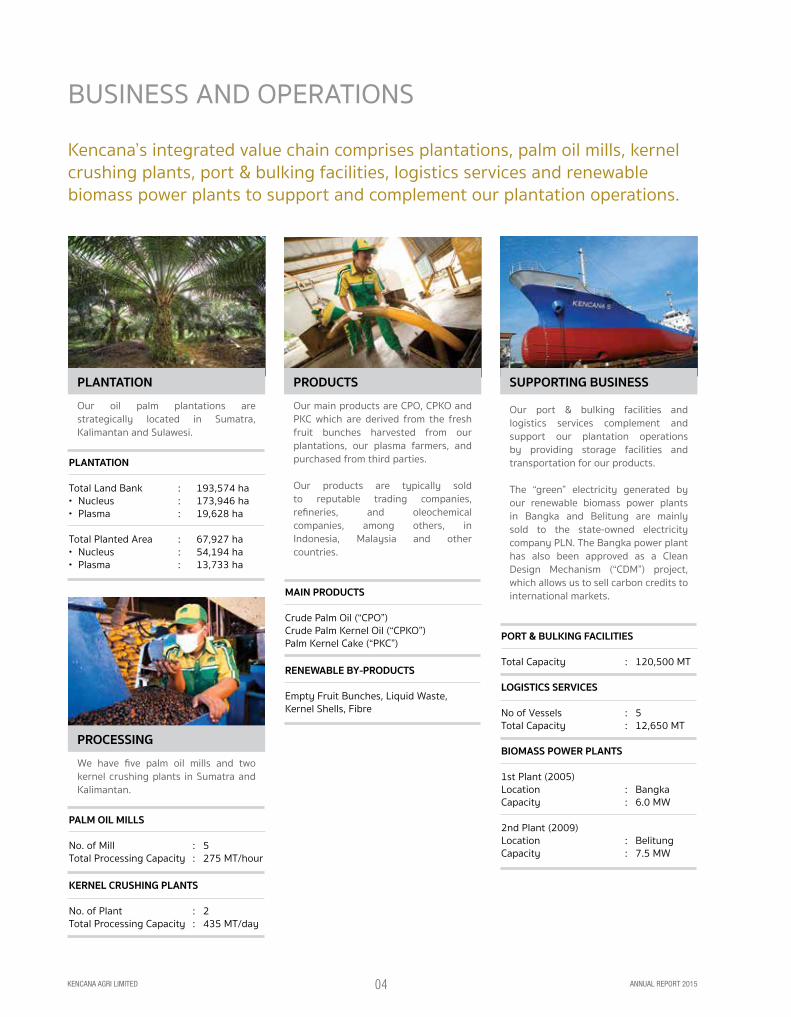
BUSINESS AND OPERATIONS
Kencana’s integrated value chain comprises plantations, palm oil mills, kernel crushing plants, port & bulking facilities, logistics services and renewable biomass power plants to support and complement our plantation operations.
PRODUCTS
PRODUCTS
PLANTATION
Total Land Bank : 193,574 ha • Nucleus : 173,946 ha• Plasma : 19,628 ha
Total Planted Area : 67,927 ha• Nucleus : 54,194 ha• Plasma : 13,733 ha
MAIN PRODUCTS
Crude Palm Oil (“CPO”) Crude Palm Kernel Oil (“CPKO”)Palm Kernel Cake (“PKC”)
RENEWABLE BY-PRODUCTS
Empty Fruit Bunches, Liquid Waste, Kernel Shells, Fibre
PORT & BULKING FACILITIES
Total Capacity : 120,500 MT
LOGISTICS SERVICES
No of Vessels : 5Total Capacity : 12,650 MT
BIOMASS POWER PLANTS
1st Plant (2005)Location : BangkaCapacity : 6.0 MW
2nd Plant (2009)Location : BelitungCapacity : 7.5 MW
PALM OIL MILLS
No. of Mill : 5Total Processing Capacity : 275 MT/hour
KERNEL CRUSHING PLANTS
No. of Plant : 2Total Processing Capacity : 435 MT/day
PLANTATION
Our oil palm plantations are strategically located in Sumatra, Kalimantan and Sulawesi.
PRODUCTS
Our main products are CPO, CPKO and PKC which are derived from the fresh fruit bunches harvested from our plantations, our plasma farmers, and purchased from third parties.
Our products are typically sold to reputable trading companies, refineries, and oleochemical companies, among others, in Indonesia, Malaysia and other countries.
SUPPORTING BUSINESS
Our port & bulking facilities and logistics services complement and support our plantation operations by providing storage facilities and transportation for our products.
The “green” electricity generated by our renewable biomass power plants in Bangka and Belitung are mainly sold to the state-owned electricity company PLN. The Bangka power plant has also been approved as a Clean Design Mechanism (“CDM”) project, which allows us to sell carbon credits to international markets.
PROCESSING
We have five palm oil mills and two kernel crushing plants in Sumatra and Kalimantan.

KENCANA AGRI LIMITED ANNUAL REPORT 201505
GROWTH
EXCELLENCE INTEGRITY
Oil palm estate
Kernel crushing plant
Palm oil mill
Bulking terminal
Biomass power plant1
Refinery, Port & Bulking2
1 Joint venture with ENCO Sdn. Bhd. in Bangka & Belitung 2 Joint venture with Louis Dreyfus Company in Balikpapan
• Medan
Dumai • • SINGAPORE
• JAKARTA
Sumatra
WEST MALAYSIA
Bangka
Belitung
Java
INDONESIA
Bali
South Kalimantan
Southeast Sulawesi
CentralSulawesi
CentralKalimantan
West Kalimantan
EastKalimantan
EAST MALAYSIA
Gorontalo
Balikpapan
• Samarinda
Bulungan
Kutai
BRUNEI
• Surabaya


Main entrance at Kalimantan Estate

KENCANA AGRI LIMITED ANNUAL REPORT 201508
Dear Shareholders
On behalf of the Board of Directors, it is my pleasure to present Kencana’s annual report for the year ended 31 December 2015 (“FY2015”).
PERFORMANCE
2015 was a challenging year for the palm oil industry. Crude palm oil price was soft due to various factors including depressed crude oil prices, ample supply of soybean and slowdown in global demand for edible oils. The Group’s revenue in FY2015 decreased by 25% to US$131.8 million, as a result of lower average selling price (“ASP”) of CPO despite an increase in sales volume. ASP of CPO decreased by 28% from US$708 to US$511 per MT, whereas sales volume of CPO increased by 8% from 210,657 to 226,915 MT.
The Group’s Operating Profit (“OP”) for 2015 decreased from US$32.5 million in 2014 to US$16.4 million and Net Profit After Tax (“NPAT”) decreased from US$7.2 million to a loss of US$17.0 million. The decrease in OP this year was mainly due to the significant drop in the ASP and the decrease in NPAT was mainly due to the drop in ASP and foreign exchange losses.
In this challenging period caused by market and the weather conditions, I am pleased to report the continued increase in our FFB production as a result of more area coming into maturity. FFB production for 2015 was almost 600,000MT. To meet this growth in FFB production we have completed the construction of a fifth palm oil mill in Kutai with 45MT/hr capacity. Our total production capacity now stands at 275MT/hr.
SUSTAINABILITY
Kencana Agri strives to develop its plantation business based on best management practices that are sustainable and environmentally friendly, whilst reinforcing our responsibility as a good corporate citizen.
We are preparing our first sustainability report to reiterate our commitment to no deforestation, no burning, protecting peat area as well as driving a positive socio-economic impact on the community. We fully embrace the principles and criteria of sustainable palm oil production under the Indonesian Sustainable Palm Oil schemes and are working towards the certification of all our estates and mills.
PROSPECTS AND OUTLOOK
We expect 2016 to be a challenging year with the El Niño weather phenomenon affecting production. However, the dry spell may on the other hand bring about the recovery of CPO prices as supply decreases. To meet the short term challenges we are consolidating our operations with particular emphasis on increasing productivity, cost control and operational efficiency. Should the price cycle turn up, we will be ready to benefit from the higher prices.
On the longer term, the outlook for the industry remains positive supported by growth in global consumption. The young age profile of our plantation will put us in a good position to capture the growth in the long term.
DIVIDEND
In view of short term challenges ahead, the Board is not recommending any dividend to be paid for this financial year. We sincerely appreciate your kind understanding and continued support.
APPRECIATION
On behalf of the Board of Directors, I would like to thank all our shareholders, customers and creditors for their continued support and all our staff for their commitment, dedication and hard work.
We are confident of meeting future challenges and seizing opportunities which may come our way to take the Group to the next level of growth.
HENRY MAKNAWI Chairman and Chief Executive Officer
CHAIRMAN’S STATEMENT
KENCANA AGRI LIMITED ANNUAL REPORT 201509
Kencana’s growth potential is still not fully realized yet because 65% of its nucleus oil palms are in the immature and young mature stage. With the relatively young age profile, the Group is well positioned to deliver strong production growth over the next few years.
““
KENCANA AGRI LIMITED ANNUAL REPORT 201510
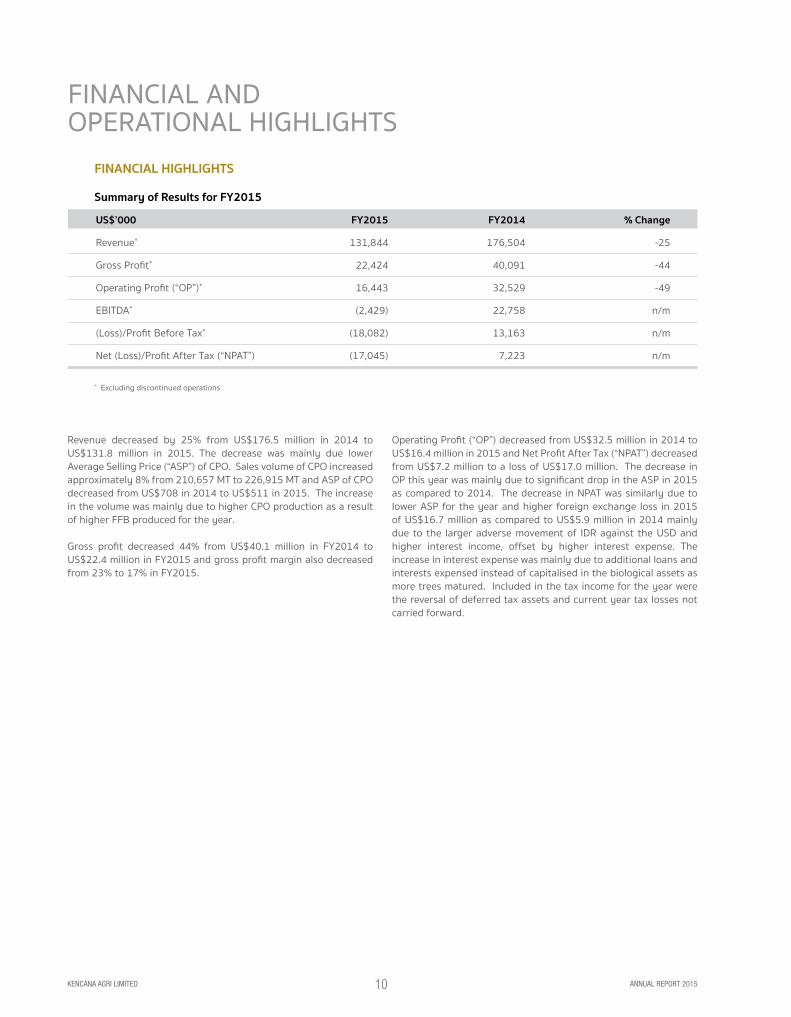
Revenue decreased by 25% from US$176.5 million in 2014 to US$131.8 million in 2015. The decrease was mainly due lower Average Selling Price (“ASP”) of CPO. Sales volume of CPO increased approximately 8% from 210,657 MT to 226,915 MT and ASP of CPO decreased from US$708 in 2014 to US$511 in 2015. The increase in the volume was mainly due to higher CPO production as a result of higher FFB produced for the year.
Gross profit decreased 44% from US$40.1 million in FY2014 to US$22.4 million in FY2015 and gross profit margin also decreased from 23% to 17% in FY2015.
Operating Profit (“OP”) decreased from US$32.5 million in 2014 to US$16.4 million in 2015 and Net Profit After Tax (“NPAT”) decreased from US$7.2 million to a loss of US$17.0 million. The decrease in OP this year was mainly due to significant drop in the ASP in 2015 as compared to 2014. The decrease in NPAT was similarly due to lower ASP for the year and higher foreign exchange loss in 2015 of US$16.7 million as compared to US$5.9 million in 2014 mainly due to the larger adverse movement of IDR against the USD and higher interest income, offset by higher interest expense. The increase in interest expense was mainly due to additional loans and interests expensed instead of capitalised in the biological assets as more trees matured. Included in the tax income for the year were the reversal of deferred tax assets and current year tax losses not carried forward.
Summary of Results for FY2015
FINANCIAL HIGHLIGHTS
FINANCIAL ANDOPERATIONAL HIGHLIGHTS
US$’000 FY2015 FY2014 % Change
Revenue* 131,844 176,504 -25
Gross Profit* 22,424 40,091 -44
Operating Profit (“OP”)* 16,443 32,529 -49
EBITDA* (2,429) 22,758 n/m
(Loss)/Profit Before Tax* (18,082) 13,163 n/m
Net (Loss)/Profit After Tax (“NPAT”) (17,045) 7,223 n/m
* Excluding discontinued operations
KENCANA AGRI LIMITED ANNUAL REPORT 201511
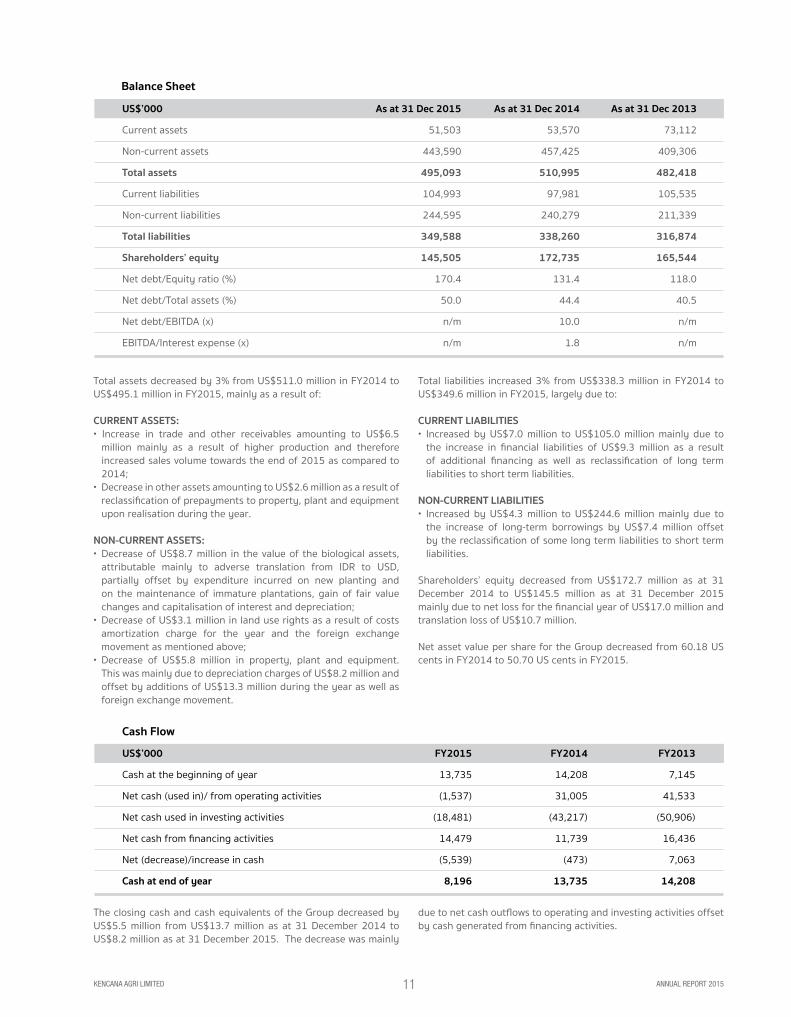
Total assets decreased by 3% from US$511.0 million in FY2014 to US$495.1 million in FY2015, mainly as a result of:
CURRENT ASSETS: • Increase in trade and other receivables amounting to US$6.5
million mainly as a result of higher production and therefore increased sales volume towards the end of 2015 as compared to 2014;
• Decrease in other assets amounting to US$2.6 million as a result of reclassification of prepayments to property, plant and equipment upon realisation during the year.
NON-CURRENT ASSETS:• Decrease of US$8.7 million in the value of the biological assets,
attributable mainly to adverse translation from IDR to USD, partially offset by expenditure incurred on new planting and on the maintenance of immature plantations, gain of fair value changes and capitalisation of interest and depreciation;
• Decrease of US$3.1 million in land use rights as a result of costs amortization charge for the year and the foreign exchange movement as mentioned above;
• Decrease of US$5.8 million in property, plant and equipment. This was mainly due to depreciation charges of US$8.2 million and offset by additions of US$13.3 million during the year as well as foreign exchange movement.
Total liabilities increased 3% from US$338.3 million in FY2014 to US$349.6 million in FY2015, largely due to:
CURRENT LIABILITIES• Increased by US$7.0 million to US$105.0 million mainly due to
the increase in financial liabilities of US$9.3 million as a result of additional financing as well as reclassification of long term liabilities to short term liabilities.
NON-CURRENT LIABILITIES• Increased by US$4.3 million to US$244.6 million mainly due to
the increase of long-term borrowings by US$7.4 million offset by the reclassification of some long term liabilities to short term liabilities.
Shareholders’ equity decreased from US$172.7 million as at 31 December 2014 to US$145.5 million as at 31 December 2015 mainly due to net loss for the financial year of US$17.0 million and translation loss of US$10.7 million.
Net asset value per share for the Group decreased from 60.18 US cents in FY2014 to 50.70 US cents in FY2015.
Cash Flow
Balance Sheet
The closing cash and cash equivalents of the Group decreased by US$5.5 million from US$13.7 million as at 31 December 2014 to US$8.2 million as at 31 December 2015. The decrease was mainly
due to net cash outflows to operating and investing activities offset by cash generated from financing activities.
US$’000 As at 31 Dec 2015 As at 31 Dec 2014 As at 31 Dec 2013
Current assets 51,503 53,570 73,112
Non-current assets 443,590 457,425 409,306
Total assets 495,093 510,995 482,418
Current liabilities 104,993 97,981 105,535
Non-current liabilities 244,595 240,279 211,339
Total liabilities 349,588 338,260 316,874
Shareholders’ equity 145,505 172,735 165,544
Net debt/Equity ratio (%) 170.4 131.4 118.0
Net debt/Total assets (%) 50.0 44.4 40.5
Net debt/EBITDA (x) n/m 10.0 n/m
EBITDA/Interest expense (x) n/m 1.8 n/m
US$’000 FY2015 FY2014 FY2013
Cash at the beginning of year 13,735 14,208 7,145
Net cash (used in)/ from operating activities (1,537) 31,005 41,533
Net cash used in investing activities (18,481) (43,217) (50,906)
Net cash from financing activities 14,479 11,739 16,436
Net (decrease)/increase in cash (5,539) (473) 7,063
Cash at end of year 8,196 13,735 14,208

KENCANA AGRI LIMITED ANNUAL REPORT 201512
Planted Area
Phase 1 Phase 2 Phase 3
Nucleus
Plasma
(Ha)
Years of planting
70,000
65,000
60,000
55,000
50,000
45,000
40,000
35,000
30,000
25,000
20,000
15,000
10,000
5,000
1996 1997 1998 1999 2000 2001 2002 2003 2004 2005 2006 2007 2008 2009 2010 2011 2012 2013 2014 2015
Nucleus
Plasma
Total
17,326
2,747
20,073
17,891
4,737
22,628
18,977
6,249
25,226
54,194
13,733
67,927
32
20
30
33
35
33
35
45
37
Young Mature Prime Mature TotalImmature % % %Age Profile
Development of Kencana’s planted area(Nucleus + Plasma)
FINANCIAL ANDOPERATIONAL HIGHLIGHTS
Young profile of oil palms drives the potential for strong FFB production growth
Kencana’s growth potential is not fully realised yet because 65% of its nucleus oil palms are in the immature and young mature stage. This shows that Kencana’s current profitability is derived mostly from 35% production of its prime mature oil palms.
The young profile of oil palms, with a weighted average age of 7.2 years, will soon enter the prime mature phase. This will drive the potential for strong FFB production growth over the next few years, as the relatively young palms continue to mature and reach peak production stage.
REVIEW OF OPERATIONAL PERFORMANCE
Increasing planted area
The Group continued phase 3 of its oil palm cultivation in Sulawesi region after the first two phases in Sumatra and Kalimantan regions. New planted area for the year was 1,260 ha. Total planted area for nucleus and plasma increased to 67,927 ha as at December 2015.
Nucleus planted area increased by 969 ha to 54,194 ha whereas plasma planted area increased by net 291 ha to 13,733 ha.

KENCANA AGRI LIMITED ANNUAL REPORT 201513
Unplanted Area
(65%)
Planted Area
(35%)
Planted Area(31%)
In general, oil palms start to yield FFB after approximately 36 months of age as they enter the young mature phase. After which, their average FFB yields will increase exponentially from the initial 5-6 MT/ha to up to 22-28 MT/ha when they enter their prime years.
Kencana’s land bank (Nucleus + Plasma)
65%
10%Immature
13%Prime
Mature
12%YoungMature
Nucleus
Plasma
Total
Land Bank(ha)
54,194
13,733
67,927
119,752
5,895
125,647
173,946
19,628
193,574
90
10
100
69
30
65
31
70
35
Total %%%Planted Area(ha)
Unplanted Area(ha)
Nucleus (MT)
Years of harvesting
600,000
550,000
500,000
450,000
400,000
350,000
300,000
250,000
200,000
150,000
100,000
50,000
2001 2002 2003 2004 2005 2006 2007 2008 2009 2010 2011 2012 2013 2014 2015
Last 5 years CAGR 17%
FFB Production Trend (Nucleus)
Oil Palm Age (years)
Average FFB yield (MT/ha)
1 - 3
0
4
5 - 6
5
10 - 12
6
16 - 18
7 - 20
22 - 28
FFB Yield Parameters & Assumptions Young Mature Prime MatureImmature
Higher yields from maturing oil palms will lead to increasing production volume
Due to more area coming into prime mature stage , production of Nucleus FFB increased to 595,969 MT in FY2015. Compounded Annual Growth Rate (“CAGR”) is over 17.2% for the last 5 years. This growth was mainly supported by Kencana’s prime mature oil palms, which comprised about 35% of its total oil palms. With more mature oil palms coming on stream in the next few years and barring unforeseen circumstances, the Group expects its FFB production to continue on an uptrend. With more FFB, CPO production is also expected to ramp up.
Significant unplanted land bank presents immense opportunities for future expansion
As at 31 December 2015, the Group had a total land bank of 193,574 ha (Nucleus and Plasma), with 65% of the area unplanted. There is ample headroom for the Group to pursue its planting programme and gradually achieve a better mix of immature and mature oil palms to deliver sustainable production growth.

KENCANA AGRI LIMITED ANNUAL REPORT 201514
FINANCIAL ANDOPERATIONAL HIGHLIGHTS
2015 2014 2013
LAND BANK (HA) 193,574 193,570 192,716 Nucleus 173,946 90% 174,165 90% 172,717 90% Plasma 19,628 10% 19,405 10% 19,999 10% PLANTED AREA (HA) 67,927 66,666 66,084 Nucleus 54,194 80% 53,224 80% 52,135 79% Plasma 13,733 20% 13,442 20% 13,949 21% PLANTED PROFILE (HA) Nucleus 54,194 53,224 52,135 1 - 3 years (Immature) 17,326 32% 22,817 43% 26,077 50% 4 - 6 years (Young mature) 17,891 33% 13,751 26% 9,512 18% 7 - 20 years (Prime mature) 18,977 35% 16,656 31% 16,546 32% Plasma 13,733 13,442 13,949 1 - 3 years (Immature) 2,747 20% 3,475 26% 4,497 32% 4 - 6 years (Young mature) 4,737 34% 4,495 33% 4,164 30% 7 - 20 years (Prime mature) 6,249 46% 5,472 41% 5,288 38% PRODUCTION VOLUME (MT) FFB Production 761,052 669,644 524,462 Nucleus 595,969 78% 527,118 79% 419,694 80% Plasma 165,083 22% 142,526 21% 104,768 20% FFB Processed 772,964 691,784 564,187 Oil Production CPO 160,043 143,732 113,999 CPKO 5,512 10,596 6,993 AVERAGE FFB YIELD (MT/HA) Nucleus 16.2 17.3 16.1 Plasma 15.0 14.3 11.1 OIL EXTRACTION RATES CPO 20.7% 21.0% 20.2% CPKO 43.3% 43.3% 43.0% SALES VOLUME (MT) CPO 226,915 210,657 331,235 CPKO 5,850 9,999 7,726 AVERAGE SELLING PRICE (US$/MT) CPO 511 708 717 CPKO 770 1,012 718
KENCANA AGRI LIMITED ANNUAL REPORT 201515
KEY MILESTONES1995-2015
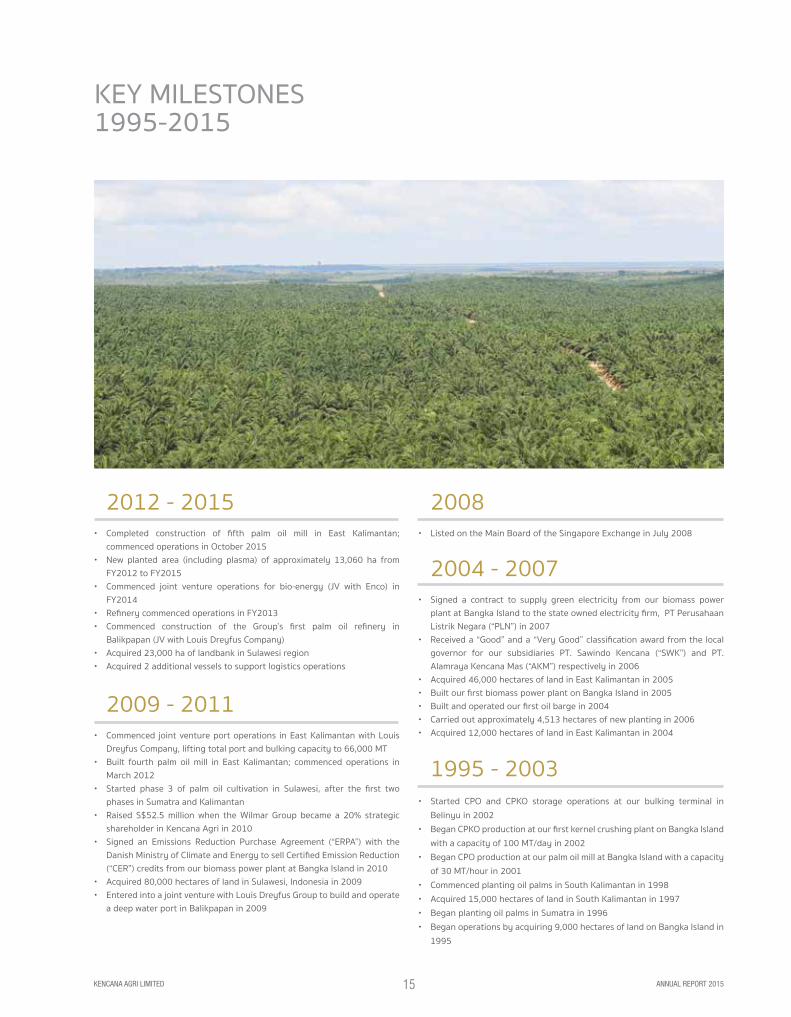
2012 - 2015• Completed construction of fifth palm oil mill in East Kalimantan;
commenced operations in October 2015• New planted area (including plasma) of approximately 13,060 ha from
FY2012 to FY2015• Commenced joint venture operations for bio-energy (JV with Enco) in
FY2014• Refinery commenced operations in FY2013 • Commenced construction of the Group’s first palm oil refinery in
Balikpapan (JV with Louis Dreyfus Company)• Acquired 23,000 ha of landbank in Sulawesi region • Acquired 2 additional vessels to support logistics operations
2009 - 2011
• Commenced joint venture port operations in East Kalimantan with Louis Dreyfus Company, lifting total port and bulking capacity to 66,000 MT
• Built fourth palm oil mill in East Kalimantan; commenced operations in March 2012
• Started phase 3 of palm oil cultivation in Sulawesi, after the first two phases in Sumatra and Kalimantan
• Raised S$52.5 million when the Wilmar Group became a 20% strategic shareholder in Kencana Agri in 2010
• Signed an Emissions Reduction Purchase Agreement (“ERPA”) with the Danish Ministry of Climate and Energy to sell Certified Emission Reduction (“CER”) credits from our biomass power plant at Bangka Island in 2010
• Acquired 80,000 hectares of land in Sulawesi, Indonesia in 2009• Entered into a joint venture with Louis Dreyfus Group to build and operate
a deep water port in Balikpapan in 2009
2008
• Listed on the Main Board of the Singapore Exchange in July 2008
2004 - 2007
• Signed a contract to supply green electricity from our biomass power plant at Bangka Island to the state owned electricity firm, PT Perusahaan Listrik Negara (“PLN”) in 2007
• Received a “Good” and a “Very Good” classification award from the local governor for our subsidiaries PT. Sawindo Kencana (“SWK”) and PT. Alamraya Kencana Mas (“AKM”) respectively in 2006
• Acquired 46,000 hectares of land in East Kalimantan in 2005• Built our first biomass power plant on Bangka Island in 2005• Built and operated our first oil barge in 2004• Carried out approximately 4,513 hectares of new planting in 2006• Acquired 12,000 hectares of land in East Kalimantan in 2004
1995 - 2003
• Started CPO and CPKO storage operations at our bulking terminal in Belinyu in 2002
• Began CPKO production at our first kernel crushing plant on Bangka Island with a capacity of 100 MT/day in 2002
• Began CPO production at our palm oil mill at Bangka Island with a capacity of 30 MT/hour in 2001
• Commenced planting oil palms in South Kalimantan in 1998• Acquired 15,000 hectares of land in South Kalimantan in 1997• Began planting oil palms in Sumatra in 1996• Began operations by acquiring 9,000 hectares of land on Bangka Island in
1995

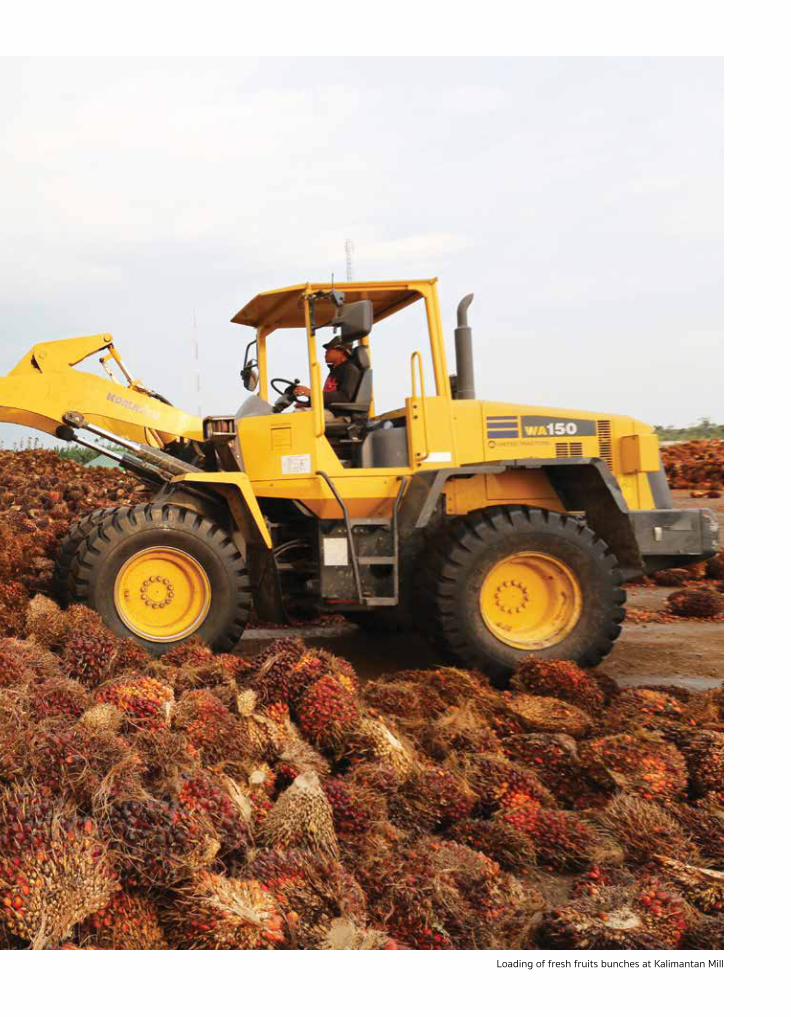
Loading of fresh fruits bunches at Kalimantan Mill
KENCANA AGRI LIMITED ANNUAL REPORT 201518
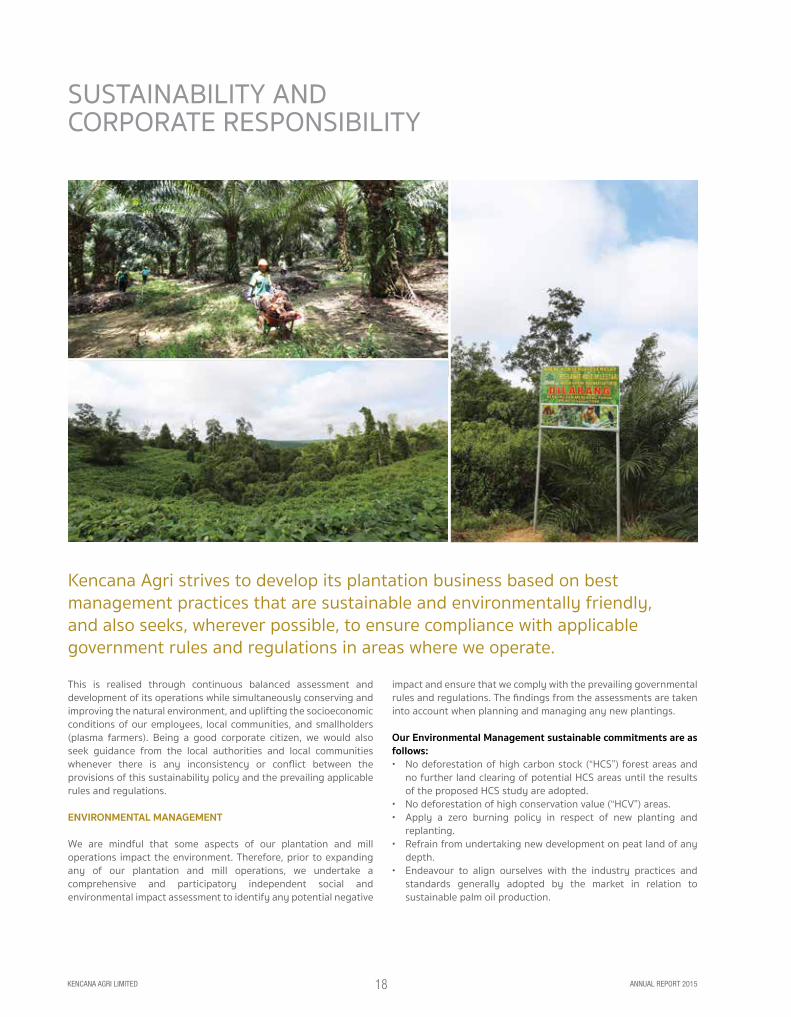
This is realised through continuous balanced assessment and development of its operations while simultaneously conserving and improving the natural environment, and uplifting the socioeconomic conditions of our employees, local communities, and smallholders (plasma farmers). Being a good corporate citizen, we would also seek guidance from the local authorities and local communities whenever there is any inconsistency or conflict between the provisions of this sustainability policy and the prevailing applicable rules and regulations.
ENVIRONMENTAL MANAGEMENT
We are mindful that some aspects of our plantation and mill operations impact the environment. Therefore, prior to expanding any of our plantation and mill operations, we undertake a comprehensive and participatory independent social and environmental impact assessment to identify any potential negative
impact and ensure that we comply with the prevailing governmental rules and regulations. The findings from the assessments are taken into account when planning and managing any new plantings.
Our Environmental Management sustainable commitments are as follows:• No deforestation of high carbon stock (“HCS”) forest areas and
no further land clearing of potential HCS areas until the results of the proposed HCS study are adopted.
• No deforestation of high conservation value (“HCV”) areas. • Apply a zero burning policy in respect of new planting and
replanting. • Refrain from undertaking new development on peat land of any
depth. • Endeavour to align ourselves with the industry practices and
standards generally adopted by the market in relation to sustainable palm oil production.
SUSTAINABILITY AND CORPORATE RESPONSIBILITY
Kencana Agri strives to develop its plantation business based on best management practices that are sustainable and environmentally friendly, and also seeks, wherever possible, to ensure compliance with applicable government rules and regulations in areas where we operate.

KENCANA AGRI LIMITED ANNUAL REPORT 201519
COMMUNITY DEVELOPMENT AND SOCIAL IMPACT
As part of our commitment to improve the social and economic welfare of the local communities in the areas where we operate, we are fully committed in our Plasma Programme and have implemented a multi-pronged Corporate Social Responsibility (“CSR”) programme. We believe that through these community development programmes, we are able to establish good rapport with the local community, which is one of the key factors in ensuring the success of our plantation management.
Through our Plasma Programme, over 8,000 local villagers who were previously plantation workers have now become new plantation owners. As plantation owners, local villagers benefit economically and socially with increased income and better welfare. They also receive training and education in oil palm cultivation. We believe that the improvement in their income will have a multiplier effect on the economy of the entire local community.
Our Community Development and Social Impact sustainable commitment as follows:• Continually develop our plasma program based on applicable
Indonesian laws and regulations. • Facilitate the inclusion of qualified smallholders into the supply
chain. • Implement corporate social responsibility programs. • Respect the rights of indigenous and local communities to give
or withhold their Free, Prior and Informed Consent (FPIC) on lands to which they hold legal, communal or customary rights in line with applicable government regulations.
• Endeavour to resolve complaints and conflicts through an open, transparent and consultative process.
• Respect land tenure rights.
HUMAN RIGHTS AND WORKPLACE
We respect human rights in all aspect and recognize the rights of all workers of our company. We value the diverse culture of Indonesia, and to further foster cultural values, we sponsor and participate in traditional events and social functions. We also contribute to the social and cultural welfare of the local communities by helping to build and repair places of worship such as mosques, churches and temples. In this way, we are able to maintain strong ties with the local communities.
Our Human Rights and Workplace sustainable commitment as follows:• Respect and support the Universal Declaration of Human Rights. • Respect and recognize the rights of all workers, including
contract, temporary and migrant workers. • Comply with minimum wage policies. • Prohibit child labour and forced labour at every stage of our
operations. • Promote a healthy and safe working environment.


Housing at Kalimantan Estate

KENCANA AGRI LIMITED ANNUAL REPORT 201522
BOARD OF DIRECTORSMR. HENRY MAKNAWIChairman and Chief Executive Officer
Mr. Henry Maknawi is responsible for the overall business strategies and policies of the Group. He has developed his expertise in business operations and development based on his knowledge and experience gained in the plantation industry over 19 years. In November 1994, he was conferred the Primaniyarta award for outstanding export from 1989 to 1993 by the late President Soeharto, the second President of the Republic of Indonesia who held office from 1967 to 1998. The Primaniyarta award is the highest award from the Indonesian Government issued by the Menteri Perdagangan Republik Indonesia (Trade Minister of the Republic of Indonesia) and National Agency for Export Development given to exporters at the national and provincial levels for their achievements in increasing non-oil and gas exports.
TENGKU ALWIN AZIZVice-Chairman and Independent Director
Tengku Alwin Aziz has been appointed as Vice-Chairman since 2008. He is also an Independent Director of PT Baramulti Suksessarana Tbk, an Indonesian listed company in the coal mining business and was an Independent Commissioner of PT. London Sumatra Indonesia Tbk, an Indonesian listed company in the palm oil and rubber plantation business from 2000 to 2015. He was appointed by the Indonesian authorities as an interim President Director of PT. Bank Umum Nasional from 1998 to 1999 to oversee the structuring of the bank. Prior to this, he served as an executive director of Bank Dagang Negara from 1992 to 1997 and as President Commissioner of various finance companies (including subsidiaries of Bank Dagang Negara) from 1990 to 1998. He also held the post of Managing Director of Staco International Financial Ltd in Hong Kong from 1990 to 1992. He graduated in 1968 with an Economics degree majoring in Accountancy from Universitas Sumatera Utara, Medan.
MS. RATNA MAKNAWIDeputy Chief Executive Officer
Ms. Ratna Maknawi is responsible for managing the Group’s overall business operations and development. She started as Finance Manager in 1993 and had played pivotal senior management roles in the growth and development of the Group’s diverse businesses before advancing to her present position as Deputy Chief Executive Officer. Ms. Ratna Maknawi graduated cum laude from the University of Wisconsin – Whitewater, USA with a Bachelor of Business Administration (Accounting major) in 1993.
MR. KENT SURYAFinance Director
Mr. Kent Surya is responsible for treasury and cash flow management, finance and corporate finance, IT, tax compliance, and financial reporting at our Group. He is engaged as a Director for most of the Group’s companies since 2004. In 1981-1987, he has held various positions relating to the commercial and housing developer industries. Between 1987 and 1998, as well as 2000 and 2003, he has held various positions related to banking (PT Bank Danamon Indonesia, listed co) and consumer finance (PT Olympindo Multi Finance). In addition, he oversaw a business in the wood-based industry (Hutrindo group) as Chief Operating Officer and Deputy Chief Executive Officer from 1999 to 2000. Since 2004, he has been engaged by some of our Group’s companies, namely SWK, AKM and AIK, first as a senior Financial Advisor and later on as Vice President Director in charge of the Group’s finances and operations. From August 2004 to May 2013, he was engaged as President Director of PT Graha Meruya, a company related to the Group. Mr. Surya graduated in 1983 with a degree in Civil Engineering from the University of Tarumanagara in Jakarta, Indonesia, and obtained his Masters in Business Administration (International-Strategic Management major) in 1994 from the Institut Management Prasetya-Mulya, Jakarta-Indonesia.
KENCANA AGRI LIMITED ANNUAL REPORT 201523
MR. SOH YEW HOCKLead Independent Director
Mr. Soh Yew Hock has been appointed as Lead Independent Director since 2008. He has extensive experience in commerce and industry and is presently the Lead Independent Director and Chairman of the Audit Committee of Japan Residential Assets Manager Limited ( Manager of Saizen Reit ) and Independent Director and Chairman of the Audit and Risk Committee of HTL Holdings Limited. Mr. Soh has previously served as a director of several listed companies and was CEO & Managing Director of Wearnes International (1994) Limited. He is a FELLOW of the Institute of Singapore Chartered Accountants, Certified Practising Accountants (Australia), Association of Chartered Certified Accountants (UK), Chartered Institute of Marketing (UK) and Singapore Institute of Directors. He holds a Bachelor of Accountancy degree from the University of Singapore (now National University of Singapore) and is a graduate of the Chartered Institute of Marketing (UK) and the Advanced Management Program of Harvard Business School. Mr. Soh was a past President of CPA (Australia) Singapore Division.
MR. SIM IDRUS MUNANDARIndependent Director
Mr. Sim Idrus Munandar has been appointed as Independent Director since 2010. He is also an Independent Director of Samko Timber Limited since December 2007 and a commissioner of various companies, namely, PT. Sumber Sawit Sejahtera and PT. Catur Manunggal Hidup Sejahtera. From August 2011 to April 2015, he was an independent commissioner of PT BCA Finance and prior to 2005 he was the President Director of PT. Bina Danatama Finance Tbk, public listed companies in Indonesia engaged in the financing business. Mr. Sim obtained a Bachelor Degree in Economics in 1981 from the University of Indonesia.
MR. DARWIN INDIGONon-Executive and Non-Independent Director
Mr. Darwin has been appointed as Non-executive Director since 2013. He is currently the General Manager - Indonesia for Wilmar Trading Pte. Ltd. Mr. Darwin graduated from Curtin University with a Bachelor of Commerce (Finance) degree in 2002 and was on the Vice Chancellor’s list. He also holds a Master of Business Administration degree from the University of Technology, Sydney.
KENCANA AGRI LIMITED ANNUAL REPORT 201524
MR. ALBERT MAKNAWIChief Operating Officer
Mr. Albert Maknawi has been appointed as COO since 2011 and is responsible for overseeing the group’s overall operational activities. He first joined the Group in 2004, as Technical Manager of PT Sawindo Kencana and was in charge of managing daily operations of mills and purchasing of plant and equipment. Since 2005, he has been a director of PT Listrindo Kencana and is responsible for the development and construction of our renewable biomass power plant operations. He has been a director of PT Belitung Energy (“BE”) since 2006, where he is the founder and project leader responsible for the construction of our Belitung power plant. Mr. Albert Maknawi graduated in 2004 from the University of Melbourne, Australia with a Bachelor of Engineering (Honours) and a Bachelor of Commerce.
MR. AJIS CHANDRAHead of Bulking and Logistics
Mr. Ajis Chandra is in charge of managing the bulking and logistics services of our operations. He is also currently the President Director of PT Indotrust and PT Pelayaran Asia Marine. He was previously with the Lippo Group for about 11 years, holding various positions in Indonesia, Malaysia and Vietnam. Mr. Chandra obtained a Bachelor of Commerce in 1987 and two Masters Degrees in Accountancy and Commerce in 1988 and 1989 respectively, from the University of Wollongong, Australia.
MR. PHILLIP LIMFinancial Controller
Mr. Phillip Lim joined our group in December 2012 as Financial Controller and is responsible for the Group’s financial and accounting matters. Prior to joining the group, Mr Lim has been the Financial Controller of various MNCs for more than 10 years during which his tenure included postings to Argentina, Kazakhstan and China covering areas of financial and management reporting, ERP system implementation and setting up of companies overseas. Mr. Lim graduated from the National University of Singapore with a Bachelor of Accountancy degree in 1990. He is currently a non-practising member of the Institute of Singapore Chartered Accountants.
KEY MANAGEMENT TEAM

KENCANA AGRI LIMITED ANNUAL REPORT 201525
CORPORATE GOVERNANCE REPORTThe Board of Kencana Agri Limited (the “Company”) and its Management are committed to ensuring high standards of corporate governance so as to ensure transparency, to protect shareholders’ interests and promote investors’ confidence.
This report describes the Group’s corporate governance structures and practices that were in place throughout the financial year ended 31 December 2015, with specific reference made to the principles of the Code of Corporate Governance 2012 (the “Code”).
The Board is pleased to confirm that for the financial year ended 31 December 2015, the Group has adhered to the principles and guidelines as set out in the Code where appropriate, and has disclosed and explained any deviations from the Code in this report.
BOARD MATTERS
The Board’s Conduct of Affairs
Principle 1: Every company should be headed by an effective Board to lead and control the Company. The Board is collectively responsible for the long-term success of the company. The Board works with Management to achieve this objective and the Management remains accountable to the Board.
The Board currently consists of seven members :
Henry Maknawi Chairman and Chief Executive OfficerTengku Alwin Aziz Vice-Chairman and Independent DirectorRatna Maknawi Deputy Chief Executive OfficerKent Surya Finance DirectorSoh Yew Hock Lead Independent Director Sim Idrus Munandar Independent DirectorDarwin Indigo Non-Executive and Non-Independent Director
The Board is entrusted with the responsibility of the overall management of the Company. The principal function of the Board is to protect and enhance long-term value and returns for its shareholders. Besides carrying out its statutory responsibilities, the Board’s role is to:
a) approve corporate objectives, plans, strategies, policies and financial objectives of the Group and monitoring the performance of Management;
b) oversee the processes for evaluating the adequacy of internal controls, risk management, financial reporting and compliance;
c) approve nominations and appointments of Board directors, committee members and key personnel;
d) approve proposals with regard to annual budgets, investments, capital expenditures, major acquisitions and divestments;
e) consider sustainability issues, e.g. environmental and social factors, as part of its strategic formulation; and
f) assume responsibility for corporate governance.
KENCANA AGRI LIMITED ANNUAL REPORT 201526
CORPORATE GOVERNANCE REPORTThe Board meets regularly to review the Group’s performance, to deliberate on specific issues including major acquisitions and disposals, to approve the annual budget and to approve the release of the quarterly, half-yearly and year-end financial results. There is an objective decision-making process, which allows each Director to engage in constructive discussion and make decisions in the best interests of the Company.
A schedule of all Board and Board Committee meetings as well as the Annual General Meeting for the next calendar year is planned in advance. The Board meets at least four times a year. In addition to the scheduled meetings, ad-hoc board briefings, conference calls and physical meetings are held as warranted by particular circumstances or as deemed appropriate by the Board members. The Company’s Constitution permits meetings of the Directors to be conducted by telephone or other methods of simultaneous communication by electronic means. The Board and Board Committees may also make decisions through circulating resolutions.
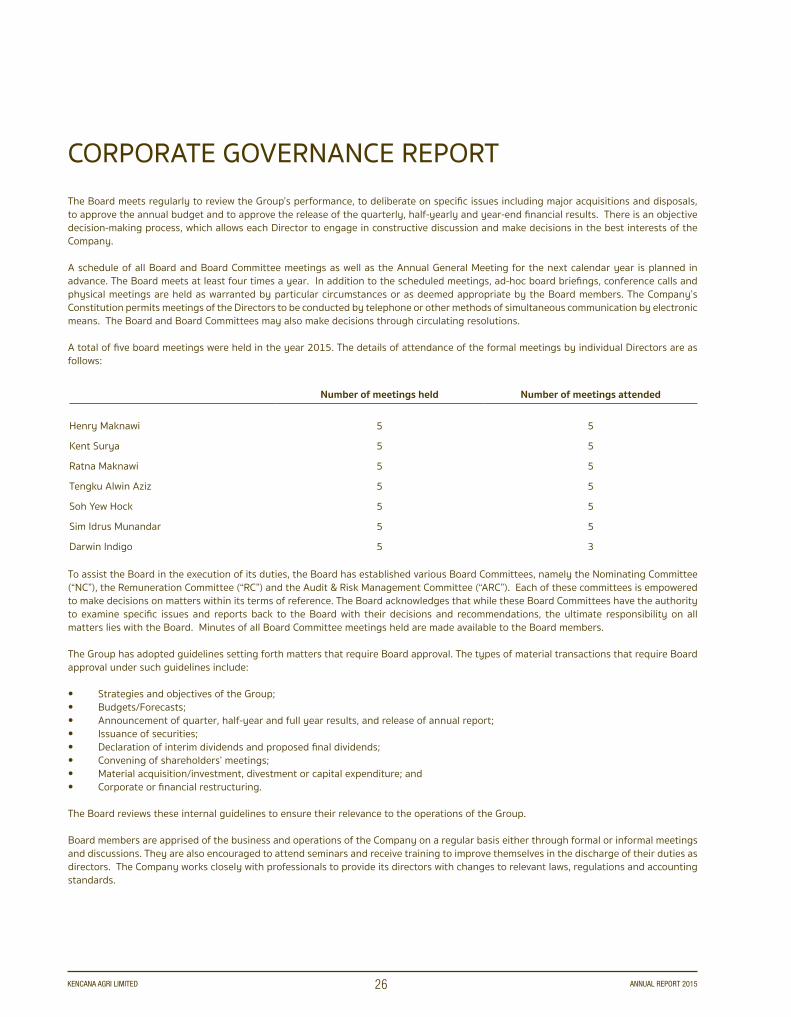
A total of five board meetings were held in the year 2015. The details of attendance of the formal meetings by individual Directors are as follows:
Number of meetings held Number of meetings attended
Henry Maknawi 5 5
Kent Surya 5 5
Ratna Maknawi 5 5
Tengku Alwin Aziz 5 5
Soh Yew Hock 5 5
Sim Idrus Munandar 5 5
Darwin Indigo 5 3
To assist the Board in the execution of its duties, the Board has established various Board Committees, namely the Nominating Committee (“NC”), the Remuneration Committee (“RC”) and the Audit & Risk Management Committee (“ARC”). Each of these committees is empowered to make decisions on matters within its terms of reference. The Board acknowledges that while these Board Committees have the authority to examine specific issues and reports back to the Board with their decisions and recommendations, the ultimate responsibility on all matters lies with the Board. Minutes of all Board Committee meetings held are made available to the Board members.
The Group has adopted guidelines setting forth matters that require Board approval. The types of material transactions that require Board approval under such guidelines include:
• Strategies and objectives of the Group;• Budgets/Forecasts;• Announcement of quarter, half-year and full year results, and release of annual report;• Issuance of securities;• Declaration of interim dividends and proposed final dividends;• Convening of shareholders’ meetings;• Material acquisition/investment, divestment or capital expenditure; and• Corporate or financial restructuring.
The Board reviews these internal guidelines to ensure their relevance to the operations of the Group.
Board members are apprised of the business and operations of the Company on a regular basis either through formal or informal meetings and discussions. They are also encouraged to attend seminars and receive training to improve themselves in the discharge of their duties as directors. The Company works closely with professionals to provide its directors with changes to relevant laws, regulations and accounting standards.
KENCANA AGRI LIMITED ANNUAL REPORT 201527
CORPORATE GOVERNANCE REPORTA newly appointed director will undergo a customized orientation program led by Management. This is to provide the new Director with background information about the Group’s structure and core values, its strategic direction and corporate governance practices as well as industry-specific knowledge. The orientation program gives the new Director an understanding of the Group’s businesses to enable him to assimilate into his new role. It also allows the new Director to get acquainted with the Management, thereby facilitating interaction and independent access to the Management. The Company will also provide newly appointed director with a formal letter setting out the duties and obligations of a director.
The Directors are provided with continuous briefings and updates in areas such as changes in company law, changes in SGX listing rules, corporate governance practices and changes in financial reporting standards, so as to enable them to make well-informed decisions. Where possible and when opportunity arises, the Directors will be invited to locations within the Group’s operating businesses to enable them to obtain a better perspective of the business and enhance their understanding of the Group’s operations.
The Board as a whole is updated regularly on corporate governance, industry specific knowledge and the key changes in the relevant regulatory requirements and financial reporting standards, so as to enable them to properly discharge their duties.
The Directors may also attend other appropriate courses, conferences and seminars, at the Company’s expense. They can also request for further explanations, briefings or information on any aspect of the Company’s operations or business issues from Management.
Board Composition and Guidance
Principle 2: There should be a strong and independent element on the Board, which is able to exercise objective judgement on corporate affairs independently, in particular, from Management and 10% shareholders. No individual or small group of individuals should be allowed to dominate the Board’s decision making.
The Company endeavours to maintain a strong and independent element on the Board. As at the date of this report, more than one-third of the Board members are independent directors.
While the Chairman and the CEO is the same person, the Board is of the opinion that based on the Group’s current size and operations, it is not necessary to have independent directors make up at least half of the Board at present.
The NC determines on an annual basis whether or not a director is independent, taking into account the Code’s definition of an “independent” director and guidance on relationships, the existence of which would deem a director not to be independent. A Director who has no relationship with the Company, its related corporations, its 10% shareholders or its officers that could interfere, or be reasonably perceived to interfere, with the exercise of his independent judgement in the best interests of the Company, is considered to be independent.
The independence of each Director is reviewed annually by the NC. Each independent director is required to complete a Director’s Independence Declaration annually to confirm his independence based on the guidelines as set out in the Code. As at the date of this report, there is no Director who has served on the Board for more than 9 years from the date of his first appointment.
The Board is of the opinion that its current size of seven Board members is both effective and efficient. The Board’s structure, size and composition is reviewed annually by the NC who is of the view that the current size of the Board is appropriate, taking into account the nature and size of the Group’s business and operation, to facilitate effective decision making.
In recommending new appointments to the Board, the NC takes into consideration the balance and diversity of skills, calibre, experience, expertise, attributes, ability and gender, amongst other factors, required to support the Group’s business activities or strategies, the current composition and size of the Board, and strives to ensure that the Board has an appropriate balance of Independent Directors.
KENCANA AGRI LIMITED ANNUAL REPORT 201528
CORPORATE GOVERNANCE REPORTTo facilitate the annual review of the directors’ mix of skills and experiences that the Board requires to function competently and efficiently, all directors will provide information of their areas of specialization and expertise to the NC. The NC, having reviewed such information, is satisfied that the Board members possess a balanced field of core competencies such as accounting and finance, business and management experience and the requisite industry knowledge to lead the Company. Details of the Board members’ qualifications and experience are presented in this Annual Report under the heading “Board of Directors” on pages 22 to 23.
Management regularly puts up proposals or reports for the Board’s consideration and approval, for instance, proposals relating to specific transactions or general business direction or strategy of the Group. Independent non-executive Directors, will then evaluate these proposals or reports and where appropriate, provide guidance to Management.
Chairman and Chief Executive Officer
Principle 3: There should be a clear division of responsibilities between the leadership of the Board and the executives responsible for managing the company’s business. No one individual should represent a considerable concentration of power.
The Chairman and Chief Executive Officer (“CEO”) of the Company is Mr. Henry Maknawi. The Board, after careful consideration, is of the opinion that the need to separate the roles of the Chairman and CEO is not necessary for the time being.
All major proposals and decisions are discussed and reviewed by the Board. The Chairman and CEO’s performance and appointment to the Board is reviewed by the NC and his remuneration package is reviewed by the RC. The ARC and RC consist of all independent directors and the NC consists of a majority of independent directors. Given this, the Board believes that there are sufficient strong and independent elements and safeguards in place against an uneven concentration of power and authority in a single individual.
The Chairman’s duties and responsibilities include:-
(a) Leading the Board to ensure it is effective in its role;(b) Scheduling of meetings to enable the Board to perform its duties responsibly;(c) Ensuring the proper conduct of meetings and accurate documentation of the proceedings;(d) Ensuring the smooth and timely flow of information between the Board and Management;(e) Ensuring compliance with internal polices and guidelines of the Company and high standards of corporate governance;(f) Ensuring effective communication with shareholders through investors’ relationship channels and timely announcements of
Company’s development;(g) Encouraging constructive relations between the Board and Management as well as between all directors.
In addition to the above duties, the Chairman will assume duties and responsibilities as may be required from time to time.
A Lead Independent Director, Mr. Soh Yew Hock, has been appointed, since the listing of the Company, to be an alternative avenue for shareholders and other directors to raise their concerns where raising through the normal channels of the Chairman has failed to resolve, or where such contact is inappropriate.
The Independent Directors meet with the Company’s external auditors without the presence of Management to discuss matters such as the Group’s financial performance, corporate governance and risk management initiatives and board processes.
Board Membership
Principle 4: There should be a formal and transparent process for the appointment and re-appointment of directors to the Board.
The NC is established and it comprises 3 members, the majority of whom, including the Chairman, are non-executive independent directors.
Chairman : Tengku Alwin AzizMember : Soh Yew HockMember : Henry Maknawi
KENCANA AGRI LIMITED ANNUAL REPORT 201529
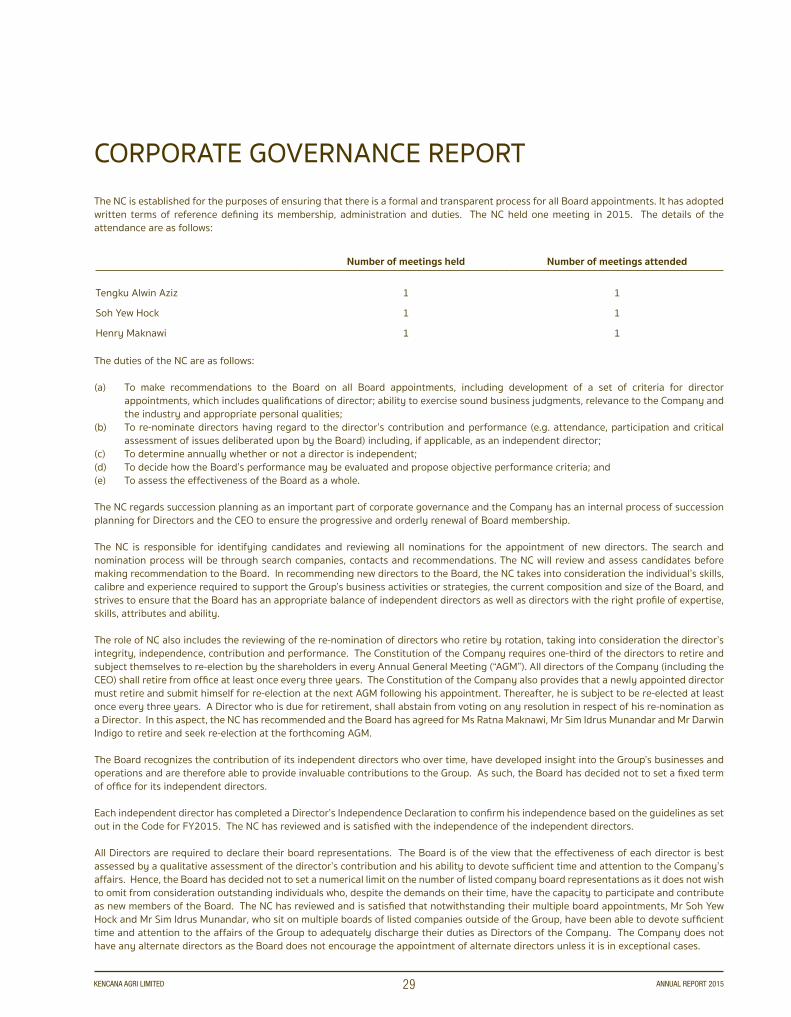
CORPORATE GOVERNANCE REPORTThe NC is established for the purposes of ensuring that there is a formal and transparent process for all Board appointments. It has adopted written terms of reference defining its membership, administration and duties. The NC held one meeting in 2015. The details of the attendance are as follows:
Number of meetings held Number of meetings attended
Tengku Alwin Aziz 1 1
Soh Yew Hock 1 1
Henry Maknawi 1 1
The duties of the NC are as follows:
(a) To make recommendations to the Board on all Board appointments, including development of a set of criteria for director appointments, which includes qualifications of director; ability to exercise sound business judgments, relevance to the Company and the industry and appropriate personal qualities;
(b) To re-nominate directors having regard to the director’s contribution and performance (e.g. attendance, participation and critical assessment of issues deliberated upon by the Board) including, if applicable, as an independent director;
(c) To determine annually whether or not a director is independent;(d) To decide how the Board’s performance may be evaluated and propose objective performance criteria; and(e) To assess the effectiveness of the Board as a whole.
The NC regards succession planning as an important part of corporate governance and the Company has an internal process of succession planning for Directors and the CEO to ensure the progressive and orderly renewal of Board membership.
The NC is responsible for identifying candidates and reviewing all nominations for the appointment of new directors. The search and nomination process will be through search companies, contacts and recommendations. The NC will review and assess candidates before making recommendation to the Board. In recommending new directors to the Board, the NC takes into consideration the individual’s skills, calibre and experience required to support the Group’s business activities or strategies, the current composition and size of the Board, and strives to ensure that the Board has an appropriate balance of independent directors as well as directors with the right profile of expertise, skills, attributes and ability.
The role of NC also includes the reviewing of the re-nomination of directors who retire by rotation, taking into consideration the director’s integrity, independence, contribution and performance. The Constitution of the Company requires one-third of the directors to retire and subject themselves to re-election by the shareholders in every Annual General Meeting (“AGM”). All directors of the Company (including the CEO) shall retire from office at least once every three years. The Constitution of the Company also provides that a newly appointed director must retire and submit himself for re-election at the next AGM following his appointment. Thereafter, he is subject to be re-elected at least once every three years. A Director who is due for retirement, shall abstain from voting on any resolution in respect of his re-nomination as a Director. In this aspect, the NC has recommended and the Board has agreed for Ms Ratna Maknawi, Mr Sim Idrus Munandar and Mr Darwin Indigo to retire and seek re-election at the forthcoming AGM.
The Board recognizes the contribution of its independent directors who over time, have developed insight into the Group’s businesses and operations and are therefore able to provide invaluable contributions to the Group. As such, the Board has decided not to set a fixed term of office for its independent directors.
Each independent director has completed a Director’s Independence Declaration to confirm his independence based on the guidelines as set out in the Code for FY2015. The NC has reviewed and is satisfied with the independence of the independent directors.
All Directors are required to declare their board representations. The Board is of the view that the effectiveness of each director is best assessed by a qualitative assessment of the director’s contribution and his ability to devote sufficient time and attention to the Company’s affairs. Hence, the Board has decided not to set a numerical limit on the number of listed company board representations as it does not wish to omit from consideration outstanding individuals who, despite the demands on their time, have the capacity to participate and contribute as new members of the Board. The NC has reviewed and is satisfied that notwithstanding their multiple board appointments, Mr Soh Yew Hock and Mr Sim Idrus Munandar, who sit on multiple boards of listed companies outside of the Group, have been able to devote sufficient time and attention to the affairs of the Group to adequately discharge their duties as Directors of the Company. The Company does not have any alternate directors as the Board does not encourage the appointment of alternate directors unless it is in exceptional cases.

KENCANA AGRI LIMITED ANNUAL REPORT 201530
CORPORATE GOVERNANCE REPORTThe details of the Board members’ directorship including the year of initial appointment and election are disclosed as follows:
Name of DirectorsDate of Initial Appointment
Date of Last Re-election
Present directorships and chairmanships
in other listed companies
Directorships and chairmanships in other listed companies over the
preceding three years
Henry Maknawi 30 May 2008 24 April 2015 Nil Nil
Kent Surya 30 May 2008 24 April 2015 Nil Nil
Ratna Maknawi 26 September 2007 24 April 2014 Nil Nil
Tengku Alwin Aziz 30 May 2008 24 April 2015 PT Baramulti Suksessarana Tbk – Independent Director
Nil
Soh Yew Hock 30 May 2008 24 April 2015 Japan Residential Assets Manager Ltd (Manager of Saizen REIT) – Independent Director and Chairman of Audit Committee HTL International Holdings Limited – Independent Director and Chairman of Audit and Risk Committee
Japan Residential Assets Manager Ltd (Manager of Saizen REIT) – Independent Director and Chairman of Audit Committee HTL International Holdings Limited – Independent Director and Chairman of Audit and Risk Committee
Sim Idrus Munandar 30 September 2010 26 April 2013 Samko Timber Limited – Independent Director and Chairman of Nominating Committee
Samko Timber Limited – Independent Director and Chairman of Nominating Committee
Darwin Indigo 26 April 2013 24 April 2014 Nil Nil
Board Performance
Principle 5: There should be a formal assessment of the effectiveness of the Board as a whole and the contribution by each director to the effectiveness of the Board.
The NC has adopted a process for assessing the performance of the Board as a whole instead of individual assessment. The performance appraisal includes qualitative and quantitative factors including Board structure, conduct of meetings, corporate strategy and planning, risk management and internal control, and so on. Although the Code proposes certain financial indicators as performance criteria, such as the Company’s share price performance, the Board is of the opinion that the performance criteria should be geared toward evaluating the performance of the Board and the directors in discharging its principal responsibilities, upholding high standards of corporate governance and strategic oversight of the Company’s business rather than the specific performance of the Company’s share price and other financial indicators.
The NC undertakes the Board performance appraisal annually. All Directors are requested on an annual basis to complete a Board assessment checklist designed to seek their views on the various performance criteria set by the Board, so as to assess the overall performance and effectiveness of the Board. The checklists are completed and submitted to the company secretary (the “Company Secretary”) for collation and the consolidated responses are presented to the NC for review and discussion before making any recommendations to the Board. The performance criteria will not change from year to year unless they are deemed necessary and the Board is able to justify the changes. The key objective of the evaluation exercise is to obtain constructive feedback from each Director to continually improve the Board’s performance against certain short and long-term financial and non-financial performance indicators and to identify areas for improvement and to implement appropriate action. The responses are reviewed by NC and discussed with Board members for determining areas of improvement.
The NC has decided unanimously, that the Directors will not be evaluated individually, as each member of the Board contributes in different aspects to the success of the Group, and therefore, it would be more appropriate to assess the Board as a whole. Following its review, the NC is of the view that the Board and its Board Committees operate effectively and despite multiple board representations in certain instances, each Director has been adequately contributing to the overall effectiveness and objectives of the Board.
KENCANA AGRI LIMITED ANNUAL REPORT 201531
CORPORATE GOVERNANCE REPORTAccess to Information
Principle 6: In order to fulfill their responsibilities, Board members should be provided with complete, adequate and timely information prior to Board meetings and on an on-going basis so as to enable them to make informed decisions to discharge their duties and responsibilities.
The Board is furnished with Board papers prior to any Board meeting. These papers are issued in sufficient time to enable the Directors to obtain additional information or explanations from the Management, if necessary. The Board papers include minutes of the previous meeting, reports relating to investment proposals, budgets, financial results announcements and reports from committees, internal and external auditors. Any additional material or information requested by the Directors is promptly furnished.
The Directors may communicate directly with the Management team on all matters whenever they deem necessary. All Directors have unrestricted access to the Group’s records and information. The Directors also have separate and independent access to the Company Secretary, the Company’s external auditors, internal auditors and other professional advisors, where relevant. The Company Secretary attends Board and committee meetings and is responsible for ensuring that Board procedures are followed and minutes of all meetings are recorded and circulated to the Board and the committees. The Company Secretary also assists the Chairman and CEO, the Chairman of each committee and Management in the development of the agendas for the various Board and committee meetings. The appointment and removal of the Company Secretary are subject to the approval of the Board.
The Company currently does not have a formal procedure for Directors to seek independent professional advice for the furtherance of their duties. However, directors may, on a case-to-case basis, propose to the Board for such independent professional advice, the cost of which may be borne by the Company.
The Company has a transparent policy wherein directors are welcomed to request further information or informal discussions and make recommendations on any aspect of the Company’s operations or business issues.
REMUNERATION MATTERS
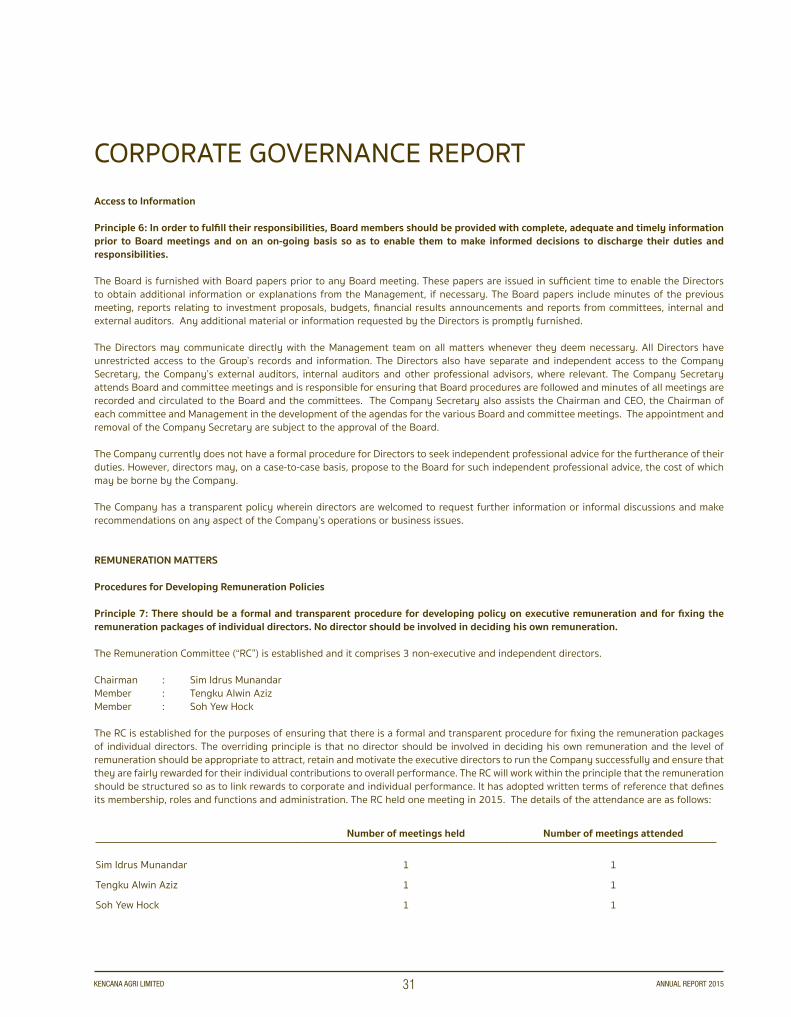
Procedures for Developing Remuneration Policies
Principle 7: There should be a formal and transparent procedure for developing policy on executive remuneration and for fixing the remuneration packages of individual directors. No director should be involved in deciding his own remuneration.
The Remuneration Committee (“RC”) is established and it comprises 3 non-executive and independent directors.
Chairman : Sim Idrus Munandar Member : Tengku Alwin AzizMember : Soh Yew Hock
The RC is established for the purposes of ensuring that there is a formal and transparent procedure for fixing the remuneration packages of individual directors. The overriding principle is that no director should be involved in deciding his own remuneration and the level of remuneration should be appropriate to attract, retain and motivate the executive directors to run the Company successfully and ensure that they are fairly rewarded for their individual contributions to overall performance. The RC will work within the principle that the remuneration should be structured so as to link rewards to corporate and individual performance. It has adopted written terms of reference that defines its membership, roles and functions and administration. The RC held one meeting in 2015. The details of the attendance are as follows:
Number of meetings held Number of meetings attended
Sim Idrus Munandar 1 1
Tengku Alwin Aziz 1 1
Soh Yew Hock 1 1

KENCANA AGRI LIMITED ANNUAL REPORT 201532
CORPORATE GOVERNANCE REPORTThe duties of the RC are as follows:
(a) to review and make recommendations to the Board the employment terms and remuneration (including share options and other benefits) of Executive Directors and key management personnel;
(b) to review the remuneration packages of employees related to any director and/or substantial shareholder of the Group; and
(c) to oversee the payment of fees to non-executive directors and to ensure, as far as is possible, that the quantum is commensurate with the non-executive directors’ contribution to the Board and the Company.
The RC will also review the Company’s obligations arising in the event of termination of the executive directors and key management personnel’s contracts of service, to ensure that such contract of service contain fair and reasonable termination clauses.
Level and Mix of Remuneration
Principle 8: The level and structure of remuneration should be aligned with the long-term interest and risk policies of the company, and should be appropriate to attract, retain and motivate (a) the directors to provide good stewardship of the company, and (b) key management personnel to successfully manage the company. However, companies should avoid paying more than is necessary for this purpose.
The annual reviews of the compensation are carried out by the RC to ensure that the remuneration of the Executive Directors and key management personnel commensurate with their performance and that of the Company, giving due regard to the financial and commercial health and business needs of the Company. As part of its review, the RC ensures that the Directors and key management personnel are adequately but not excessively remunerated as compared to industry benchmarks and other comparable companies.
The remuneration framework of the Executive Directors and key management personnel comprises mainly a fixed component and a variable component, taking into account factors such as the individual performance and the duties and responsibilities required of the position. The fixed component is paid in the form of a base salary. The variable component is paid in the form of a bonus, which is linked to Company and individual performance.
Non-executive directors will be paid a fee for their board services and appointment to board committees, taking into account factors such as their level of contribution to the Board, the effort and time spent, and responsibilities of these directors. While the remuneration frameworks are not subject to shareholders’ approval, the directors’ fees for the non-executive directors will be subjected to the approval of shareholders at AGMs.
The Company has no share-based compensation scheme or any long-term scheme involving the offer of shares or options in place.
The Company had entered into separate Service Agreements with the three Executive Directors, namely, Mr Henry Maknawi, Ms Ratna Maknawi and Mr Kent Surya, for an initial term of three years commencing from the Listing Date, which will continue thereafter. The service agreements may be terminated by not less than six months’ notice in writing served by either party on the other. The Group is of the view that it is not necessary to incorporate contractual provisions to allow it to reclaim incentive components of remuneration from Executive Directors and key management personnel in exceptional circumstances of misstatement of financial results, or of misconduct resulting in financial loss to the Group. The Executive Directors owe a fiduciary duty to the Company, and the Company should be able to avail itself to remedies against the Executive Directors in the event of such breach of fiduciary duties. In addition, the Company has in place alternative corporate governance practices described herein, such as the establishment of whistle-blowing policy, rigorous selection criteria of its Directors and key management personnel, private discussions between the Independent Directors with the external auditors and the granting of full access to all employees and documents of the Group to the Independent Directors, as checks and balances to prevent the occurrence of such instances.
KENCANA AGRI LIMITED ANNUAL REPORT 201533
CORPORATE GOVERNANCE REPORTDisclosure on Remuneration
Principle 9: Every company should provide clear disclosure of its remuneration policies, level and mix of remuneration, and the procedure for setting remuneration, in the company’s Annual Report. It should provide disclosure in relation to its remuneration policies to enable investors to understand the link between remuneration paid to directors and key management personnel, and performance.
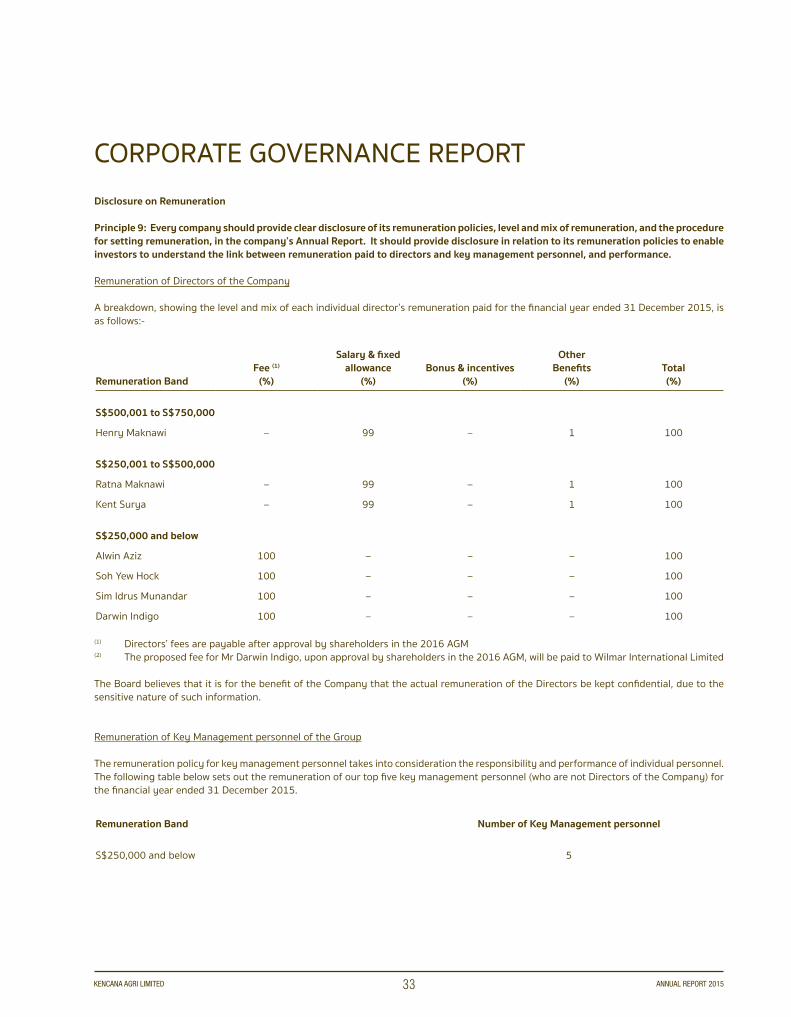
Remuneration of Directors of the Company
A breakdown, showing the level and mix of each individual director’s remuneration paid for the financial year ended 31 December 2015, is as follows:-
Remuneration BandFee (1)
(%)
Salary & fixed allowance
(%)Bonus & incentives
(%)
Other Benefits
(%)Total(%)
S$500,001 to S$750,000
Henry Maknawi – 99 – 1 100
S$250,001 to S$500,000
Ratna Maknawi – 99 – 1 100
Kent Surya – 99 – 1 100
S$250,000 and below
Alwin Aziz 100 – – – 100
Soh Yew Hock 100 – – – 100
Sim Idrus Munandar 100 – – – 100
Darwin Indigo 100 – – – 100
(1) Directors’ fees are payable after approval by shareholders in the 2016 AGM (2) The proposed fee for Mr Darwin Indigo, upon approval by shareholders in the 2016 AGM, will be paid to Wilmar International Limited
The Board believes that it is for the benefit of the Company that the actual remuneration of the Directors be kept confidential, due to the sensitive nature of such information.
Remuneration of Key Management personnel of the Group
The remuneration policy for key management personnel takes into consideration the responsibility and performance of individual personnel. The following table below sets out the remuneration of our top five key management personnel (who are not Directors of the Company) for the financial year ended 31 December 2015.
Remuneration Band Number of Key Management personnel
S$250,000 and below 5
KENCANA AGRI LIMITED ANNUAL REPORT 201534
CORPORATE GOVERNANCE REPORTIn considering the disclosure of remuneration of the key management personnel of the Company, the Company has regarded the industry conditions in which the company operates as well as the confidential nature of such remuneration. The Company believes that full detailed disclosure of the remuneration of each key management personnel on a name basis as recommended by the Code would be prejudicial to the Company’s interests and hamper its ability to retain and nurture the Company’s talent pool. The aggregate remuneration of the top five key management personnel (who are not directors or the CEO) for FY2015 is S$1,072,000 (rounded to the nearest thousand dollars)
There are three employees who are immediate family members of a Director or CEO and whose remunerations exceeded S$50,000 for the financial year ended 31 December 2015: (i) Mr Eddy Maknawi, who is the brother of both Mr Henry Maknawi and Ms Ratna Maknawi, (ii) Mr Albert Maknawi, who is the son of Mr Henry Makwawi, and (iii) Mr Ajis Chandra, who is the spouse of Ms Ratna Maknawi.
The Board is of the opinion that the information as disclosed above would be sufficient for shareholders to have an adequate appreciation of the Company’s compensation policies and practices and therefore does not intend to issue a separate remuneration report.
The Company currently does not have any long-term incentive schemes for Executive Directors and key management personnel.
ACCOUNTABILITY AND AUDIT
Accountability
Principle 10: The Board should present a balanced and understandable assessment of the company’s performance, position and prospects.
One of the Board’s principal duties is to protect and enhance the long-term value and returns to the shareholders of the Company. The accountability of the Board to the shareholders is demonstrated through the presentation of the periodic financial statements as well as timely announcements and news releases of significant corporate developments and activities so that the shareholders can have a detailed explanation and balanced assessment of the Group’s financial position and prospects.
The Board ensures that the Management maintains a sound system of internal control to safeguard the shareholders’ investment and the Group’s assets.
The Management provides all members of the Board with management reports and financial statements on regular basis. Board papers are given prior to any Board meeting to facilitate effective discussion and decision making.
The Group recognizes the importance of providing the Board with accurate and relevant information on a timely basis. On a quarterly basis, Directors are provided with management operation reviews and other information on the Group’s performance for effective monitoring and decision making. The Management also highlights key business indicators and major issues that are relevant to the Group’s performance from time to time in order for the Board to make a balanced and informed assessment of the Group’s performance, position and prospects.
Risk Management and Internal Controls
Principle 11: The Board is responsible for the governance of risk. The Board should ensure that Management maintains a sound system of risk management and internal controls to safeguard the shareholders’ investments and the company’s assets, and should determine the nature and extent of the significant risks which the Board is willing to take in achieving its strategic objectives.
The Board acknowledges that it is responsible for the governance of risks and the overall internal control framework, but recognizes that no cost effective internal control system will preclude all errors and irregularities. A system is designed to manage rather than eliminate the risk of failure to achieve business objectives, and can provide only reasonable and not absolute assurance against material misstatement or loss.
KENCANA AGRI LIMITED ANNUAL REPORT 201535
CORPORATE GOVERNANCE REPORTThe Board is assisted by the Risk Working Group (“RWG”) which was formed in FY2012, as part of the Group’s efforts to strengthen its risk management processes and framework. The RWG constitutes representatives from different business units in the Company. The RWG has assessed the Group’s risk profile which summarizes the key risks faced, the appropriate risk rankings set for the respective risk and the countermeasures in place to manage or mitigate those risks. On an ongoing basis, the RWG will review the key risks identified and monitor changes affecting the risk criteria. The RWG will carry out internal risk management exercise and report the findings and action plans to the Board on an annual basis.
For FY2015, the Board has received assurance from the CEO and the Finance Director that the financial records have been properly maintained and the financial statements give a true and fair view of the Group’s businesses and operations and also that the Group’s risk management and internal control system in place is adequate in addressing the key risks in the Group in its current business environment
Based on the internal control policies and procedures established and maintained by the Group, work performed by the external and internal auditors, as well as reviews performed by the RWG, the Board, with the concurrence of the ARC, is of the view that the internal controls of the Group, addressing the financial, operational, compliance and information technology risks are adequate as at 31 December 2015.
Audit & Risk Management Committee
Principle 12: The Board should establish an Audit & Risk Management Committee (“ARC”) with written terms of reference which clearly set out its authority and duties.
The ARC comprises 3 members, all non-executive and the all of whom, including the Chairman are independent directors.
Chairman Soh Yew Hock Member Tengku Alwin AzizMember Sim Idrus Munandar
The Chairman, Mr Soh Yew Hock, has extensive experience in finance, commerce and industry. The other members of the ARC possess experience in finance and business management. At least two members have the appropriate accounting or related financial management experience or expertise.
The Board is of the opinion that the members of the ARC have sufficient financial management expertise and experience in discharging their duties.
The role of the ARC is to assist the Board with discharging its responsibility to safeguard the Company’s assets, maintain adequate accounting records and develop and maintain an effective system of risk management and internal controls.
In accordance with the terms of reference adopted by the ARC, the ARC shall perform the following main functions:
(a) Discuss with the external auditors, prior to the commencement of audit, the audit plan which states the nature and scope of the audit;(b) Review with external auditors, their evaluation of the system of internal accounting controls, the Management Letter and
Management’s response thereon;(c) Review of the independence and objectivity of the external auditors and nomination of their re-appointment as auditors of the
Company;(d) Review of the adequacy of the Company’s internal controls, and the effectiveness of the Company’s internal audit function, the
internal audit annual plan and program including the scope and results of the internal audit;(e) Review of interested person transactions (as defined in Chapter 9 of the Listing Manual of SGX-ST);(f) Review of quarterly, half-yearly and annual financial results, including review of the significant financial reporting issues and
judgments so as to ensure the integrity of the financial statements of the Company and any formal announcements relating to the Company’s financial performance;
(g) to oversee and advise the Board on the current risk exposures and future risk strategy of the Company;(h) to review reports by the Risk Working Group and monitor Management’s responsiveness to the findings;(i) to review the effectiveness of the Company’s internal controls and risk management systems established by Management; and(j) Undertake any other functions that are requested by the Board, as may be required by statute or the Listing Manual.

KENCANA AGRI LIMITED ANNUAL REPORT 201536
CORPORATE GOVERNANCE REPORTIn performing the above functions, the ARC confirms that it has full access to and co-operation from Management and is given full discretion to invite any Director to attend its meetings. In addition, the ARC has also been given reasonable resources to enable it to perform its functions properly. The ARC meets with the external auditors, without the presence of Management, at least once a year.
The ARC has undertaken an annual review of of the audit and non-audit services provided by the external auditors to satisfy it that the nature and extent of such services will not prejudice the independence and objectivity of the auditors before recommending their re-nomination to the Board. A breakdown of the fees in total for audit and non-audit services is set out on page 70 of this annual report. The ARC is satisfied with their independence and has recommended the re-appointment of the external auditors at the forthcoming Annual General Meeting of the Company.
The Company has implemented a whistle-blowing policy, which serves to encourage and provide a channel to employees to report in good faith and in confidence, concerns about possible improprieties. The objective of such arrangement is to ensure independent investigation of such matters and appropriate follow-up action.
During the year 2015, the ARC met four times and the details of attendance are as follows:
Number of meetings held Number of meetings attended
Soh Yew Hock 4 4
Tengku Alwin Aziz 4 4
Sim Idrus Munandar 4 4
In FY2015, the ARC has reviewed with the Management and the external auditors, the results of the Group before submitting them to the Board for its approval and announcement of the financial results. The ARC also reviewed the Group’s financial condition, internal and external audit reports.
The ARC is kept abreast by Management, the external and internal auditors on changes and updates to accounting standards, and other issues which could have a direct impact on the financial statements of the Group, if any.
None of the members of the ARC is a former partner or director of the Company’s external or internal auditors.
Internal Audit
Principle 13: The Company should establish an internal audit function that is independent of the activities it audits.
The ARC is aware that internal audit function is essential to assist in obtaining the assurance it requires regarding the effectiveness of the system of internal control.
The Company currently has an in-house internal audit department for reviewing and implementing appropriate internal accounting controls, risk management and good corporate governance. The internal auditors (“IA”) is guided by the International Standards for the Professional Practice of Internal Auditing (IIA Standards) issued by the Institute of Internal Auditors. The IA reports directly to the ARC.
The ARC reviews and approves the internal audit scope and plan to ensure that there is sufficient coverage of the Group’s activities. The internal control weaknesses identified during the internal audit reviews, the recommended corrective actions and Management’s responses are reported to the ARC on a quarterly basis.
The ARC annually reviews the adequacy of the internal audit function to ensure that the internal audits are performed effectively. The ARC is satisfied that the IA is adequately staffed by qualified and experienced personnel.
KENCANA AGRI LIMITED ANNUAL REPORT 201537
CORPORATE GOVERNANCE REPORTSHAREHOLDER RIGHTS
Principle 14: Companies should treat all shareholders fairly and equitably, and should recognize, protect and facilitate the exercise of shareholders’ rights, and continually review and update such governance arrangements
The Company’s corporate governance practices promote fair and equitable treatment of all shareholders. To facilitate shareholders’ ownership rights, the Company ensures that all material information is disclosed on a comprehensive and timely basis via SGXNET and the Company’s website, especially information pertaining to the Group’s business development and financial performance which could have a material impact on the share price of the Company, so as to enable shareholders to make informed decisions in respect of their investments in the Company.
Shareholders are informed of general meetings through notices published in the newspaper and the Company’s announcements and press releases via SGXNET as well as through reports/circulars sent to all shareholders. They are given the opportunity to participate effectively and vote at general meetings of the Company, where relevant rules and procedures governing the meetings are clearly communicated.
The Constitution of the Company allows each shareholder to appoint up to two proxies to attend general meetings. On 3 January 2016, the legislation was amended, among other things to allow certain members, defined as “relevant intermediary” to attend and participate in general meetings without being constrained by the two-proxy requirement. Relevant intermediary includes corporations holding licenses in providing nominee and custodial services and CPF Board which purchases shares on behalf of the CPF investors.
COMMUNICATION WITH SHAREHOLDERS
Principle 15: Companies should actively engage their shareholders and put in place an investor relations policy to promote regular, effective and fair communication with shareholders.
The Company endeavours to communicate regularly, effectively and fairly with its shareholders.
Results are published via SGXNET and are usually followed by a news release. Price sensitive information is first publicly released, either before the Company meets with any group of investors or analysts or simultaneously with such meetings. Results are announced or issued within the mandatory period and are available on the Company’s website. The Company does not practise selective disclosure.
Shareholders are encouraged to attend and raise questions to the directors at the Company’s general meetings. At these meetings, shareholders are given the opportunity to express their views and raise issues either formally or informally. These meetings provide opportunities for the Board to engage with shareholders and solicit their feedback.
The Company’s website at http://www.kencanaagri.com is also another channel to solicit and understand the views of the shareholders.
The Company does not have a fixed dividend policy at present. The frequency and amount of dividends declared each year will take into consideration the Group’s profit growth, cash position, projected capital requirements for business growth and other factors as the Board may deem appropriate. Given the volatility in palm oil prices and having considered the projected capital expenditure requirements for planting and upkeep, the Board has decided not to recommend a dividend for FY2015.

KENCANA AGRI LIMITED ANNUAL REPORT 201538
CORPORATE GOVERNANCE REPORTCONDUCT OF SHAREHOLDER MEETINGS
Principle 16: Companies should encourage greater shareholder participation at general meetings of shareholders, and allow shareholders the opportunity to communicate their views on various matters affecting the Company.
Annual reports and notices of AGM are sent to all shareholders. The notice is also published in the local newspapers and made available on the SGXNET and the Company’s website. At the AGM, the shareholders are given the opportunity to express their views and raise any queries regarding the Company.
Each item of special business included in the notice of meeting will be accompanied by the relevant explanatory notes. This is to enable the shareholders to understand the nature and effect of the proposed resolutions.
To facilitate voting by shareholders, the Company’s Constitution allows shareholders to appoint up to two proxies to attend and vote at the same general meeting. The Board of Directors (including the Chairman of the respective Board committees), Management, as well as the external auditors will attend the Company’s AGM to address any questions that shareholders may have.
The minutes of general meetings will be made available to shareholders upon written request.
All resolutions at general meetings of the Company will be put to vote by poll so as to better reflect shareholders’ shareholding interest and ensure greater transparency. The results of the poll voting on each resolution tabled will be announced after the general meetings via SGXNET and the Company’s website.
DEALINGS IN SECURITIES
The Company has devised and adopted its own internal Code of Conduct on dealing in the securities of the Company (the “Code”). This code will provide guidance to the Group’s directors and employees on their dealings in its securities. The key guidelines are:
• Directors and key officers are prohibited from trading in the Company’s securities during the period commencing two weeks before the announcement of the Company’s financial statements for each of the first three quarters of its financial year, and one month before the announcement of the Company’s full-year financial statements. The prohibition ends on the day of the announcement of such results.
• Directors and key officers should not deal in the Company’s securities on short-term consideration.• Directors and key officers are required to observe the insider trading laws under the Securities and Futures Act (Chapter 289) at all
times even when engaging in dealings of securities within the non-prohibitory periods. To enable the Company to monitor such share transactions, Directors and key officers are required to report to the Company whenever they deal in the Company’s securities.
The Company has complied with the Code for the financial year ended 31 December 2015.
INTERESTED PERSON TRANSACTIONS
The Company has adopted internal guidelines in respect of any transactions with interested persons and has set out the procedures for review and approval of the Company’s interested person transactions. The main objective is to ensure that all interested person transactions are conducted on arm’s length basis and on normal commercial terms and will not be prejudicial to the interests of our shareholders.
The Company monitors all its interested person transactions closely and all interested person transactions are subject to review by the ARC on a quarterly basis.
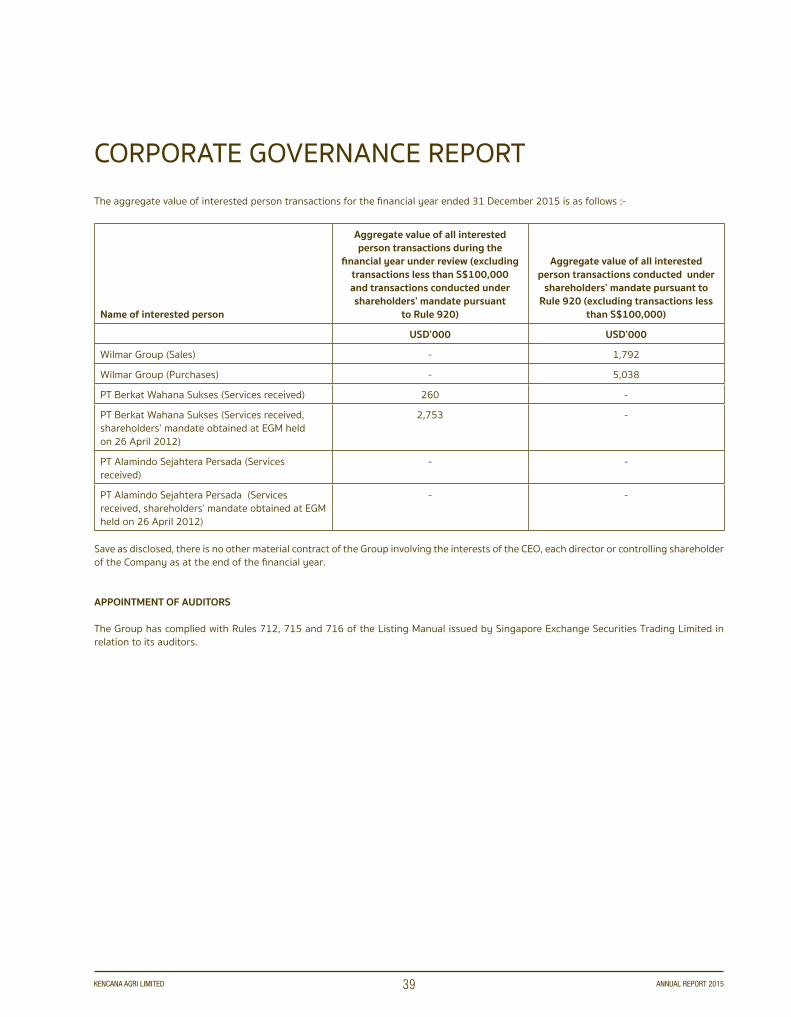
KENCANA AGRI LIMITED ANNUAL REPORT 201539
CORPORATE GOVERNANCE REPORTThe aggregate value of interested person transactions for the financial year ended 31 December 2015 is as follows :-
Name of interested person
Aggregate value of all interested person transactions during the
financial year under review (excluding transactions less than S$100,000 and transactions conducted under shareholders’ mandate pursuant
to Rule 920)
Aggregate value of all interested person transactions conducted under
shareholders’ mandate pursuant to Rule 920 (excluding transactions less
than S$100,000)
USD’000 USD’000
Wilmar Group (Sales) - 1,792
Wilmar Group (Purchases) - 5,038
PT Berkat Wahana Sukses (Services received) 260 -
PT Berkat Wahana Sukses (Services received, shareholders’ mandate obtained at EGM held on 26 April 2012)
2,753 -
PT Alamindo Sejahtera Persada (Services received)
- -
PT Alamindo Sejahtera Persada (Services received, shareholders’ mandate obtained at EGM held on 26 April 2012)
- -
Save as disclosed, there is no other material contract of the Group involving the interests of the CEO, each director or controlling shareholder of the Company as at the end of the financial year.
APPOINTMENT OF AUDITORS
The Group has complied with Rules 712, 715 and 716 of the Listing Manual issued by Singapore Exchange Securities Trading Limited in relation to its auditors.
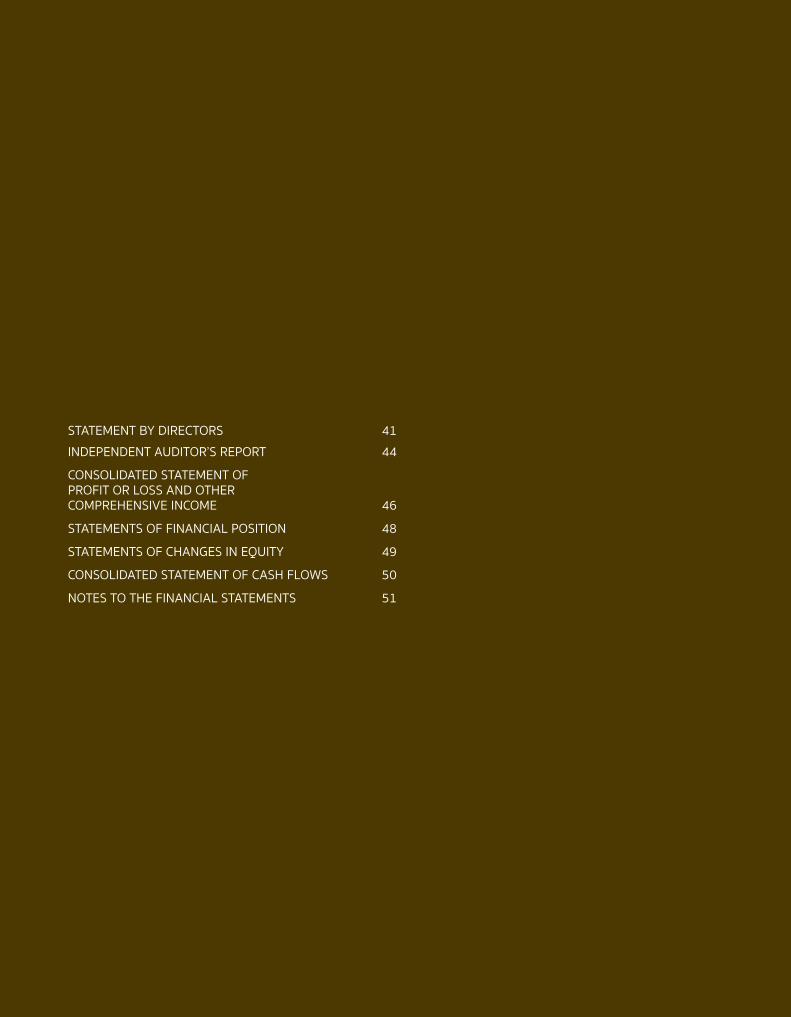
STATEMENT BY DIRECTORS 41INDEPENDENT AUDITOR’S REPORT 44
CONSOLIDATED STATEMENT OF PROFIT OR LOSS AND OTHER COMPREHENSIVE INCOME 46
STATEMENTS OF FINANCIAL POSITION 48
STATEMENTS OF CHANGES IN EQUITY 49
CONSOLIDATED STATEMENT OF CASH FLOWS 50
NOTES TO THE FINANCIAL STATEMENTS 51

KENCANA AGRI LIMITED ANNUAL REPORT 201541
The directors of the company are pleased to present the accompanying audited financial statements of the company and of the group for the reporting year ended 31 December 2015.
1. Opinion of the directors
In the opinion of the directors,
(a) the accompanying financial statements and the consolidated financial statements are drawn up so as to give a true and fair view of the financial position and performance of the company and, of the financial position and performance of the group for the reporting year covered by the financial statements or consolidated financial statements; and
(b) at the date of this statement there are reasonable grounds to believe that the company will be able to pay its debts as and when they fall due.
The board of directors approved and authorised these financial statements for issue.
2. Directors in office at date of statement
The directors of the company in office at the date of this statement are:
Henry Maknawi Tengku Alwin Aziz Ratna Maknawi Kent Surya Soh Yew Hock Sim Idrus Munandar Darwin Indigo
3. Directors’ interests in shares and debentures
The directors of the company holding office at the end of the reporting year were not interested in shares in or debentures of the company or other related body corporate other than wholly-owned subsidiaries as recorded in the register of directors’ shareholdings kept by the company under section 164 of the Companies Act, Chapter 50 (“the Act”) except as follows:
Name of directors and companies in which interests are held
At beginning of the reporting year
At end of thereporting year
At beginning of thereporting year
At end of thereporting year
Number of shares of no par value
Direct interest Deemed interest
Kencana Holdings Pte. Ltd.(The ultimate parent company)
Henry Maknawi 7,486,378 7,486,378 – –
Ratna Maknawi 1,246,867 1,246,867 32,767 32,767
Tengku Alwin Aziz 384,580 384,580 – –
STATEMENT BY DIRECTORS
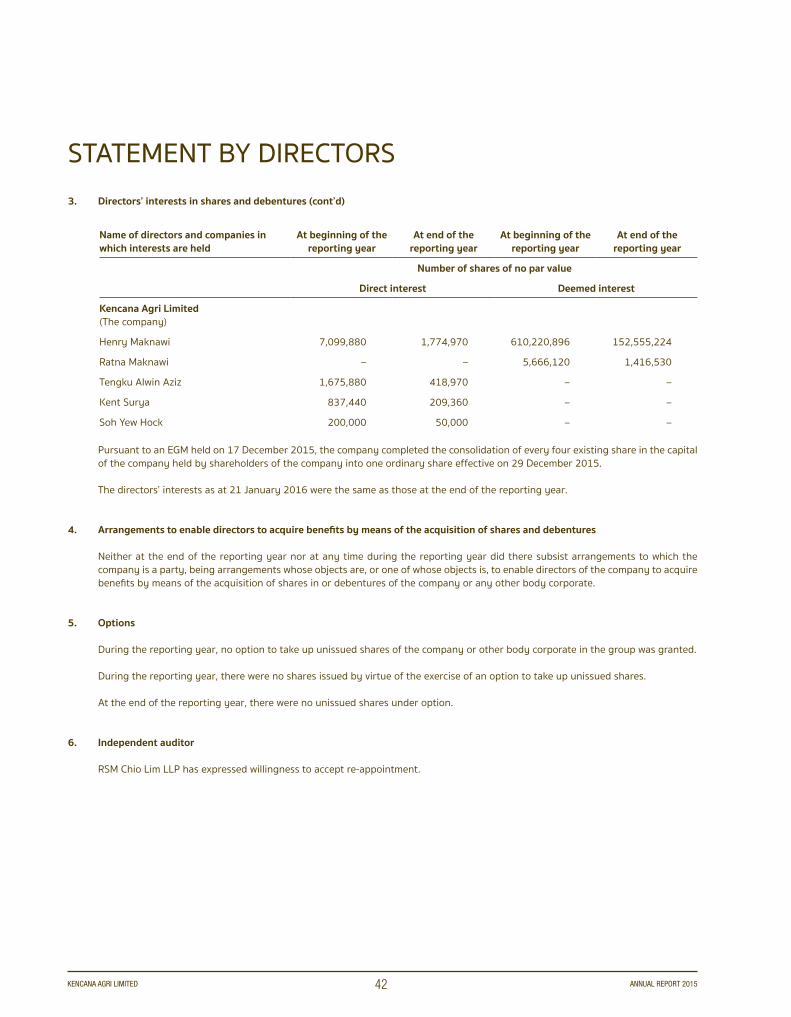
KENCANA AGRI LIMITED ANNUAL REPORT 201542
3. Directors’ interests in shares and debentures (cont’d)
Name of directors and companies in which interests are held
At beginning of the reporting year
At end of thereporting year
At beginning of thereporting year
At end of thereporting year
Number of shares of no par value
Direct interest Deemed interest
Kencana Agri Limited(The company)
Henry Maknawi 7,099,880 1,774,970 610,220,896 152,555,224
Ratna Maknawi – – 5,666,120 1,416,530
Tengku Alwin Aziz 1,675,880 418,970 – –
Kent Surya 837,440 209,360 – –
Soh Yew Hock 200,000 50,000 – –
Pursuant to an EGM held on 17 December 2015, the company completed the consolidation of every four existing share in the capital of the company held by shareholders of the company into one ordinary share effective on 29 December 2015.
The directors’ interests as at 21 January 2016 were the same as those at the end of the reporting year.
4. Arrangements to enable directors to acquire benefits by means of the acquisition of shares and debentures
Neither at the end of the reporting year nor at any time during the reporting year did there subsist arrangements to which the company is a party, being arrangements whose objects are, or one of whose objects is, to enable directors of the company to acquire benefits by means of the acquisition of shares in or debentures of the company or any other body corporate.
5. Options
During the reporting year, no option to take up unissued shares of the company or other body corporate in the group was granted.
During the reporting year, there were no shares issued by virtue of the exercise of an option to take up unissued shares.
At the end of the reporting year, there were no unissued shares under option.
6. Independent auditor
RSM Chio Lim LLP has expressed willingness to accept re-appointment.
STATEMENT BY DIRECTORS

KENCANA AGRI LIMITED ANNUAL REPORT 201543
7. Report of audit and risk management committee
The members of the audit and risk management committee at the date of this report are as follows:
Soh Yew Hock (Chairman of audit and risk management committee and Lead Independent Director)Tengku Alwin Aziz (Vice Chairman and Independent Director)Sim Idrus Munandar (Independent Director)
The audit and risk management committee performs the functions specified by section 201B(5) of the Act. Among other functions, it performed the following:
• Reviewed with the independent external auditor their audit plan.• Reviewed with the independent external auditor their evaluation of the company’s internal accounting control, relevant to their
statutory audit and their report on the financial statements and the assistance given by management to them.• Reviewed with the internal auditor the scope and results of the internal audit procedures (including those relating to financial,
operational and compliance controls and risk management) and the assistance given by the management to the internal auditors.
• Reviewed the financial statements of the group and the company prior to their submission to the directors of the company for adoption.
• Reviewed the interested person transactions (as defined in Chapter 9 of the Singapore Exchange Securities Trading Limited’s Listing Manual).
Other functions performed by the audit and risk management committee are described in the report on corporate governance included in the annual report of the company. It also includes an explanation of how independent auditor’s objectivity and independence are safeguarded where the independent auditors provide non-audit services.
The audit and risk management committee has recommended to the board of directors that the independent auditor, RSM Chio Lim LLP, be nominated for re-appointment as independent auditor at the next annual general meeting of the company.
8. Directors’ opinion on the adequacy of internal controls
Based on the internal controls established and maintained by the company, work performed by the internal and external auditor, and reviews performed by management, other committees of the board and the board, the audit committee and the board are of the opinion that company’s internal controls, addressing financial, operational and compliance risks, are adequate as at the end of the reporting year 31 December 2015.
9. Subsequent developments
There are no significant developments subsequent to the release of the group’s and the company’s preliminary financial statements, as announced on 29 February 2016, which would materially affect the group’s and the company’s operating and financial performance as of the date of this report.
On behalf of the directors
Henry Maknawi Kent SuryaDirector Director28 March 2016
STATEMENT BY DIRECTORS

KENCANA AGRI LIMITED ANNUAL REPORT 201544
Report on the financial statements
We have audited the accompanying financial statements of Kencana Agri Limited (the “company”) and its subsidiaries (the “group”), which comprise the consolidated statement of financial position of the group and the statement of financial position of the company as at 31 December 2015, and the consolidated statement of profit or loss and other comprehensive income, statement of changes in equity and statement of cash flows of the group, and statement of changes in equity of the company for the reporting year then ended, and significant accounting policies and other explanatory information.
Management’s responsibility for the financial statements
Management is responsible for the preparation of financial statements that give a true and fair view in accordance with the provisions of the Singapore Companies Act, Chapter 50 (the “Act”) and Singapore Financial Reporting Standards, and for devising and maintaining a system of internal accounting controls sufficient to provide a reasonable assurance that assets are safeguarded against loss from unauthorised use or disposition; and transactions are properly authorised and that they are recorded as necessary to permit the preparation of true and fair financial statements and to maintain accountability of assets.
Auditor’s responsibility
Our responsibility is to express an opinion on these financial statements based on our audit. We conducted our audit in accordance with Singapore Standards on Auditing. Those standards require that we comply with ethical requirements and plan and perform the audit to obtain reasonable assurance about whether the financial statements are free from material misstatement.
An audit involves performing procedures to obtain audit evidence about the amounts and disclosures in the financial statements. The procedures selected depend on the auditor’s judgement, including the assessment of the risks of material misstatement of the financial statements, whether due to fraud or error. In making those risk assessments, the auditor considers internal control relevant to the entity’s preparation of financial statements that give a true and fair view in order to design audit procedures that are appropriate in the circumstances, but not for the purpose of expressing an opinion on the effectiveness of the entity’s internal control. An audit also includes evaluating the appropriateness of accounting policies used and the reasonableness of accounting estimates made by management, as well as evaluating the overall presentation of the financial statements.
We believe that the audit evidence we have obtained is sufficient and appropriate to provide a basis for our audit opinion.
Opinion
In our opinion, the consolidated financial statements of the group and the statement of financial position and statement of changes in equity of the company are properly drawn up in accordance with the provisions of the Act and Singapore Financial Reporting Standards so as to give a true and fair view of the financial position of the group and of the company as at 31 December 2015 and of the financial performance, changes in equity and cash flows of the group and the changes in equity of the company for the reporting year ended on that date.
INDEPENDENT AUDITOR’S REPORTto the Members of KENCANA AGRI LIMITED (Registration No: 200717793E)

KENCANA AGRI LIMITED ANNUAL REPORT 201545
Report on other legal and regulatory requirements
In our opinion, the accounting and other records required by the Act to be kept by the company and by those subsidiary corporations incorporated in Singapore of which we are the auditors have been properly kept in accordance with the provisions of the Act.
RSM Chio Lim LLPPublic Accountants andChartered AccountantsSingapore
28 March 2016
Partner in charge of audit: Kaka SinghEffective from year ended 31 December 2014
INDEPENDENT AUDITOR’S REPORTto the Members of KENCANA AGRI LIMITED (Registration No: 200717793E)
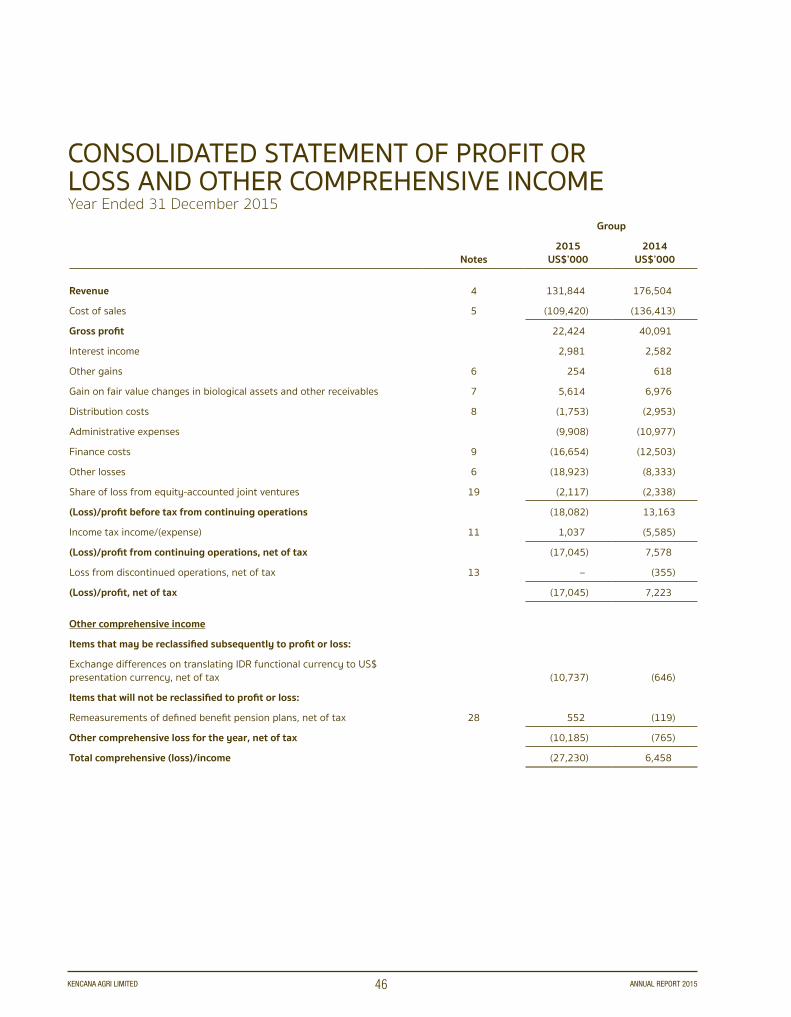
KENCANA AGRI LIMITED ANNUAL REPORT 201546
CONSOLIDATED STATEMENT OF PROFIT OR LOSS AND OTHER COMPREHENSIVE INCOMEYear Ended 31 December 2015
Group
Notes2015
US$’0002014
US$’000
Revenue 4 131,844 176,504
Cost of sales 5 (109,420) (136,413)
Gross profit 22,424 40,091
Interest income 2,981 2,582
Other gains 6 254 618
Gain on fair value changes in biological assets and other receivables 7 5,614 6,976
Distribution costs 8 (1,753) (2,953)
Administrative expenses (9,908) (10,977)
Finance costs 9 (16,654) (12,503)
Other losses 6 (18,923) (8,333)
Share of loss from equity-accounted joint ventures 19 (2,117) (2,338)
(Loss)/profit before tax from continuing operations (18,082) 13,163
Income tax income/(expense) 11 1,037 (5,585)
(Loss)/profit from continuing operations, net of tax (17,045) 7,578
Loss from discontinued operations, net of tax 13 – (355)
(Loss)/profit, net of tax (17,045) 7,223
Other comprehensive income
Items that may be reclassified subsequently to profit or loss:
Exchange differences on translating IDR functional currency to US$ presentation currency, net of tax (10,737) (646)
Items that will not be reclassified to profit or loss:
Remeasurements of defined benefit pension plans, net of tax 28 552 (119)
Other comprehensive loss for the year, net of tax (10,185) (765)
Total comprehensive (loss)/income (27,230) 6,458

KENCANA AGRI LIMITED ANNUAL REPORT 201547
Group
Notes 2015 2014
(Loss)/earnings per share
(Loss)/earnings per share currency unit US Cents US Cents
Basic
Continuing operations (5.94) 2.64
Discontinued operations – (0.12)
Total 14 (5.94) 2.52
Diluted
Continuing operations (5.94) 2.64
Discontinued operations – (0.12)
Total 14 (5.94) 2.52
The accompanying notes form an integral part of these financial statements.
CONSOLIDATED STATEMENT OF PROFIT OR LOSS AND OTHER COMPREHENSIVE INCOMEYear Ended 31 December 2015

KENCANA AGRI LIMITED ANNUAL REPORT 201548
Group CompanyNotes 2015
US$’0002014
US$’0002015
US$’0002014
US$’000
ASSETSNon-current assetsProperty, plant and equipment 15 90,985 96,767 – – Investment property 16 2,430 2,460 – – Biological assets, non-current 17 288,424 297,169 – – Investments in subsidiaries 18 – – 38,429 42,615Investments in joint ventures 19 6,169 5,523 5,755 5,500Land use rights 20 35,301 38,386 – – Other receivables, non-current 22 19,520 16,276 – – Other assets, non-current 23 761 844 – – Total non-current assets 443,590 457,425 44,184 48,115
Current assetsInventories 21 11,161 11,729 – – Trade and other receivables, current 22 22,841 16,335 21,666 24,908Other assets, current 23 8,814 11,382 2 – Cash and cash equivalents 24 8,687 14,124 724 952Total current assets 51,503 53,570 22,392 25,860Total assets 495,093 510,995 66,576 73,975
EQUITY AND LIABILITIESEquityShare capital 25 93,860 93,860 93,860 93,860Retained earnings/(accumulated losses) 123,245 139,733 (4,751) (4,487)Other reserve 2,485 2,485 – – Translation reserve (74,085) (63,348) (24,607) (17,563)Equity, attributable to owners of the parent 145,505 172,730 64,502 71,810Non-controlling interests – 5 – – Total equity 145,505 172,735 64,502 71,810
Non-current liabilitiesDeferred tax liabilities 11 23,121 27,113 – – Finance leases, non-current 26 188 598 – – Other payables, non-current 27 11,189 9,484 – – Other financial liabilities, non-current 26 206,265 198,868 – – Other liabilities, non-current 28 3,832 4,216 – – Total non-current liabilities 244,595 240,279 – –
Current liabilitiesIncome tax payable 1,867 2,334 – 3Trade and other payables, current 27 52,984 53,977 2,074 2,162Finance leases, current 26 422 1,235 – – Other financial liabilities, current 26 49,720 40,435 – – Total current liabilities 104,993 97,981 2,074 2,165Total liabilities 349,588 338,260 2,074 2,165Total equity and liabilities 495,093 510,995 66,576 73,975
The accompanying notes form an integral part of these financial statements.
STATEMENTS OF FINANCIAL POSITIONAs at 31 December 2015
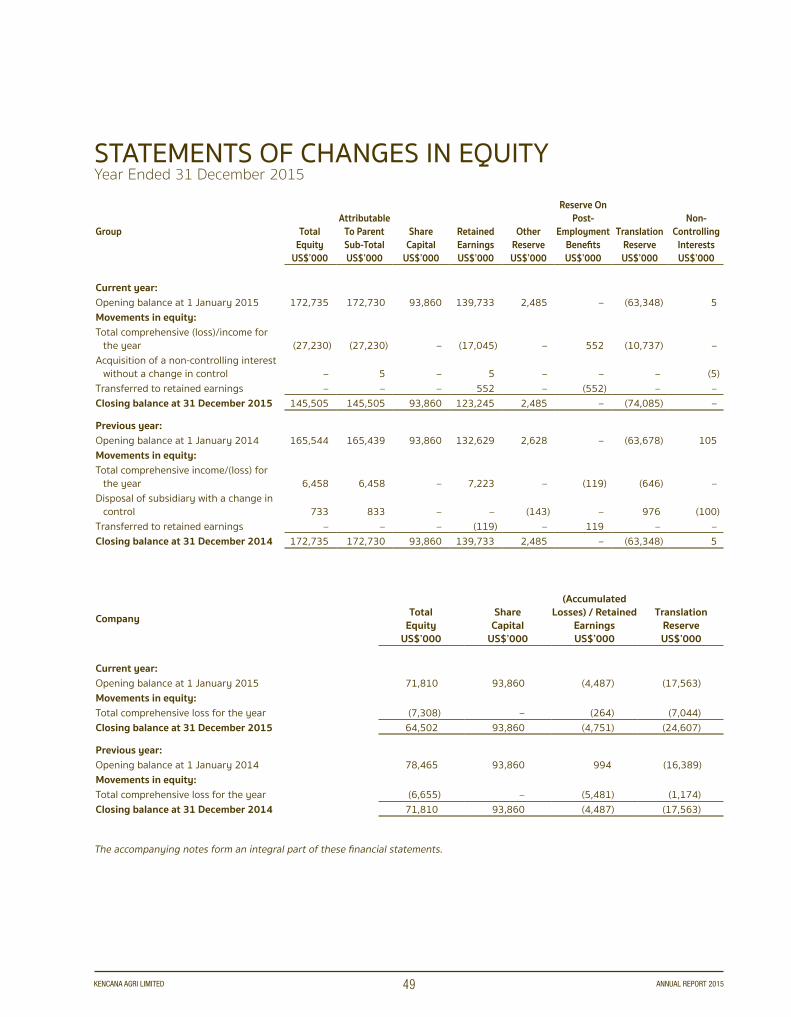
KENCANA AGRI LIMITED ANNUAL REPORT 201549
Group TotalEquity
US$’000
Attributable To ParentSub-TotalUS$’000
ShareCapital
US$’000
RetainedEarningsUS$’000
OtherReserveUS$’000
Reserve OnPost-
EmploymentBenefitsUS$’000
TranslationReserveUS$’000
Non-Controlling
InterestsUS$’000
Current year:Opening balance at 1 January 2015 172,735 172,730 93,860 139,733 2,485 – (63,348) 5Movements in equity:Total comprehensive (loss)/income for
the year (27,230) (27,230) – (17,045) – 552 (10,737) – Acquisition of a non-controlling interest
without a change in control – 5 – 5 – – – (5)Transferred to retained earnings – – – 552 – (552) – – Closing balance at 31 December 2015 145,505 145,505 93,860 123,245 2,485 – (74,085) –
Previous year:Opening balance at 1 January 2014 165,544 165,439 93,860 132,629 2,628 – (63,678) 105Movements in equity:Total comprehensive income/(loss) for
the year 6,458 6,458 – 7,223 – (119) (646) – Disposal of subsidiary with a change in
control 733 833 – – (143) – 976 (100)Transferred to retained earnings – – – (119) – 119 – – Closing balance at 31 December 2014 172,735 172,730 93,860 139,733 2,485 – (63,348) 5
Company TotalEquity
US$’000
ShareCapital
US$’000
(Accumulated Losses) / Retained
EarningsUS$’000
TranslationReserveUS$’000
Current year:Opening balance at 1 January 2015 71,810 93,860 (4,487) (17,563)Movements in equity:Total comprehensive loss for the year (7,308) – (264) (7,044)Closing balance at 31 December 2015 64,502 93,860 (4,751) (24,607)
Previous year:Opening balance at 1 January 2014 78,465 93,860 994 (16,389)Movements in equity:Total comprehensive loss for the year (6,655) – (5,481) (1,174)Closing balance at 31 December 2014 71,810 93,860 (4,487) (17,563)
The accompanying notes form an integral part of these financial statements.
STATEMENTS OF CHANGES IN EQUITYYear Ended 31 December 2015
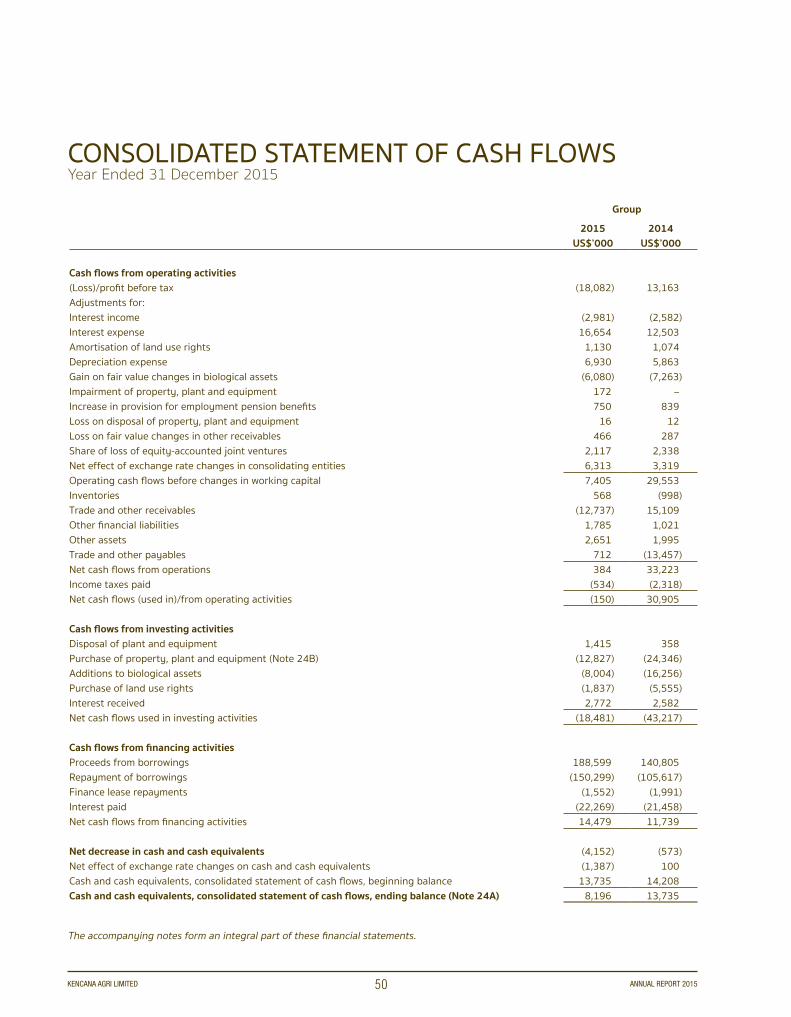
KENCANA AGRI LIMITED ANNUAL REPORT 201550
Group
2015 2014 US$’000 US$’000
Cash flows from operating activities(Loss)/profit before tax (18,082) 13,163Adjustments for:Interest income (2,981) (2,582)Interest expense 16,654 12,503Amortisation of land use rights 1,130 1,074Depreciation expense 6,930 5,863Gain on fair value changes in biological assets (6,080) (7,263)Impairment of property, plant and equipment 172 – Increase in provision for employment pension benefits 750 839Loss on disposal of property, plant and equipment 16 12Loss on fair value changes in other receivables 466 287Share of loss of equity-accounted joint ventures 2,117 2,338Net effect of exchange rate changes in consolidating entities 6,313 3,319Operating cash flows before changes in working capital 7,405 29,553Inventories 568 (998)Trade and other receivables (12,737) 15,109Other financial liabilities 1,785 1,021Other assets 2,651 1,995Trade and other payables 712 (13,457)Net cash flows from operations 384 33,223Income taxes paid (534) (2,318)Net cash flows (used in)/from operating activities (150) 30,905
Cash flows from investing activitiesDisposal of plant and equipment 1,415 358Purchase of property, plant and equipment (Note 24B) (12,827) (24,346)Additions to biological assets (8,004) (16,256)Purchase of land use rights (1,837) (5,555)Interest received 2,772 2,582Net cash flows used in investing activities (18,481) (43,217)
Cash flows from financing activitiesProceeds from borrowings 188,599 140,805Repayment of borrowings (150,299) (105,617)Finance lease repayments (1,552) (1,991)Interest paid (22,269) (21,458)Net cash flows from financing activities 14,479 11,739
Net decrease in cash and cash equivalents (4,152) (573)Net effect of exchange rate changes on cash and cash equivalents (1,387) 100Cash and cash equivalents, consolidated statement of cash flows, beginning balance 13,735 14,208Cash and cash equivalents, consolidated statement of cash flows, ending balance (Note 24A) 8,196 13,735
The accompanying notes form an integral part of these financial statements.
CONSOLIDATED STATEMENT OF CASH FLOWSYear Ended 31 December 2015
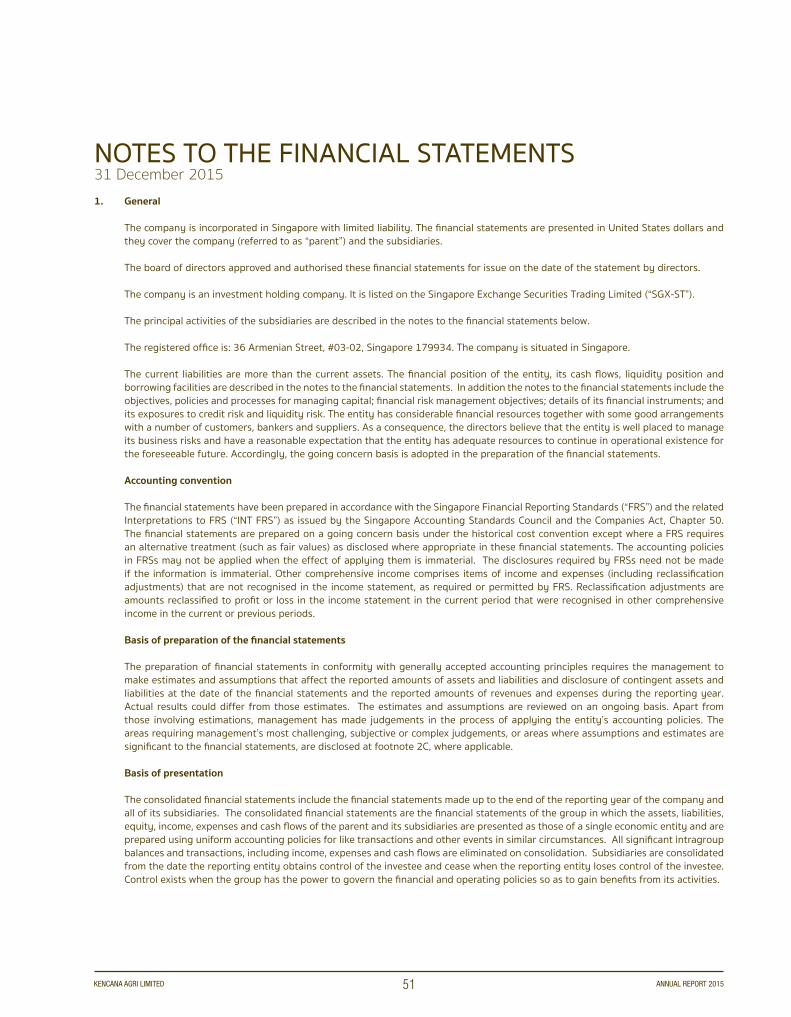
NOTES TO THE FINANCIAL STATEMENTS31 December 2015
KENCANA AGRI LIMITED ANNUAL REPORT 201551
1. General
The company is incorporated in Singapore with limited liability. The financial statements are presented in United States dollars and they cover the company (referred to as “parent”) and the subsidiaries.
The board of directors approved and authorised these financial statements for issue on the date of the statement by directors.
The company is an investment holding company. It is listed on the Singapore Exchange Securities Trading Limited (“SGX-ST”).
The principal activities of the subsidiaries are described in the notes to the financial statements below.
The registered office is: 36 Armenian Street, #03-02, Singapore 179934. The company is situated in Singapore.
The current liabilities are more than the current assets. The financial position of the entity, its cash flows, liquidity position and borrowing facilities are described in the notes to the financial statements. In addition the notes to the financial statements include the objectives, policies and processes for managing capital; financial risk management objectives; details of its financial instruments; and its exposures to credit risk and liquidity risk. The entity has considerable financial resources together with some good arrangements with a number of customers, bankers and suppliers. As a consequence, the directors believe that the entity is well placed to manage its business risks and have a reasonable expectation that the entity has adequate resources to continue in operational existence for the foreseeable future. Accordingly, the going concern basis is adopted in the preparation of the financial statements.
Accounting convention
The financial statements have been prepared in accordance with the Singapore Financial Reporting Standards (“FRS”) and the related Interpretations to FRS (“INT FRS”) as issued by the Singapore Accounting Standards Council and the Companies Act, Chapter 50. The financial statements are prepared on a going concern basis under the historical cost convention except where a FRS requires an alternative treatment (such as fair values) as disclosed where appropriate in these financial statements. The accounting policies in FRSs may not be applied when the effect of applying them is immaterial. The disclosures required by FRSs need not be made if the information is immaterial. Other comprehensive income comprises items of income and expenses (including reclassification adjustments) that are not recognised in the income statement, as required or permitted by FRS. Reclassification adjustments are amounts reclassified to profit or loss in the income statement in the current period that were recognised in other comprehensive income in the current or previous periods. Basis of preparation of the financial statements
The preparation of financial statements in conformity with generally accepted accounting principles requires the management to make estimates and assumptions that affect the reported amounts of assets and liabilities and disclosure of contingent assets and liabilities at the date of the financial statements and the reported amounts of revenues and expenses during the reporting year. Actual results could differ from those estimates. The estimates and assumptions are reviewed on an ongoing basis. Apart from those involving estimations, management has made judgements in the process of applying the entity’s accounting policies. The areas requiring management’s most challenging, subjective or complex judgements, or areas where assumptions and estimates are significant to the financial statements, are disclosed at footnote 2C, where applicable.
Basis of presentation
The consolidated financial statements include the financial statements made up to the end of the reporting year of the company and all of its subsidiaries. The consolidated financial statements are the financial statements of the group in which the assets, liabilities, equity, income, expenses and cash flows of the parent and its subsidiaries are presented as those of a single economic entity and are prepared using uniform accounting policies for like transactions and other events in similar circumstances. All significant intragroup balances and transactions, including income, expenses and cash flows are eliminated on consolidation. Subsidiaries are consolidated from the date the reporting entity obtains control of the investee and cease when the reporting entity loses control of the investee. Control exists when the group has the power to govern the financial and operating policies so as to gain benefits from its activities.
NOTES TO THE FINANCIAL STATEMENTS31 December 2015
KENCANA AGRI LIMITED ANNUAL REPORT 201552
1. General (cont’d)
Basis of presentation (cont’d)
Changes in the group’s ownership interest in a subsidiary that do not result in the loss of control are accounted for within equity as transactions with owners in their capacity as owners. The carrying amounts of the group’s and non-controlling interests are adjusted to reflect the changes in their relative interests in the subsidiary. When the group loses control of a subsidiary it derecognises the assets and liabilities and related equity components of the former subsidiary. Any gain or loss is recognised in profit or loss. Any investment retained in the former subsidiary is measured at its fair value at the date when control is lost and is subsequently accounted as available-for-sale financial assets in accordance with FRS 39.
The company’s separate financial statements have been prepared on the same basis, and as permitted by the Companies Act, Chapter 50, the company’s separate statement of profit or loss and other comprehensive income is not presented.
2. Significant accounting policies and other explanatory information
2A. Significant accounting policies
Revenue recognition
The revenue amount is the fair value of the consideration received or receivable from the gross inflow of economic benefits during the reporting year arising from the course of the activities of the entity and it is shown net of any related sales taxes and rebates. Revenue from the sale of goods is recognised when significant risks and rewards of ownership are transferred to the buyer, there is neither continuing managerial involvement to the degree usually associated with ownership nor effective control over the goods sold, and the amount of revenue and the costs incurred or to be incurred in respect of the transaction can be measured reliably. Revenue from rendering of services that are not significant transactions is recognised as the services are provided or when the significant acts have been completed. Rental revenue is recognised on a time-proportion basis that takes into account the effective yield on the asset on a straight-line basis over the lease term. Interest is recognised using the effective interest method. Dividend from equity instruments is recognised as income when the entity’s right to receive payment is established.
Employee benefits
Certain subsidiaries of the group are required to provide for employee service entitlements in order to meet the minimum benefits required to be paid to qualified employees as required under existing manpower regulations in Indonesia. Short-term employee benefits are recognised at an undiscounted amount where employees have rendered their services to the group during the accounting periods. Post employment benefits are recognised at discounted amounts when the employees have rendered their services to the group during the accounting periods. Liabilities and reserves are measured using actuarial techniques which include constructive obligations that arise from the group’s common practices. In calculating the liabilities, the benefits are discounted by using the projected unit credit method and changes in fair value recognised through other comprehensive income. Termination benefits are recognised when, and only when, the group is committed to either; (a) terminate the employment of an employee or group of employees before the normal retirement date; or (b) provide termination benefits as a result of an offer made in order to encourage voluntary redundancy.
This plan is in addition to the contributions to government managed retirement benefit plans such as the Central Provident Fund (“CPF”) in Singapore which specifies the employer’s obligations which are dealt with as defined contribution retirement benefit plans. Contributions to defined contribution retirement benefit plans are recorded as an expense as they fall due. The entity’s legal or constructive obligation is limited to the amount that it agrees to contribute to the CPF.
For employee leave entitlement the expected cost of short-term employee benefits in the form of compensated absences is recognised in the case of accumulating compensated absences, when the employees render service that increases their entitlement to future compensated absences; and in the case of non-accumulating compensated absences, when the absences occur. A liability for bonuses is recognised where the entity is contractually obliged or where there is constructive obligation based on past practice.

NOTES TO THE FINANCIAL STATEMENTS31 December 2015
KENCANA AGRI LIMITED ANNUAL REPORT 201553
2. Significant accounting policies and other explanatory information (cont’d)
2A. Significant accounting policies (cont’d)
Income tax
The income taxes are accounted using the asset and liability method that requires the recognition of taxes payable or refundable for the current year and deferred tax liabilities and assets for the future tax consequence of events that have been recognised in the financial statements or tax returns. The measurements of current and deferred tax liabilities and assets are based on provisions of the enacted or substantially enacted tax laws; the effects of future changes in tax laws or rates are not anticipated. Tax expense (tax income) is the aggregate amount included in the determination of profit or loss for the reporting year in respect of current tax and deferred tax. Current and deferred income taxes are recognised as income or as an expense in profit or loss unless the tax relates to items that are recognised in the same or a different period outside profit or loss. For such items recognised outside profit or loss the current tax and deferred tax are recognised (a) in other comprehensive income if the tax is related to an item recognised in other comprehensive income and (b) directly in equity if the tax is related to an item recognised directly in equity. Deferred tax assets and liabilities are offset when they relate to income taxes levied by the same income tax authority. The carrying amount of deferred tax assets is reviewed at each end of the reporting year and is reduced, if necessary, by the amount of any tax benefits that, based on available evidence, are not expected to be realised. A deferred tax amount is recognised for all temporary differences, unless the deferred tax amount arises from the initial recognition of an asset or liability in a transaction which (i) is not a business combination; and (ii) at the time of the transaction, affects neither accounting profit nor taxable profit (tax loss). A deferred tax liability or asset is recognised for all taxable temporary differences associated with investments in subsidiaries and joint arrangements except where the reporting entity is able to control the timing of the reversal of the taxable temporary difference and it is probable that the taxable temporary difference will not reverse in the foreseeable future or for deductible temporary differences, they will not reverse in the foreseeable future and they cannot be utilised against taxable profits.
Foreign currency transactions
The functional currency of the company and all of its subsidiaries except for Sawindo Agri Pte Ltd is the Indonesian Rupiah (“IDR”). The functional currency of Sawindo Agri Pte Ltd is the United States dollar (“US$”). The functional currency reflects the primary economic environment in which these entities operate. Transactions in foreign currencies are recorded in the functional currency at the rates ruling at the dates of the transactions. At each end of the reporting year, recorded monetary balances and balances measured at fair value that are denominated in non-functional currencies are reported at the rates ruling at the end of the reporting year and fair value dates respectively. All realised and unrealised exchange adjustment gains and losses are dealt with in profit or loss except when recognised in other comprehensive income and if applicable deferred in equity such as qualifying cash flow hedges. The presentation currency is the United States dollar as the financial statements are meant primarily for international users. For the United States dollar financial statements assets and liabilities are translated at year end rates of exchange and the income and expense items are translated at average rates of exchange for the reporting year. The resulting translation adjustments (if any) are recognised in other comprehensive income and accumulated in a separate component of equity.
The translations of IDR amounts into US$ amounts are included solely for the convenience of readers. The reporting year end rates used are US$1 to IDR13,795 (2014: US$1 to IDR12,440) which approximate the rate of exchange at the end of the reporting year. The average rates of exchange for the reporting year were US$1 to IDR13,389 (2014: US$1 to IDR11,869). Such translation should not be construed as a representation that the US$ amounts could be converted into IDR at the above rate or other rate.
Translation of financial statements of other entities
Each entity in the group determines the appropriate functional currency as it reflects the primary economic environment in which the relevant reporting entity operates. In translating the financial statements of such an entity for incorporation in the consolidated financial statements in the presentation currency the assets and liabilities denominated in other currencies are translated at end of the reporting year rates of exchange and the income and expense items for each statement presenting profit or loss and other comprehensive income are translated at average rates of exchange for the reporting year. The resulting translation adjustments (if any) are recognised in other comprehensive income and accumulated in a separate component of equity until the disposal of that relevant reporting entity.

NOTES TO THE FINANCIAL STATEMENTS31 December 2015
KENCANA AGRI LIMITED ANNUAL REPORT 201554
2. Significant accounting policies and other explanatory information (cont’d)
2A. Significant accounting policies (cont’d)
Borrowing costs
Borrowing costs are interest and other costs incurred in connection with the borrowing of funds. Interest expense is calculated using the effective interest rate method. Borrowing costs are recognised as an expense in the period in which they are incurred except that borrowing costs that are directly attributable to the acquisition, construction or production of a qualifying asset that necessarily take a substantial period of time to get ready for their intended use or sale are capitalised as part of the cost of that asset until substantially all the activities necessary to prepare the qualifying asset for its intended use or sale are complete.
Property, plant and equipment
Depreciation is provided on a straight-line basis to allocate the gross carrying amounts of the assets less their residual values over their estimated useful lives of each part of an item of these assets. The annual rates of depreciation are as follows:
Freehold land – Depreciation is not providedLeasehold buildings – Over the terms of the lease that are from 1% to 6.25%Plant, fixtures and equipment – 12.5% to 25%Vessels – 6.25%Assets under construction – Depreciation is not provided until the asset is available for use
An asset is depreciated when it is available for use until it is derecognised even if during that period the item is idle. Fully depreciated assets still in use are retained in the financial statements.
Property, plant and equipment are carried at cost on initial recognition and after initial recognition at cost less any accumulated depreciation and any accumulated impairment losses. The gain or loss arising from the derecognition of an item of property, plant and equipment is measured as the difference between the net disposal proceeds, if any, and the carrying amount of the item and is recognised in profit or loss. The residual value and the useful life of an asset is reviewed at least at each end of the reporting year and, if expectations differ significantly from previous estimates, the changes are accounted for as a change in an accounting estimate, and the depreciation charge for the current and future periods are adjusted.
Cost also includes acquisition cost, borrowing cost capitalised any cost directly attributable to bringing the asset to the location and condition necessary for it to be capable of operating in the manner intended by management. Subsequent costs are recognised as an asset only when it is probable that future economic benefits associated with the item will flow to the entity and the cost of the item can be measured reliably. All other repairs and maintenance are charged to profit or loss when they are incurred. Investment property
Investment property is property (land or a building or part of a building or both) owned or held under a finance lease to earn rentals or for capital appreciation or both, rather than for use in the production or supply of goods or services or for administrative purposes or sale in the ordinary course of business. It includes an investment property in the course of construction. After initial recognition at cost including transaction costs the cost model is used to measure the investment property using the treatment for property, plant and equipment, that is, at cost less any accumulated depreciation and any accumulated impairment losses. An investment property that meets the criteria to be classified as held for sale is carried at the lower of carrying amount and fair value less costs to sell. For disclosure purposes, the fair values are determined periodically on a systematic basis at least once yearly by management. The annual rates of depreciation are as follows:
Leasehold buildings – Over the terms of the lease that is 1%

NOTES TO THE FINANCIAL STATEMENTS31 December 2015
KENCANA AGRI LIMITED ANNUAL REPORT 201555
2. Significant accounting policies and other explanatory information (cont’d)
2A. Significant accounting policies (cont’d)
Land use rights
Land rights that have a limited useful life are depreciated in a manner that reflects the benefits to be derived from these rights. Costs associated with the legal transfer or renewal for titles of land rights, such as legal fees, land survey and re-measurement fees, taxes and other related expenses, are deferred and amortised using the straight-line method over the legal terms of the related land rights of thirty-five years.
Biological assets
Biological assets are stated at fair values less estimated point-of-sale costs. These include mature and immature oil palm plantations. Oil palm trees have an average life that ranges from 23 to 25 years, with the first 3 to 4 years as immature and the remaining years as mature. In general, an oil palm plantation takes between 3 and 4 years to reach maturity from the time seedlings are planted.
As market determined prices or values are not readily available for plantations in their present condition, the group uses the present value of expected net future cash flows (excluding any future cash flows for financing the assets, taxation, or re-establishing plantations after harvest) from the asset, discounted at a current market determined pre-tax rate in measuring the fair values. The fair value of the oil palm plantations is measured by reference to independent professional valuations using the discounted cash flows for the underlying biological assets. The expected cash flows from the whole life cycle of the oil palm plantations is determined using the long term forecast of market prices of the estimated yield of the agriculture produce, being fresh fruit bunches (“FFB”), net of maintenance and harvesting costs and any costs required to bring the oil palm plantations to maturity. The estimated yield of the oil palm plantations is affected by the age of the oil palm trees, the location, plantation size, soil type and infrastructure. The market price of the fresh fruit bunches is largely dependent on the prevailing and projected market prices of the processed products after harvest, being crude palm oil (“CPO”) and crude palm kernel oil (“CPKO”). Point-of-sale costs include all costs that would be necessary to sell the assets.
The changes in fair value less estimated point-of-sale costs at each reporting date are included in the profit or loss for the period in which they arise. The fair value is measured twice every year, at the end of second quarter and at the end of the year. Leases
Leases are classified as finance leases if substantially all the risks and rewards of ownership are transferred to the lessee. All other leases are classified as operating leases. At the commencement of the lease term, a finance lease is recognised as an asset and as a liability in the statement of financial position at amounts equal to the fair value of the leased asset or, if lower, the present value of the minimum lease payments, each measured at the inception of the lease. The discount rate used in calculating the present value of the minimum lease payments is the interest rate implicit in the lease, if this is practicable to determine, the lessee’s incremental borrowing rate is used. Any initial direct costs of the lessee are added to the amount recognised as an asset. The excess of the lease payments over the recorded lease liability are treated as finance charges which are allocated to each reporting year during the lease term so as to produce a constant periodic rate of interest on the remaining balance of the liability. Contingent rents are charged as expenses in the reporting years in which they are incurred. The assets are depreciated as owned depreciable assets. Leases where the lessor effectively retains substantially all the risks and benefits of ownership of the leased assets are classified as operating leases. For operating leases, lease payments are recognised as an expense in profit or loss on a straight-line basis over the term of the relevant lease unless another systematic basis is representative of the time pattern of the user’s benefit, even if the payments are not on that basis. Lease incentives received are recognised in profit or loss as an integral part of the total lease expense. Rental income from operating leases is recognised in profit or loss on a straight-line basis over the term of the relevant lease unless another systematic basis is representative of the time pattern of the user’s benefit, even if the payments are not on that basis. Initial direct costs incurred in negotiating and arranging an operating lease are added to the carrying amount of the leased asset and recognised on a straight-line basis over the lease term.

NOTES TO THE FINANCIAL STATEMENTS31 December 2015
KENCANA AGRI LIMITED ANNUAL REPORT 201556
2. Significant accounting policies and other explanatory information (cont’d)
2A. Significant accounting policies (cont’d)
Subsidiaries
A subsidiary is an entity including unincorporated and special purpose entity that is controlled by the reporting entity and the reporting entity is exposed, or has rights, to variable returns from its involvement with the investee and has the ability to affect those returns through its power over the investee. The existence and effect of substantive potential voting rights that the reporting entity has the practical ability to exercise (that is, substantive rights) are considered when assessing whether the reporting entity controls another entity.
In the reporting entity’s separate financial statements, an investment in a subsidiary is accounted for at cost less any allowance for impairment in value. Impairment loss recognised in profit or loss for a subsidiary is reversed only if there has been a change in the estimates used to determine the asset’s recoverable amount since the last impairment loss was recognised. The carrying value and the net book value of the investment in a subsidiary are not necessarily indicative of the amount that would be realised in a current market exchange.
Joint arrangements – joint venture
A joint arrangement (that is, either a joint operation or a joint venture, depending on the rights and obligations of the jointly controlling parties to the arrangement), is one in which the reporting entity is party to an arrangement of which two or more parties have joint control, which is the contractually agreed sharing of control of the arrangement; it exists only when decisions about the relevant activities (that is, activities that significantly affect the returns of the arrangement) require the unanimous consent of the parties sharing control. In a joint venture, the parties with joint control have rights to the net assets of the arrangement. The reporting interests in joint ventures are recognised using the equity method in accordance with FRS 28 Investments in Associates and Joint Ventures.
Under the equity method the investment is initially recognised at cost and adjusted thereafter for the post-acquisition change in the investor’s share of the investee’s net assets.
In the consolidated financial statements, the accounting for investments in a joint venture is on the equity method. Under the equity method the investment is initially recognised at cost and adjusted thereafter for the post-acquisition change in the investor’s share of the investee’s net assets. The carrying value and the net book value of the investment in the joint venture are not necessarily indicative of the amounts that would be realised in a current market exchange. The investor’s profit or loss includes its share of the investee’s profit or loss and the investor’s other comprehensive income includes its share of the investee’s other comprehensive income. Losses of a joint venture in excess of the reporting entity’s interest in the relevant joint venture are not recognised except to the extent that the reporting entity has an obligation. Profits and losses resulting from transactions between the reporting entity and a joint venture are recognised in the financial statements only to the extent of unrelated reporting entity’s interests in the joint venture. Unrealised losses are also eliminated unless the transaction provides evidence of an impairment of the asset transferred. Accounting policies of joint ventures are changed where necessary to ensure consistency with the policies adopted by the reporting entity. The reporting entity discontinues the use of the equity method from the date that when its investment ceases to be a joint venture and accounts for the investment in accordance with FRS 39 from that date. Any gain or loss is recognised in profit or loss. Any investment retained in the former joint venture is measured at fair value at the date that it ceases to be a joint venture.
In the company’s separate financial statements, an investment in a joint venture is accounted for at cost less any allowance for impairment in value. Impairment loss recognised in profit or loss for a joint venture is reversed only if there has been a change in the estimates used to determine the asset’s recoverable amount since the last impairment loss was recognised. The carrying value and the net book value of an investment in the joint venture are not necessarily indicative of the amounts that would be realised in a current market exchange.
NOTES TO THE FINANCIAL STATEMENTS31 December 2015
KENCANA AGRI LIMITED ANNUAL REPORT 201557
2. Significant accounting policies and other explanatory information (cont’d)
2A. Significant accounting policies (cont’d)
Business combinations
Business combinations are accounted for by applying the acquisition method. There were no acquisitions during the reporting year.
Non-controlling interests
The non-controlling interest is equity in a subsidiary not attributable, directly or indirectly, to the reporting entity as the parent. The non-controlling interest is presented in the consolidated statement of financial position within equity, separately from the equity of the owners of the parent. For each business combination, any non-controlling interest in the acquiree (subsidiary) is initially measured either at fair value or at the non-controlling interest’s proportionate share of the acquiree’s identifiable net assets. Where the non-controlling interest is measured at fair value, the valuation techniques and key model inputs used are disclosed in the relevant note. Profit or loss and each component of other comprehensive income are attributed to the owners of the parent and to the non-controlling interests. Total comprehensive income is attributed to the owners of the parent and to the non-controlling interests even if this results in the non-controlling interests having a deficit balance.
Impairment of non-financial assets
Irrespective of whether there is any indication of impairment, an annual impairment test is performed at the same time every year on an intangible asset with an indefinite useful life or an intangible asset not yet available for use. The carrying amount of other non-financial assets is reviewed at each end of the reporting year for indications of impairment and where an asset is impaired, it is written down through profit or loss to its estimated recoverable amount. The impairment loss is the excess of the carrying amount over the recoverable amount and is recognised in profit or loss unless the relevant asset is carried at a revalued amount, in which case the impairment loss is treated as a revaluation decrease. The recoverable amount of an asset or a cash-generating unit is the higher of its fair value less costs of disposal and its value in use. When the fair value less costs of disposal method is used, any available recent market transactions are taken into consideration. When the value in use method is adopted, in assessing value in use, the estimated future cash flows are discounted to their present value using a pre-tax discount rate that reflects current market assessments of the time value of money and the risks specific to the asset. For the purposes of assessing impairment, assets are grouped at the lowest levels for which there are separately identifiable cash flows (cash-generating units). At each end of the reporting year non-financial assets other than goodwill with impairment loss recognised in prior periods are assessed for possible reversal of the impairment. An impairment loss is reversed only to the extent that the asset’s carrying amount does not exceed the carrying amount that would have been measured, net of depreciation or amortisation, if no impairment loss had been recognised.
Inventories
Inventories are measured at the lower of cost (weighted average) and net realisable value. Net realisable value is the estimated selling price in the ordinary course of business less the estimated costs of completion and the estimated costs necessary to make the sale. A write down on cost is made where the cost is not recoverable or if the selling prices have declined. Cost includes all costs of purchase, costs of conversion and other costs incurred in bringing the inventories to their present location and condition.
Financial assets
Initial recognition, measurement and derecognition:
A financial asset is recognised on the statement of financial position when, and only when, the entity becomes a party to the contractual provisions of the instrument. The initial recognition of financial assets is at fair value normally represented by the transaction price. The transaction price for financial asset not classified at fair value through profit or loss includes the transaction costs that are directly attributable to the acquisition or issue of the financial asset. Transaction costs incurred on the acquisition or issue of financial assets classified at fair value through profit or loss are expensed immediately. The transactions are recorded at the trade date method.
NOTES TO THE FINANCIAL STATEMENTS31 December 2015
KENCANA AGRI LIMITED ANNUAL REPORT 201558
2. Significant accounting policies and other explanatory information (cont’d)
2A. Significant accounting policies (cont’d)
Financial assets (cont’d)
Irrespective of the legal form of the transactions performed, financial assets are derecognised when they pass the “substance over form” based on the derecognition test prescribed by FRS 39 relating to the transfer of risks and rewards of ownership and the transfer of control. Financial assets and financial liabilities are offset and the net amount is reported in the statement of financial position if there is currently a legally enforceable right to offset the recognised amounts and there is an intention to settle on a net basis, to realise the assets and settle the liabilities simultaneously. Subsequent measurement:
Subsequent measurement based on the classification of the financial assets in one of the following categories under FRS 39 is as follows:
#1. Financial assets at fair value through profit or loss: Assets are classified in this category when they are incurred principally for the purpose of selling or repurchasing in the near term (trading assets) or are derivatives (except for a derivative that is a designated and effective hedging instrument) or have been classified in this category because the conditions are met to use the “fair value option” and it is used. All changes in fair value relating to assets at fair value through profit or loss are recognised directly in profit or loss.
#2. Loans and receivables: Loans and receivables are non-derivative financial assets with fixed or determinable payments that are not quoted in an active market. Assets that are for sale immediately or in the near term are not classified in this category. These assets are carried at amortised costs using the effective interest method (except that short-duration receivables with no stated interest rate are normally measured at original invoice amount unless the effect of imputing interest would be significant) minus any reduction (directly or through the use of an allowance account) for impairment or uncollectibility. Impairment charges are provided only when there is objective evidence that an impairment loss has been incurred as a result of one or more events that occurred after the initial recognition of the asset (a ‘loss event’) and that loss event (or events) has an impact on the estimated future cash flows of the financial asset or group of financial assets that can be reliably estimated. The methodology ensures that an impairment loss is not recognised on the initial recognition of an asset. Losses expected as a result of future events, no matter how likely, are not recognised. For impairment, the carrying amount of the asset is reduced through use of an allowance account. The amount of the loss is recognised in profit or loss. An impairment loss is reversed if the reversal can be related objectively to an event occurring after the impairment loss was recognised. Typically the trade and other receivables are classified in this category.
#3. Held-to-maturity financial assets: As at end of the reporting year date there were no financial assets classified in this category.
#4. Available-for-sale financial assets: As at end of the reporting year date there were no financial assets classified in this category.
Cash and cash equivalents
Cash and cash equivalents include bank and cash balances, on demand deposits and any highly liquid debt instruments purchased with an original maturity of three months or less. For the statement of cash flows the item includes cash and cash equivalents less cash subject to restriction and bank overdrafts payable on demand that form an integral part of cash management. Other financial assets and financial liabilities at fair value through profit or loss are presented within the section on operating activities as part of changes in working capital in the statement of cash flows.

NOTES TO THE FINANCIAL STATEMENTS31 December 2015
KENCANA AGRI LIMITED ANNUAL REPORT 201559
2. Significant accounting policies and other explanatory information (cont’d)
2A. Significant accounting policies (cont’d)
Hedging
The entity is exposed to currency and interest rate risks. The policy is to reduce currency and interest rate exposures through derivatives and other hedging instruments. From time to time, there may be borrowings and foreign exchange arrangements or interest rate swap contracts or similar instruments entered into as hedges against changes in interest rates, cash flows or the fair value of the financial assets and liabilities. The gain or loss from remeasuring these hedging or other arrangement instruments at fair value are recognised in profit or loss. The derivatives and other hedging instruments used are described below in the notes to the financial statements.
Derivatives
All derivatives are initially recognised and subsequently carried at fair value. The policy is to use derivatives only for non-speculative purposes. Certain derivatives are entered into in order to hedge some transactions and all the strict hedging criteria prescribed by FRS 39 are not met. In those cases, even though the transaction has its economic and business rationale, hedge accounting cannot be applied. As a result, changes in the fair value of those derivatives are recognised directly in profit or loss and the hedged item follows normal accounting policies.
The group has committed purchase and sales contracts for crude palm oil and palm kernel cake that are entered into as part of its processing and sale activities. The prices and physical delivery of the sales and purchases are fixed in the contracts and these executory contracts are not recognised in the financial statements until physical deliveries take place.
The group enters into non-physical delivery forward contracts to manage the price risk of its physical inventory and to hedge against fluctuations in commodity prices. Prices on commodity exchanges are quoted up to 3 to 5 months forward. The gains or losses arising from matched non-physical delivery forward contracts are recognised immediately in profit or loss.
Outstanding forward contracts are valued at their fair values at the end of the reporting year. Where available, quoted market prices are used as a measure of fair values for the outstanding contracts. Where the quoted market prices are not available, fair values are based on management’s best estimate and are arrived at by reference to the market prices of other contracts that are substantially similar. Unrealised losses arising from the valuation are set off against unrealised gains on an aggregate basis.
Financial liabilities
Initial recognition, measurement and derecognition:
A financial liability is recognised on the statement of financial position when, and only when, the entity becomes a party to the contractual provisions of the instrument and it is derecognised when the obligation specified in the contract is discharged or cancelled or expires. The initial recognition of financial liability is at fair value normally represented by the transaction price. The transaction price for financial liability not classified at fair value through profit or loss includes the transaction costs that are directly attributable to the acquisition or issue of the financial liability. Transaction costs incurred on the acquisition or issue of financial liability classified at fair value through profit or loss are expensed immediately. The transactions are recorded at the trade date method. Financial liabilities including bank and other borrowings are classified as current liabilities unless there is an unconditional right to defer settlement of the liability for at least 12 months after the end of the reporting year.

NOTES TO THE FINANCIAL STATEMENTS31 December 2015
KENCANA AGRI LIMITED ANNUAL REPORT 201560
2. Significant accounting policies and other explanatory information (cont’d)
2A. Significant accounting policies (cont’d)
Financial liabilities (cont’d)
Subsequent measurement:
Subsequent measurement based on the classification of the financial liabilities in one of the following two categories under FRS 39 is as follows:
#1. Liabilities at fair value through profit or loss: Liabilities are classified in this category when they are incurred principally for the purpose of selling or repurchasing in the near term (trading liabilities) or are derivatives (except for a derivative that is a designated and effective hedging instrument) or have been classified in this category because the conditions are met to use the “fair value option” and it is used. Financial guarantee contracts are initially recognised at fair value and are subsequently measured at the greater of (a) the amount measured in accordance with FRS 37 and (b) the amount initially recognised less, where appropriate, cumulative amortisation recognised in accordance with FRS 18. All changes in fair value relating to liabilities at fair value through profit or loss are charged to profit or loss as incurred.
#2. Other financial liabilities: All liabilities, which have not been classified as in the previous category fall into this residual category. These liabilities are carried at amortised cost using the effective interest method. Trade and other payables and borrowings are usually classified in this category. Items classified within current trade and other payables are not usually re-measured, as the obligation is usually known with a high degree of certainty and settlement is short-term.
Fair value measurement
Fair value is taken to be the price that would be received to sell an asset or paid to transfer a liability in an orderly transaction between market participants at the measurement date (that is, an exit price). It is a market-based measurement, not an entity-specific measurement. When measuring fair value, management uses the assumptions that market participants would use when pricing the asset or liability under current market conditions, including assumptions about risk. The entity’s intention to hold an asset or to settle or otherwise fulfil a liability is not taken into account as relevant when measuring fair value. In making the fair value measurement, management determines the following: (a) the particular asset or liability being measured (these are identified and disclosed in the relevant notes below); (b) for a non-financial asset, the highest and best use of the asset and whether the asset is used in combination with other assets or on a stand-alone basis; (c) the market in which an orderly transaction would take place for the asset or liability; and (d) the appropriate valuation techniques to use when measuring fair value. The valuation techniques used maximise the use of relevant observable inputs and minimise unobservable inputs. These inputs are consistent with the inputs a market participant may use when pricing the asset or liability.
The fair value measurements and related disclosures categorise the inputs to valuation techniques used to measure fair value by using a fair value hierarchy of three levels. These are recurring fair value measurements unless stated otherwise in the relevant notes to the financial statements. Level 1 inputs are quoted prices (unadjusted) in active markets for identical assets or liabilities that the entity can access at the measurement date. Level 2 inputs are inputs other than quoted prices included within Level 1 that are observable for the asset or liability, either directly or indirectly. Level 3 inputs are unobservable inputs for the asset or liability. The level is measured on the basis of the lowest level input that is significant to the fair value measurement in its entirety. Transfers between levels of the fair value hierarchy are deemed to have occurred at the beginning of the reporting year. If a financial instrument measured at fair value has a bid price and an ask price, the price within the bid-ask spread or mid-market pricing that is most representative of fair value in the circumstances is used to measure fair value regardless of where the input is categorised within the fair value hierarchy. If there is no market, or the markets available are not active, the fair value is established by using an acceptable valuation technique.
The carrying values of current financial instruments approximate their fair values due to the short-term maturity of these instruments and the disclosures of fair value are not made when the carrying amount of current financial instruments is a reasonable approximation of the fair value. The fair values of non-current financial instruments may not be disclosed separately unless there are significant differences at the end of the reporting year and in the event the fair values are disclosed in the relevant notes to the financial statements.
NOTES TO THE FINANCIAL STATEMENTS31 December 2015
KENCANA AGRI LIMITED ANNUAL REPORT 201561
2. Significant accounting policies and other explanatory information (cont’d)
2A. Significant accounting policies (cont’d)
Provisions
A liability or provision is recognised when there is a present obligation (legal or constructive) as a result of a past event, it is probable that an outflow of resources embodying economic benefits will be required to settle the obligation and a reliable estimate can be made of the amount of the obligation. A provision is made using best estimates of the amount required in settlement and where the effect of the time value of money is material, the amount recognised is the present value of the expenditures expected to be required to settle the obligation using a pre-tax rate that reflects current market assessments of the time value of money and the risks specific to the obligation. The increase in the provision due to passage of time is recognised as interest expense. Changes in estimates are reflected in profit or loss in the reporting year they occur.
2B. Other explanatory information
Classification of equity and liabilities
A financial instrument is classified as a liability or as equity in accordance with the substance of the contractual arrangement on initial recognition. Equity instruments are contracts that give a residual interest in the net assets of the reporting entity. Where the financial instrument does not give rise to a contractual obligation on the part of the issuer to make payment in cash or kind under conditions that are potentially unfavourable, it is classified as an equity instrument. Ordinary shares are classified as equity. Equity instruments are recognised at the amount of proceeds received net of incremental costs directly attributable to the transaction. Dividends on equity are recognised as liabilities when they are declared. Interim dividends are recognised when declared by the directors.
Segment reporting
The reporting entity discloses financial and descriptive information about its consolidated reportable segments. Reportable segments are operating segments or aggregations of operating segments that meet specified criteria. Operating segments are components about which separate financial information is available that is evaluated regularly by the chief operating decision maker in deciding how to allocate resources and in assessing the performance. Generally, financial information is reported on the same basis as is used internally for evaluating operating segment performance and deciding how to allocate resources to operating segments.
2C. Critical judgements, assumptions and estimation uncertainties
The critical judgements made in the process of applying the accounting policies that have the most significant effect on the amounts recognised in the financial statements and the key assumptions concerning the future, and other key sources of estimation uncertainty at the end of the reporting year, that have a significant risk of causing a material adjustment to the carrying amounts of assets and liabilities currently or within the next reporting year are discussed below. These estimates and assumptions are periodically monitored to ensure they incorporate all relevant information available at the date when financial statements are prepared. However, this does not prevent actual figures differing from estimates.
Biological assets:The oil palm plantations are stated at fair value less estimated point-of-sale costs. This measurement is significant and the process is complex and highly judgmental and is based on assumptions that are affected by expected future market or economic conditions. As a result, judgement is required in evaluating the assumptions and methodologies used by management, in particular those relating to the forecasted revenue growth and profit margins. The disclosures about measurement of fair values are included in Note 17, which explains that small changes in the key assumptions used could give rise to gains and losses. Actual outcomes could vary from these estimates.
NOTES TO THE FINANCIAL STATEMENTS31 December 2015
KENCANA AGRI LIMITED ANNUAL REPORT 201562
2. Significant accounting policies and other explanatory information (cont’d)
2C. Critical judgements, assumptions and estimation uncertainties (cont’d)
Income tax amounts:The group has exposure to income taxes in mainly two jurisdictions, Indonesia and Singapore. The entity recognises tax liabilities and tax assets based on an estimation of the likely taxes due, which requires significant judgement as to the ultimate tax determination of certain items. Where the actual amount arising from these issues differs from these estimates, such differences will have an impact on income tax and deferred tax amounts in the period when such determination is made. In addition management judgement is required in determining the amount of current and deferred tax recognised and the extent to which amounts should or can be recognised. A deferred tax asset is recognised for unused tax losses if it is probable that the entity will earn sufficient taxable profit in future periods to benefit from a reduction in tax payments. This involves the management making assumptions within its overall tax planning activities and periodically reassessing them in order to reflect changed circumstances as well as tax regulations. Moreover, the measurement of a deferred tax asset or liability reflects the manner in which the entity expects to recover the asset’s carrying value or settle the liability. As a result, due to their inherent nature assessments of likelihood are judgmental and not susceptible to precise determination. The income tax amounts are disclosed in the note on income tax.
Property, plant and equipment:An assessment is made for the reporting year whether there is any indication that the asset may be impaired. If any such indication exists, an estimate is made of the recoverable amount of the asset. The recoverable amounts of cash-generating units if applicable is measured based on the fair value less costs of disposal or value in use calculations. It is impracticable to disclose the extent of the possible effects. It is reasonably possible, based on existing knowledge, that outcomes within the next reporting year that are different from assumptions could require a material adjustment to the carrying amount of the balances affected. The carrying amounts of the specific asset or class of assets at the end of the reporting year affected by the assumption are disclosed in the note on property, plant and equipment.
Useful lives of property, plant and equipment:The estimates for the useful lives and related depreciation charges for property, plant and equipment is based on commercial and production factors which could change significantly as a result of innovations and in response to market conditions. The depreciation charge is increased where useful lives are less than previously estimated lives, or the carrying amounts written off or written down for technically obsolete assets that have been abandoned. It is impracticable to disclose the extent of the possible effects. It is reasonably possible, based on existing knowledge, that outcomes within the next reporting year that are different from assumptions could require a material adjustment to the carrying amount of the balances affected. The carrying amounts of the specific assets at the end of the reporting year affected by the assumption are US$85,732,000 (2014: US$58,234,000).
Land use rights:The group holds location permits or Ijin Lokasi in respect of plantation land in Indonesia allocated by the Indonesian authorities. Upon the completion of the acquisition of such land, the group will be entitled to begin the process of application for Business Usage Rights (“Hak Guna Usaha” or “HGU”) certificates over such land. The Ijin Lokasi may not be extended by the Indonesian Authorities and will automatically expire if the group fails to acquire the land covered in the Ijin Lokasi within the stipulated validity period of the said Ijin Lokasi. In such an event, the group may lose their rights granted by the Indonesian Authorities under the Ijin Lokasi in respect of the remaining area covered by the original Ijin Lokasi.
At the date of this report, the group is in the final process of obtaining HGU certificates for conversion in respect of 9,002 (2014: 6,411) hectares of Kadastral land. Kadastral land is land that is measured to determine the actual land area for the HGU title based on the application submitted by the group. The group is also in the process of acquiring and clearing land held under their land bank prior to the issuance of Kadastral for such land. Prior to the issuance of the HGU certificates, such land is considered as uncertified land. Pending the issue of HGU certificates, the group is permitted to physically occupy and build on the uncertified land and to plant and harvest crops. However, as the administration of land laws and regulations may be subject to a certain degree of discretion by the Indonesian authorities, there is no assurance with certainty that the relevant authorities would not take a different approach or view as regard the uncertified land, its use, registration and future disposal for value. Should the relevant authorities take a different approach or view as regards the same and the group is unable to convert the uncertified land to HGU certified land, the group’s interest in the uncertified land as well as the use of such land may be adversely affected. At the end of the reporting year, the uncertified land amounted to 9,002 (2014: 6,411) hectares (see Note 20).
NOTES TO THE FINANCIAL STATEMENTS31 December 2015
KENCANA AGRI LIMITED ANNUAL REPORT 201563
2. Significant accounting policies and other explanatory information (cont’d)
2C. Critical judgements, assumptions and estimation uncertainties (cont’d)
Pension and employee benefits:The determination of the group’s obligations and cost for pension and employee benefits liability is dependent on its selection of certain assumptions used by independent actuaries in calculating such amounts. Those assumptions include among others, discount rates, future annual salary increases, annual employee turnover rates, disability rates, retirement age and mortality rates.
Actual results that differ from the assumptions are recognised immediately in profit or loss as and when they occur. While the group believes that its assumptions are reasonable and appropriate, significant differences in the group’s actual experience or significant changes in the assumptions may materially affect its estimated liabilities for pension and employee benefits and net employee benefits expense. The carrying amount of the estimated liabilities for employee benefits as at 31 December 2015 was US$3,832,000 (2014: US$4,216,000).
Advances/guarantees under the Plasma Programme:The group has provided guarantees in respect of loans granted by banks to villagers under the Plasma Programme. The villagers will repay the bank loans from the sale proceeds of FFB. In the event the villagers default on their obligations to repay the bank loans, the banks may call upon the guarantees, which have been provided by the group to the banks to secure the loans of the villagers. The entity recognises expected losses if any which require significant judgement. Details of the bank guarantees provided are disclosed in Note 32 to these financial statements.
Environmental regulations:The main environmental concerns relate to the discharge of effluent arising from the milling of FFB and clearance of land and forest for developing the group’s plantations. The main social concern relates to possible conflicts that may arise with local communities in the areas around the plantations. Any environmental claims or failure to comply with any present or future regulations could result in the imposition of fines, the suspension or a cessation of the group’s operations.
The group’s plantations are subject to both scheduled and unscheduled inspections by various Indonesian government agencies, each of whom may have differing perspectives or standards from the others. These agencies have the power to examine and control the group’s compliances with their environmental regulations, including the imposition of fines and revocation of licenses and land rights. However, governmental agencies may adopt additional regulations that would require the group to spend additional funds on environmental matters.
Environmental regulations and social practices in Indonesia tend to be less exact than in developed countries. It is possible that these regulations could become more exact in the future and compliance with them may involve incurring significant costs. This may consequently have an adverse effect on the group’s operations. Any failure to comply with the laws and regulations could subject the group to further liabilities.
It is impracticable to disclose the extent of the possible effects of the above matters on the consolidated financial statements of the group. Measurement of impairment of subsidiaries and joint ventures: Where an investee is in net equity deficit and has suffered operating losses a test is made whether the investment in the investee has suffered any impairment. This determination requires significant judgement. An estimate is made of the future profitability of the investee, and the financial health of and near-term business outlook for the investee, including factors such as industry and sector performance, and operational and financing cash flow. It is impracticable to disclose the extent of the possible effects. It is reasonably possible, based on existing knowledge, that outcomes within the next reporting year that are different from assumptions could require a material adjustment to the carrying amount of the balances affected. The carrying amount of the investments in subsidiaries at the end of the reporting year affected by the assumption are US$269,700 (2014:US$299,000).

NOTES TO THE FINANCIAL STATEMENTS31 December 2015
KENCANA AGRI LIMITED ANNUAL REPORT 201564
3. Related party relationships and transactions
FRS 24 on related party disclosures requires the reporting entity to disclose: (a) transactions with its related parties; and (b) relationships between parents and subsidiaries irrespective of whether there have been transactions between those related parties. A party is related to a party if the party controls, or is controlled by, or can significantly influence or is significantly influenced by the other party.
3A. Members of a group:
Name Relationship Country of incorporation
Kencana Holdings Pte. Ltd. Ultimate parent company Singapore
Related companies in these financial statements include the members of the above group of companies. Associates also include those that are associates of members of the above group.
The ultimate controlling party is Henry Maknawi, a director.
3B. Related party transactions: There are transactions and arrangements between the reporting entity and related parties and the effects of these on the basis determined between the parties are reflected in these financial statements. The related party balances are unsecured without fixed repayment terms and interest unless stated otherwise. For any balances and financial guarantees no interest or charge is imposed unless stated otherwise.
Intragroup transactions and balances that have been eliminated in these consolidated financial statements are not disclosed as related party transactions and balances below.
In addition to transactions and balances disclosed elsewhere in the notes to the financial statements, this item includes the following:
Significant related party transactions:
Group 2015 2014 US$’000 US$’000
Related parties:Sales of commodities (a) 1,792 30,763Purchases of commodities (a) (5,038) (9,838)Lease related services (b) (45) (51)Receiving of service expense (b) (3,221) (6,408)
Joint ventures:Sales of commodities 48,180 40,248Interest income 1,906 1,744Management fee income 111 90Purchase of services – (2)
Other related parties – persons with significant influence over the entity:Acquisition of non-controlling interests 106 –
(a) The related party, Wilmar International Limited has 20% interest in and significant influence over the reporting entity.
(b) The related parties PT Berkat Wahana Sukses, PT Alamindo Sejahtera Persada and PT Graha Meruya are companies in which directors or their immediate family members have a significant or controlling interest.
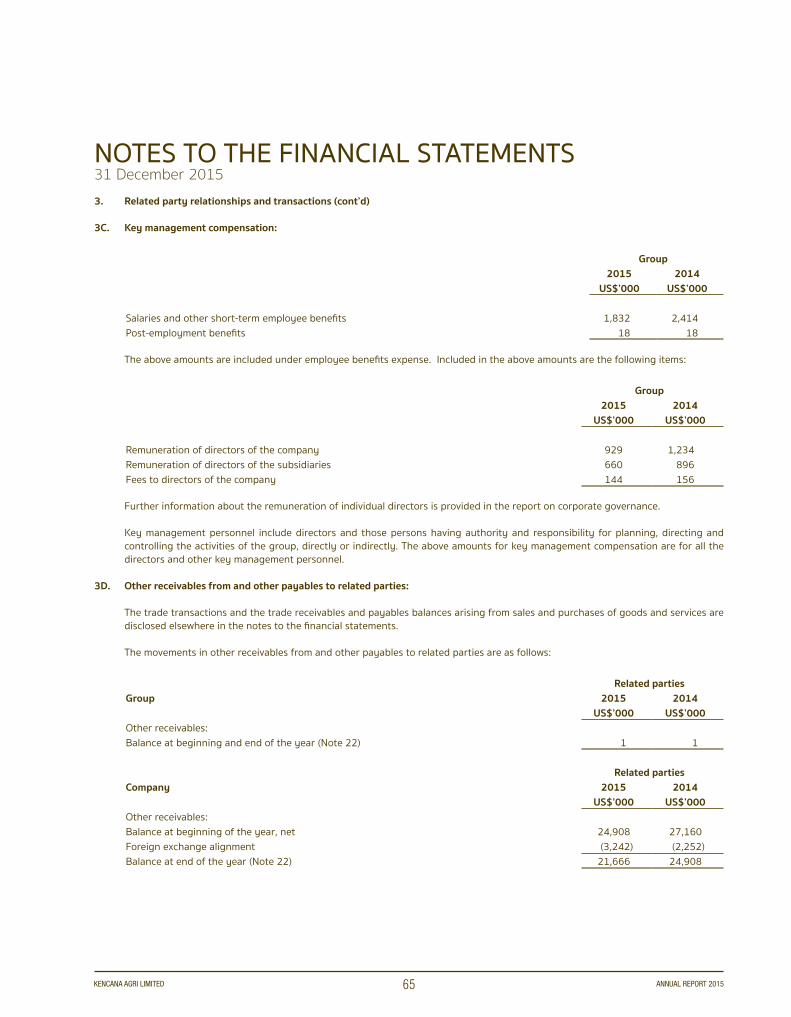
NOTES TO THE FINANCIAL STATEMENTS31 December 2015
KENCANA AGRI LIMITED ANNUAL REPORT 201565
3. Related party relationships and transactions (cont’d)
3C. Key management compensation:
Group2015 2014
US$’000 US$’000
Salaries and other short-term employee benefits 1,832 2,414Post-employment benefits 18 18
The above amounts are included under employee benefits expense. Included in the above amounts are the following items:
Group2015 2014
US$’000 US$’000
Remuneration of directors of the company 929 1,234Remuneration of directors of the subsidiaries 660 896Fees to directors of the company 144 156
Further information about the remuneration of individual directors is provided in the report on corporate governance.
Key management personnel include directors and those persons having authority and responsibility for planning, directing and controlling the activities of the group, directly or indirectly. The above amounts for key management compensation are for all the directors and other key management personnel.
3D. Other receivables from and other payables to related parties:
The trade transactions and the trade receivables and payables balances arising from sales and purchases of goods and services are disclosed elsewhere in the notes to the financial statements.
The movements in other receivables from and other payables to related parties are as follows:
Related partiesGroup 2015 2014
US$’000 US$’000Other receivables:Balance at beginning and end of the year (Note 22) 1 1
Related partiesCompany 2015 2014
US$’000 US$’000Other receivables:Balance at beginning of the year, net 24,908 27,160Foreign exchange alignment (3,242) (2,252)Balance at end of the year (Note 22) 21,666 24,908
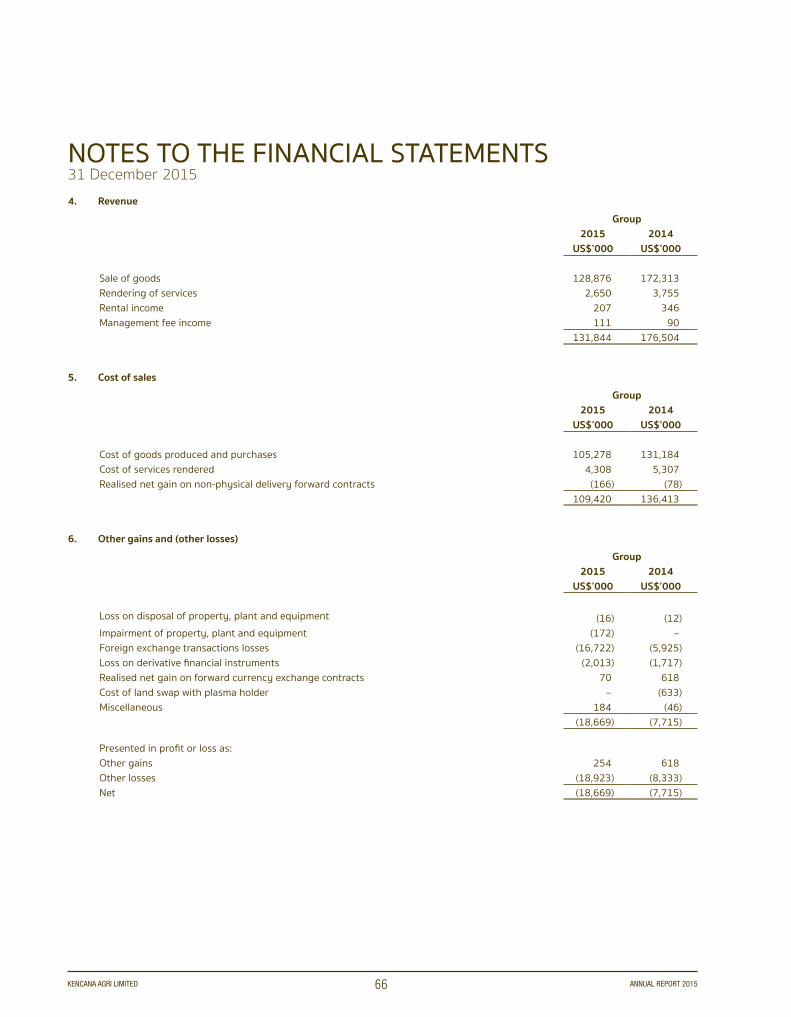
NOTES TO THE FINANCIAL STATEMENTS31 December 2015
KENCANA AGRI LIMITED ANNUAL REPORT 201566
4. RevenueGroup
2015 2014 US$’000 US$’000
Sale of goods 128,876 172,313Rendering of services 2,650 3,755Rental income 207 346Management fee income 111 90
131,844 176,504
5. Cost of salesGroup
2015 2014 US$’000 US$’000
Cost of goods produced and purchases 105,278 131,184Cost of services rendered 4,308 5,307Realised net gain on non-physical delivery forward contracts (166) (78)
109,420 136,413
6. Other gains and (other losses)Group
2015 2014 US$’000 US$’000
Loss on disposal of property, plant and equipment (16) (12)Impairment of property, plant and equipment (172) – Foreign exchange transactions losses (16,722) (5,925)Loss on derivative financial instruments (2,013) (1,717)Realised net gain on forward currency exchange contracts 70 618Cost of land swap with plasma holder – (633)Miscellaneous 184 (46)
(18,669) (7,715)
Presented in profit or loss as:Other gains 254 618Other losses (18,923) (8,333)Net (18,669) (7,715)
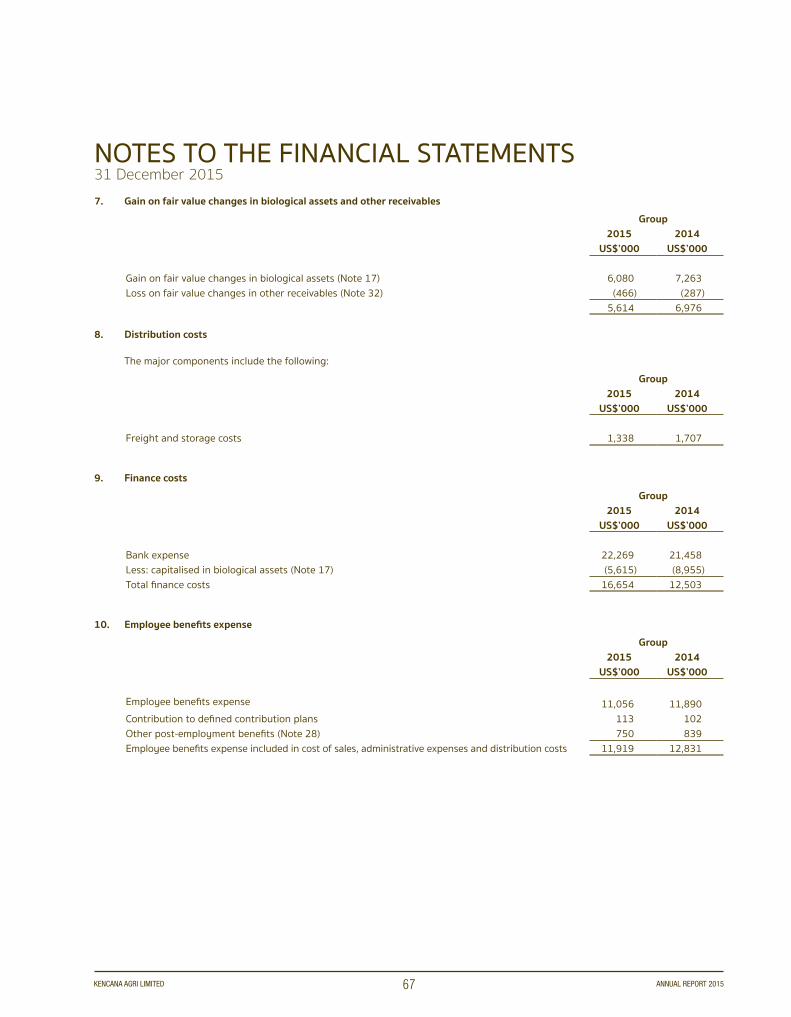
NOTES TO THE FINANCIAL STATEMENTS31 December 2015
KENCANA AGRI LIMITED ANNUAL REPORT 201567
7. Gain on fair value changes in biological assets and other receivablesGroup
2015 2014 US$’000 US$’000
Gain on fair value changes in biological assets (Note 17) 6,080 7,263Loss on fair value changes in other receivables (Note 32) (466) (287)
5,614 6,976
8. Distribution costs
The major components include the following:Group
2015 2014 US$’000 US$’000
Freight and storage costs 1,338 1,707
9. Finance costsGroup
2015 2014 US$’000 US$’000
Bank expense 22,269 21,458Less: capitalised in biological assets (Note 17) (5,615) (8,955)Total finance costs 16,654 12,503
10. Employee benefits expense
Group2015 2014
US$’000 US$’000
Employee benefits expense 11,056 11,890Contribution to defined contribution plans 113 102Other post-employment benefits (Note 28) 750 839Employee benefits expense included in cost of sales, administrative expenses and distribution costs 11,919 12,831

NOTES TO THE FINANCIAL STATEMENTS31 December 2015
KENCANA AGRI LIMITED ANNUAL REPORT 201568
11. Income tax
11A. Components of tax (income)/expense recognised in profit or loss include:Group
2015 2014 US$’000 US$’000
Current tax expense: Current tax expense 503 1,121(Over)/under adjustments to current tax in respect of prior period (2) 872Subtotal 501 1,993
Deferred tax (income)/expense:Current deferred tax (income)/expense (1,538) 3,134Under adjustments to deferred tax in respect of prior period – 458Subtotal (1,538) 3,592Total income tax (income)/expense (1,037) 5,585
Substantially all of the group’s operations are located in Indonesia. Companies in Indonesia are generally subject to a tax rate of 25% (2014: 25%). Accordingly, the Indonesian statutory tax rate of 25% (2014: 25%) is used in the reconciliation below.
The income tax in profit or loss varied from the amount of income tax amount determined by applying the Indonesian statutory income tax rate of 25% (2014: 25%) to profit before income tax as a result of the following differences:
Group2015 2014
US$’000 US$’000
(Loss)/Profit before tax (18,082) 12,808Less: Share of loss from equity-accounted joint ventures (2,117) (2,338)
(15,965) 15,146
Income tax (income)/expense at the applicable tax rate (3,991) 3,787Non allowable items 2,622 590Effect of different tax rates in different countries 97 87Unrecognised deferred tax assets 406 70Under provision of deferred tax for prior period – 458(Over)/under adjustments to income tax in respect of prior period (2) 872Other items less than 3% each (169) (279)Total income tax (income)/expense (1,037) 5,585
There are no income tax consequences of dividends to owners of the company.
The amount of income taxes outstanding as at the end of the reporting year was US$1,867,000 (2014: US$2,334,000). Such an amount is net of tax advances, which according to the tax rules in Indonesia, were paid before the reporting year end.
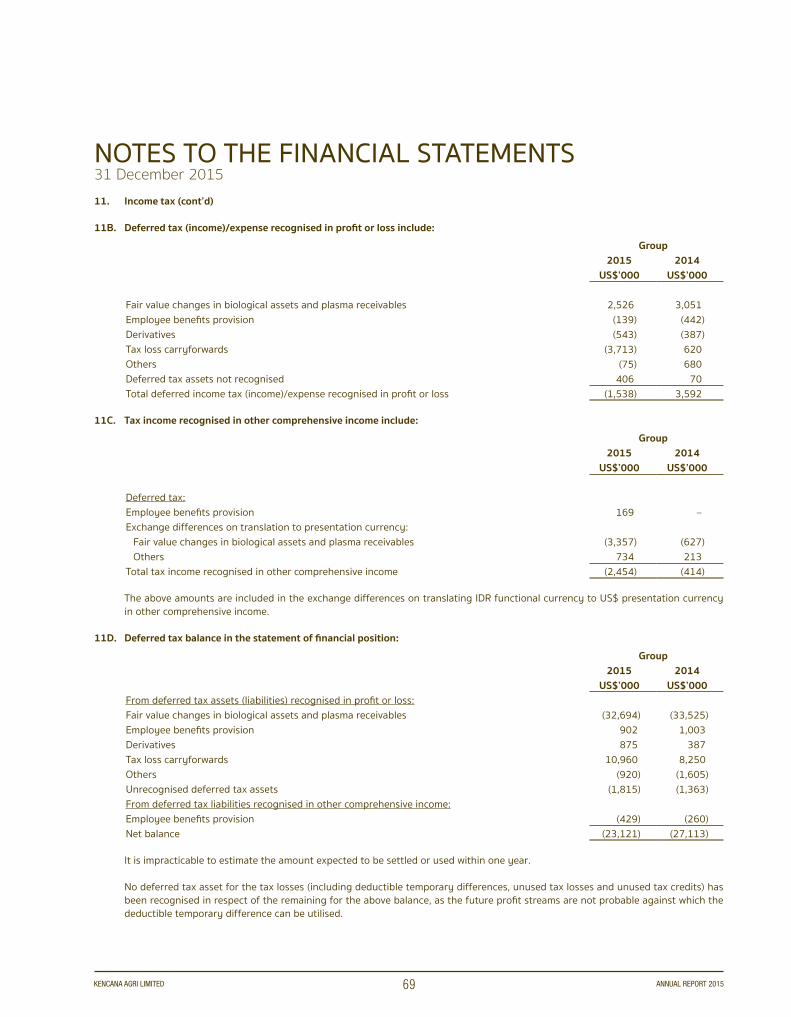
NOTES TO THE FINANCIAL STATEMENTS31 December 2015
KENCANA AGRI LIMITED ANNUAL REPORT 201569
11. Income tax (cont’d)
11B. Deferred tax (income)/expense recognised in profit or loss include:Group
2015 2014 US$’000 US$’000
Fair value changes in biological assets and plasma receivables 2,526 3,051Employee benefits provision (139) (442)Derivatives (543) (387)Tax loss carryforwards (3,713) 620Others (75) 680Deferred tax assets not recognised 406 70Total deferred income tax (income)/expense recognised in profit or loss (1,538) 3,592
11C. Tax income recognised in other comprehensive income include:Group
2015 2014 US$’000 US$’000
Deferred tax:Employee benefits provision 169 – Exchange differences on translation to presentation currency:
Fair value changes in biological assets and plasma receivables (3,357) (627)Others 734 213
Total tax income recognised in other comprehensive income (2,454) (414)
The above amounts are included in the exchange differences on translating IDR functional currency to US$ presentation currency in other comprehensive income.
11D. Deferred tax balance in the statement of financial position:Group
2015 2014 US$’000 US$’000
From deferred tax assets (liabilities) recognised in profit or loss:Fair value changes in biological assets and plasma receivables (32,694) (33,525)Employee benefits provision 902 1,003Derivatives 875 387Tax loss carryforwards 10,960 8,250Others (920) (1,605)Unrecognised deferred tax assets (1,815) (1,363)From deferred tax liabilities recognised in other comprehensive income:Employee benefits provision (429) (260) Net balance (23,121) (27,113)
It is impracticable to estimate the amount expected to be settled or used within one year.
No deferred tax asset for the tax losses (including deductible temporary differences, unused tax losses and unused tax credits) has been recognised in respect of the remaining for the above balance, as the future profit streams are not probable against which the deductible temporary difference can be utilised.

NOTES TO THE FINANCIAL STATEMENTS31 December 2015
KENCANA AGRI LIMITED ANNUAL REPORT 201570
11. Income tax (cont’d)
11D. Deferred tax balance in the statement of financial position: (cont’d)
Included in unrecognised tax losses are losses that will expire as follows:
Unrecognised deferred tax assets: Tax lossesUnrecognised
deferred tax assetsExpiring in year 2015
US$’0002014
US$’0002015
US$’0002014
US$’000
Indonesian companies2015 – 426 – 1072016 86 8 21 22017 263 45 66 112018 783 150 196 382019 83 – 21 – 2020 363 – 91 – Singapore companies Unlimited period 8,352 7,090 1,420 1,205
9,930 7,719 1,815 1,363
For the Singapore companies, the realisation of the future income tax benefits from tax loss carryforwards is available for an unlimited future period subject to the conditions imposed by law including the retention of majority shareholders as defined. For the Indonesian companies, the realisation of the future income tax benefits from tax loss carryforwards is available for a period of 5 years subject to the conditions imposed by Indonesian laws.
No deferred tax liability of approximately US$9,425,000 (2014: US$13,430,000) has been recognised for taxes that would be payable on the undistributed earnings of the group’s foreign subsidiaries as the group has determined that these undistributed earnings will not be distributed in the foreseeable future.
12. Items in the statement of profit or loss and other comprehensive income
In addition to the charges and credits disclosed elsewhere in the notes to the financial statements, the profit or loss includes the following charges:
Group2015 2014
US$’000 US$’000Audit fees to independent auditors included under administrative expenses: - company’s auditors 109 105 - other auditors 70 102Other fees to independent auditors included under administrative expenses: - company’s auditors 3 2

NOTES TO THE FINANCIAL STATEMENTS31 December 2015
KENCANA AGRI LIMITED ANNUAL REPORT 201571
13. Loss from discontinued operations, net of tax
In March 2014, 30% of voting shares in a subsidiary Kencana Bio-Energy Pte. Ltd. (“KB”) (the power generation segment) were sold to Enco Ventures (Singapore) Pte. Ltd. (“Enco”), a wholly-owned subsidiary of Enco Holdings Sdn. Bhd. On 21 March 2014 the sale was completed. From this date onwards, control over the joint venture is shared between Enco and the group (Note 19).
The results for the discontinued operation for the period from the beginning of the last reporting year to 21 March 2014, which have been included in the consolidated financial statements, were as follows:
GroupPeriod ended 21/03/2014
US$’000Revenue 113Expenses (468) Loss before tax (355)Income tax – Loss after tax before disposal loss (355)
Loss on disposal of subsidiary – Income tax expense – Loss after tax on disposal – Total loss on discontinued operations (355)
The following table is a summary of the carrying value assets and liabilities of Kencana Bio-Energy Pte. Ltd. that was sold on 21 March 2014:
GroupAt date of disposal in
2014US$’000
Property, plant and equipment 9,366Land use rights 82Deferred tax assets 1,539Inventories 1,356Trade and other receivables, current 1,151Other assets, current 650Other liabilities, non-current (74)Income tax payable (4)Trade and other payables, current (1,213)Non-controlling interest 188Net assets disposed of 13,041Loss on disposal – Total consideration 13,041
Satisfied by:Receivable from joint venture 13,041Loss on disposal –
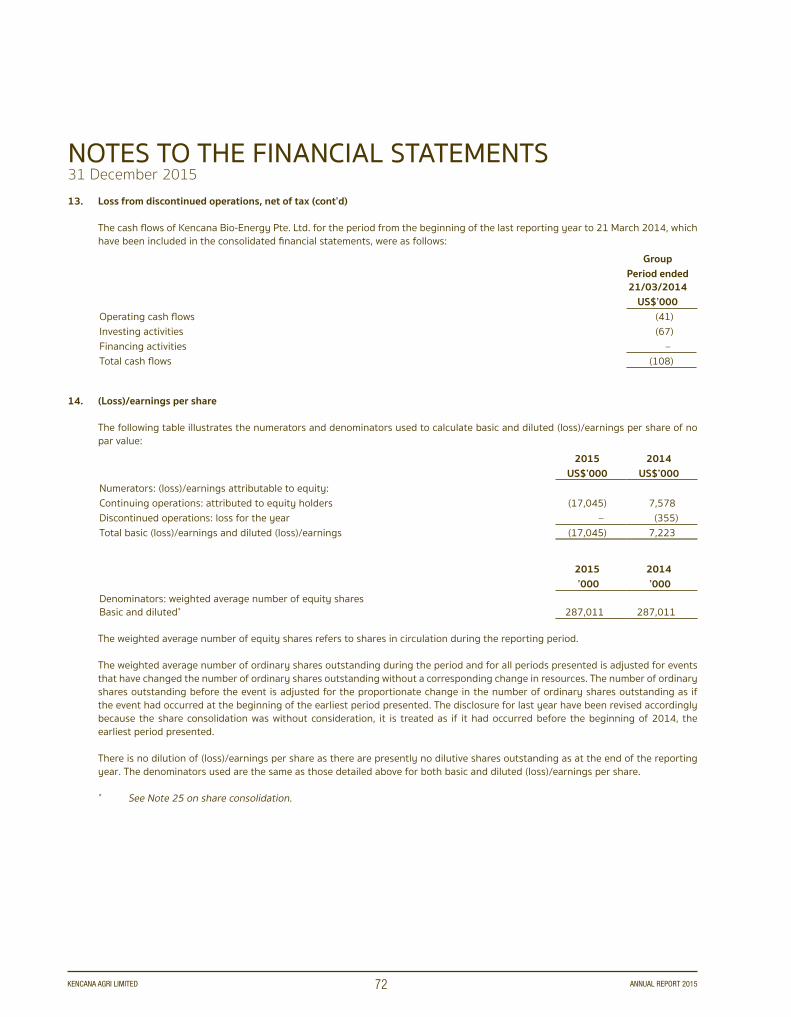
NOTES TO THE FINANCIAL STATEMENTS31 December 2015
KENCANA AGRI LIMITED ANNUAL REPORT 201572
13. Loss from discontinued operations, net of tax (cont’d)
The cash flows of Kencana Bio-Energy Pte. Ltd. for the period from the beginning of the last reporting year to 21 March 2014, which have been included in the consolidated financial statements, were as follows:
GroupPeriod ended 21/03/2014
US$’000Operating cash flows (41)Investing activities (67)Financing activities – Total cash flows (108)
14. (Loss)/earnings per share
The following table illustrates the numerators and denominators used to calculate basic and diluted (loss)/earnings per share of no par value:
2015 2014 US$’000 US$’000
Numerators: (loss)/earnings attributable to equity:Continuing operations: attributed to equity holders (17,045) 7,578Discontinued operations: loss for the year – (355)Total basic (loss)/earnings and diluted (loss)/earnings (17,045) 7,223
2015 2014 ’000 ’000
Denominators: weighted average number of equity sharesBasic and diluted* 287,011 287,011
The weighted average number of equity shares refers to shares in circulation during the reporting period.
The weighted average number of ordinary shares outstanding during the period and for all periods presented is adjusted for events that have changed the number of ordinary shares outstanding without a corresponding change in resources. The number of ordinary shares outstanding before the event is adjusted for the proportionate change in the number of ordinary shares outstanding as if the event had occurred at the beginning of the earliest period presented. The disclosure for last year have been revised accordingly because the share consolidation was without consideration, it is treated as if it had occurred before the beginning of 2014, the earliest period presented.
There is no dilution of (loss)/earnings per share as there are presently no dilutive shares outstanding as at the end of the reporting year. The denominators used are the same as those detailed above for both basic and diluted (loss)/earnings per share.
* See Note 25 on share consolidation.
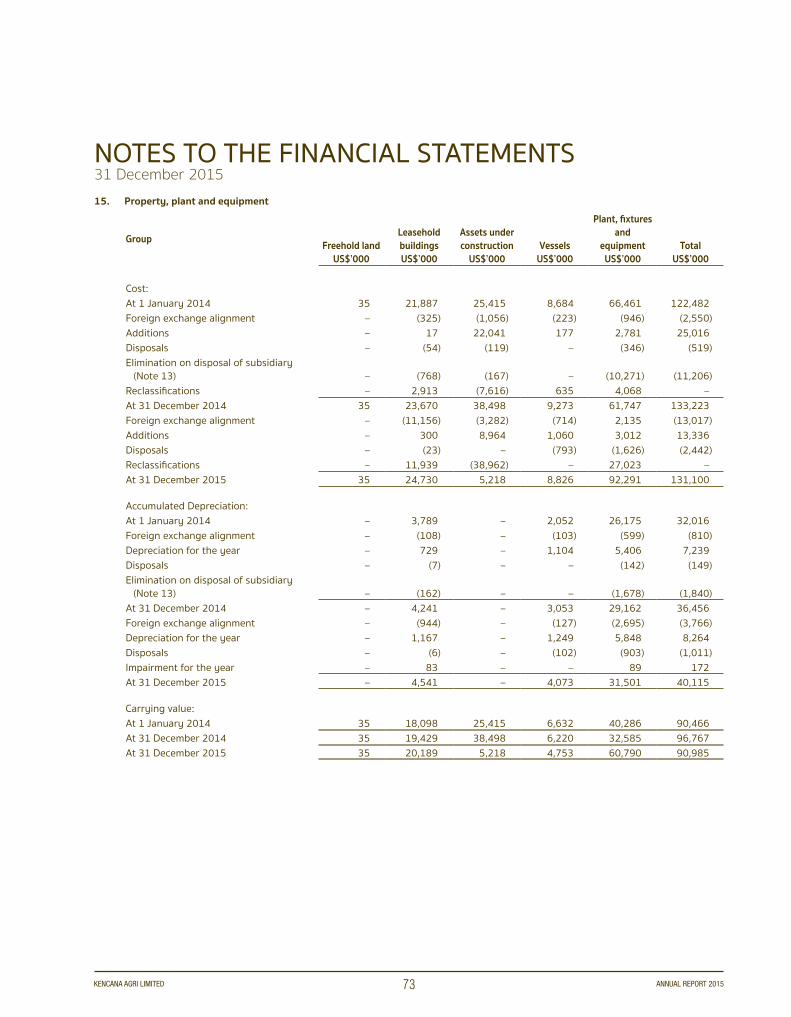
NOTES TO THE FINANCIAL STATEMENTS31 December 2015
KENCANA AGRI LIMITED ANNUAL REPORT 201573
15. Property, plant and equipment
Group Freehold landUS$’000
Leasehold buildingsUS$’000
Assets under construction
US$’000Vessels
US$’000
Plant, fixtures and
equipmentUS$’000
TotalUS$’000
Cost:At 1 January 2014 35 21,887 25,415 8,684 66,461 122,482Foreign exchange alignment – (325) (1,056) (223) (946) (2,550)Additions – 17 22,041 177 2,781 25,016Disposals – (54) (119) – (346) (519)Elimination on disposal of subsidiary
(Note 13) – (768) (167) – (10,271) (11,206)Reclassifications – 2,913 (7,616) 635 4,068 – At 31 December 2014 35 23,670 38,498 9,273 61,747 133,223Foreign exchange alignment – (11,156) (3,282) (714) 2,135 (13,017)Additions – 300 8,964 1,060 3,012 13,336Disposals – (23) – (793) (1,626) (2,442)Reclassifications – 11,939 (38,962) – 27,023 – At 31 December 2015 35 24,730 5,218 8,826 92,291 131,100
Accumulated Depreciation:At 1 January 2014 – 3,789 – 2,052 26,175 32,016Foreign exchange alignment – (108) – (103) (599) (810)Depreciation for the year – 729 – 1,104 5,406 7,239Disposals – (7) – – (142) (149)Elimination on disposal of subsidiary
(Note 13) – (162) – – (1,678) (1,840)At 31 December 2014 – 4,241 – 3,053 29,162 36,456Foreign exchange alignment – (944) – (127) (2,695) (3,766)Depreciation for the year – 1,167 – 1,249 5,848 8,264Disposals – (6) – (102) (903) (1,011)Impairment for the year – 83 – – 89 172At 31 December 2015 – 4,541 – 4,073 31,501 40,115
Carrying value:At 1 January 2014 35 18,098 25,415 6,632 40,286 90,466At 31 December 2014 35 19,429 38,498 6,220 32,585 96,767At 31 December 2015 35 20,189 5,218 4,753 60,790 90,985

NOTES TO THE FINANCIAL STATEMENTS31 December 2015
KENCANA AGRI LIMITED ANNUAL REPORT 201574
15. Property, plant and equipment (cont’d)
Assets under construction represent partial payments for the construction of the following assets:Group
2015 2014 US$’000 US$’000
Leasehold properties 4,725 10,251Plant and equipment 493 28,247
5,218 38,498Allocation of the depreciation expense:Biological assets (Note 17) 1,364 1,402Cost of sales 6,514 5,533Administrative expenses 386 304Total 8,264 7,239
Certain items of property, plant and equipment at a carrying value of US$73,338,000 (2014: US$90,597,000) are pledged as security for the bank facility (see Note 26).
Certain items are under finance lease agreement (see Note 26).
16. Investment property
Group2015 2014
US$’000 US$’000
At cost:At beginning and end of the year 2,526 2,526
Accumulated depreciation:At beginning of the year 66 40Depreciation for the year 30 26At end of the year 96 66
Net book value 2,430 2,460
Fair value for disclosure purposes only:Fair value at end of the year 3,300 2,938
Rental and service income from investment property 82 82
Allocation of depreciation expense:Administrative expenses 30 26
There are no restrictions on the realisability of investment property or the remittance of income and proceeds of disposal.
The investment property is leased out under operating leases. Also see Note 31 on operating lease income commitments. The management has not entered into contractual obligations for the maintenance or enhancement of the investment property.

NOTES TO THE FINANCIAL STATEMENTS31 December 2015
KENCANA AGRI LIMITED ANNUAL REPORT 201575
16. Investment property (cont’d)
The fair value of the investment property was measured in December based on the highest and best use method to reflect the actual market state and circumstances as of the end of the reporting year. The fair value was based on a valuation made by management, on a systematic basis at least once yearly.
There has been no change to the valuation technique during the year. Management determined that the highest and best use of the asset is the current use and that it would provide maximum value to market participants principally through its use in combination with other assets.
For fair value measurements categorised within Level 3 of the fair value hierarchy, a description of the valuation techniques and the significant other observable inputs used in the fair value measurement are as follows:
Asset: Leasehold property at 36 Armenian Street #03-03, Singapore 179934
Gross floor area: 1,527 square feet
Tenure of land: 99 years from 2007
Unexpired lease term: 91 years
Fair value in US$ and fair value hierarchy - Level: US$3,300,000 (2014: US$2,938,000). Level 3 (2014: Level 3).
Valuation technique for recurring fair value measurements:
Comparison with market evidence on recent offer of sale prices for similar properties
Significant observable inputs and range (weighted average):
Price per square foot. US$2,160 (2014: US$1,924)
Relationship of unobservable inputs to fair value: NA
Sensitivity on management’s estimates – 10% variation from estimate
Impact – lower/higher by US$330,000
The investment property is mortgaged as security for the bank facilities (see Note 26).
17. Biological assetsGroup
2015 2014 US$’000 US$’000
Movement in fair value
At beginning of the year 297,169 270,302Additions 8,004 16,256Capitalisation of interest cost 5,615 8,955Capitalisation of depreciation expense (Note 15) 1,364 1,402Foreign currency alignment (29,808) (7,009)Increase in fair value less estimated point-of-sale costs (Note 7) 6,080 7,263At end of the year (Level 3) 288,424 297,169
There was no change in the level during the year. The group’s oil palm plantations are located in Indonesia.

NOTES TO THE FINANCIAL STATEMENTS31 December 2015
KENCANA AGRI LIMITED ANNUAL REPORT 201576
17. Biological assets (cont’d)
The group carries its oil palm plantations at fair value less estimated point-of-sale costs, which require extensive use of accounting estimates and assumptions. Significant components of fair value measurement were determined using assumptions and estimates including determination of future cash flows expected to be generated from the continued use of such assets, average lives of plantations, period of being immature and mature plantations, yield per hectare, annual discount rates and projected selling prices of CPO and CPKO. Any changes in fair values of these plantations would affect the group’s profit and carrying value of the biological assets. It is impracticable to disclose the extent of the possible effects. It is reasonably possible, based on existing knowledge, that outcomes within the next reporting year that are different from assumptions could require a material adjustment to the carrying amount of the balances affected.
Mature oil palm trees produce FFB, which are used to produce CPO and CPKO. The fair value of the biological assets was measured by KJPP Benedictus Darmapuspita dan Rekan, a firm of independent professional valuers on 25 February 2016 based on the present value of the expected net cash flows of the underlying plantations (fair value hierarchy: Level 3). The expected net cash flows of the oil palm plantations are determined using the forecast market price of FFB, which is largely dependent on the historical and projected selling prices of CPO and CPKO in the market. The significant assumptions made in determining the fair values of the oil palm plantations are as follows:
(i) Oil palm trees have an average economic life that ranges from 23 to 25 years (2014: 23 to 25 years), with the first 3 to 4 years (2014: 3 to 4 years) as immature and the remaining years as mature;
(ii) Yield per hectare of oil palm trees is determined by reference to guidelines issued by the Indonesian Oil Palm Research Institute (Pusat Penelitian Kelapa Sawit), which varies with the average age of oil palm trees, the yield ranges from 6 metric tonnes per hectare to 30 metric tonnes per hectare (2014: 6 metric tonnes per hectare to 27 metric tonnes per hectare);
(iii) The discount rate used in 2015 is 14.37% per annum (2014: 13.74% per annum) (such discount rates represent the asset specific rate for the group’s plantation operations which is applied in the discounted future cash flows calculations);
(iv) The projected selling prices of CPO over the projection period are based on World Bank forecasts;
(v) The projected oil extraction rate from FFB and palm kernel are 20.29% (2014: 20.15%) and 4.57% (2014: 4.37%) respectively; and
(vi) No new planting or re-planting activities are assumed.
The fair value of biological assets would be affected by changes in the above assumptions used, particularly the CPO price used.
Relationship of unobservable inputs to fair value:
Favourable or adverse change in discount rate, projected selling price of CPO and FFB extraction rate will increase or decrease fair value.

NOTES TO THE FINANCIAL STATEMENTS31 December 2015
KENCANA AGRI LIMITED ANNUAL REPORT 201577
17. Biological assets (cont’d)
Sensitivity on unobservable inputs:
If the projected selling prices of CPO used in the above valuation increased or decreased by 10%, assuming all other variables are held constant, the group’s profit and the carrying value of biological assets would increase or decrease by approximately US$57,000,000 (2014: US$52,000,000) and US$68,000,000 (2014: US$19,000,000) respectively as a result of higher or lower gains arising from changes in fair value of the biological assets.
If the FFB extraction rate used in the above valuation increased or decreased by 1%, assuming all other variables are held constant, the group’s profit and the carrying value of biological assets would increase or decrease by approximately US$25,000,000 (2014: US$26,000,000) and US$25,000,000 (2014: US$26,000,000) respectively.
If the discount rate used in the above valuation increased or decreased by 1%, assuming all other variables are held constant, the group’s profit and the carrying value of biological assets would decrease or increase by approximately US$12,000,000 (2014: US$8,000,000) and US$13,000,000 (2014: US$9,000,000) respectively.
(a) Analysis of biological assets:
At the end of the reporting year, biological assets comprise oil palm trees as follows:
Group2015 2014
Planted area amounts:- mature (US$’000) 221,296 197,259- immature (US$’000) 67,128 99,910
288,424 297,169Planted area size:- mature (hectares) 36,868 30,407- immature (hectares) 17,326 22,817
54,194 53,224
(b) Analysis of palm oil production:
During the reporting year, the group harvested approximately 596,000 tonnes (2014: 527,000 tonnes) of FFB, which had fair values less estimated point-of-sale costs of US$47,000,000 (2014: US$68,000,000).
(c) At the end of the reporting year, the fair value of biological assets of the group mortgaged as security for bank borrowings amounted to US$281,182,000 (2014: US$286,211,000).
(d) The interest capitalised is the actual interest incurred on the bank borrowings to finance the development of oil palm plantations. The interest rates are disclosed in Note 26.
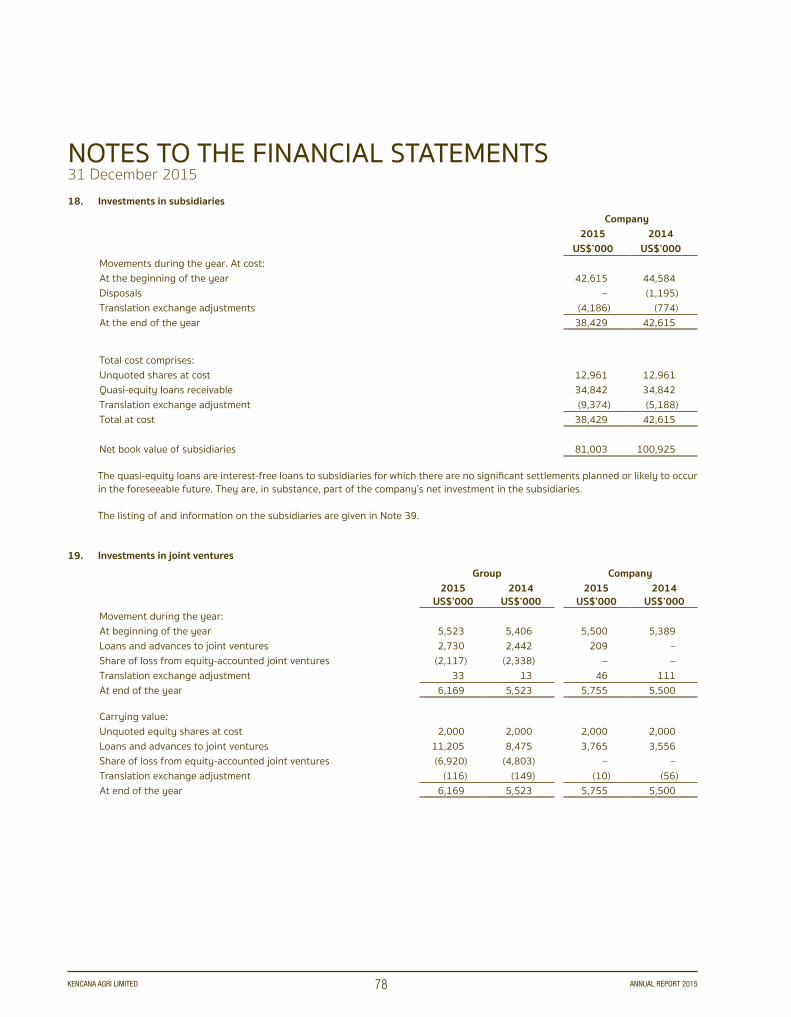
NOTES TO THE FINANCIAL STATEMENTS31 December 2015
KENCANA AGRI LIMITED ANNUAL REPORT 201578
18. Investments in subsidiariesCompany
2015 2014 US$’000 US$’000
Movements during the year. At cost:At the beginning of the year 42,615 44,584Disposals – (1,195)Translation exchange adjustments (4,186) (774)At the end of the year 38,429 42,615
Total cost comprises:Unquoted shares at cost 12,961 12,961Quasi-equity loans receivable 34,842 34,842Translation exchange adjustment (9,374) (5,188)Total at cost 38,429 42,615
Net book value of subsidiaries 81,003 100,925
The quasi-equity loans are interest-free loans to subsidiaries for which there are no significant settlements planned or likely to occur in the foreseeable future. They are, in substance, part of the company’s net investment in the subsidiaries.
The listing of and information on the subsidiaries are given in Note 39.
19. Investments in joint venturesGroup Company
2015US$’000
2014US$’000
2015US$’000
2014US$’000
Movement during the year:At beginning of the year 5,523 5,406 5,500 5,389Loans and advances to joint ventures 2,730 2,442 209 – Share of loss from equity-accounted joint ventures (2,117) (2,338) – – Translation exchange adjustment 33 13 46 111At end of the year 6,169 5,523 5,755 5,500
Carrying value: Unquoted equity shares at cost 2,000 2,000 2,000 2,000Loans and advances to joint ventures 11,205 8,475 3,765 3,556Share of loss from equity-accounted joint ventures (6,920) (4,803) – – Translation exchange adjustment (116) (149) (10) (56)At end of the year 6,169 5,523 5,755 5,500
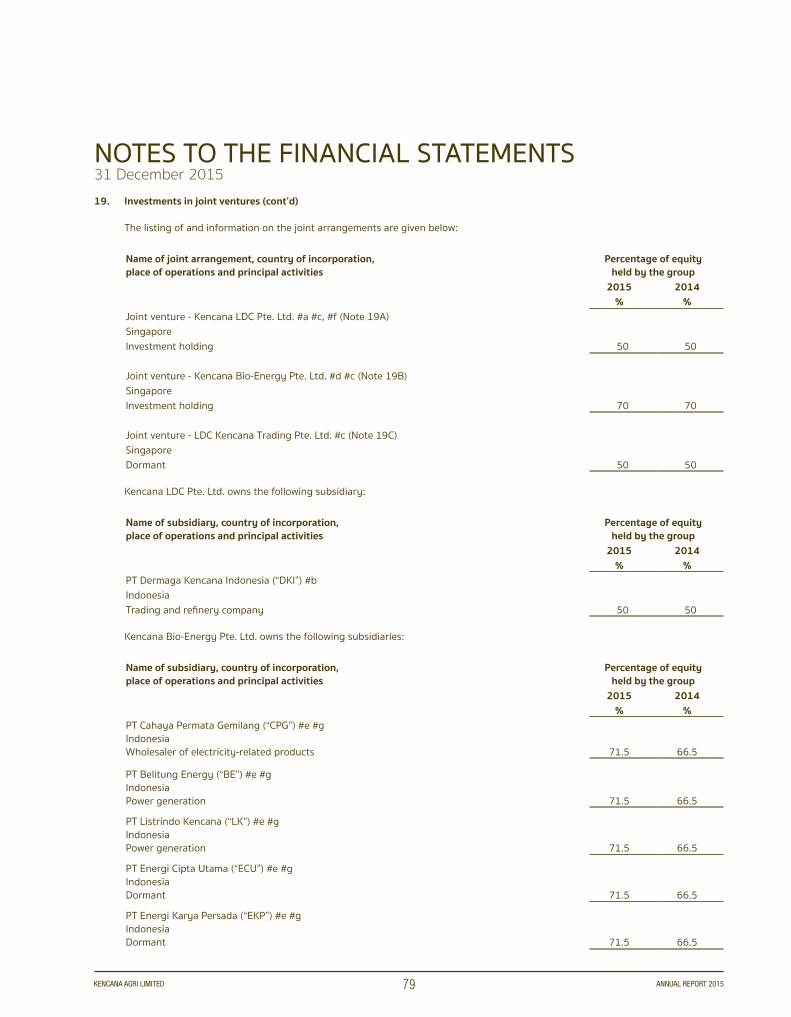
NOTES TO THE FINANCIAL STATEMENTS31 December 2015
KENCANA AGRI LIMITED ANNUAL REPORT 201579
19. Investments in joint ventures (cont’d)
The listing of and information on the joint arrangements are given below:
Name of joint arrangement, country of incorporation,place of operations and principal activities
Percentage of equity held by the group
2015 2014 % %
Joint venture - Kencana LDC Pte. Ltd. #a #c, #f (Note 19A)SingaporeInvestment holding 50 50
Joint venture - Kencana Bio-Energy Pte. Ltd. #d #c (Note 19B)SingaporeInvestment holding 70 70
Joint venture - LDC Kencana Trading Pte. Ltd. #c (Note 19C)SingaporeDormant 50 50
Kencana LDC Pte. Ltd. owns the following subsidiary:
Name of subsidiary, country of incorporation,place of operations and principal activities
Percentage of equity held by the group
2015 2014 % %
PT Dermaga Kencana Indonesia (“DKI”) #bIndonesiaTrading and refinery company 50 50
Kencana Bio-Energy Pte. Ltd. owns the following subsidiaries:
Name of subsidiary, country of incorporation,place of operations and principal activities
Percentage of equity held by the group
2015 2014 % %
PT Cahaya Permata Gemilang (“CPG”) #e #gIndonesia Wholesaler of electricity-related products 71.5 66.5
PT Belitung Energy (“BE”) #e #gIndonesiaPower generation 71.5 66.5
PT Listrindo Kencana (“LK”) #e #gIndonesiaPower generation 71.5 66.5
PT Energi Cipta Utama (“ECU”) #e #gIndonesia Dormant 71.5 66.5
PT Energi Karya Persada (“EKP”) #e #gIndonesiaDormant 71.5 66.5

NOTES TO THE FINANCIAL STATEMENTS31 December 2015
KENCANA AGRI LIMITED ANNUAL REPORT 201580
19. Investments in joint ventures (cont’d)
#a. Kencana LDC Pte. Ltd. is an investment holding company. Its subsidiary, DKI, owns and operates a refinery and a deep water port on a land parcel located at Balikpapan, East Kalimantan, Indonesia.
#b. Other independent auditors. Audited by firms of accountants other than member firms of RSM International of which RSM Chio Lim LLP in Singapore is a member. The name of the firm is Deloitte Indonesia (Osman Bing Satrio & Eny) for the Indonesian entity.
#c. Audited by RSM Chio Lim LLP, a member of RSM International.
#d. Kencana Bio-Energy Pte. Ltd. (“KB”) is an investment holding company. Its subsidiaries PT Belitung Energy (“BE”) and PT Listrindo Kencana (“LK”) own and operate power plants at Belitung and Bangka, Indonesia.
#e. Audited by a member firm of RSM International of which RSM Chio Lim LLP in Singapore is a member. The name of the member firm is RSM AAJ Associates, Jakarta.
#f. Under an agreement between Louis Dreyfus Company Asia Pte. Ltd. (“LDCA”) joint venture partner of the group in PT Dermaga Kencana Indonesia (“DKI”) (a wholly owned subsidiary of joint venture Kencana LDC Pte. Ltd.) and the group, LDCA will purchase 100% of the volume of palm products originating from DKI. A Joint Book Account is maintained to record the trading of DKI’s palm products. The group and LDCA will share the profits or losses arising from this Joint Book Account equally. This agreement, in substance, would extend the operation and trading cycle of DKI. Therefore the share of profit or loss from the Joint Book Account is treated as part of the share of profit or loss from the equity accounted joint venture. The net loss on Joint Book Account included in share of profit or loss from this equity accounted joint venture is US$179,000 (2014: US$408,000).
#g. Included in the percentage equity held by the group is a 5% direct interest in CPG acquired by a wholly owned subsidiary of the company, PT Sawindo Kencana on 31 December 2015. Consequently the company acquired an additional 5% interest in the wholly owned subsidiaries of CPG, which are BE, LK, ECU and EKP.
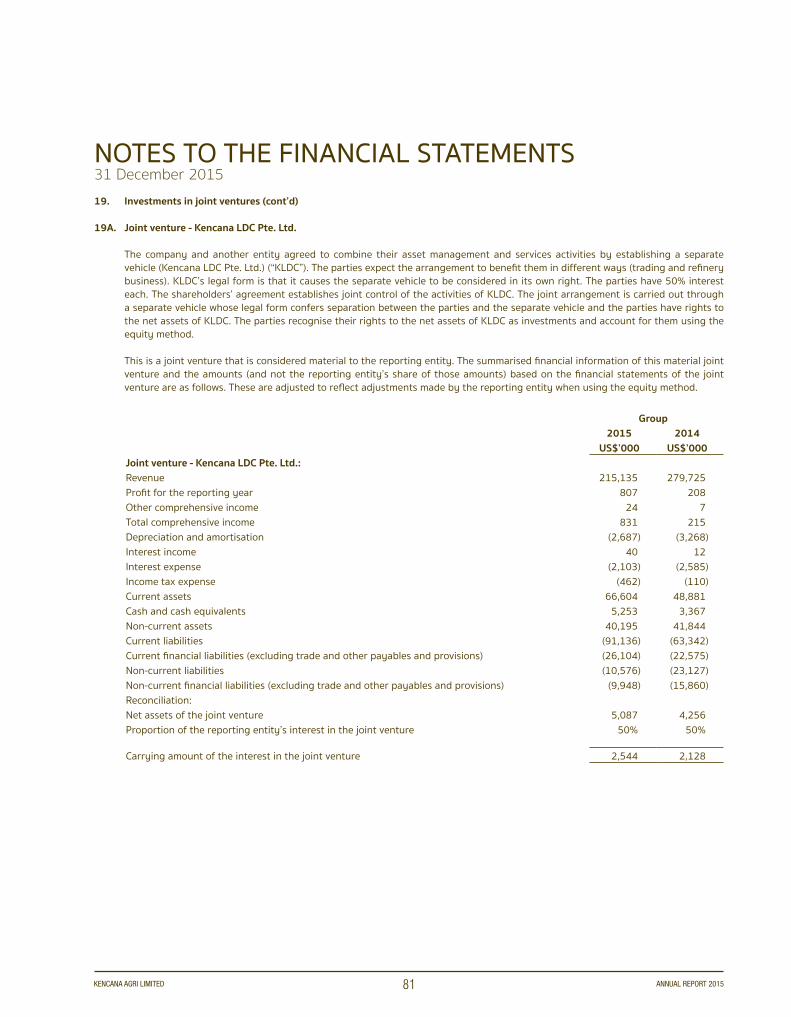
NOTES TO THE FINANCIAL STATEMENTS31 December 2015
KENCANA AGRI LIMITED ANNUAL REPORT 201581
19. Investments in joint ventures (cont’d)
19A. Joint venture - Kencana LDC Pte. Ltd.
The company and another entity agreed to combine their asset management and services activities by establishing a separate vehicle (Kencana LDC Pte. Ltd.) (“KLDC”). The parties expect the arrangement to benefit them in different ways (trading and refinery business). KLDC’s legal form is that it causes the separate vehicle to be considered in its own right. The parties have 50% interest each. The shareholders’ agreement establishes joint control of the activities of KLDC. The joint arrangement is carried out through a separate vehicle whose legal form confers separation between the parties and the separate vehicle and the parties have rights to the net assets of KLDC. The parties recognise their rights to the net assets of KLDC as investments and account for them using the equity method.
This is a joint venture that is considered material to the reporting entity. The summarised financial information of this material joint venture and the amounts (and not the reporting entity’s share of those amounts) based on the financial statements of the joint venture are as follows. These are adjusted to reflect adjustments made by the reporting entity when using the equity method.
Group2015 2014
US$’000 US$’000Joint venture - Kencana LDC Pte. Ltd.:Revenue 215,135 279,725Profit for the reporting year 807 208Other comprehensive income 24 7Total comprehensive income 831 215Depreciation and amortisation (2,687) (3,268)Interest income 40 12Interest expense (2,103) (2,585)Income tax expense (462) (110)Current assets 66,604 48,881Cash and cash equivalents 5,253 3,367Non-current assets 40,195 41,844Current liabilities (91,136) (63,342)Current financial liabilities (excluding trade and other payables and provisions) (26,104) (22,575)Non-current liabilities (10,576) (23,127)Non-current financial liabilities (excluding trade and other payables and provisions) (9,948) (15,860)Reconciliation:Net assets of the joint venture 5,087 4,256Proportion of the reporting entity’s interest in the joint venture 50% 50%
Carrying amount of the interest in the joint venture 2,544 2,128

NOTES TO THE FINANCIAL STATEMENTS31 December 2015
KENCANA AGRI LIMITED ANNUAL REPORT 201582
19. Investments in joint ventures (cont’d)
19B. Joint venture - Kencana Bio-Energy Pte. Ltd.
The company entered into an agreement with Enco Holdings Sdn Bhd, (“Enco”) a company in the business of manufacturing and installation of boiler systems. The investment by Enco was completed on 21 March 2014. Under this arrangement Enco invested MYR15,000,000 (equivalent to US$4,500,000) in the form of equity and convertible loan into Kencana Bio-Energy Pte. Ltd. (“KB”) for a 30% stake in the KB group. The company owns the remaining shares in the KB group (See Note 22A for details of the convertible loan receivable from joint venture).
The shareholders’ agreement establishes joint control of the activities of KB. The joint arrangement is carried out through a separate vehicle whose legal form confers separation between the parties and the separate vehicle and the parties have rights to the net assets of KB. The parties recognise their rights to the net assets of KB as investments and account for them using the equity method.
The shareholders’ agreement provides that in the event of stipulated events of default by the company, the company grants a put option to Enco that requires the company to purchase all the share capital of KB at a price equivalent to (a) the aggregate initial subscription price of the share capital issued (b) plus the cumulative undistributed profits attributable to the share capital issued to Enco or less the cumulative losses attributable to the share capital issued to Enco. In the event of stipulated events of default by Enco, the company has a call option that requires Enco to sell all the investment shares issued to Enco at the same price as stated in (a) and (b) above.
The accounting recognition of these arrangements (financial liability and the corresponding underlying shares as part of its investment in subsidiary) and including the fair value of the put option and the call option at the end of the reporting year were not recognised as their impact is unlikely to be material. The prices at which the options are exercisable are based on the performance of KB. The fair value of the options cannot be reliably measured because (a) the variability in the range of reasonable fair value measurements is significant and (b) the probabilities of the various estimates within the range cannot be reasonably assessed. It is unlikely to be significant.
In addition, KB has granted Enco an option to subscribe for additional shares such that Enco will hold 49% of the share capital of KB on an enlarged basis. The price of the new shares shall be based on the fair value as determined by an independent valuer at the point of exercise of the option. The fair value of the option to subscribe additional shares at the end of the reporting year was not recognised in the books of KB as it was not significant.
This is a joint venture that is considered material to the reporting entity. The summarised financial information of this material joint venture and the amounts (and not the reporting entity’s share of those amounts) based on the financial statements of the joint venture are as follows. These are adjusted to reflect adjustments made by the reporting entity when using the equity method.

NOTES TO THE FINANCIAL STATEMENTS31 December 2015
KENCANA AGRI LIMITED ANNUAL REPORT 201583
19. Investments in joint ventures (cont’d)
19B. Joint venture - Kencana Bio-Energy Pte. Ltd. (cont’d)Group
2015 2014 US$’000 US$’000
Joint venture - Kencana Bio-Energy Pte. Ltd.:Revenue 786 222Loss for the reporting year (3,345) (3,260)Other comprehensive income/(loss) 347 (1)Total comprehensive loss (2,998) (3,261)Depreciation and amortisation (621) (585)Interest income 7 251Interest expense (2,235) (2,130)Income tax income 575 175Current assets 7,024 5,076Cash and cash equivalents 126 325Non-current assets 10,666 10,514Current liabilities (2,094) (851)Current financial liabilities (excluding trade and other payables and provisions) (905) – Non-current liabilities (22,878) (19,023)Non-current financial liabilities (excluding trade and other payables and provisions) (1,589) –Non-controlling interests 444 302Reconciliation:Net liabilities of the joint venture (7,282) (4,284)Proportion of the reporting entity’s interest in the joint venture 70% 70%
Carrying amount of the interest in the joint venture (5,097) (2,999)
Capital commitments for construction of plant, fixtures and equipments 318 3,657
19C. Joint venture - LDC Kencana Trading Pte. Ltd.
This is a joint venture that is considered not material to the reporting entity. The summarised financial information of the non-material joint venture and the aggregate amounts (and not the reporting entity’s share of those amounts) based on the financial statements of the joint venture is as follows. These are adjusted to reflect adjustments made by the reporting entity when using the equity method.
Group2015 2014
US$’000 US$’000Joint venture – LDC Kencana Trading Pte. Ltd.:Loss for the reporting year (5) (7)Total comprehensive loss (5) (7)Current assets 7 3Cash and cash equivalents 7 3Current liabilities (36) (27)Reconciliation:Net liabilities of the joint venture (29) (24)Proportion of the reporting entity’s interest in the joint venture 50% 50%
Carrying amount of the interest in the joint venture (15) (12)

NOTES TO THE FINANCIAL STATEMENTS31 December 2015
KENCANA AGRI LIMITED ANNUAL REPORT 201584
20. Land use rightsGroup
2015 2014 US$’000 US$’000
Cost:At beginning of the year 40,927 36,454Foreign exchange adjustment (4,074) (1,000)Additions 1,837 5,555Elimination on disposal of subsidiary (Note 13) – (82)At end of the year 38,690 40,927
Accumulated amortisation:At beginning of the year (2,541) (1,561)Foreign exchange adjustment 282 94Amortisation for the year included under administrative expenses (1,130) (1,074)At end of the year (3,389) (2,541)
Carrying value:At beginning of the year 38,386 34,893At end of the year 35,301 38,386
Balance to be amortised:Not later than one year 1,132 1,161Later than one year and not later than five years 4,526 4,644Later than five years 29,643 32,581
35,301 38,386
The land rights with a carrying value of US$30,675,000 (2014: US$32,673,000) have been pledged as security for the bank facilities (see Note 26).
At the end of the reporting year the group’s land rights covering a total land area shown below, represent Business Usage Rights (“Hak Guna Usaha” or “HGU”) that have been applied for. Out of these land rights, the certificates for 112,874 hectares were obtained before 31 December 2015 while the land rights certificates covering the remaining area of 9,002 hectares are still in the progress of preparation as at the date of this report. The group has been given a permit to arrange for land clearing for oil palm plantation purposes. The land rights will be amortised once the titles are issued to the group.
The legal terms of the group’s existing certified land rights expire in various years. The details are as follows:-
Land rights Expire in years
23,464 hectares 2028 – 2037
89,410 hectares 2038 – 2040
9,002 hectares Certificates have yet to be received as of the date of this report
121,876 hectares

NOTES TO THE FINANCIAL STATEMENTS31 December 2015
KENCANA AGRI LIMITED ANNUAL REPORT 201585
21. InventoriesGroup
2015 2014 US$’000 US$’000
Raw materials, consumables and supplies 9,313 9,189Finished goods and goods for resale (CPO and CPKO) 1,848 2,540
11,161 11,729
Decrease/(increase) in inventories of finished goods 692 (1,015)Raw materials and consumables used included in cost of sales 18,912 31,802
Inventories with a carrying value of US$10,797,000 (2014: US$9,560,000) are pledged as security for the bank facilities (see Note 26).
22. Trade and other receivablesGroup Company
2015US$’000
2014US$’000
2015US$’000
2014US$’000
Non-currentOther receivables:Advances under Plasma Programme (Note 32) 7,155 3,864 – – Convertible loan receivable from joint venture (Note 22A) 12,365 12,412 – – Net other receivables - Subtotal 19,520 16,276 – – Total other receivables, non-current 19,520 16,276 – –
CurrentTrade receivables:Outside parties 5,927 1,391 – – Less allowance for impairment (900) (900) – – Joint venture (Note 3) 101 215 – – Related parties (Note 3) 120 129 – – Net trade receivables - Subtotal 5,248 835 – –
Other receivables:Subsidiaries (Note 3) – – 21,666 24,908Related parties (Note 3) 1 1 – – Joint venture (Note 3) 152 – – – Staff advances 153 231 – – Prepaid taxes 3,077 3,028 – – VAT receivable 6,377 4,230 – – Advances under Plasma Programme (Note 32) 7,426 7,583 – – Other receivables 407 427 – – Net other receivables - Subtotal 17,593 15,500 21,666 24,908Total trade and other receivables, current 22,841 16,335 21,666 24,908Total trade and other receivables 42,361 32,611 21,666 24,908
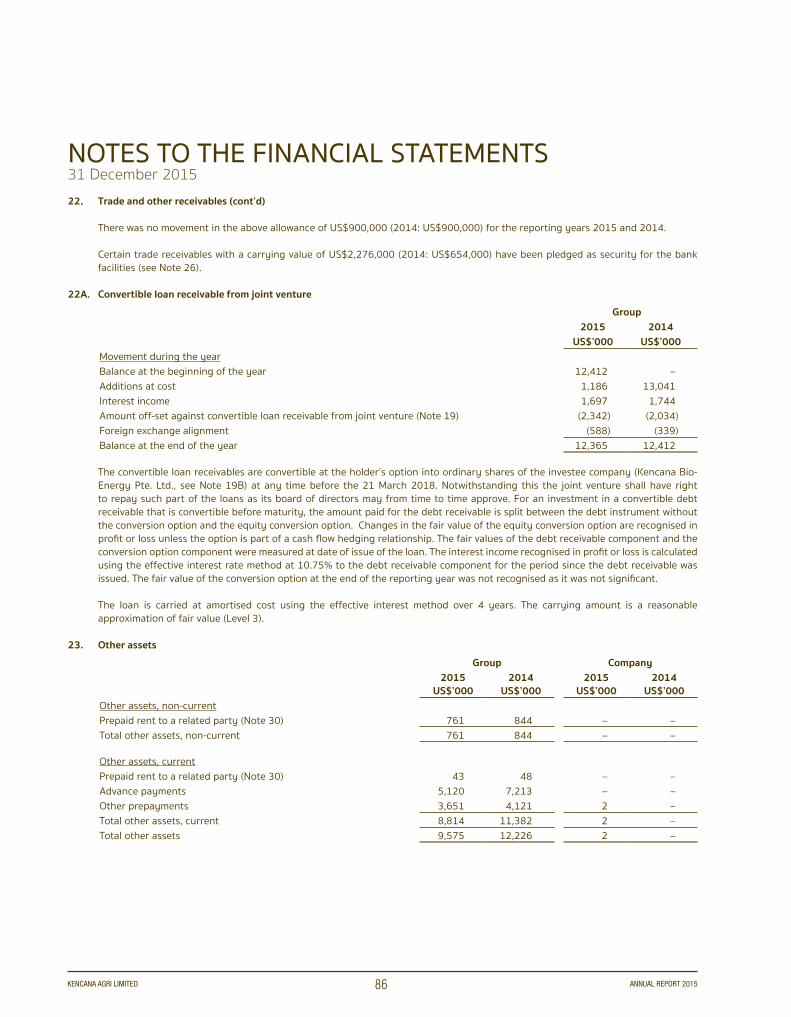
NOTES TO THE FINANCIAL STATEMENTS31 December 2015
KENCANA AGRI LIMITED ANNUAL REPORT 201586
22. Trade and other receivables (cont’d)
There was no movement in the above allowance of US$900,000 (2014: US$900,000) for the reporting years 2015 and 2014.
Certain trade receivables with a carrying value of US$2,276,000 (2014: US$654,000) have been pledged as security for the bank facilities (see Note 26).
22A. Convertible loan receivable from joint ventureGroup
2015 2014 US$’000 US$’000
Movement during the yearBalance at the beginning of the year 12,412 – Additions at cost 1,186 13,041 Interest income 1,697 1,744Amount off-set against convertible loan receivable from joint venture (Note 19) (2,342) (2,034)Foreign exchange alignment (588) (339)Balance at the end of the year 12,365 12,412
The convertible loan receivables are convertible at the holder’s option into ordinary shares of the investee company (Kencana Bio-Energy Pte. Ltd., see Note 19B) at any time before the 21 March 2018. Notwithstanding this the joint venture shall have right to repay such part of the loans as its board of directors may from time to time approve. For an investment in a convertible debt receivable that is convertible before maturity, the amount paid for the debt receivable is split between the debt instrument without the conversion option and the equity conversion option. Changes in the fair value of the equity conversion option are recognised in profit or loss unless the option is part of a cash flow hedging relationship. The fair values of the debt receivable component and the conversion option component were measured at date of issue of the loan. The interest income recognised in profit or loss is calculated using the effective interest rate method at 10.75% to the debt receivable component for the period since the debt receivable was issued. The fair value of the conversion option at the end of the reporting year was not recognised as it was not significant.
The loan is carried at amortised cost using the effective interest method over 4 years. The carrying amount is a reasonable approximation of fair value (Level 3).
23. Other assetsGroup Company
2015US$’000
2014US$’000
2015US$’000
2014US$’000
Other assets, non-currentPrepaid rent to a related party (Note 30) 761 844 – – Total other assets, non-current 761 844 – –
Other assets, currentPrepaid rent to a related party (Note 30) 43 48 – – Advance payments 5,120 7,213 – – Other prepayments 3,651 4,121 2 – Total other assets, current 8,814 11,382 2 – Total other assets 9,575 12,226 2 –

NOTES TO THE FINANCIAL STATEMENTS31 December 2015
KENCANA AGRI LIMITED ANNUAL REPORT 201587
24. Cash and cash equivalentsGroup Company
2015US$’000
2014US$’000
2015US$’000
2014US$’000
Not restricted in use 8,687 14,124 724 952
The interest earning balances are not significant.
24A. Cash and cash equivalents in consolidated statement of cash flows:Group
2015 2014 US$’000 US$’000
Amount as shown above 8,687 14,124Bank overdrafts (Note 26) (491) (389)Cash and cash equivalents for consolidated statement of cash flows purposes at end of the year 8,196 13,735
24B. Non-cash transactions:
There were acquisitions of certain assets under property, plant and equipment with a total cost of US$509,000 (2014: US$670,000) acquired by means of finance leases.
25. Share capitalNumber
of sharesissued
Sharecapital
’000 US$’000Ordinary shares of no par value:Balance at beginning of the year 1 January 2014 1,148,045 93,860Balance at end of the year 31 December 2014 1,148,045 93,860Balance at end of the year 31 December 2015 287,011 93,860
As above 1,148,045 93,860Consolidation of shares – 4 into 1 (861,034) – Balance at end of the year 31 December 2015 287,011 93,860
The ordinary shares of no par value which are fully paid carry no right to fixed income. The company is not subject to any externally imposed capital requirements except as noted below.
Share consolidation - During the reporting year a share consolidation exercise was made to facilitate compliance with the continuing listing requirement imposed by SGX-ST for issuers listed on the SGX Mainboard to have a minimum trading price per share of S$0.20. Under this arrangement every four (4) shares were consolidated into one (1) consolidated share. The share consolidation does not involve the diminution of any liability in respect of any unpaid capital or the payment to any shareholder of any paid-up capital and has no effect on the equity of the company and the subsidiaries.
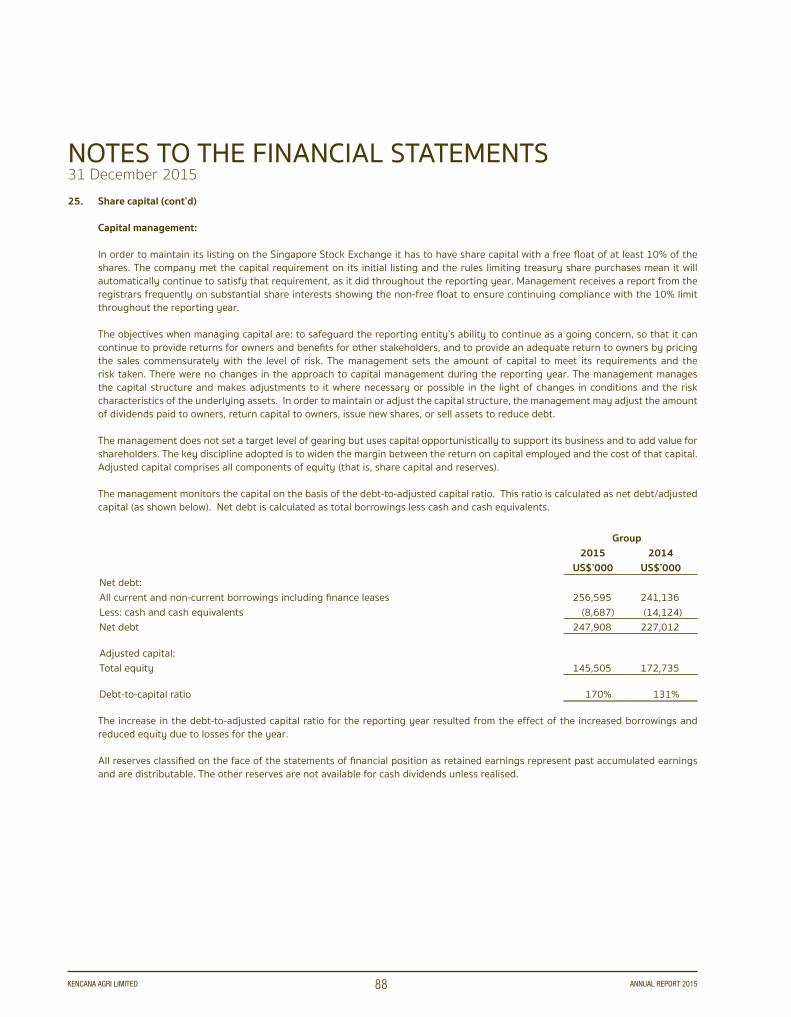
NOTES TO THE FINANCIAL STATEMENTS31 December 2015
KENCANA AGRI LIMITED ANNUAL REPORT 201588
25. Share capital (cont’d)
Capital management:
In order to maintain its listing on the Singapore Stock Exchange it has to have share capital with a free float of at least 10% of the shares. The company met the capital requirement on its initial listing and the rules limiting treasury share purchases mean it will automatically continue to satisfy that requirement, as it did throughout the reporting year. Management receives a report from the registrars frequently on substantial share interests showing the non-free float to ensure continuing compliance with the 10% limit throughout the reporting year.
The objectives when managing capital are: to safeguard the reporting entity’s ability to continue as a going concern, so that it can continue to provide returns for owners and benefits for other stakeholders, and to provide an adequate return to owners by pricing the sales commensurately with the level of risk. The management sets the amount of capital to meet its requirements and the risk taken. There were no changes in the approach to capital management during the reporting year. The management manages the capital structure and makes adjustments to it where necessary or possible in the light of changes in conditions and the risk characteristics of the underlying assets. In order to maintain or adjust the capital structure, the management may adjust the amount of dividends paid to owners, return capital to owners, issue new shares, or sell assets to reduce debt.
The management does not set a target level of gearing but uses capital opportunistically to support its business and to add value for shareholders. The key discipline adopted is to widen the margin between the return on capital employed and the cost of that capital. Adjusted capital comprises all components of equity (that is, share capital and reserves). The management monitors the capital on the basis of the debt-to-adjusted capital ratio. This ratio is calculated as net debt/adjusted capital (as shown below). Net debt is calculated as total borrowings less cash and cash equivalents.
Group2015 2014
US$’000 US$’000Net debt:All current and non-current borrowings including finance leases 256,595 241,136Less: cash and cash equivalents (8,687) (14,124)Net debt 247,908 227,012
Adjusted capital:Total equity 145,505 172,735
Debt-to-capital ratio 170% 131%
The increase in the debt-to-adjusted capital ratio for the reporting year resulted from the effect of the increased borrowings and reduced equity due to losses for the year.
All reserves classified on the face of the statements of financial position as retained earnings represent past accumulated earnings and are distributable. The other reserves are not available for cash dividends unless realised.
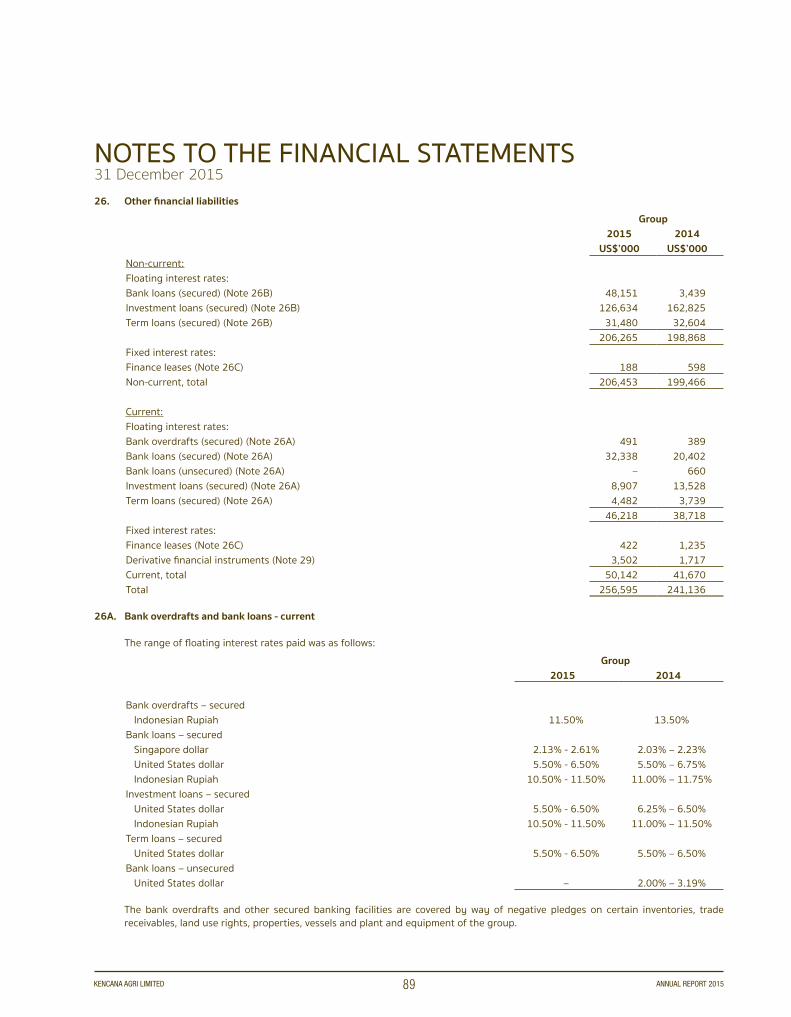
NOTES TO THE FINANCIAL STATEMENTS31 December 2015
KENCANA AGRI LIMITED ANNUAL REPORT 201589
26. Other financial liabilitiesGroup
2015 2014 US$’000 US$’000
Non-current:Floating interest rates:Bank loans (secured) (Note 26B) 48,151 3,439Investment loans (secured) (Note 26B) 126,634 162,825Term loans (secured) (Note 26B) 31,480 32,604
206,265 198,868Fixed interest rates:Finance leases (Note 26C) 188 598Non-current, total 206,453 199,466
Current:Floating interest rates:Bank overdrafts (secured) (Note 26A) 491 389Bank loans (secured) (Note 26A) 32,338 20,402Bank loans (unsecured) (Note 26A) – 660Investment loans (secured) (Note 26A) 8,907 13,528Term loans (secured) (Note 26A) 4,482 3,739
46,218 38,718Fixed interest rates:Finance leases (Note 26C) 422 1,235Derivative financial instruments (Note 29) 3,502 1,717Current, total 50,142 41,670Total 256,595 241,136
26A. Bank overdrafts and bank loans - current
The range of floating interest rates paid was as follows:Group
2015 2014
Bank overdrafts – secured Indonesian Rupiah 11.50% 13.50%Bank loans – secured Singapore dollar 2.13% - 2.61% 2.03% – 2.23% United States dollar 5.50% - 6.50% 5.50% – 6.75% Indonesian Rupiah 10.50% - 11.50% 11.00% – 11.75%Investment loans – secured United States dollar 5.50% - 6.50% 6.25% – 6.50% Indonesian Rupiah 10.50% - 11.50% 11.00% – 11.50%Term loans – secured United States dollar 5.50% - 6.50% 5.50% – 6.50%Bank loans – unsecured United States dollar – 2.00% – 3.19%
The bank overdrafts and other secured banking facilities are covered by way of negative pledges on certain inventories, trade receivables, land use rights, properties, vessels and plant and equipment of the group.
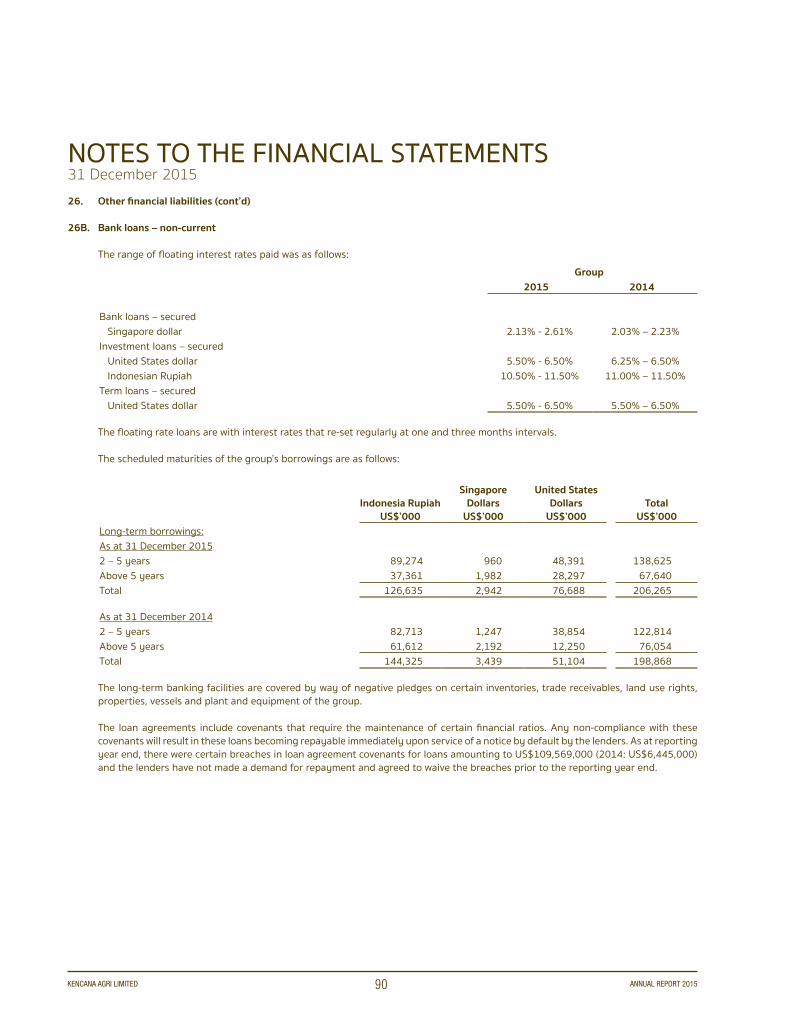
NOTES TO THE FINANCIAL STATEMENTS31 December 2015
KENCANA AGRI LIMITED ANNUAL REPORT 201590
26. Other financial liabilities (cont’d)
26B. Bank loans – non-current
The range of floating interest rates paid was as follows:Group
2015 2014
Bank loans – secured Singapore dollar 2.13% - 2.61% 2.03% – 2.23%Investment loans – secured United States dollar 5.50% - 6.50% 6.25% – 6.50% Indonesian Rupiah 10.50% - 11.50% 11.00% – 11.50%Term loans – secured United States dollar 5.50% - 6.50% 5.50% – 6.50%
The floating rate loans are with interest rates that re-set regularly at one and three months intervals.
The scheduled maturities of the group’s borrowings are as follows:
Indonesia RupiahUS$’000
Singapore Dollars
US$’000
United States Dollars
US$’000Total
US$’000Long-term borrowings:As at 31 December 20152 – 5 years 89,274 960 48,391 138,625Above 5 years 37,361 1,982 28,297 67,640Total 126,635 2,942 76,688 206,265
As at 31 December 20142 – 5 years 82,713 1,247 38,854 122,814Above 5 years 61,612 2,192 12,250 76,054Total 144,325 3,439 51,104 198,868
The long-term banking facilities are covered by way of negative pledges on certain inventories, trade receivables, land use rights, properties, vessels and plant and equipment of the group.
The loan agreements include covenants that require the maintenance of certain financial ratios. Any non-compliance with these covenants will result in these loans becoming repayable immediately upon service of a notice by default by the lenders. As at reporting year end, there were certain breaches in loan agreement covenants for loans amounting to US$109,569,000 (2014: US$6,445,000) and the lenders have not made a demand for repayment and agreed to waive the breaches prior to the reporting year end.

NOTES TO THE FINANCIAL STATEMENTS31 December 2015
KENCANA AGRI LIMITED ANNUAL REPORT 201591
26. Other financial liabilities (cont’d)
26C. Finance leases
Group2015
Minimumpayments
Financecharges
Present value
US$’000 US$’000 US$’000Minimum lease payments payable:Due within one year 461 (39) 422Due within 2 to 5 years 195 (7) 188Total 656 (46) 610
Net book value of plant and equipment under finance leases 1,898
2014 Minimumpayments
Financecharges
Present value
US$’000 US$’000 US$’000Minimum lease payments payable:Due within one year 1,350 (115) 1,235Due within 2 to 5 years 643 (45) 598Total 1,993 (160) 1,833
Net book value of plant and equipment under finance leases 3,606
There are leased assets for certain plant and equipment under finance leases. The average lease term is 3 years. The fixed rate of interest for finance leases is about 6.8% to 14.5% (2014: 7.5% to 15.0%) per year. All leases are on a fixed repayment basis and no arrangements have been entered into for contingent rental payments. The obligations under finance leases are secured by the lessor’s charge over the leased assets.
The fair value (Level 2) is a reasonable approximation of the carrying amount. The fair value of the finance leases was estimated by discounting the future cash flows payable under the terms of the finance leases using the year-end interest rates ranging between 6.8% to 14.5% (2014: 7.5% and 15.0%).
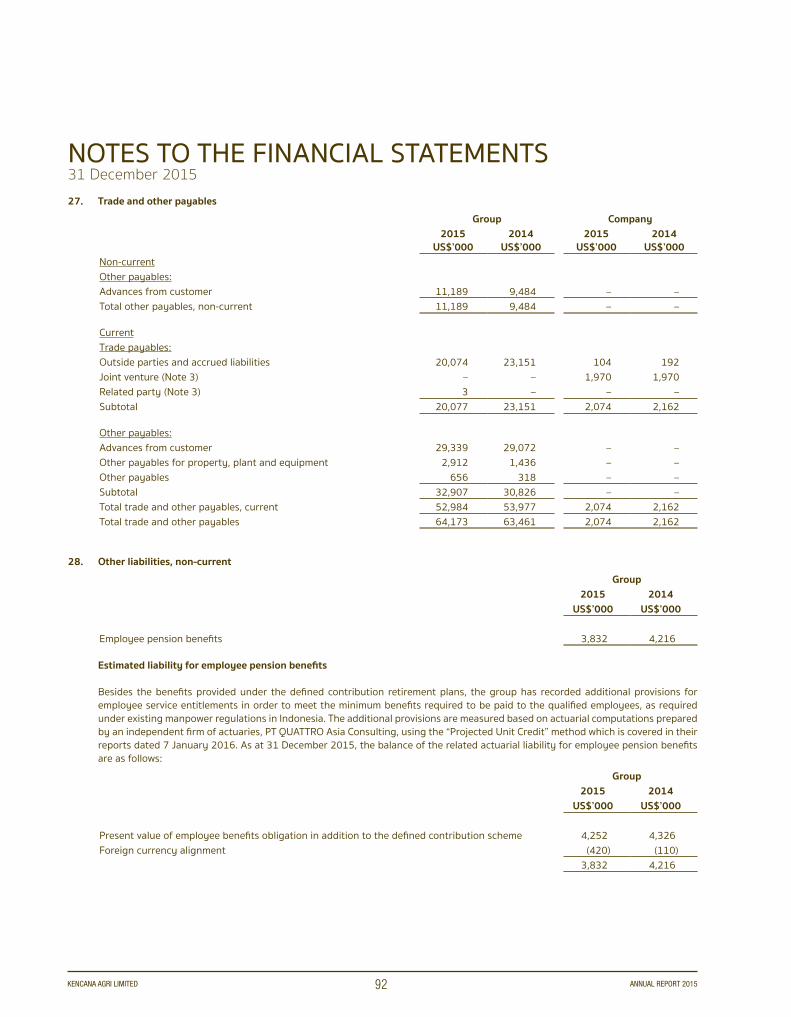
NOTES TO THE FINANCIAL STATEMENTS31 December 2015
KENCANA AGRI LIMITED ANNUAL REPORT 201592
27. Trade and other payablesGroup Company
2015US$’000
2014US$’000
2015US$’000
2014US$’000
Non-currentOther payables:Advances from customer 11,189 9,484 – – Total other payables, non-current 11,189 9,484 – –
CurrentTrade payables:Outside parties and accrued liabilities 20,074 23,151 104 192Joint venture (Note 3) – – 1,970 1,970Related party (Note 3) 3 – – – Subtotal 20,077 23,151 2,074 2,162
Other payables:Advances from customer 29,339 29,072 – –Other payables for property, plant and equipment 2,912 1,436 – – Other payables 656 318 – – Subtotal 32,907 30,826 – – Total trade and other payables, current 52,984 53,977 2,074 2,162Total trade and other payables 64,173 63,461 2,074 2,162
28. Other liabilities, non-currentGroup
2015 2014 US$’000 US$’000
Employee pension benefits 3,832 4,216
Estimated liability for employee pension benefits
Besides the benefits provided under the defined contribution retirement plans, the group has recorded additional provisions for employee service entitlements in order to meet the minimum benefits required to be paid to the qualified employees, as required under existing manpower regulations in Indonesia. The additional provisions are measured based on actuarial computations prepared by an independent firm of actuaries, PT QUATTRO Asia Consulting, using the “Projected Unit Credit” method which is covered in their reports dated 7 January 2016. As at 31 December 2015, the balance of the related actuarial liability for employee pension benefits are as follows:
Group2015 2014
US$’000 US$’000
Present value of employee benefits obligation in addition to the defined contribution scheme 4,252 4,326Foreign currency alignment (420) (110)
3,832 4,216
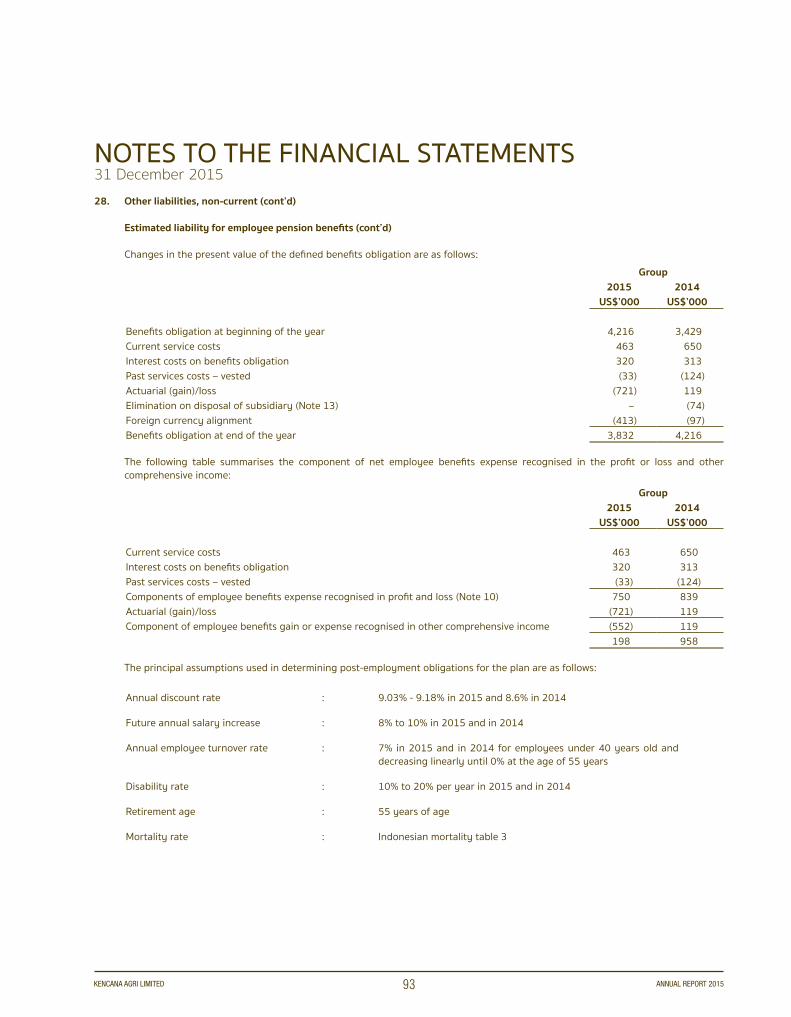
NOTES TO THE FINANCIAL STATEMENTS31 December 2015
KENCANA AGRI LIMITED ANNUAL REPORT 201593
28. Other liabilities, non-current (cont’d)
Estimated liability for employee pension benefits (cont’d)
Changes in the present value of the defined benefits obligation are as follows:Group
2015 2014 US$’000 US$’000
Benefits obligation at beginning of the year 4,216 3,429Current service costs 463 650Interest costs on benefits obligation 320 313Past services costs – vested (33) (124)Actuarial (gain)/loss (721) 119Elimination on disposal of subsidiary (Note 13) – (74)Foreign currency alignment (413) (97)Benefits obligation at end of the year 3,832 4,216
The following table summarises the component of net employee benefits expense recognised in the profit or loss and other comprehensive income:
Group2015 2014
US$’000 US$’000
Current service costs 463 650Interest costs on benefits obligation 320 313Past services costs – vested (33) (124)Components of employee benefits expense recognised in profit and loss (Note 10) 750 839Actuarial (gain)/loss (721) 119Component of employee benefits gain or expense recognised in other comprehensive income (552) 119
198 958
The principal assumptions used in determining post-employment obligations for the plan are as follows:
Annual discount rate : 9.03% - 9.18% in 2015 and 8.6% in 2014
Future annual salary increase : 8% to 10% in 2015 and in 2014
Annual employee turnover rate : 7% in 2015 and in 2014 for employees under 40 years old and decreasing linearly until 0% at the age of 55 years
Disability rate : 10% to 20% per year in 2015 and in 2014
Retirement age : 55 years of age
Mortality rate : Indonesian mortality table 3

NOTES TO THE FINANCIAL STATEMENTS31 December 2015
KENCANA AGRI LIMITED ANNUAL REPORT 201594
28. Other liabilities, non-current (cont’d)
Estimated liability for employee pension benefits (cont’d)
The assumptions relating to longevity used to compute the defined benefit obligation liabilities are based on best estimate of the mortality of plan members both during and after employment based on the published mortality tables commonly used by the actuarial profession in each territory concerned.
For the above significant actuarial assumptions, a sensitivity analysis on the defined benefit obligation has been determined based on reasonably possible changes of the assumption occurring at the end of the reporting year, while holding all other assumptions constant:
GroupDecrease IncreaseUS$’000 US$’000
If the discount rate is 1% higher/lower (225) 259
For the above sensitivity analysis, the present value of the defined benefit obligation has been determined using the projected unit credit method at the end of the reporting year. Such sensitivity analysis might not be representative of the actual change in the defined benefit obligation as it is unlikely that the change in assumptions would occur in isolation of one another.
29. Derivative financial instrumentsGroup
2015 2014 US$’000 US$’000
Liabilities – Derivatives with negative fair values:Cross currency swap contracts (Note 29A) 3,316 1,547Interest rate swap contracts (Note 29B) 186 170Total derivatives 3,502 1,717
Movements during the year were as follows:2015 2014
US$’000 US$’000
Fair value at the beginning of the year (1,717) (696)Additions (236) – Gains on disposal included in other gains 70 618Decrease in fair value included in other losses (2,013) (1,717)Gains recognised in cost of sales 166 78Foreign exchange alignment 228 – Fair value at end of the year (3,502) (1,717)

NOTES TO THE FINANCIAL STATEMENTS31 December 2015
KENCANA AGRI LIMITED ANNUAL REPORT 201595
29. Derivative financial instruments (cont’d)
29A. Forward currency exchange contracts
These include the gross amount of all notional values for contracts that have not yet been settled or cancelled. The amount of notional value outstanding is not necessarily a measure or indication of market risk, as the exposure of certain contracts may be offset by that of other contracts.
Principal Fair ValueReference currency
2015US$’000
2014US$’000
2015US$’000
2014US$’000
Cross currency swaps USD 16,217 21,762 3,316 1,54716,217 21,762 3,316 1,547
Currency derivatives are utilised to hedge significant future transactions and cash flows. The entity is party to a variety of foreign currency forward contracts in the management of its exchange rate exposures. The instruments purchased are primarily denominated in the currencies of the entity’s principal markets. As a matter of principle, the entity does not enter into derivative contracts for speculative purposes.
The fair value of the forward currency contracts is based on the difference between the contractual exchange rate and the market rate at the end of the reporting year. The fair value of the currency derivatives is estimated based on market values of equivalent instruments at the statements of financial position date (Level 2).
There are contractual agreements or currency swaps with other parties to exchange streams of payments over time based on specified notional amounts. The entity pays a specified amount in one currency and receives a specified amount in another currency. The currency swaps for which gross cash flows are exchanged are shown gross. The increases or decreases in the fair values of the foreign currency denominated financial assets and liabilities are partially offset by gains and losses on the economic hedging instruments.
The applied valuation techniques for the currency swaps include forward pricing and swap models, using present value calculations. The models incorporate various inputs including the credit quality of counterparties, foreign exchange spot and forward rates and interest rate curves. For these financial instruments, inputs into models are market observable (Level 2).
29B. Interest rate swap contracts
Interest on the interest rate swaps is calculated on the notional amount of US$30,930,000 (2014: US$34,430,000). They are designed to convert floating rate borrowings to fixed rate exposure for the next five years at 6.50% per year (2014: 6.50%). At the end of the reporting year, the floating interest rate was 5.41% (2014: 6.50%). Information on the maturities of the loans is provided in Note 26.
The interest rate swaps are not traded in an active market. As a result, their fair values are based on valuation techniques currently consistent with generally accepted valuation methodologies for pricing financial instruments, and incorporate all factors and assumptions that knowledgeable, willing market participants would consider in setting the price (Level 2). The valuation technique uses market observable inputs.
The fair value (Level 2) of interest rate swaps is measured at the present value of future cash flows estimated and discounted based on the applicable yield curves derived from quoted interest rates.
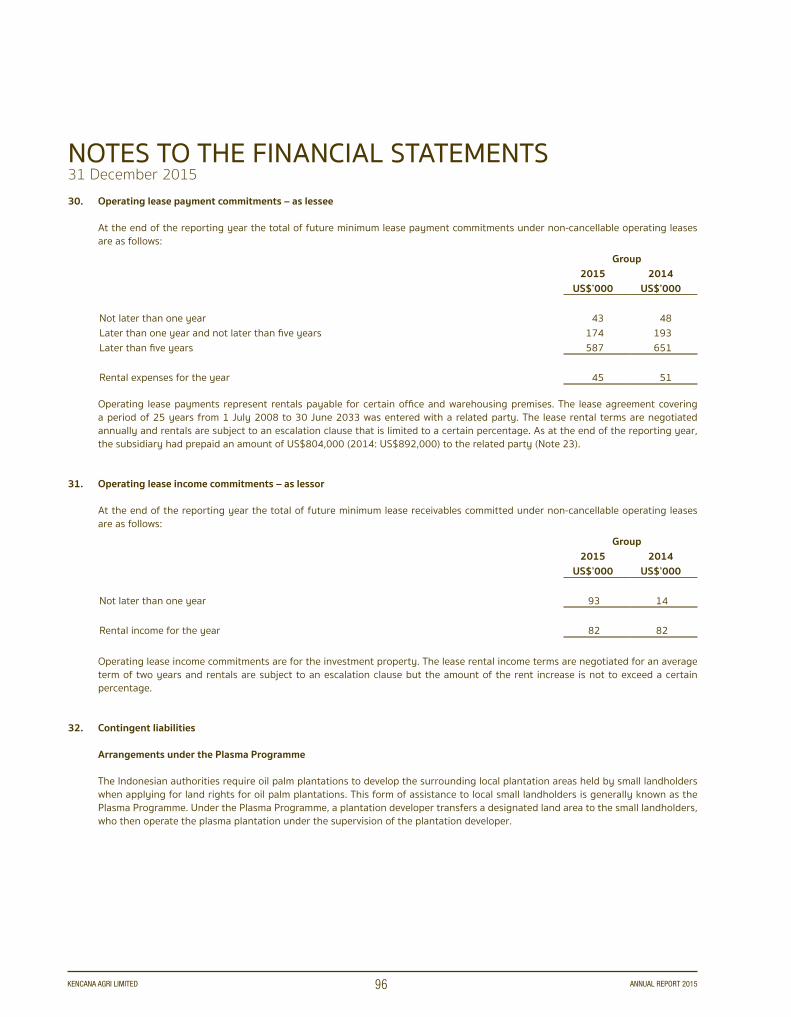
NOTES TO THE FINANCIAL STATEMENTS31 December 2015
KENCANA AGRI LIMITED ANNUAL REPORT 201596
30. Operating lease payment commitments – as lessee
At the end of the reporting year the total of future minimum lease payment commitments under non-cancellable operating leases are as follows:
Group2015 2014
US$’000 US$’000
Not later than one year 43 48Later than one year and not later than five years 174 193Later than five years 587 651
Rental expenses for the year 45 51
Operating lease payments represent rentals payable for certain office and warehousing premises. The lease agreement covering a period of 25 years from 1 July 2008 to 30 June 2033 was entered with a related party. The lease rental terms are negotiated annually and rentals are subject to an escalation clause that is limited to a certain percentage. As at the end of the reporting year, the subsidiary had prepaid an amount of US$804,000 (2014: US$892,000) to the related party (Note 23).
31. Operating lease income commitments – as lessor
At the end of the reporting year the total of future minimum lease receivables committed under non-cancellable operating leases are as follows:
Group2015 2014
US$’000 US$’000
Not later than one year 93 14
Rental income for the year 82 82
Operating lease income commitments are for the investment property. The lease rental income terms are negotiated for an average term of two years and rentals are subject to an escalation clause but the amount of the rent increase is not to exceed a certain percentage.
32. Contingent liabilities
Arrangements under the Plasma Programme
The Indonesian authorities require oil palm plantations to develop the surrounding local plantation areas held by small landholders when applying for land rights for oil palm plantations. This form of assistance to local small landholders is generally known as the Plasma Programme. Under the Plasma Programme, a plantation developer transfers a designated land area to the small landholders, who then operate the plasma plantation under the supervision of the plantation developer.
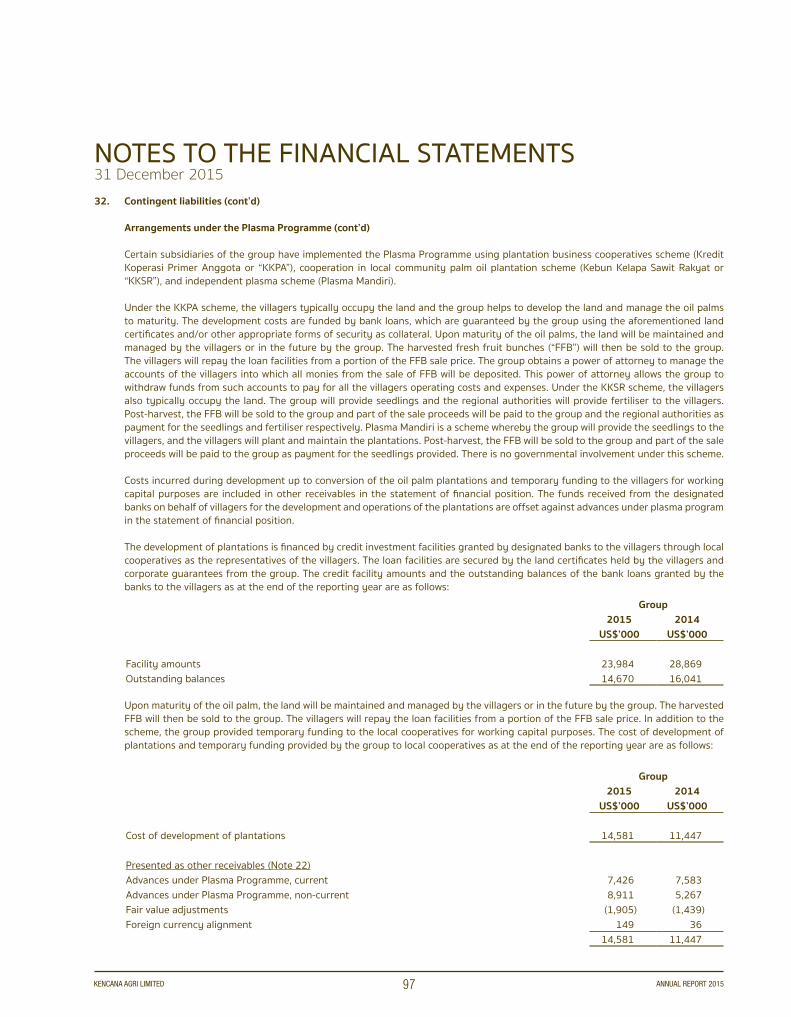
NOTES TO THE FINANCIAL STATEMENTS31 December 2015
KENCANA AGRI LIMITED ANNUAL REPORT 201597
32. Contingent liabilities (cont’d)
Arrangements under the Plasma Programme (cont’d)
Certain subsidiaries of the group have implemented the Plasma Programme using plantation business cooperatives scheme (Kredit Koperasi Primer Anggota or “KKPA”), cooperation in local community palm oil plantation scheme (Kebun Kelapa Sawit Rakyat or “KKSR”), and independent plasma scheme (Plasma Mandiri).
Under the KKPA scheme, the villagers typically occupy the land and the group helps to develop the land and manage the oil palms to maturity. The development costs are funded by bank loans, which are guaranteed by the group using the aforementioned land certificates and/or other appropriate forms of security as collateral. Upon maturity of the oil palms, the land will be maintained and managed by the villagers or in the future by the group. The harvested fresh fruit bunches (“FFB”) will then be sold to the group. The villagers will repay the loan facilities from a portion of the FFB sale price. The group obtains a power of attorney to manage the accounts of the villagers into which all monies from the sale of FFB will be deposited. This power of attorney allows the group to withdraw funds from such accounts to pay for all the villagers operating costs and expenses. Under the KKSR scheme, the villagers also typically occupy the land. The group will provide seedlings and the regional authorities will provide fertiliser to the villagers. Post-harvest, the FFB will be sold to the group and part of the sale proceeds will be paid to the group and the regional authorities as payment for the seedlings and fertiliser respectively. Plasma Mandiri is a scheme whereby the group will provide the seedlings to the villagers, and the villagers will plant and maintain the plantations. Post-harvest, the FFB will be sold to the group and part of the sale proceeds will be paid to the group as payment for the seedlings provided. There is no governmental involvement under this scheme.
Costs incurred during development up to conversion of the oil palm plantations and temporary funding to the villagers for working capital purposes are included in other receivables in the statement of financial position. The funds received from the designated banks on behalf of villagers for the development and operations of the plantations are offset against advances under plasma program in the statement of financial position.
The development of plantations is financed by credit investment facilities granted by designated banks to the villagers through local cooperatives as the representatives of the villagers. The loan facilities are secured by the land certificates held by the villagers and corporate guarantees from the group. The credit facility amounts and the outstanding balances of the bank loans granted by the banks to the villagers as at the end of the reporting year are as follows:
Group2015 2014
US$’000 US$’000
Facility amounts 23,984 28,869Outstanding balances 14,670 16,041
Upon maturity of the oil palm, the land will be maintained and managed by the villagers or in the future by the group. The harvested FFB will then be sold to the group. The villagers will repay the loan facilities from a portion of the FFB sale price. In addition to the scheme, the group provided temporary funding to the local cooperatives for working capital purposes. The cost of development of plantations and temporary funding provided by the group to local cooperatives as at the end of the reporting year are as follows:
Group2015 2014
US$’000 US$’000
Cost of development of plantations 14,581 11,447
Presented as other receivables (Note 22)Advances under Plasma Programme, current 7,426 7,583Advances under Plasma Programme, non-current 8,911 5,267Fair value adjustments (1,905) (1,439)Foreign currency alignment 149 36
14,581 11,447
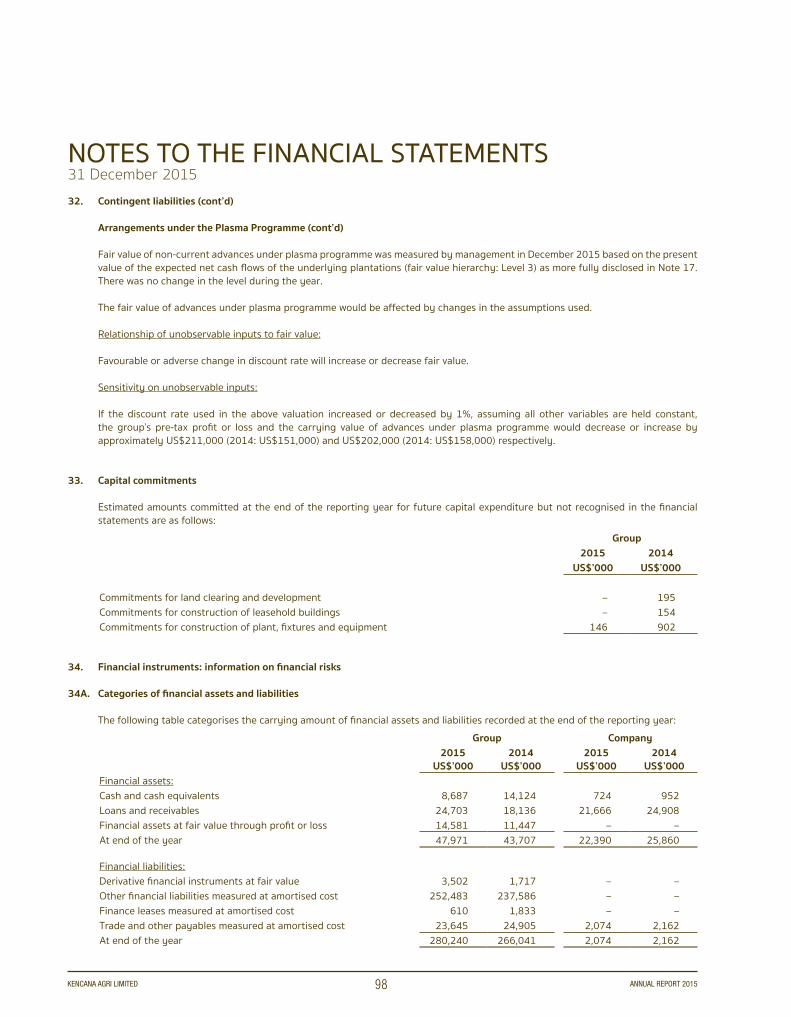
NOTES TO THE FINANCIAL STATEMENTS31 December 2015
KENCANA AGRI LIMITED ANNUAL REPORT 201598
32. Contingent liabilities (cont’d)
Arrangements under the Plasma Programme (cont’d)
Fair value of non-current advances under plasma programme was measured by management in December 2015 based on the present value of the expected net cash flows of the underlying plantations (fair value hierarchy: Level 3) as more fully disclosed in Note 17. There was no change in the level during the year.
The fair value of advances under plasma programme would be affected by changes in the assumptions used.
Relationship of unobservable inputs to fair value:
Favourable or adverse change in discount rate will increase or decrease fair value.
Sensitivity on unobservable inputs:
If the discount rate used in the above valuation increased or decreased by 1%, assuming all other variables are held constant, the group’s pre-tax profit or loss and the carrying value of advances under plasma programme would decrease or increase by approximately US$211,000 (2014: US$151,000) and US$202,000 (2014: US$158,000) respectively.
33. Capital commitments
Estimated amounts committed at the end of the reporting year for future capital expenditure but not recognised in the financial statements are as follows:
Group2015 2014
US$’000 US$’000
Commitments for land clearing and development – 195Commitments for construction of leasehold buildings – 154Commitments for construction of plant, fixtures and equipment 146 902
34. Financial instruments: information on financial risks
34A. Categories of financial assets and liabilities
The following table categorises the carrying amount of financial assets and liabilities recorded at the end of the reporting year:Group Company
2015US$’000
2014US$’000
2015US$’000
2014US$’000
Financial assets:Cash and cash equivalents 8,687 14,124 724 952Loans and receivables 24,703 18,136 21,666 24,908Financial assets at fair value through profit or loss 14,581 11,447 – – At end of the year 47,971 43,707 22,390 25,860
Financial liabilities:Derivative financial instruments at fair value 3,502 1,717 – – Other financial liabilities measured at amortised cost 252,483 237,586 – – Finance leases measured at amortised cost 610 1,833 – – Trade and other payables measured at amortised cost 23,645 24,905 2,074 2,162At end of the year 280,240 266,041 2,074 2,162
NOTES TO THE FINANCIAL STATEMENTS31 December 2015
KENCANA AGRI LIMITED ANNUAL REPORT 201599
34. Financial instruments: information on financial risks (cont’d)
34A. Categories of financial assets and liabilities (cont’d)
Further quantitative disclosures are included throughout these financial statements. Certain disclosures for the company have not been made as the financial assets and financial liabilities are not significant.
34B. Financial risk management
The main purpose for holding or issuing financial instruments is to raise and manage the finances for the entity’s operating, investing and financing activities. There are exposures to the financial risks on the financial instruments such as credit risk, liquidity risk and market risk comprising interest rate, currency risk and price risk exposures. Management has certain practices for the management of financial risks. However these are not formally documented in written form. The guidelines include the following:
1. Minimise interest rate, currency, credit and market risk for all kinds of transactions.2. Maximise the use of “natural hedge”: favouring as much as possible the natural off-setting of sales and costs and payables and
receivables denominated in the same currency and therefore put in place hedging strategies only for the excess balance. The same strategy is pursued with regard to interest rate risk.
3. All financial risk management activities are carried out and monitored by senior management staff.4. All financial risk management activities are carried out following good market practices.5. When appropriate, enter into derivatives or any other similar instruments solely for hedging purposes.
The entity is exposed to currency and interest rate risks. From time to time, there may be borrowings and foreign exchange arrangements or interest rate swap contracts or similar instruments entered into as derivatives against changes in interest rates, cash flows or the fair value of the financial assets and liabilities.
There have been no changes to the exposures to risk; the objectives, policies and processes for managing the risk and the methods used to measure the risk.
The finance director who monitors the procedures reports to the board.
34C. Fair value of financial instruments
The analyses of financial instruments that are measured subsequent to initial recognition at fair value, grouped into Levels 1 to 3 are disclosed in the relevant notes to the financial statements. These include both the significant financial instruments stated at amortised cost and at fair value in the statement of financial position. The carrying values of current financial instruments approximate their fair values due to the short-term maturity of these instruments and the disclosures of fair value are not made when the carrying amount of current financial instruments is a reasonable approximation of the fair value.
34D. Credit risk on financial assets
Financial assets that are potentially subject to concentrations of credit risk and failures by counterparties to discharge their obligations in full or in a timely manner consist principally of cash balances with banks, cash equivalents and receivables. The maximum exposure to credit risk is: the total of the fair value of the financial assets; the maximum amount the entity could have to pay if the guarantee is called on; and the full amount of any loan payable commitments at the end of the reporting year. Credit risk on cash balances with banks and any derivative financial instruments is limited because the counter-parties are entities with acceptable credit ratings. For credit risk on receivables an ongoing credit evaluation is performed on the financial condition of the debtors and a loss from impairment is recognised in profit or loss. The exposure to credit risk with customers is controlled by setting limits on the exposure to individual customers and these are disseminated to the relevant persons concerned and compliance is monitored by management.
Note 24 discloses the maturity of the cash and cash equivalents balances.
As part of the process of setting customer credit limits, different credit terms are used. The average credit period generally granted to trade receivable customers is about 30 days (2014: 30 days). But some customers take a longer period to settle the amounts.

NOTES TO THE FINANCIAL STATEMENTS31 December 2015
KENCANA AGRI LIMITED ANNUAL REPORT 2015100
34. Financial instruments: information on financial risks (cont’d)
34D. Credit risk on financial assets (cont’d)
(a) Aging analysis of the age of trade receivable amounts that are past due as at the end of reporting year but not impaired:
Group2015 2014
US$’000 US$’000Trade receivables:1 to 60 days 5,027 835
(b) Aging analysis as at the end of reporting year of trade receivable amounts that are impaired:Group
2015 2014 US$’000 US$’000
Trade receivables:Over 180 days 900 900
Other receivables are normally with no fixed terms and therefore there is no maturity.
Concentration of trade receivable customers as at the end of the reporting year:Group
2015 2014 US$’000 US$’000
Top 1 customer 1,501 215Top 2 customers 2,756 344
34E. Liquidity risk – financial liability maturity analysis
The following table analyses the non-derivative financial liabilities by remaining contractual maturity (contractual and undiscounted cash flows):
Group Less than1 year
US$’000
1 – 3 years
US$’000
3 – 5 years
US$’000
Over 5 years
US$’000Total
US$’000Non-derivative financial liabilities:2015Gross borrowing commitments 68,274 95,342 100,753 73,497 337,866Gross finance lease commitments 461 195 – – 656Trade and other payables 23,645 – – – 23,645Total 92,380 95,537 100,753 73,497 362,167
2014Gross borrowing commitments 60,996 93,554 92,646 87,512 334,708Gross finance lease commitments 1,350 643 – – 1,993Trade and other payables 24,905 – – – 24,905Total 87,251 94,197 92,646 87,512 361,606
The above balances include undiscounted bank borrowings with fixed and floating interest for the full tenure of the loan and are determined by reference to the conditions existing at the reporting date.
NOTES TO THE FINANCIAL STATEMENTS31 December 2015
KENCANA AGRI LIMITED ANNUAL REPORT 2015101
34. Financial instruments: information on financial risks (cont’d)
34E. Liquidity risk – financial liability maturity analysis (cont’d)
The above amounts disclosed in the maturity analysis are the contractual undiscounted cash flows and such undiscounted cash flows differ from the amount included in the statements of financial position. When the counterparty has a choice of when an amount is paid, the liability is included on the basis of the earliest date on which it can be required to pay. The undiscounted amounts on the bank borrowings with fixed and floating interest rates are determined by reference to the conditions existing at the reporting date.
The following table analyses the derivative financial liabilities by remaining contractual maturity (contractual and undiscounted cash flows):
Group Less than1 year
US$’000
1 – 3 years
US$’000
3 – 5 years
US$’000Total
US$’000Derivative financial liabilities:2015Gross settled:Cross currency swap 7,045 9,172 – 16,217Interest rate swap 246 1,398 366 2,010Total 7,291 10,570 366 18,227
2014Gross settled:Cross currency swap 5,545 10,968 5,249 21,762Interest rate swap 228 587 1,423 2,238Total 5,773 11,555 6,672 24,000
Financial guarantee contracts – For issued financial guarantee contracts the maximum earliest amount of the guarantee is allocated to the earliest period in which the guarantee could be called. At the end of the reporting year no claims on the financial guarantees are expected to be payable. The following table shows the maturity analysis of the contingent liabilities from financial guarantees:
Group Less than1 year
US$’000
1 – 5 years
US$’000
Over 5 years
US$’000Total
US$’0002015Financial guarantees in respect of the Plasma Programme (Note 32) 2,340 8,916 3,414 14,670
2014Financial guarantees in respect of the Plasma Programme (Note 32) 1,360 9,007 5,674 16,041
The liquidity risk refers to the difficulty in meeting obligations associated with financial liabilities that are settled by delivering cash or another financial asset. It is expected that all the liabilities will be settled at their contractual maturity. The average credit period taken to settle trade payables is about 50 days (2014: 50 days). The other payables are with short-term durations. The classification of the financial assets is shown in the statements of financial position as they may be available to meet liquidity needs and no further analysis is deemed necessary.
The fair value of the financial guarantees is not significant.
Bank facilities: Group2015 2014
US$’000 US$’000
Undrawn borrowing facilities 85,288 199,418

NOTES TO THE FINANCIAL STATEMENTS31 December 2015
KENCANA AGRI LIMITED ANNUAL REPORT 2015102
34. Financial instruments: information on financial risks (cont’d)
34E. Liquidity risk – financial liability maturity analysis (cont’d)
The undrawn borrowing facilities are available for operating activities and to settle other commitments. Borrowing facilities are maintained to ensure funds are available for the operations. A schedule showing the maturity of financial liabilities and unused bank facilities is provided regularly to management to assist in monitoring the liquidity risk.
34F. Interest rate risk
The interest rate risk exposure is from changes in fixed rate and floating interest rates and it mainly concerns financial liabilities which are both fixed rate and floating rate. The interest from financial assets including cash balances is not significant. The following table analyses the breakdown of the significant financial instruments (excluding derivatives) by type of interest rate:
Group Company2015
US$’0002014
US$’0002015
US$’0002014
US$’000Financial liabilities with interest:Floating rate 252,483 237,586 – – Fixed rate 610 1,833 – – Total at end of year 253,093 239,419 – –
Financial assets with interest:Floating rate 8,687 14,124 724 952Fixed rate 12,365 12,412 – – Total at end of year 21,052 26,536 724 952
The floating rate debt instruments are with interest rates that are re-set at regular intervals. The interest rates are disclosed in the respective notes.
Sensitivity analysis:Group Company
2015US$’000
2014US$’000
2015US$’000
2014US$’000
Financial assets:A hypothetical variation in interest rates by 100 basis points
with all other variables held constant, would have an increase in pre-tax (loss)/profit for the year by 87 141 7 10
Financial liabilities:A hypothetical variation in interest rates by 100 basis points
with all other variables held constant, would have a decrease in pre-tax (loss)/profit for the year by 2,525 2,376 – –
The analysis has been performed for fixed interest rate and floating interest rate over a year for financial instruments. The impact of a change in interest rates on fixed interest rate financial instruments has been assessed in terms of changing of their fair value. The impact of a change in interest rates on floating interest rate financial instruments has been assessed in terms of changing of their cash flows and therefore in terms of the impact on net expenses. The hypothetical changes in basis points are not based on observable market data (unobservable inputs).
There is an adverse change in interest rates during the current reporting year mainly due to the adverse changes in variable rate borrowing instruments.

NOTES TO THE FINANCIAL STATEMENTS31 December 2015
KENCANA AGRI LIMITED ANNUAL REPORT 2015103
34. Financial instruments: information on financial risks (cont’d)
34G. Foreign currency risks
Analysis of amounts denominated in non-functional currency:
Group US dollars TotalUS$’000 US$’000
2015Financial assets:Cash and cash equivalents 3,708 3,708Trade and other receivables 467 467Total financial assets 4,175 4,175
Financial liabilities:Borrowings (108,917) (108,917)Finance leases (194) (194)Trade and other payables (3,755) (3,755)Total financial liabilities (112,866) (112,866)Net financial liabilities at the end of the year (108,691) (108,691)
2014Financial assets:Cash and cash equivalents 3,609 3,609Trade and other receivables 212 212Total financial assets 3,821 3,821
Financial liabilities:Borrowings (84,602) (84,602)Finance leases (784) (784)Trade and other payables (3,715) (3,715)Total financial liabilities (89,101) (89,101)Net financial liabilities at the end of the year (85,280) (85,280)
Company US dollars TotalUS$’000 US$’000
2015Financial assets:Cash and cash equivalents 605 605
Financial liabilities:Trade and other payables (102) (102)Net financial assets at the end of the year 503 503
2014Financial assets:Cash and cash equivalents 905 905
Financial liabilities:Trade and other payables (186) (186)Net financial assets at the end of the year 719 719
NOTES TO THE FINANCIAL STATEMENTS31 December 2015
KENCANA AGRI LIMITED ANNUAL REPORT 2015104
34. Financial instruments: information on financial risks (cont’d)
34G. Foreign currency risks (cont’d)
There is exposure to foreign currency risk as part of its normal business. In particular, there is significantly exposure to US$ currency risk due to the large value of sales denominated in United States dollars.Sensitivity analysis: Group
2015 2014 US$’000 US$’000
A hypothetical 10% strengthening in the exchange rate of the functional currency against the US$ would have a favourable effect on pre-tax (loss)/profit of 10,869 8,528
Sensitivity analysis: Company2015 2014
US$’000 US$’000
A hypothetical 10% strengthening in the exchange rate of the functional currency against the US$ would have an adverse effect on pre-tax (loss)/profit of (50) (72)
The above table shows sensitivity to a hypothetical 10% variation in the functional currency against the relevant non-functional foreign currencies. The sensitivity rate used is the reasonably possible change in foreign exchange rates. For similar rate weakening of the functional currency against the relevant foreign currencies above, there would be comparable impacts in the opposite direction.
34H. Price risk
The group is exposed to commodity price risk due to certain factors, such as weather, government policy, level of demand and supply in the market and the global economic environment resulting from population growth and changes in standards of living, and global production of similar and competitive crops. During its ordinary course of business, the value of its open sales and purchase commitments and inventory of raw material changes continuously in line with movements in the prices of the underlying commodity. To the extent that its open sales and purchase commitments do not match at the end of each business day, the group will be subject to price fluctuations in the commodities market. Consequently, it is the group’s policy to minimise the risks arising from the fluctuations in the commodity prices by being partly self-sufficient in CPO and CPKO as this provides a hedge against such cost fluctuations. To the extent it is unable to do so, the group may minimise such risks through direct purchases of the similar commodities or through forward purchase and sales contracts. As such, it may also be exposed to commodity price risk as changes in fair value of forward commodity contracts are recognised directly in the statement of profit or loss and other comprehensive income.
Decisions to enter into forward purchase and sales contracts must be approved by at least two directors and are currently under the purview of the group’s chairman and deputy chief executive officer. The group does not enter into forward purchase and sales contracts for speculative purposes.
35. Financial information by segments
35A. Information about reportable segment profit or loss, assets and liabilities
Disclosure of information about operating segments, products and services, the geographical areas, and the major customers are made as required by FRS 108 Operating Segments. This disclosure standard has no impact on the reported results or financial position of the reporting entity. For management purposes the reporting entity is organised into the following major strategic operating segments that offer different products and services: (1) plantation, and (2) logistics & bulking. Such a structural organisation is determined by the nature of risks and returns associated with each business segment and it defines the management structure as well as the internal reporting system. It represents the basis on which the management reports the primary segment information that is available and that is evaluated regularly by the chief operating decision maker in deciding how to allocate resources and in assessing the performance. They are managed separately because each business requires different strategies.
NOTES TO THE FINANCIAL STATEMENTS31 December 2015
KENCANA AGRI LIMITED ANNUAL REPORT 2015105
35. Financial information by segments (cont’d)
35A. Information about reportable segment profit or loss, assets and liabilities (cont’d)
Two or more operating segments may be aggregated into a single operating segment if in the judgement of management the segments have similar economic characteristics, and the segments are similar in some aspects such as the nature of the products and services; production processes; type or class of customer; distribution methods.
The segments and the types of products and services are as follows:
The plantation segment is the group’s main business comprising plantations, palm oil mills, and kernel crushing plants.
The logistics & bulking segment provides support storage facilities and transportation of palm oil products.
Inter-segment sales are measured on the basis that the entity actually used to price the transfers. Internal transfer pricing policies of the reporting entity are as far as practicable based on market prices. The accounting policies of the operating segments are the same as those described in the summary of significant accounting policies.
The discontinued operations relate to the disposal of power generation segment in 2014 (Note 13).
The following tables illustrate the information about the reportable segment profit or loss, assets and liabilities.
35B. Profit or loss from continuing and discontinued operations and reconciliationsGroup 2015
PlantationUS$’000
Logistics & BulkingUS$’000
EliminationUS$’000
TotalUS$’000
Revenue by Segment:Revenue from external customers 128,987 2,857 – 131,844Inter-segment sales 121,169 525 (121,694) –Total revenue 250,156 3,382 (121,694) 131,844Results:Segment results (13,113) (1,873) – (14,986)Other unallocated items (979)Share of results of joint ventures (2,117)Income tax income 1,037Loss, net of tax (17,045)
Group 2014 PlantationUS$’000
Logistics & BulkingUS$’000
EliminationUS$’000
TotalUS$’000
Revenue by Segment:Revenue from external customers 172,350 4,154 – 176,504Inter-segment sales 43,415 569 (43,984) –Total revenue 215,765 4,723 (43,984) 176,504Results:Segment results 20,135 (1,562) – 18,573Other unallocated items (3,072)Share of results of joint ventures (2,338)Income tax expense (5,585)Net profit from continuing operations 7,578Loss from discontinued operations, net of tax (355)Profit, net of tax 7,223
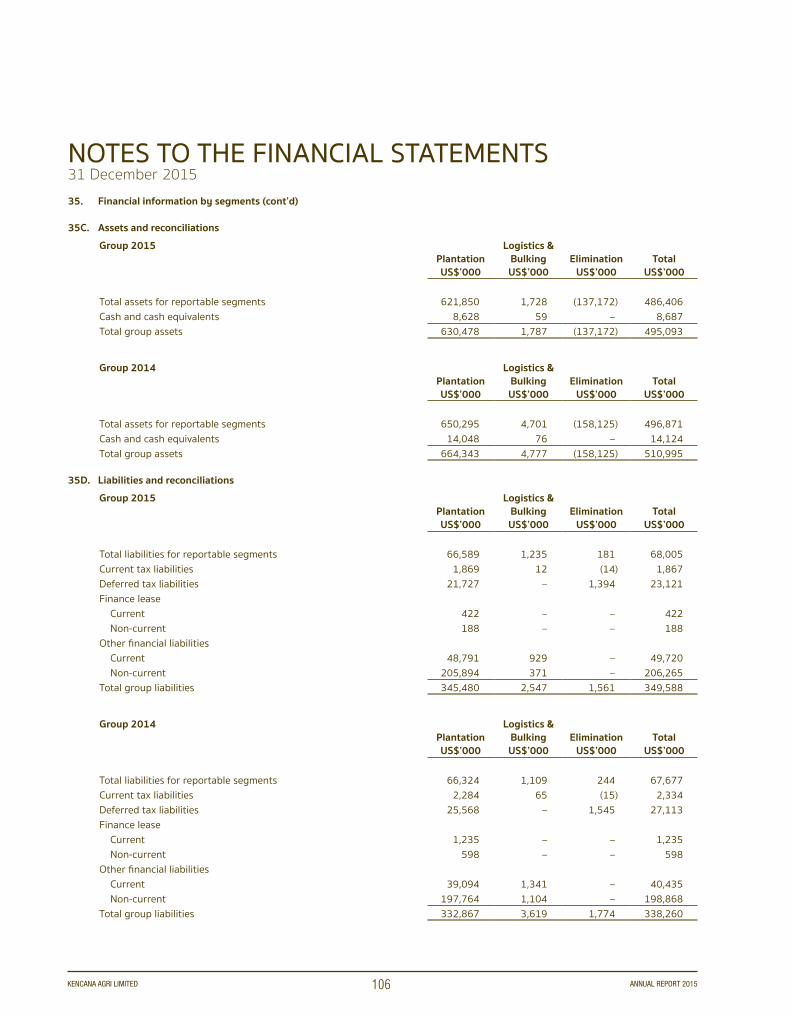
NOTES TO THE FINANCIAL STATEMENTS31 December 2015
KENCANA AGRI LIMITED ANNUAL REPORT 2015106
35. Financial information by segments (cont’d)
35C. Assets and reconciliationsGroup 2015
PlantationUS$’000
Logistics & BulkingUS$’000
EliminationUS$’000
TotalUS$’000
Total assets for reportable segments 621,850 1,728 (137,172) 486,406Cash and cash equivalents 8,628 59 – 8,687Total group assets 630,478 1,787 (137,172) 495,093
Group 2014 PlantationUS$’000
Logistics & BulkingUS$’000
EliminationUS$’000
TotalUS$’000
Total assets for reportable segments 650,295 4,701 (158,125) 496,871Cash and cash equivalents 14,048 76 – 14,124Total group assets 664,343 4,777 (158,125) 510,995
35D. Liabilities and reconciliationsGroup 2015
PlantationUS$’000
Logistics & BulkingUS$’000
EliminationUS$’000
TotalUS$’000
Total liabilities for reportable segments 66,589 1,235 181 68,005Current tax liabilities 1,869 12 (14) 1,867Deferred tax liabilities 21,727 – 1,394 23,121Finance lease Current 422 – – 422 Non-current 188 – – 188Other financial liabilities Current 48,791 929 – 49,720 Non-current 205,894 371 – 206,265Total group liabilities 345,480 2,547 1,561 349,588
Group 2014 PlantationUS$’000
Logistics & BulkingUS$’000
EliminationUS$’000
TotalUS$’000
Total liabilities for reportable segments 66,324 1,109 244 67,677Current tax liabilities 2,284 65 (15) 2,334Deferred tax liabilities 25,568 – 1,545 27,113Finance lease Current 1,235 – – 1,235 Non-current 598 – – 598Other financial liabilities Current 39,094 1,341 – 40,435 Non-current 197,764 1,104 – 198,868Total group liabilities 332,867 3,619 1,774 338,260

NOTES TO THE FINANCIAL STATEMENTS31 December 2015
KENCANA AGRI LIMITED ANNUAL REPORT 2015107
35. Financial information by segments (cont’d)
35E. Other material items and reconciliationsGroup 2015
PlantationUS$’000
Logistics & BulkingUS$’000
EliminationUS$’000
TotalUS$’000
Depreciation and amortisation expense 6,765 1,295 – 8,060Foreign exchange loss, net 16,462 260 – 16,722Loss on forward currency exchange contracts 2,013 – – 2,013Interest expense 21,119 175 (4,640) 16,654Interest income (7,620) (1) 4,640 (2,981)Loss on disposal of property, plant and equipment 16 – – 16Gain on fair value changes in biological assets and other receivables, net (5,614) – – (5,614)
Group 2014 PlantationUS$’000
Logistics & BulkingUS$’000
EliminationUS$’000
TotalUS$’000
Depreciation and amortisation expense 5,791 1,146 – 6,937Foreign exchange loss, net 5,779 73 – 5,852Loss on forward currency exchange contracts 1,717 – – 1,717Interest expense 16,242 304 (4,043) 12,503Interest income (7,067) (1) 4,486 (2,582)Loss on disposal of property, plant and equipment 12 – – 12Gain on fair value changes in biological assets and other receivables, net (6,976) – – (6,976)
35F. Geographical informationRevenue Non-current assets
2015US$’000
2014US$’000
2015US$’000
2014US$’000
Indonesia 101,348 137,507 438,282 452,005Singapore 30,496 38,997 5,308 5,420Total 131,844 176,504 443,590 457,425
Revenues are attributed to countries on the basis of the customer’s location, irrespective of the origin of the goods and services. The non-current assets are analysed by the geographical area in which the assets are located. The non-current assets exclude any financial instruments and deferred tax assets.
36. Changes and adoption of financial reporting standards
For the current reporting year new or revised Singapore Financial Reporting Standards and the related Interpretations to FRS (“INT FRS”) were issued by the Singapore Accounting Standards Council. Those applicable to the reporting entity are listed below. These applicable new or revised standards did not require any modification of the measurement methods or the presentation in the financial statements.
FRS No. TitleFRS 1 Amendments to FRS 1: Disclosure Initiative (early application)Various Improvements to FRSs (Issued in January 2014). Relating to
FRS 108 Operating Segments FRS 113 Fair Value Measurement
Various Improvements to FRSs (Issued in February 2014). Relating to FRS 113 Fair Value Measurement
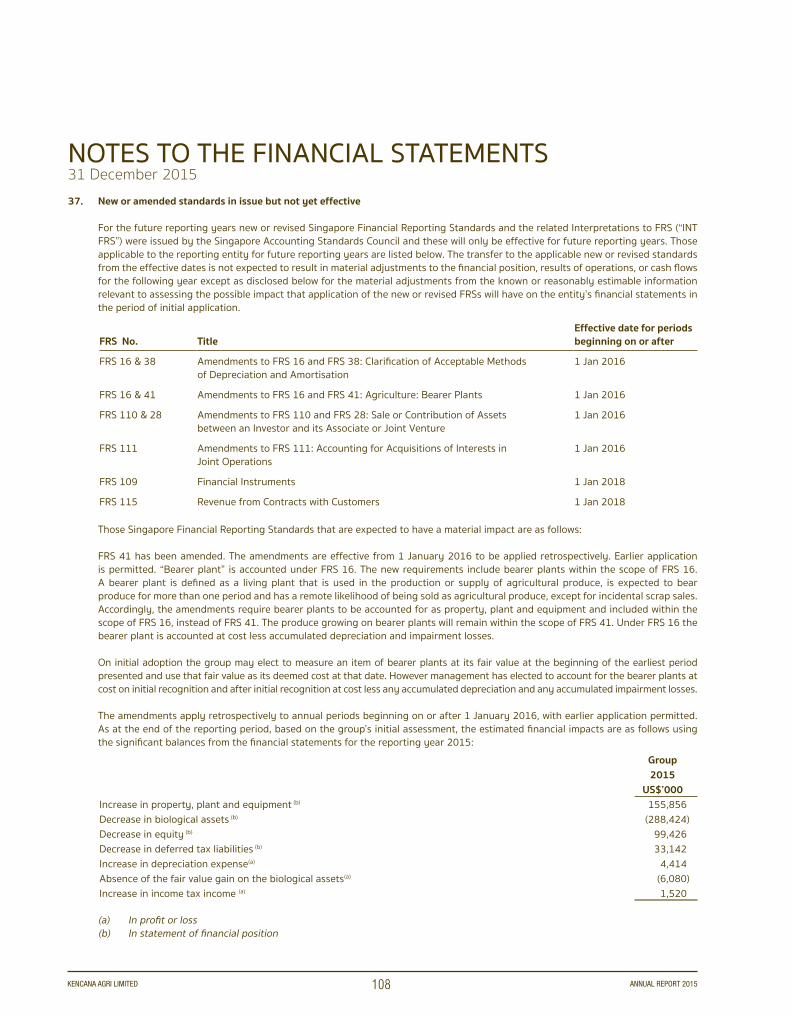
NOTES TO THE FINANCIAL STATEMENTS31 December 2015
KENCANA AGRI LIMITED ANNUAL REPORT 2015108
37. New or amended standards in issue but not yet effective
For the future reporting years new or revised Singapore Financial Reporting Standards and the related Interpretations to FRS (“INT FRS”) were issued by the Singapore Accounting Standards Council and these will only be effective for future reporting years. Those applicable to the reporting entity for future reporting years are listed below. The transfer to the applicable new or revised standards from the effective dates is not expected to result in material adjustments to the financial position, results of operations, or cash flows for the following year except as disclosed below for the material adjustments from the known or reasonably estimable information relevant to assessing the possible impact that application of the new or revised FRSs will have on the entity’s financial statements in the period of initial application.
FRS No. TitleEffective date for periods beginning on or after
FRS 16 & 38 Amendments to FRS 16 and FRS 38: Clarification of Acceptable Methods of Depreciation and Amortisation
1 Jan 2016
FRS 16 & 41 Amendments to FRS 16 and FRS 41: Agriculture: Bearer Plants 1 Jan 2016
FRS 110 & 28 Amendments to FRS 110 and FRS 28: Sale or Contribution of Assets between an Investor and its Associate or Joint Venture
1 Jan 2016
FRS 111 Amendments to FRS 111: Accounting for Acquisitions of Interests in Joint Operations
1 Jan 2016
FRS 109 Financial Instruments 1 Jan 2018
FRS 115 Revenue from Contracts with Customers 1 Jan 2018
Those Singapore Financial Reporting Standards that are expected to have a material impact are as follows:
FRS 41 has been amended. The amendments are effective from 1 January 2016 to be applied retrospectively. Earlier application is permitted. “Bearer plant” is accounted under FRS 16. The new requirements include bearer plants within the scope of FRS 16. A bearer plant is defined as a living plant that is used in the production or supply of agricultural produce, is expected to bear produce for more than one period and has a remote likelihood of being sold as agricultural produce, except for incidental scrap sales. Accordingly, the amendments require bearer plants to be accounted for as property, plant and equipment and included within the scope of FRS 16, instead of FRS 41. The produce growing on bearer plants will remain within the scope of FRS 41. Under FRS 16 the bearer plant is accounted at cost less accumulated depreciation and impairment losses.
On initial adoption the group may elect to measure an item of bearer plants at its fair value at the beginning of the earliest period presented and use that fair value as its deemed cost at that date. However management has elected to account for the bearer plants at cost on initial recognition and after initial recognition at cost less any accumulated depreciation and any accumulated impairment losses.
The amendments apply retrospectively to annual periods beginning on or after 1 January 2016, with earlier application permitted. As at the end of the reporting period, based on the group’s initial assessment, the estimated financial impacts are as follows using the significant balances from the financial statements for the reporting year 2015:
Group2015
US$’000Increase in property, plant and equipment (b) 155,856Decrease in biological assets (b) (288,424)Decrease in equity (b) 99,426Decrease in deferred tax liabilities (b) 33,142Increase in depreciation expense(a) 4,414Absence of the fair value gain on the biological assets(a) (6,080)Increase in income tax income (a) 1,520
(a) In profit or loss(b) In statement of financial position

NOTES TO THE FINANCIAL STATEMENTS31 December 2015
KENCANA AGRI LIMITED ANNUAL REPORT 2015109
38. Re-stated consolidated statement of cash flows of the group for 2013
Under the Financial Reporting Surveillance Programme (FRSP), the Accounting and Corporate Regulatory Authority (ACRA) reviews selected financial statements of companies. The company’s financial statements for 2013 were selected for review by ACRA in 2014. As a result of ACRA’s FRSP, the company was directed by ACRA on 2 September 2015 to restate the consolidated statement of cash flows of the group and re-file the 2013 financial statements.
The consolidated statement of cash flows of the group has been re-stated and replaces the original consolidated statement of cash flows of the group presented in original financial statements for the reporting year ended 31 December 2013. For the information of the members of the company the re-stated statement of cash flows of the group for 2013 is as follows:
Re-stated Consolidated Statement of Cash FlowsYear Ended 31 December 2013 Group
2013 2012US$’000 US$’000
Cash Flows From Operating Activities(Loss)/Profit before Tax (11,988) 24,726Adjustments for:Interest Income (543) (342)Interest Expense 10,448 6,641 Share of Loss/(Profit) of Equity-Accounted Joint Ventures 2,377 (54) Depreciation Expense 5,972 5,608 Amortisation of Land Use Rights 1,185 – Loss/(Gain) on Disposal of Property, Plant and Equipment 28 (6) Gain on Fair Value Changes in Biological Assets (11,662) (18,213)Loss on Fair Value Changes in Other Receivables 673 479 Increase in Provision for Retirement Benefits 831 786 Net Effect of Exchange Rate Changes in Consolidating Entities 13,170 1,021Operating Cash Flows before Changes in Working Capital 10,491 20,646Inventories 5,317 (3,933) Trade and Other Receivables 15,083 3,977Other Financial Assets 910 (910) Other Financial Liabilities 696 – Other Assets (3,589) (3,401)Trade and Other Payables 15,956 (6,635) Net Cash Flows From Operations before Tax 44,864 9,744Income Taxes Paid (3,331) (4,222)Net Cash Flows From Operating Activities 41,533 5,522
Cash Flows From Investing ActivitiesDisposal of Plant and Equipment 7 66Purchase of Property, Plant and Equipment (Note 24B) (19,165) (19,892)Purchase of Investment Property – (2,526)Additions to Biological Assets (24,434) (25,555)Purchase of Land Use Rights (6,857) (13,121)Interest Received 543 342Investments in Joint Ventures (1,000) (1,550)Net Cash Flows Used in Investing Activities (50,906) (62,236)

NOTES TO THE FINANCIAL STATEMENTS31 December 2015
KENCANA AGRI LIMITED ANNUAL REPORT 2015110
38. Re-stated consolidated statement of cash flows of the group for 2013 (cont’d)
Re-stated Consolidated Statement of Cash Flows (cont’d)
Year Ended 31 December 2013 Group2013 2012
US$’000 US$’000Cash Flows From Financing ActivitiesDividends Paid to Equity Owners (1,209) (1,855)Payment from Non-Controlling Interests - 134 Proceeds from Borrowings 152,575 105,186 Repayment of Borrowings (114,974) (46,953)Finance Lease Repayments (2,437) (1,496)Interest Paid (17,519) (14,708)Net Cash Flows From Financing Activities 16,436 40,308
Net Increase/(Decrease) in Cash and Cash Equivalents 7,063 (16,406)Cash and Cash Equivalents, Consolidated Statement of Cash Flows, Beginning Balance 7,145 23,551Cash and Cash Equivalents, Consolidated Statement of Cash Flows, Ending Balance 14,208 7,145
The reclassifications for 2013 were as follows:
After reclassification
US$’000
Before reclassification
US$’000DifferenceUS$’000
Consolidated Statement of Cash Flows:Cash Flows From Operating Activities
Net Effect of Exchange Rate Changes in Consolidating Entities 13,170 (53,701) 66,871Cash Flows From Investing Activities
Net Effect of Exchange Rate Changes in Consolidating Entities – 97,292 (97,292)Cash Flows From Financing Activities
Net Effect of Exchange Rate Changes in Consolidating Entities – (30,421) 30,421

NOTES TO THE FINANCIAL STATEMENTS31 December 2015
KENCANA AGRI LIMITED ANNUAL REPORT 2015111
39. Listing of and information on subsidiaries
#A. The following subsidiaries are wholly owned by the group:
Name of subsidiaries, country of incorporation, place of operations and principal activities (and independent auditor)
Cost in booksof company
2015 2014 US$’000 US$’000
Kencana Logistics Pte. Ltd. (“KL”) (a) 315 315SingaporeInvestment holding
Kencana Plantations Pte. Ltd. (“KP”) (a) 2,043 2,043SingaporeInvestment holding
Sawindo Agri Pte. Ltd. (“SA”) (a) 10,603 10,603SingaporeTrading and investment holding
12,961 12,961
#B. The following subsidiaries are held through the above subsidiaries:
Name of subsidiaries, country of incorporation, place of operations and principal activities (and independent auditor) Global Eastern Capital Pte. Ltd. (“GEC”) (c)
Singapore, Investment holding
PT Agri Eastborneo Kencana (“AEK”) (b) Indonesia, Agribusiness
PT Agro Inti Kencanamas (“AIK”) (b)
Indonesia, Agribusiness
PT Agrojaya Tirta Kencana (“ATK”) (b)
Indonesia, Agribusiness
PT Agro Mas Lestari (“AML”) (b)
Indonesia, Agribusiness
PT Agro Sawit Mas Lestari (“ASML”) (b)
Indonesia, Agribusiness
PT Alamraya Kencana Mas (“AKM”) (b)
Indonesia, Agribusiness
PT Bumi Permai Sentosa (“BPS”) (b)
Indonesia, Wholesaler of shipping-related products
PT Citra Megah Kencana (“CMK”) (b)
Indonesia, Agribusiness and transportation
PT Delta Subur Permai (“DSP”) (b)
Indonesia, Agribusiness
PT Indotrust (“IDT”) (b)
Indonesia, Bulking
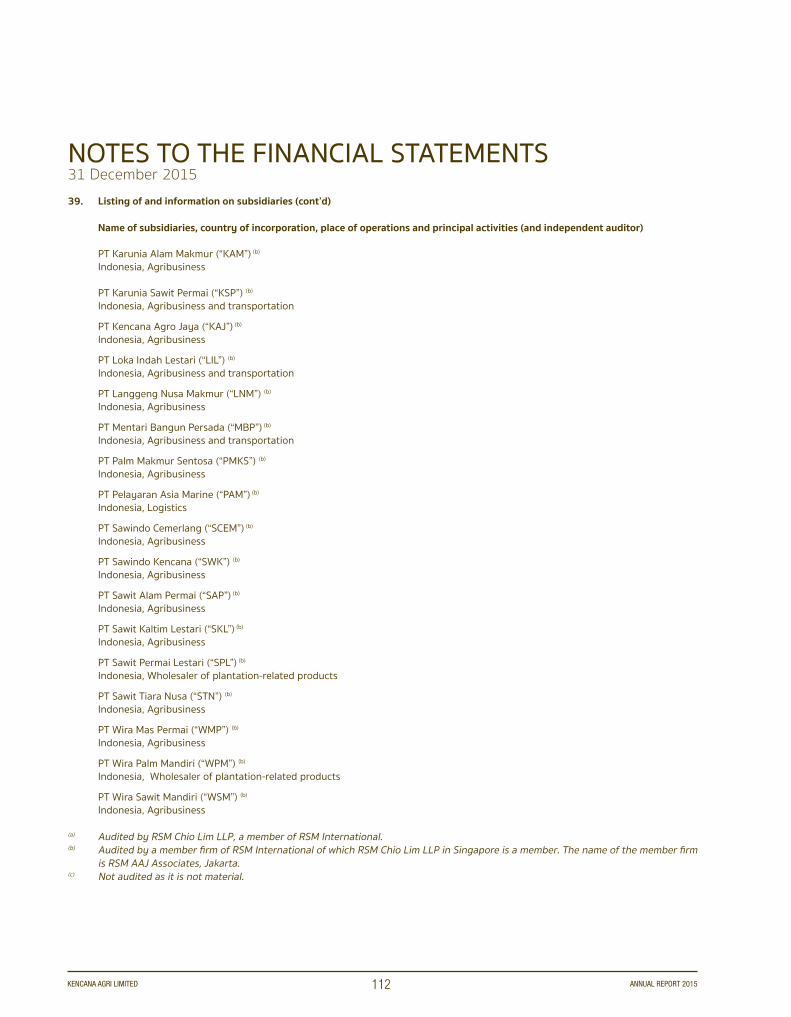
NOTES TO THE FINANCIAL STATEMENTS31 December 2015
KENCANA AGRI LIMITED ANNUAL REPORT 2015112
39. Listing of and information on subsidiaries (cont’d)
Name of subsidiaries, country of incorporation, place of operations and principal activities (and independent auditor)
PT Karunia Alam Makmur (“KAM”) (b)
Indonesia, Agribusiness
PT Karunia Sawit Permai (“KSP”) (b)
Indonesia, Agribusiness and transportation
PT Kencana Agro Jaya (“KAJ”) (b)
Indonesia, Agribusiness
PT Loka Indah Lestari (“LIL”) (b)
Indonesia, Agribusiness and transportation
PT Langgeng Nusa Makmur (“LNM”) (b)
Indonesia, Agribusiness
PT Mentari Bangun Persada (“MBP”) (b)
Indonesia, Agribusiness and transportation
PT Palm Makmur Sentosa (“PMKS”) (b)
Indonesia, Agribusiness
PT Pelayaran Asia Marine (“PAM”) (b)
Indonesia, Logistics
PT Sawindo Cemerlang (“SCEM”) (b)
Indonesia, Agribusiness
PT Sawindo Kencana (“SWK”) (b)
Indonesia, Agribusiness
PT Sawit Alam Permai (“SAP”) (b)
Indonesia, Agribusiness
PT Sawit Kaltim Lestari (“SKL”) (b)
Indonesia, Agribusiness
PT Sawit Permai Lestari (“SPL”) (b)
Indonesia, Wholesaler of plantation-related products
PT Sawit Tiara Nusa (“STN”) (b)
Indonesia, Agribusiness
PT Wira Mas Permai (“WMP”) (b)
Indonesia, Agribusiness
PT Wira Palm Mandiri (“WPM”) (b)
Indonesia, Wholesaler of plantation-related products
PT Wira Sawit Mandiri (“WSM”) (b)
Indonesia, Agribusiness
(a) Audited by RSM Chio Lim LLP, a member of RSM International.(b) Audited by a member firm of RSM International of which RSM Chio Lim LLP in Singapore is a member. The name of the member firm
is RSM AAJ Associates, Jakarta. (c) Not audited as it is not material.

INFORMATION ON SHAREHOLDINGS
KENCANA AGRI LIMITED ANNUAL REPORT 2015113
Issued and fully paid capital : SGD 133,451,118 Number of shares : 287,011,177 Class of shares : ordinary shares Voting rights : one vote per share
DISTRIBUTION OF SHAREHOLDINGS
SIZE OF SHAREHOLDINGS NO. OF SHAREHOLDERS % NO. OF SHARES %
1 - 99 6 0.41 175 0.00
100 - 1,000 175 11.82 105,300 0.04
1,001 - 10,000 915 61.83 3,733,820 1.30
10,001 - 1,000,000 361 24.39 22,504,375 7.84
1,000,001 AND ABOVE 23 1.55 260,667,507 90.82
TOTAL 1,480 100.00 287,011,177 100.00
Shareholding held by the public
Based on the information available to the Company as at 17 March 2016, approximately 21.83% of the issued ordinary shares of the Company is held by the public and, therefore, Rule 723 of the Listing Manual issued by the Singapore Exchange Securities Trading Limited is complied with.
Substantial shareholders
Name of shareholders Direct interest Deemed interest
No. of shares % of shares No. of shares % of shares
Kencana Holdings Pte. Ltd. 152,555,224 53.15 - -
Newbloom Pte. Ltd. 57,402,236 20.00 - -
Wilmar International Limited - - 57,402,236 20.00
Henry Maknawi 1,774,970 0.62 152,555,224 53.15
Notes :- (1) Wilmar International Limited is deemed to be interested in the shares held by Newbloom Pte. Ltd. by virtue of its 100% shareholding
interest in Newbloom Pte. Ltd..
(2) Mr Henry Maknawi is deemed to be interested in the shares held by Kencana Holdings Pte. Ltd. by virtue of his 43.41% shareholding interest in Kencana Holdings Pte. Ltd..
As at 17 March 2016

INFORMATION ON SHAREHOLDINGS
KENCANA AGRI LIMITED ANNUAL REPORT 2015114
TWENTY LARGEST SHAREHOLDERS
NO. NAME NO. OF SHARES %
1 KENCANA HOLDINGS PTE. LTD. 152,555,224 53.15
2 NEWBLOOM PTE. LTD. 57,402,236 20.00
3 CITIBANK NOMINEES SINGAPORE PTE LTD 7,083,250 2.47
4 DBS VICKERS SECURITIES (SINGAPORE) PTE LTD 5,807,690 2.02
5 DBS NOMINEES (PRIVATE) LIMITED 4,006,130 1.40
6 RAFFLES NOMINEES (PTE) LIMITED 3,621,275 1.26
7 MORPH INVESTMENTS LTD 3,542,000 1.23
8 PHILLIP SECURITIES PTE LTD 3,462,750 1.21
9 SUSANTO AMIN @ LIM HWA MIN 2,677,250 0.93
10 SOEKARTO 2,169,380 0.76
11 RHB SECURITIES SINGAPORE PTE. LTD. 2,009,275 0.70
12 HENRY MAKNAWI 1,774,970 0.62
13 HSBC (SINGAPORE) NOMINEES PTE LTD 1,716,750 0.60
14 DICKY PERMANA 1,596,090 0.56
15 OCBC SECURITIES PRIVATE LIMITED 1,529,600 0.53
16 WONG SHAW SENG REGI 1,482,000 0.52
17 SOEPRAPTO KASNAWI ABDUL LATIF 1,436,480 0.50
18 KGI FRASER SECURITIES PTE. LTD. 1,272,750 0.44
19 CIMB SECURITIES (SINGAPORE) PTE. LTD. 1,181,357 0.41
20 ARIFIN @ LIE TJONG TJIN @ LIE CHANG CHIN 1,175,000 0.41
TOTAL 257,501,457 89.72
As at 17 March 2016

KENCANA AGRI LIMITED ANNUAL REPORT 2015115
NOTICE OF ANNUAL GENERAL MEETINGNOTICE IS HEREBY GIVEN That the 2016 Annual General Meeting of the Company will be held at Hotel Fort Canning, 11 Canning Walk, Singapore 178881, Lavender Room 1 on 29 April 2016 at 2:30 p.m. to transact the following businesses:
AS ORDINARY BUSINESS
1. To receive and adopt the Directors’ Statement and Audited Financial Statements of the Company for the year ended 31 December 2015 together with the Auditors’ Report thereon.
Resolution 1
2. To re-elect the following director retiring pursuant to the Company’s Constitution:
Ms Ratna Maknawi (Article 91)
Resolution 2
3. To re-elect the following director retiring pursuant to the Company’s Constitution:
Mr Sim Idrus Munandar (Article 91)
Mr Sim Idrus Munandar shall, upon re-election as Director of the Company, remain as Chairman of the Remuneration Committee, a member of the Audit & Risk Management Committee and a member of the Nominating Committee. Mr Sim Idrus Munandar shall be considered independent for the purpose of Rule 704(8) of the Listing Manual of the Singapore Exchange Securities Trading Limited.
Resolution 3
4. To re-elect the following director retiring pursuant to the Company’s Constitution:
Mr Darwin Indigo (Article 91)
Resolution 4
5. To approve the Directors’ fees of SGD198,000 for the year ended 31 December 2015. Resolution 5
6. To re-appoint RSM Chio Lim LLP as the Auditors for the ensuing year and to authorise the Directors to fix their remuneration.
Resolution 6
AS SPECIAL BUSINESS
To consider and, if thought fit, to pass the following Resolutions as Ordinary Resolutions, with or without amendments:
7. Proposed Share Issue Mandate“That pursuant to Section 161 of the Companies Act, Cap. 50. and Rule 806 of the Listing Manual of the Singapore Exchange Securities Trading Limited (“SGX-ST”), the Directors of the Company be authorized and empowered to:
(a) (i) allot and issue shares in the Company (“shares”) whether by way of rights, bonus or otherwise; and/or
(ii) make or grant offers, agreements or options (collectively, “Instruments”) that might or would require shares to be issued, including but not limited to the creation and issue of (as well as adjustments to) options, warrants, debentures or other instruments convertible into shares,
at any time and upon such terms and conditions and for such purposes and to such persons as the Directors of the Company may in their absolute discretion deem fit; and
(b) (notwithstanding the authority conferred by this Resolution may have ceased to be in force) issue shares in pursuance of any Instrument made or granted by the Directors of the Company while this Resolution was in force,
Resolution 7
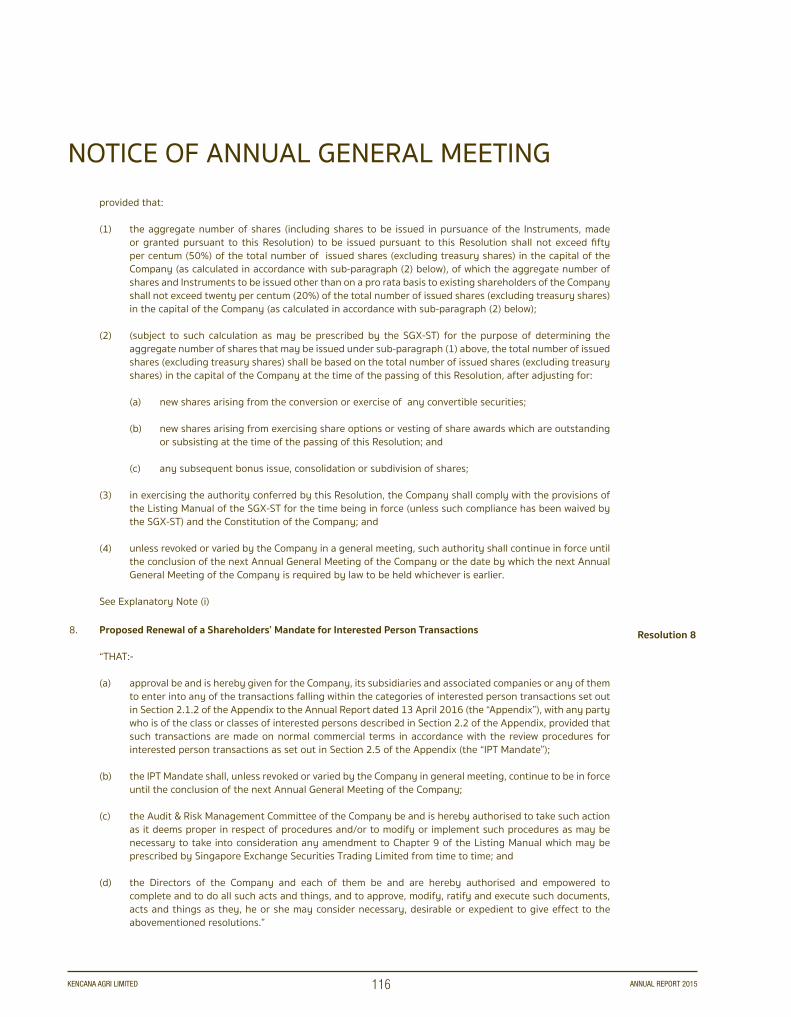
KENCANA AGRI LIMITED ANNUAL REPORT 2015116
NOTICE OF ANNUAL GENERAL MEETINGprovided that:
(1) the aggregate number of shares (including shares to be issued in pursuance of the Instruments, made or granted pursuant to this Resolution) to be issued pursuant to this Resolution shall not exceed fifty per centum (50%) of the total number of issued shares (excluding treasury shares) in the capital of the Company (as calculated in accordance with sub-paragraph (2) below), of which the aggregate number of shares and Instruments to be issued other than on a pro rata basis to existing shareholders of the Company shall not exceed twenty per centum (20%) of the total number of issued shares (excluding treasury shares) in the capital of the Company (as calculated in accordance with sub-paragraph (2) below);
(2) (subject to such calculation as may be prescribed by the SGX-ST) for the purpose of determining the aggregate number of shares that may be issued under sub-paragraph (1) above, the total number of issued shares (excluding treasury shares) shall be based on the total number of issued shares (excluding treasury shares) in the capital of the Company at the time of the passing of this Resolution, after adjusting for:
(a) new shares arising from the conversion or exercise of any convertible securities;
(b) new shares arising from exercising share options or vesting of share awards which are outstanding or subsisting at the time of the passing of this Resolution; and
(c) any subsequent bonus issue, consolidation or subdivision of shares;
(3) in exercising the authority conferred by this Resolution, the Company shall comply with the provisions of the Listing Manual of the SGX-ST for the time being in force (unless such compliance has been waived by the SGX-ST) and the Constitution of the Company; and
(4) unless revoked or varied by the Company in a general meeting, such authority shall continue in force until the conclusion of the next Annual General Meeting of the Company or the date by which the next Annual General Meeting of the Company is required by law to be held whichever is earlier.
See Explanatory Note (i)
8. Proposed Renewal of a Shareholders’ Mandate for Interested Person Transactions “THAT:-
(a) approval be and is hereby given for the Company, its subsidiaries and associated companies or any of them to enter into any of the transactions falling within the categories of interested person transactions set out in Section 2.1.2 of the Appendix to the Annual Report dated 13 April 2016 (the “Appendix”), with any party who is of the class or classes of interested persons described in Section 2.2 of the Appendix, provided that such transactions are made on normal commercial terms in accordance with the review procedures for interested person transactions as set out in Section 2.5 of the Appendix (the “IPT Mandate”);
(b) the IPT Mandate shall, unless revoked or varied by the Company in general meeting, continue to be in force until the conclusion of the next Annual General Meeting of the Company;
(c) the Audit & Risk Management Committee of the Company be and is hereby authorised to take such action as it deems proper in respect of procedures and/or to modify or implement such procedures as may be necessary to take into consideration any amendment to Chapter 9 of the Listing Manual which may be prescribed by Singapore Exchange Securities Trading Limited from time to time; and
(d) the Directors of the Company and each of them be and are hereby authorised and empowered to complete and to do all such acts and things, and to approve, modify, ratify and execute such documents, acts and things as they, he or she may consider necessary, desirable or expedient to give effect to the abovementioned resolutions.”
Resolution 8
KENCANA AGRI LIMITED ANNUAL REPORT 2015117
9. To transact any other business which may be properly transacted at an Annual General Meeting.
Explanatory Note:
(i) The proposed Resolution 7 above, if passed, will empower the Directors of the Company, effective until the conclusion of the next Annual General Meeting of the Company, or the date by which the next Annual General Meeting of the Company is required by law to be held or such authority is varied or revoked by the Company in a general meeting, whichever is the earlier, to issue shares, make or grant instruments convertible into shares and to issue shares pursuant to such instruments, up to a number not exceeding, in total, 50% of the total number of issued shares (excluding treasury shares) in the capital of the Company, of which up to 20% may be issued other than on a pro-rata basis to shareholders.
By Order Of the Board
Phillip Lim Lian TengCompany Secretary
Date : 13 April 2016
NOTICE OF ANNUAL GENERAL MEETING
KENCANA AGRI LIMITED ANNUAL REPORT 2015118
NOTICE OF ANNUAL GENERAL MEETING
Notes :
a) A member entitled to attend and vote at this meeting is entitled to appoint no more than two proxies to attend and vote on his behalf. Where a member appoints more than one proxy, he shall specify the proportion of his shares to be represented by each proxy. A proxy need not be a member of the Company.
b) Pursuant to Section 181 of the Companies Act, Cap. 50 of Singapore, any member who is a relevant intermediary is entitled to appoint one or more proxies to attend and vote at a general meeting. Relevant intermediary is either:
(i) a banking corporation licensed under the Banking Act (Cap. 19) or its wholly-owned subsidiary which provides nominee
services and holds shares in that capacity; (ii) a capital market services license holder which provides custodial services for securities under the Securities and Futures Act
(Cap. 289) and holds in that capacity; or
(iii) the Central Provident Fund (“CPF”) Board established by the Central Provident Fund Act (Cap. 36), in respect of shares purchased on behalf of CPF investors.
c) If a proxy is to be appointed, the form must be deposited at the registered office of the Company at 36 Armenian Street #03-02 Singapore 179934 not less than 48 hours before the meeting.
d) In the case of joint shareholders, all holders must sign the proxy forms.
Personal Data Privacy:
By submitting an instrument appointing a proxy(ies) and/or representatives to attend, speak and vote at the AGM and/or any adjournment thereof, a member of the Company (i) consents to the collection, use and disclosure of the member’s personal data by the Company (or its agents) for the purpose of the processing and administration by the Company (or its agents) of proxies and representatives appointed for the AGM (including any adjournment thereof) and the preparation and compilation of the attendance lists, minutes and other documents relating to the AGM (including any adjournment thereof), and in order for the Company (or its agents) to comply with any applicable laws, listing rules, regulations and/or guidelines (collectively, the “Purposes”), (ii) warrants that where the member discloses the personal data of the member’s proxy(ies) and/or representative(s) to the Company (or its agents), the member has obtained the prior consent of such proxy(ies) and/or representative(s) for the collection, use and disclosure by the Company (or its agents) of the personal data of such proxy(ies) and/or representative(s) for the Purposes, and (iii) agrees that the member will indemnify the Company in respect of any penalties, liabilities, claims, demands, losses and damages as a result of the member’s breach of warranty.

KENCANA AGRI LIMITEDRegistration No. 200717793E(Incorporated in Singapore)
PROXY FORM
I/We NRIC/Passport No./Registration No.
of
being a member(s) of KENCANA AGRI LIMITED (the “Company”), hereby appoint
Name Address NRIC/Passport Number
Proportion of Shareholdings
and/or (delete as appropriate)
Name Address NRIC/Passport Number
Proportion of Shareholdings
as my/our proxy/proxies to attend and to vote for me/us on my/our behalf at the 2016 Annual General Meeting of the Company to be held at Hotel Fort Canning, 11 Canning Walk, Singapore 178881, Lavender Room 1 on 29 April 2016 at 2:30 p.m. and at any adjournment thereof.
(Please indicate with an “X” in the spaces provided whether you wish your vote(s) to be cast for or against the resolutions as set out in the notice of Annual General Meeting. In the absence of specific directions, the proxy/proxies will vote or abstain as he/they may think fit, as he/they will on any other matter arising at the Annual General Meeting.)
No. Resolutions For Against
1 Directors’ Statement and Audited Accounts for the year ended 31 December 2015
2 Re-election of Ms Ratna Maknawi as Director
3 Re-election of Mr Sim Idrus Munandar as Director
4 Re-election of Mr Darwin Indigo as Director
5 Approval of Directors’ fees for the year ended 31 December 2015
6 Re-appointment of RSM Chio Lim LLP as Auditors
7 Proposed Share Issue Mandate
8 Proposed renewal of a Shareholders’ Mandate for Interested Person Transactions
Dated this day of 2016
Total number of Shares held
Signature(s) of member(s) or common seal
IMPORTANT: PLEASE READ NOTES OVERLEAF
IMPORTANT1. A relevant intermediary may appoint more than two proxies to
attend the Annual General Meeting and vote (please see Note 3 for the definition of “relevant intermediary”).
2. For investors who have used their CPF monies to buy shares in the Company, this Proxy Form is not valid for use and shall be ineffective for all intents and purposes if used or is purported to be used by them.
3. Please read the notes to the Proxy Form.

Notes :
1. Please insert the total number of shares held by you. If you have shares entered against your name in the Depository Register (as defined in Section 81SF of the Securities and Futures Act, Cap. 289), you should insert that number of shares. If you have shares registered in your name in the Register of Members, you should insert that number of shares. If you have shares entered against your name in the Depository Register and shares registered in your name in the Register of Members, you should insert the aggregate number of shares. If no number is inserted, this form of proxy will be deemed to relate to all the shares held by you.
2. A member who is not a relevant intermediary is entitled to appoint not more than two proxies to attend, speak and vote on his behalf at the general meeting. Where a member appoints more than one proxy, he shall specify the proportion of his shares to be represented by each such proxy, failing which, the nomination shall be deemed to be alternative.
3. Pursuant to Section 181 of the Companies Act, Cap. 50 of Singapore, any member who is a relevant intermediary is entitled to appoint one or more proxies to attend and vote at the general meeting. Relevant intermediary is either:
(i) a banking corporation licensed under the Banking Act (Cap. 19) or its wholly-owned subsidiary which provides nominee
services and holds shares in that capacity; (ii) a capital market services license holder which provides custodial services for securities under the Securities and Futures Act
(Cap. 289) and holds in that capacity; or
(iii) the Central Provident Fund (“CPF”) Board established by the Central Provident Fund Act (Cap. 36), in respect of shares purchased on behalf of CPF investors.
4. The instrument appointing a proxy or proxies must be deposited at the registered office of the Company at 36 Armenian Street #03-02 Singapore 179934 not later than 48 hours before the time set for the Annual General Meeting.
5. The instrument appointing a proxy or proxies must be under the hand of the appointor or his attorney duly authorised in writing. Where the instrument appointing a proxy or proxies is executed by a corporation, it must be executed under its common seal or signed on its behalf by an attorney duly authorized in writing or by an authorised officer of the corporation.
6. Where an instrument appointing a proxy or proxies is signed on behalf of the appointer by an attorney the letter or power of attorney (or other authority) or a duly certified copy thereof must (failing previous registration with the Company) be lodged with the instrument of proxy, failing which the instrument may be treated as invalid.
7. A corporation which is a member may by resolution of its directors or other governing body authorise such person as it thinks fit to act as its representative at the Annual General Meeting.
8. The Company shall be entitled to reject the instrument appointing a proxy or proxies if it is incomplete, improperly completed or illegible or where the true intentions of the appointor are not ascertainable from the instructions of the appointor specified in the instrument appointing a proxy or proxies. In addition, in the case of members of the Company whose shares are entered against their names in the Depository Register, the Company may reject any instrument appointing a proxy or proxies lodged if such members are not shown to have shares entered against their names in the Depository Register at 72 hours before the time appointed for holding the Annual General Meeting as certified by The Central Depository (Pte) Limited to the Company.
Personal Data Privacy:
By submitting an instrument appointing a proxy(ies) and/or representative(s), the members accepts and agrees to the personal data privacy terms set out in the Notice of Annual General Meeting dated 13 April 2016.
COMPANY SECRETARY
Mr. Phillip Lim Lian Teng
SHARE REGISTRAR AND SHARE TRANSFER AGENT
Boardroom Corporate & AdvisoryServices Pte. Ltd.
AUDITORS
RSM Chio Lim LLPPublic Accountants and Chartered Accountants8 Wilkie Road,#03-08, Wilkie Edge,Singapore 228095
Partner in Charge: Mr. Kaka Singh
INDEPENDENT VALUER (Biological Assets)
KJPP Benedictus Darmapuspita dan RekanProperty & Business Appraisal,Feasibility Study, AdvisoryJalan Musi 38Jakarta 10150, Indonesia
PRINCIPAL BANKERS
PT Bank Negara Indonesia (Persero) Tbk PT Bank Mandiri (Persero) Tbk PT Bank OCBC NISP Tbk
BOARD OF DIRECTORS
Mr. Henry Maknawi Chairman and CEO
Tengku Alwin Aziz Vice Chairman andIndependent Director
Ms. Ratna MaknawiDeputy CEO
Mr. Kent Surya Finance Director
Mr. Soh Yew Hock Lead Independent Director
Mr. Sim Idrus Munandar Independent Director
Mr. Darwin Indigo Non-Executive andNon-Independent Director
AUDIT & RISK MANAGEMENT COMMITTEE
Mr. Soh Yew Hock Chairman
Tengku Alwin Aziz
Mr. Sim Idrus Munandar
REMUNERATION COMMITTEE
Mr. Sim Idrus Munandar Chairman
Tengku Alwin Aziz
Mr. Soh Yew Hock
NOMINATING COMMITTEE
Tengku Alwin Aziz Chairman
Mr. Soh Yew Hock
Mr. Henry Maknawi
COMPANY REGISTRATION NUMBER
Kencana Agri LimitedRegistration Number: 200717793EIncorporated in the Republic of Singapore
REGISTERED OFFICE
36 Armenian Street#03-02Singapore 179934
PRINCIPAL OFFICE
Kencana Tower, 9th FloorBusiness Park Kebon JerukJalan Raya Meruya llir No. 88Jakarta Barat 11620Indonesia
CONTENTS01 Corporate Profile04 Business and Operations 08 Chairman’s Statement 10 Financial and Operational Highlights15 Key Milestones 18 Sustainability and
Corporate Responsibility
22 Board of Directors24 Key Management Team 25 Corporate Governance 40 Financial Contents
PLANTATION
Sawindo Agri Pte. Ltd. Kencana Plantations Pte. Ltd.100% 100%
PT Sawit Permai Lestari PT Wira Palm Mandiri100% 100%
POWERGENERATION
Kencana Bio-Energy Pte. Ltd.70%
PT Cahaya Permata Gemilang71.5%
JOINT VENTUREPARTNERS
• Louis Dreyfus Company
• Enco
BULKING & LOGISTICS
Kencana Logistics Pte. Ltd.100%
PT Bumi Permai Sentosa100%
▼
CORPORATE INFORMATIONCORPORATE STRUCTURE
KENCANA AGRI LIMITEDANNUAL REPORT 2015
SINGAPORE36 Armenian Street
#03-02Singapore 179934
INDONESIAKencana Tower 9th Floor
Business Park Kebon JerukJalan Raya Meruya Ilir No. 88
Jakarta Barat 11620Indonesia
KENCANA AGRI LIMITEDRegistration No. 200717793E
www.kencanaagri.com
KENCANA
AGRI
LIMITED
ANNUAL
REPORT
2015