corporate social responsibility - scc · british waterways in adopting a stretch of local canal....
TRANSCRIPT

Corporate Social Responsibility
Technology Solutions Provider
Full Report 2011
02 Contents
ContentsManaging Director’s Message
Our Commitment to Sustainability and the Environment
- Environmental Management System- Carbon Footprint- The Greenhouse Gas Audit- Scoping the Greenhouse Gas Audit- Total Carbon Footprint for 2010/11- Energy Consumption- Company and staff owned cars- Business Travel- Comparison of Emissions 2008/2009,
2009/2010 and 2010/2011
03
04
Our Commitment to Sustainability- Sustainable Projects within the UK- Sustainable Projects abroad
15
Recycling & Green IT 18
Community Engagement 20
Charity Contribution- British Waterways Canal Adoption Scheme- Police Community Club Internet Safety in
Schools Project
21
Our People- Training on Health and Safety
- Accident Reporting and Performance
24
Engaging the Workforce 26
SCC | Corporate Social Responsibility Report 2011
21
15
04
26
03 Managing Director’s Message
I stated last year, within our 2010 Report, that as a privately owned business our culture is focused on “putting back” and that we take proactive action
on climate change and our links within our local communities.
We are fully committed in becoming an integral and influential participant in society and fully understand the vital role we play in shaping the world around us.
We have a long history of supporting the communities directly touched by our services and believe that building and maintaining relationships of trust is vital to the sustainable future of our business. Moreover, volunteering has been an important part of our CSR strategy in 2011.
Our Executive Board endorsed a revitalised ‘Charitable Donations, Volunteering and Fundraising Policy’ in January. We started by working with the staff of British Waterways in adopting a stretch of local canal. This scheme encourages employees to help maintain the canal so that members of the local community can make best use of it and the surrounding area. This was quickly followed by our work with the Police Community Clubs in sponsoring the ‘SCC
Internet Safety Project Award’ by distributing a series of books to 100 schools nationwide.
We also continue to perform well in other key areas of corporate responsibility. Our work in support of our ‘Building a Better Workplace Policy’ made enormous strides last year.
We continue to support the wellbeing of our employees through various initiatives including diet and nutritional advice through our ‘Energy and Productivity Programme’, facilitated by Distance Dieters, and a better health programme through the introduction of a ‘Cycle to Work Scheme’.
Our guarantees to implement carbon neutrality via the Gold Standard stove building project in Kenya have brought enormous benefits to local communities and individuals alike that we are very proud of.
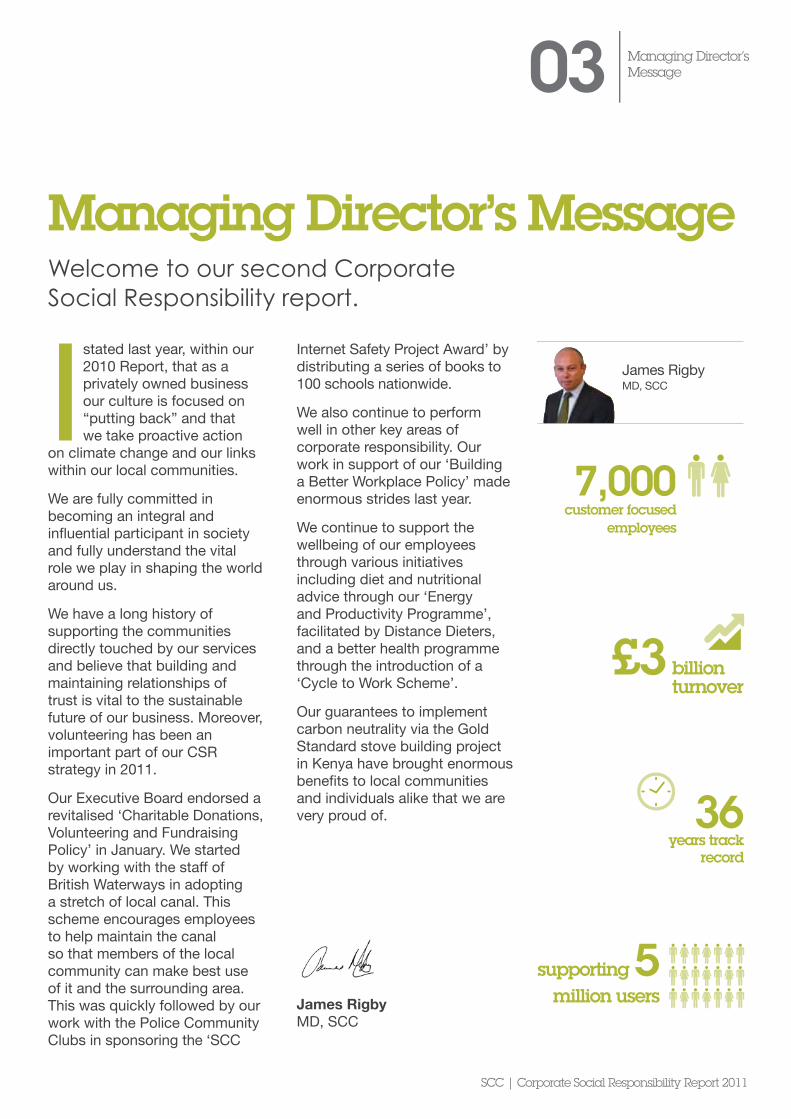
James Rigby MD, SCC
Welcome to our second Corporate Social Responsibility report.
Managing Director’s Message
James Rigby MD, SCC
SCC | Corporate Social Responsibility Report 2011
7,000customer focused
employees
supporting 5 million users
36 years track
record
£3billion turnover

We accept our environmental responsibilities and recognise our obligations to contribute to the resolution of global and local environmental issues by reducing our environmental impact and taking a leading role in promoting good practice.
04 Our Commitment to Sustainability and the Environment
Our Commitment to Sustainability and the Environment
SCC | Corporate Social Responsibility Report 2011
In particular, this will be achieved through our commitment to:
• Operating the business in an environmentally sensitive manner and striving for continuous improvement in environmental performance through setting objectives, targets and developing key performance indicators
• Complying with all applicable environmental legislation, regulations and other requirements pertaining to our business
• Employing sound waste management practices to minimise waste produced and maximise re-use or recycle opportunities with full consideration to our duty of care
• Employing best practice to maximise the efficient use of resources and educating staff on environmental issues and the promotion of individual good practice
• Engaging in dialogue with suppliers, distributors and sub-contractors to encourage their participation in environmental best practice
05 Our Commitment to Sustainability and the Environment
SCC | Corporate Social Responsibility Report 2011
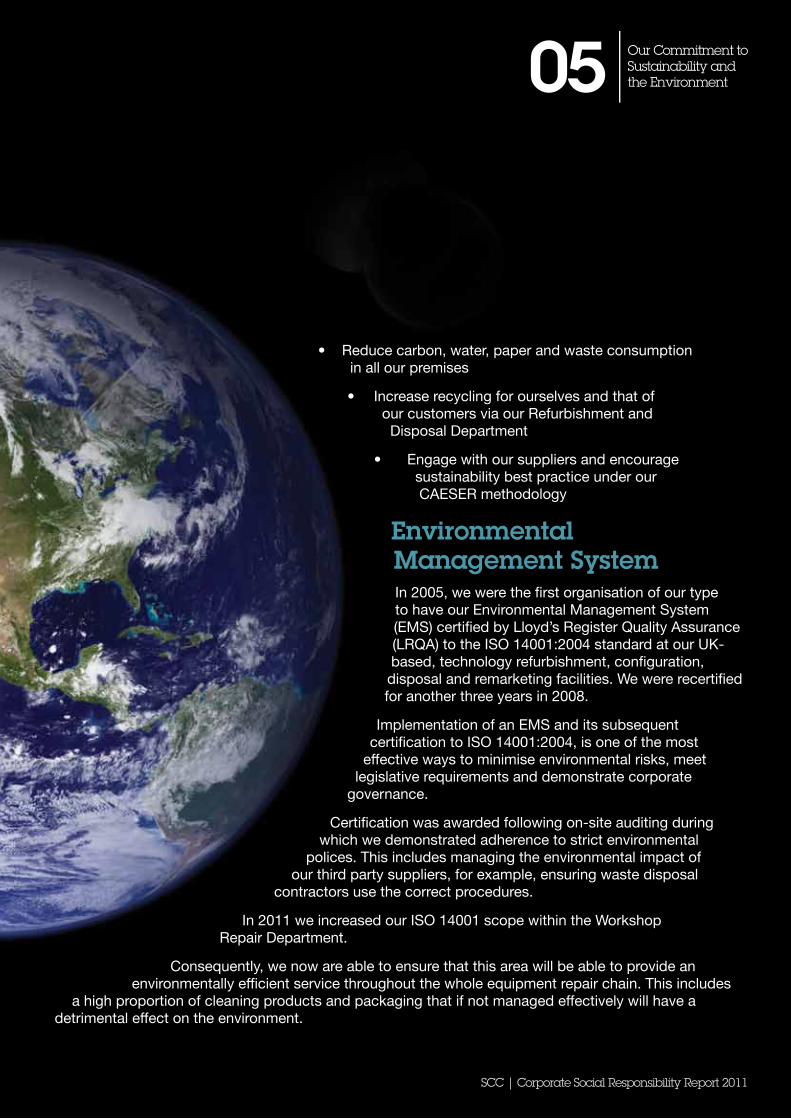
• Reduce carbon, water, paper and waste consumption in all our premises
• Increase recycling for ourselves and that of our customers via our Refurbishment and Disposal Department
• Engage with our suppliers and encourage sustainability best practice under our CAESER methodology
Environmental Management SystemIn 2005, we were the first organisation of our type to have our Environmental Management System (EMS) certified by Lloyd’s Register Quality Assurance (LRQA) to the ISO 14001:2004 standard at our UK-based, technology refurbishment, configuration, disposal and remarketing facilities. We were recertified for another three years in 2008.
Implementation of an EMS and its subsequent certification to ISO 14001:2004, is one of the most
effective ways to minimise environmental risks, meet legislative requirements and demonstrate corporate
governance.
Certification was awarded following on-site auditing during which we demonstrated adherence to strict environmental
polices. This includes managing the environmental impact of our third party suppliers, for example, ensuring waste disposal
contractors use the correct procedures.
In 2011 we increased our ISO 14001 scope within the Workshop Repair Department.
Consequently, we now are able to ensure that this area will be able to provide an environmentally efficient service throughout the whole equipment repair chain. This includes
a high proportion of cleaning products and packaging that if not managed effectively will have a detrimental effect on the environment.

SCC | Corporate Social Responsibility Report 2011
06
Carbon Dioxide is an inevitable product of the way we all live today. It is produced primarily through the burning of fossil fuels in:
Electricity generation
The powering of vehicles, trains and aircraft
Home heating and cooking (gas, wood, coal, oil)
It is widely accepted amongst a global coalition of meteorologists and associated scientists that the Earth’s atmosphere is warming rapidly and that this change has been brought about by the activities of humans.
Put simply, gases released into the atmosphere by human activity are forming an insulating barrier around the Earth, preventing the natural release of heat from our atmosphere. There are a number of gases that are held responsible for this process, which is sometimes referred to as ‘the greenhouse effect’. While methane and other gases contribute to the problem, the chief culprit, by virtue of the volumes produced, is carbon dioxide.
Our Approach
We have targeted the reduction of carbon dioxide as one of our key objectives over the next 5 years. This year we continued our drive, in this key area, by conducting our 3rd Greenhouse Gas (GHG) Audit.
Our Commitment to Sustainability and the Environment
Carbon Footprint The Greenhouse Gas AuditIt is essential that we have a clear picture of the impact on the environment.
There are a number of reasons for this:
• CRC Energy Efficiency Scheme compliance
• Identify opportunities to reduce costs (e.g. energy use)
• Benchmark performance, identifying opportunities to improve the organisation’s processes
• Provide information to stakeholders and clients
• Define and monitor corporate responsibility targets
• Assess risk for potential future legislation around climate change
• Engage in carbon offsetting or carbon trading (for example becoming a Carbon Zero organisation)
• Be part of larger scale greenhouse gas reporting initiatives
We have targeted the reduction of carbon dioxide as one of our key objectives over the next 5 years
07
SCC | Corporate Social Responsibility Report 2011
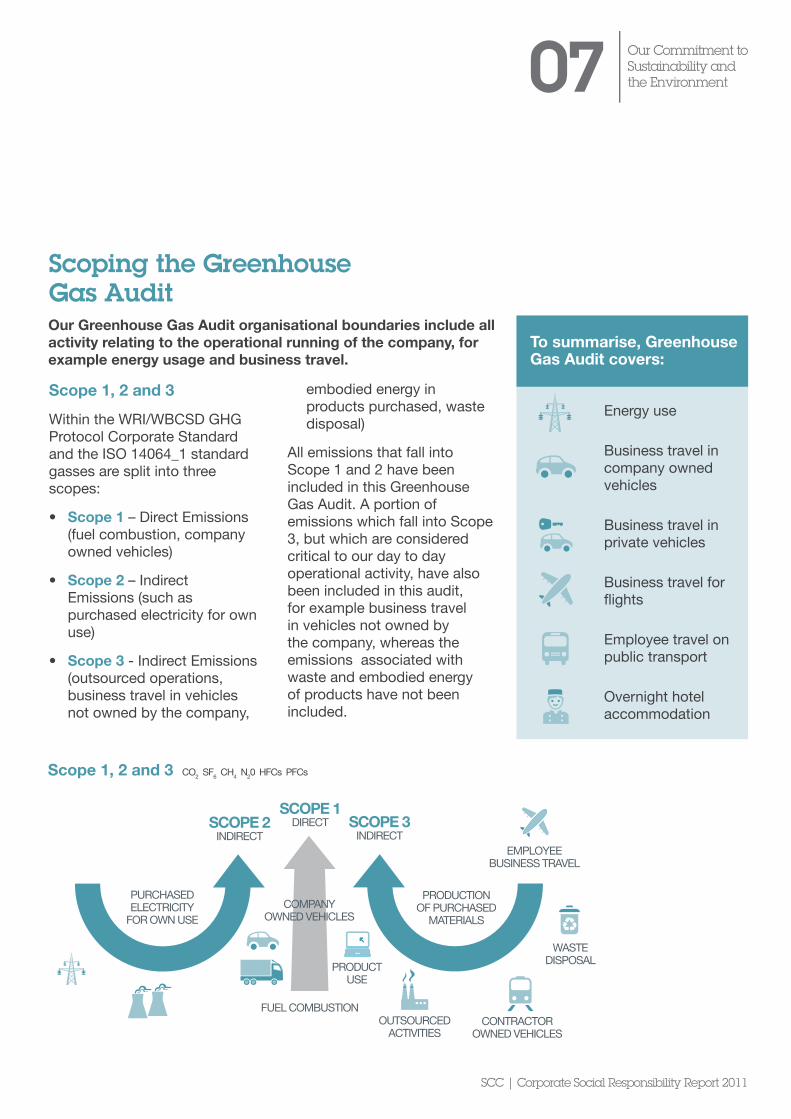
Energy use
Business travel in company owned vehicles
Business travel in private vehicles
Business travel for flights
Employee travel on public transport
Overnight hotel accommodation
To summarise, Greenhouse Gas Audit covers:
Our Commitment to Sustainability and the Environment
Scoping the Greenhouse Gas Audit
Scope 1, 2 and 3
Within the WRI/WBCSD GHG Protocol Corporate Standard and the ISO 14064_1 standard gasses are split into three scopes:
• Scope 1 – Direct Emissions (fuel combustion, company owned vehicles)
• Scope 2 – Indirect Emissions (such as purchased electricity for own use)
• Scope 3 - Indirect Emissions (outsourced operations, business travel in vehicles not owned by the company,
embodied energy in products purchased, waste disposal)
All emissions that fall into Scope 1 and 2 have been included in this Greenhouse Gas Audit. A portion of emissions which fall into Scope 3, but which are considered critical to our day to day operational activity, have also been included in this audit, for example business travel in vehicles not owned by the company, whereas the emissions associated with waste and embodied energy of products have not been included.
Scope 1, 2 and 3 CO2 SF6 CH4 N20 HFCs PFCs
Our Greenhouse Gas Audit organisational boundaries include all activity relating to the operational running of the company, for example energy usage and business travel.
SCOPE 2INDIRECT
SCOPE 1DIRECT SCOPE 3
INDIRECT
PURCHASED ELECTRICITY
FOR OWN USE
PRODUCTION OF PURCHASED
MATERIALSCOMPANY
OWNED VEHICLES
EMPLOYEE BUSINESS TRAVEL
WASTE DISPOSAL
OUTSOURCED ACTIVITIES
CONTRACTOR OWNED VEHICLES
PRODUCTUSE
FUEL COMBUSTION
082010/2011
GHG emissions from operational activities
12,446.07 tonnes of CO2e
Our Commitment to Sustainability and the Environment
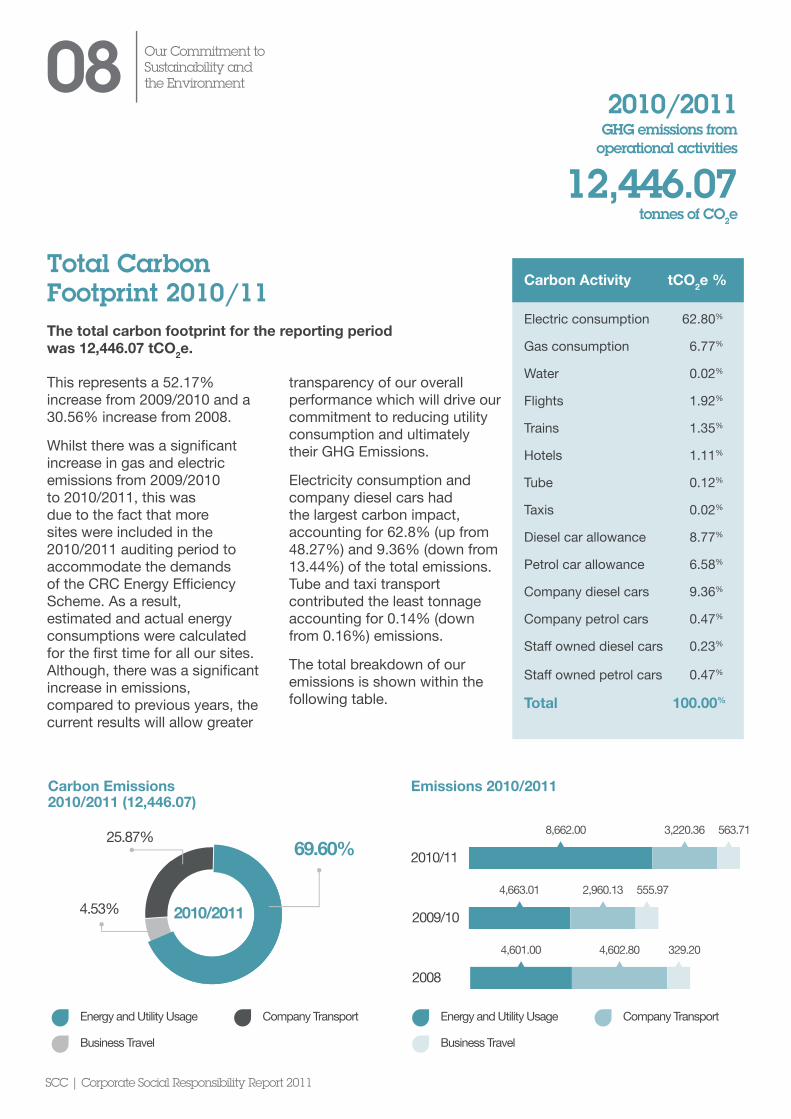
This represents a 52.17% increase from 2009/2010 and a 30.56% increase from 2008.
Whilst there was a significant increase in gas and electric emissions from 2009/2010 to 2010/2011, this was due to the fact that more sites were included in the 2010/2011 auditing period to accommodate the demands of the CRC Energy Efficiency Scheme. As a result, estimated and actual energy consumptions were calculated for the first time for all our sites. Although, there was a significant increase in emissions, compared to previous years, the current results will allow greater
transparency of our overall performance which will drive our commitment to reducing utility consumption and ultimately their GHG Emissions.
Electricity consumption and company diesel cars had the largest carbon impact, accounting for 62.8% (up from 48.27%) and 9.36% (down from 13.44%) of the total emissions. Tube and taxi transport contributed the least tonnage accounting for 0.14% (down from 0.16%) emissions.
The total breakdown of our emissions is shown within the following table.
Total Carbon Footprint 2010/11The total carbon footprint for the reporting period was 12,446.07 tCO2e.
Carbon Activity tCO2e %
Electric consumption 62.80%
Gas consumption 6.77%
Water 0.02%
Flights 1.92%
Trains 1.35%
Hotels 1.11%
Tube 0.12%
Taxis 0.02%
Diesel car allowance 8.77%
Petrol car allowance 6.58%
Company diesel cars 9.36%
Company petrol cars 0.47%
Staff owned diesel cars 0.23%
Staff owned petrol cars 0.47%
Total 100.00%
Carbon Emissions 2010/2011 (12,446.07)
69.60%
4.53%
25.87%
Energy and Utility Usage Company Transport
Business Travel
2010/2011
SCC | Corporate Social Responsibility Report 2011
Emissions 2010/2011
2010/11
8,662.00 3,220.36 563.71
2009/10
4,663.01 2,960.13 555.97
2008
4,601.00 4,602.80 329.20
Energy and Utility Usage Company Transport
Business Travel

09 Our Commitment to Sustainability and the Environment
in gas (332.45 tCO2e to 843.05 tCO2e) and electric (3,947.783 tCO2e to 7,815.91 tCO2e) from 2009/2010 to 2010/2011. This was because more sites were included in the 2010/2011 period. There were a total of 22 sites included in the
2010/2011 auditing period. Data was complete and grouped into estimated and actual consumptions in compliance
Scheme.
Energy Consumption
Energy and utility consumption comprised 69.60% of the total emissions. Electricity was the single largest source of emissions, accounting for 93.21% of the total emissions.
Carbon Emissions 2010/2011 (12,446.07)
6.77%
Electric Consumption
Gas Consumption
Water Consumption
2010/2011
93.21%0.02%
93.21%
Electricity was the single largest source of
emissions, accounting for
of the total emissions
2010/11 7,815.91 tCO2e
3947.78 tCO2e
4064.22 tCO2e
2009/10
Electric Carbon Activity
2008/09
2010/11 843.05 tCO2e
332.45 tCO2e
534.17 tCO2e
2009/10
Gas Carbon Activity
2008/09
2010/11 5.04 tCO2e
3.82 tCO2e
3.04 tCO2e
2009/10
Water Carbon Activity
2008/09
SCC | Corporate Social Responsibility Report 2011
153.59%Gas consumption increased by
10 Our Commitment to Sustainability and the Environment
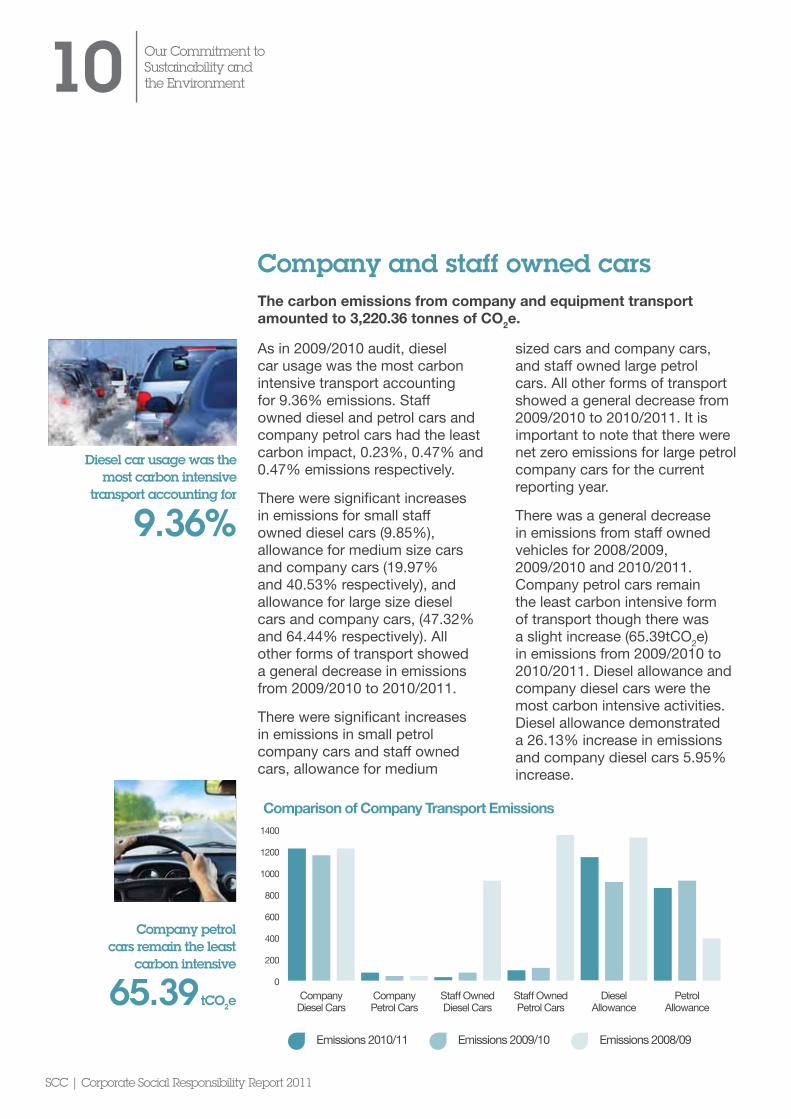
As in 2009/2010 audit, diesel car usage was the most carbon intensive transport accounting for 9.36% emissions. Staff owned diesel and petrol cars and company petrol cars had the least carbon impact, 0.23%, 0.47% and 0.47% emissions respectively.
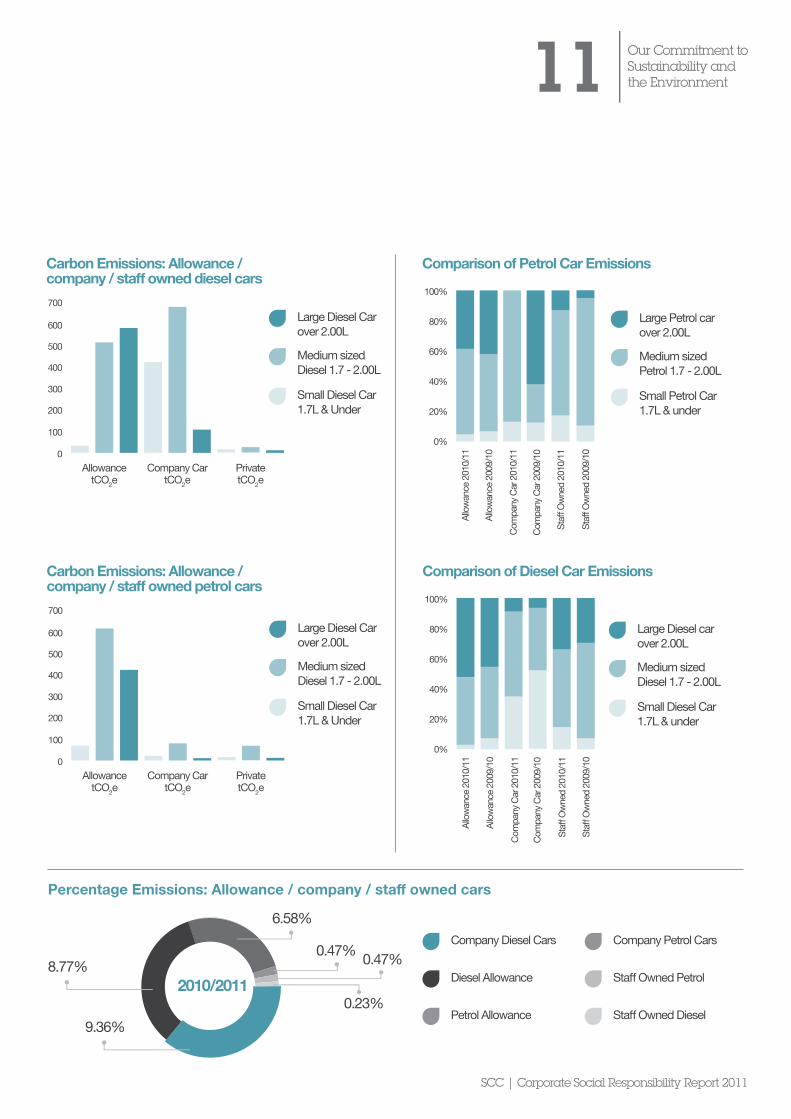
There were significant increases in emissions for small staff owned diesel cars (9.85%), allowance for medium size cars and company cars (19.97% and 40.53% respectively), and allowance for large size diesel cars and company cars, (47.32% and 64.44% respectively). All other forms of transport showed a general decrease in emissions from 2009/2010 to 2010/2011.
There were significant increases in emissions in small petrol company cars and staff owned cars, allowance for medium
sized cars and company cars, and staff owned large petrol cars. All other forms of transport showed a general decrease from 2009/2010 to 2010/2011. It is important to note that there were net zero emissions for large petrol company cars for the current reporting year.
There was a general decrease in emissions from staff owned vehicles for 2008/2009, 2009/2010 and 2010/2011. Company petrol cars remain the least carbon intensive form of transport though there was a slight increase (65.39tCO2e) in emissions from 2009/2010 to 2010/2011. Diesel allowance and company diesel cars were the most carbon intensive activities. Diesel allowance demonstrated a 26.13% increase in emissions and company diesel cars 5.95% increase.
Company and staff owned carsThe carbon emissions from company and equipment transport amounted to 3,220.36 tonnes of CO2e.
SCC | Corporate Social Responsibility Report 2011
Comparison of Company Transport Emissions
Company Diesel Cars
200
600
800
1200
1400
Emissions 2008/09Emissions 2009/10Emissions 2010/11
Company Petrol Cars
Staff Owned Diesel Cars
400
1000
0Staff Owned Petrol Cars
Diesel Allowance
Petrol Allowance
Diesel car usage was the most carbon intensive
transport accounting for
9.36%
Company petrol cars remain the least
carbon intensive
65.39 tCO2e
11 Our Commitment to Sustainability and the Environment
SCC | Corporate Social Responsibility Report 2011
Comparison of Diesel Car Emissions
Allow
ance
200
9/10
Com
pany
Car
200
9/10
0%
20%
40%
60%
80%
100%
Allow
ance
201
0/11
Com
pany
Car
201
0/11
Staff
Own
ed 2
009/
10
Staff
Own
ed 2
010/
11
Large Diesel car over 2.00L
Medium sized Diesel 1.7 - 2.00L
Small Diesel Car 1.7L & under
Comparison of Petrol Car Emissions
Allow
ance
200
9/10
Com
pany
Car
200
9/10
0%
20%
40%
60%
80%
100%
Allow
ance
201
0/11
Com
pany
Car
201
0/11
Staff
Own
ed 2
009/
10
Staff
Own
ed 2
010/
11
Large Petrol car over 2.00L
Medium sized Petrol 1.7 - 2.00L
Small Petrol Car 1.7L & under
Carbon Emissions: Allowance / company / staff owned diesel cars
Allowance tCO2e
100
300
400
600
700Large Diesel Car over 2.00L
Medium sized Diesel 1.7 - 2.00L
Small Diesel Car 1.7L & Under
Company Car tCO2e
Private tCO2e
200
500
0
Carbon Emissions: Allowance / company / staff owned petrol cars
Allowance tCO2e
100
300
400
600
700
Large Diesel Car over 2.00L
Medium sized Diesel 1.7 - 2.00L
Small Diesel Car 1.7L & Under
Company Car tCO2e
Private tCO2e
200
500
0
Percentage Emissions: Allowance / company / staff owned cars
6.58%Company Diesel Cars
Diesel Allowance
Petrol Allowance
2010/2011
Company Petrol Cars
Staff Owned Petrol
Staff Owned Diesel
8.77%
0.23%9.36%
0.47%0.47%

From this percentage, flights had the largest carbon impact, comprising 1.92% emissions. Taxis and tube transport were the least intensive forms of transport accounting for 0.14% emissions.
Through our focus on providing video conferencing facilities throughout key locations
within the business, there were significant decreases in flights and taxis for all of the reporting years.
Flights demonstrated a 17.96% decrease and taxis 8.78% decrease. In contrast, trains, hotels and tube transport all had general increases from 2008/2009, 2009/2010, and 2010/2011.
Business TravelBusiness Travel comprised 563.71 tonnes of CO2e.
12 Our Commitment to Sustainability and the Environment
SCC | Corporate Social Responsibility Report 2011
Carbon Footprint of Business Travel (563.71 tCO2e)
Flights
Trains
Hotels
Tube
Taxis
1.11
2010/20111.35
0.0021.92
0.12
Comparison of Business Travel Emissions
Flights
50
150
200
300
350
Emissions 2008/2009Emissions 2009/10Emissions 2010/11
Trains Hotels
100
250
0
Tube Taxis
Our flights have decreased by
17.96%
Taxi transport saw a decrease of
8.78%
13 Our Commitment to Sustainability and the Environment
SCC | Corporate Social Responsibility Report 2011
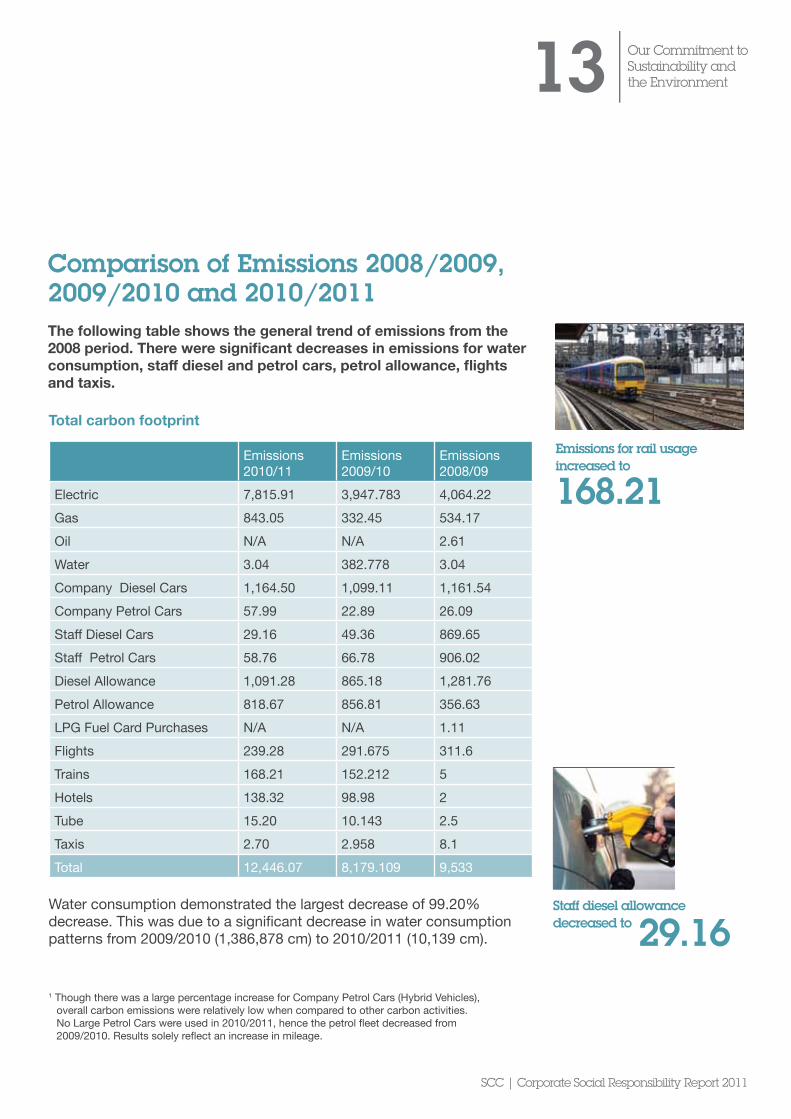
The following table shows the general trend of emissions from the 2008 period. There were significant decreases in emissions for water consumption, staff diesel and petrol cars, petrol allowance, flights and taxis.
Comparison of Emissions 2008/2009, 2009/2010 and 2010/2011
1 Though there was a large percentage increase for Company Petrol Cars (Hybrid Vehicles), overall carbon emissions were relatively low when compared to other carbon activities. No Large Petrol Cars were used in 2010/2011, hence the petrol fleet decreased from 2009/2010. Results solely reflect an increase in mileage.
Total carbon footprint
Emissions 2010/11
Emissions 2009/10
Emissions 2008/09
Electric 7,815.91 3,947.783 4,064.22Gas 843.05 332.45 534.17Oil N/A N/A 2.61Water 3.04 382.778 3.04Company Diesel Cars 1,164.50 1,099.11 1,161.54Company Petrol Cars 57.99 22.89 26.09Staff Diesel Cars 29.16 49.36 869.65Staff Petrol Cars 58.76 66.78 906.02Diesel Allowance 1,091.28 865.18 1,281.76Petrol Allowance 818.67 856.81 356.63LPG Fuel Card Purchases N/A N/A 1.11Flights 239.28 291.675 311.6Trains 168.21 152.212 5Hotels 138.32 98.98 2Tube 15.20 10.143 2.5Taxis 2.70 2.958 8.1Total 12,446.07 8,179.109 9,533
Water consumption demonstrated the largest decrease of 99.20% decrease. This was due to a significant decrease in water consumption patterns from 2009/2010 (1,386,878 cm) to 2010/2011 (10,139 cm).
Emissions for rail usage increased to
168.21
Staff diesel allowance decreased to 29.16
SCC | Corporate Social Responsibility Report 2011
14 Our Commitment to Sustainability and the Environment
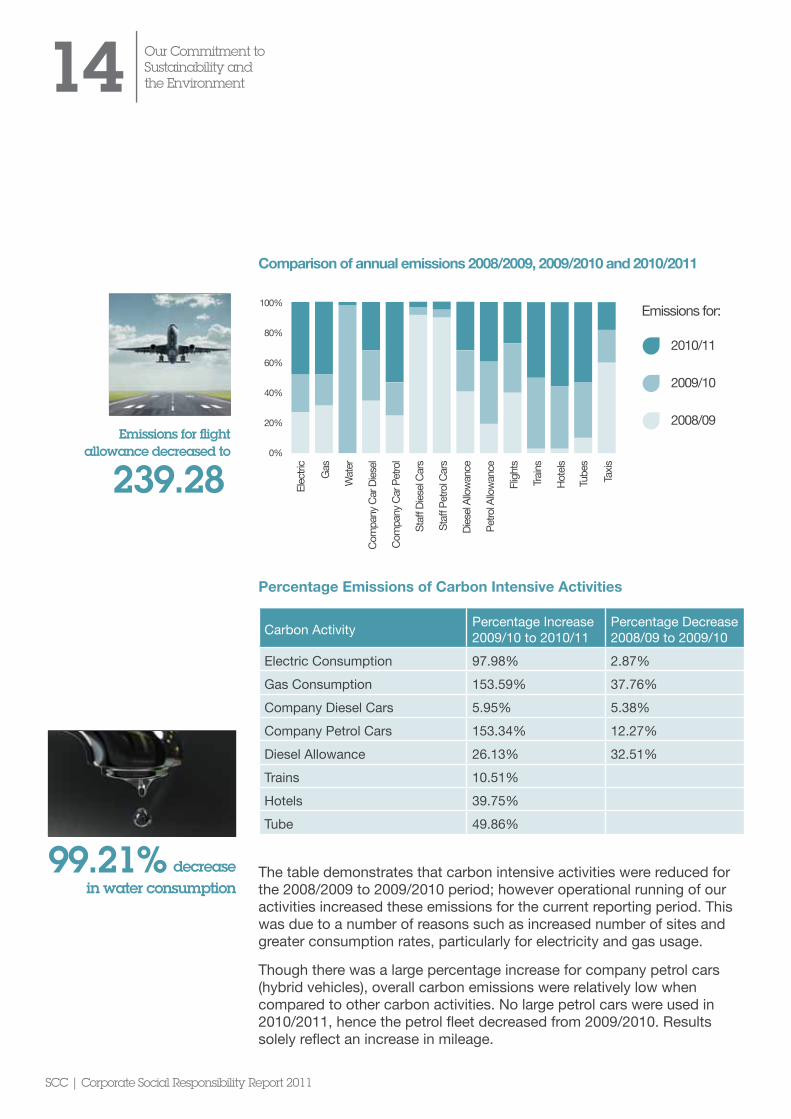
Percentage Emissions of Carbon Intensive Activities
Carbon Activity Percentage Increase 2009/10 to 2010/11
Percentage Decrease 2008/09 to 2009/10
Electric Consumption 97.98% 2.87%Gas Consumption 153.59% 37.76%Company Diesel Cars 5.95% 5.38%Company Petrol Cars 153.34% 12.27%Diesel Allowance 26.13% 32.51%Trains 10.51%Hotels 39.75%Tube 49.86%
The table demonstrates that carbon intensive activities were reduced for the 2008/2009 to 2009/2010 period; however operational running of our activities increased these emissions for the current reporting period. This was due to a number of reasons such as increased number of sites and greater consumption rates, particularly for electricity and gas usage.
Though there was a large percentage increase for company petrol cars (hybrid vehicles), overall carbon emissions were relatively low when compared to other carbon activities. No large petrol cars were used in 2010/2011, hence the petrol fleet decreased from 2009/2010. Results solely reflect an increase in mileage.
Emissions for:
Comparison of annual emissions 2008/2009, 2009/2010 and 2010/2011
Gas
Wat
er
Com
pany
Car
Dies
el
Com
pany
Car
Pet
rol
Staff
Dies
el Ca
rs
Staff
Pet
rol C
ars
Dies
el Al
lowan
ce
Tube
s
Petro
l Allo
wanc
e
Fligh
ts
Train
s
Hote
ls
Taxis
0%
20%
40%
60%
80%
100%
2010/11
2009/10
2008/09
Elec
tric
99.21% decrease in water consumption
Emissions for flight allowance decreased to
239.28
SCC | Corporate Social Responsibility Report 2011
2010/11
Everything we do has an environmental affect, be it positive or negative. Our Sustainability
Policy commits us to continually improve the sustainability of all our services and working practices.
Our Sustainability Commitments
• Reduce carbon emissions from premises and vehicles in-line with our commitment to the Carbon Reduction Commitment
• Reduce water consumption in all our premises
• Reduce paper consumption in all our premises
• Reduce waste from all our premises and those of our customers where we have a major presence
• Increase recycling for ourselves and that of our customers via our Refurbishment and Disposal Department
• Engage with our suppliers and encourage sustainability best practice under our CAESER methodology
• Encourage “green travel plans” for staff and customers and continue to encourage the use of video and telephone conferencing
• Increase our activity in sustainable projects both within the UK and abroad
With 80% of the nation’s IT systems running obsolete or unsupported software, our core business helps organisations affordably access best of breed and green technologies, remove inefficiencies and enhance business performance.
Our Commitment to Sustainability
Focusing on sustainable projects abroad is only part of what we, as a company, aim to accomplish. We were awarded the Green Grid Award for Sustainability 2011 at the Data Centres in Europe Awards.
Awarded the prestigious prize ahead of a very competitive list of nominees, we emerged ahead of the field after judges praised our environmental strategy that combines
innovative approaches to carbon reduction with an unrivalled long term vision. The panel highlighted our whole lifecycle approach to our data centre building - which saw an existing structure utilised to create a new facility founded on energy efficiency - and similarly commended our carbon offsetting initiative, which distributes fuel-efficient cooking stoves to poor African communities.
Sustainable Projects within the UK
15 Our Commitment to Sustainability
16
We recognise that it is not going to be possible for the business to completely eliminate the current carbon footprint. After taking all sensible carbon reduction steps, we believe that it makes absolute sense to ‘neutralise’ or offset those emissions that it has not been possible to remove.
To do otherwise is simply to ignore our contribution to climate change. Over the next 5 years we intend to invest in a managed project in Africa.
The Gold Standard Foundation is a non-profit organization under Swiss law that operates a certification scheme for premium carbon credits.
Our Commitment to Sustainability
Sustainable Projects abroad
The Foundation has trademarked the Gold Standard label, which is today internationally-recognised as the leading indicator of quality in carbon markets.
SCC | Corporate Social Responsibility Report 2011
Gold Standard Verified Emission Reduction credits are offered for sale in compliance offset markets established by the Kyoto Protocol. The Foundation has trademarked the Gold Standard label, which is today internationally-recognised as the leading indicator of quality in carbon markets.
The Gold Standard incorporates all five United Nations Framework Convention on Climate Change (UNFCCC) criteria for Clean Development Mechanism (CDM) carbon offset projects, namely:
• Additionality of emissions reductions compared to the ‘business-as usual’ situation
• No adverse environmental impact (do not harm assessment)
• Consistency with host country sustainable development strategy (projects must contribute to the countries sustainable development)
• Emissions reduction benefits that are real and measurable (establish baselines and monitor emissions savings)
• No diversion of Overseas Development Assistance (ODA) to finance carbon offset projects
All projects are operated to the highest standard and are subject to the CarbonZero Guarantee. This means that no matter what happens, there are always guarantees to offset the amount of Greenhouse Gases for which it has been paid. Examples of the projects being assessed are as follows:
17 Our Commitment to Sustainability
SCC | Corporate Social Responsibility Report 2011
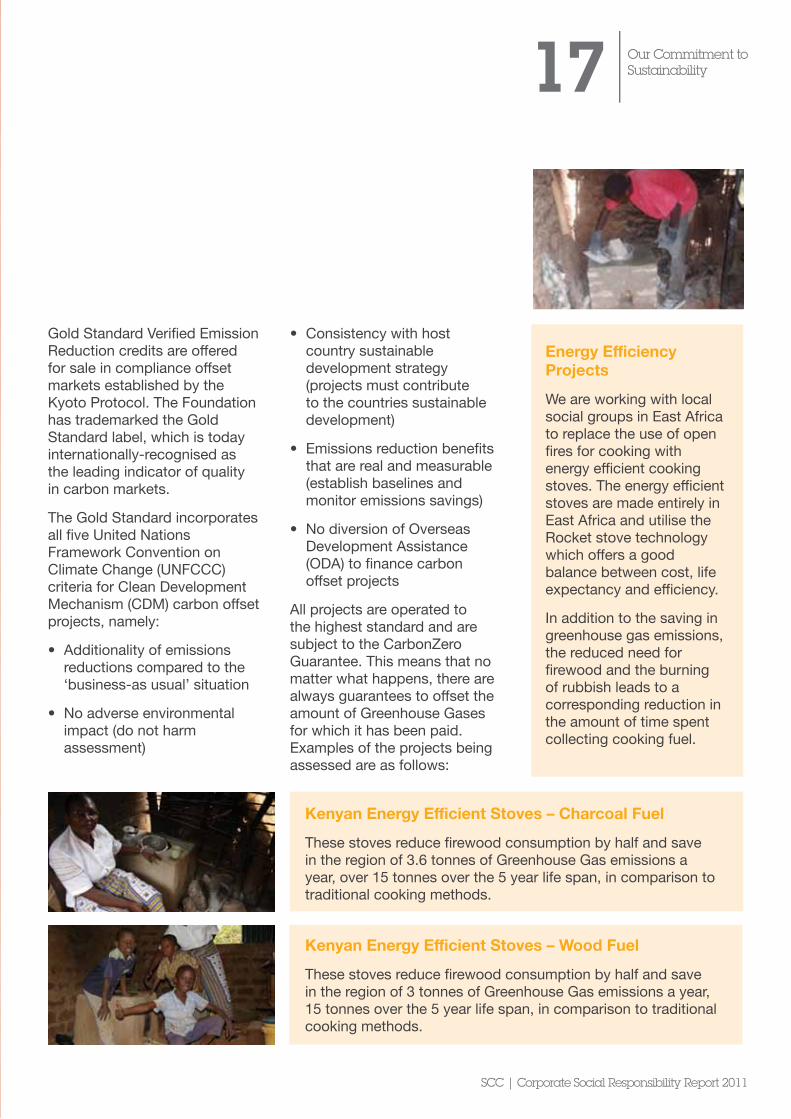
Energy Efficiency Projects
We are working with local social groups in East Africa to replace the use of open fires for cooking with energy efficient cooking stoves. The energy efficient stoves are made entirely in East Africa and utilise the Rocket stove technology which offers a good balance between cost, life expectancy and efficiency.
In addition to the saving in greenhouse gas emissions, the reduced need for firewood and the burning of rubbish leads to a corresponding reduction in the amount of time spent collecting cooking fuel.
Kenyan Energy Efficient Stoves – Charcoal Fuel
These stoves reduce firewood consumption by half and save in the region of 3.6 tonnes of Greenhouse Gas emissions a year, over 15 tonnes over the 5 year life span, in comparison to traditional cooking methods.
Kenyan Energy Efficient Stoves – Wood Fuel
These stoves reduce firewood consumption by half and save in the region of 3 tonnes of Greenhouse Gas emissions a year, 15 tonnes over the 5 year life span, in comparison to traditional cooking methods.
SCC | Corporate Social Responsibility Report 2011
18 Recycling & Green IT
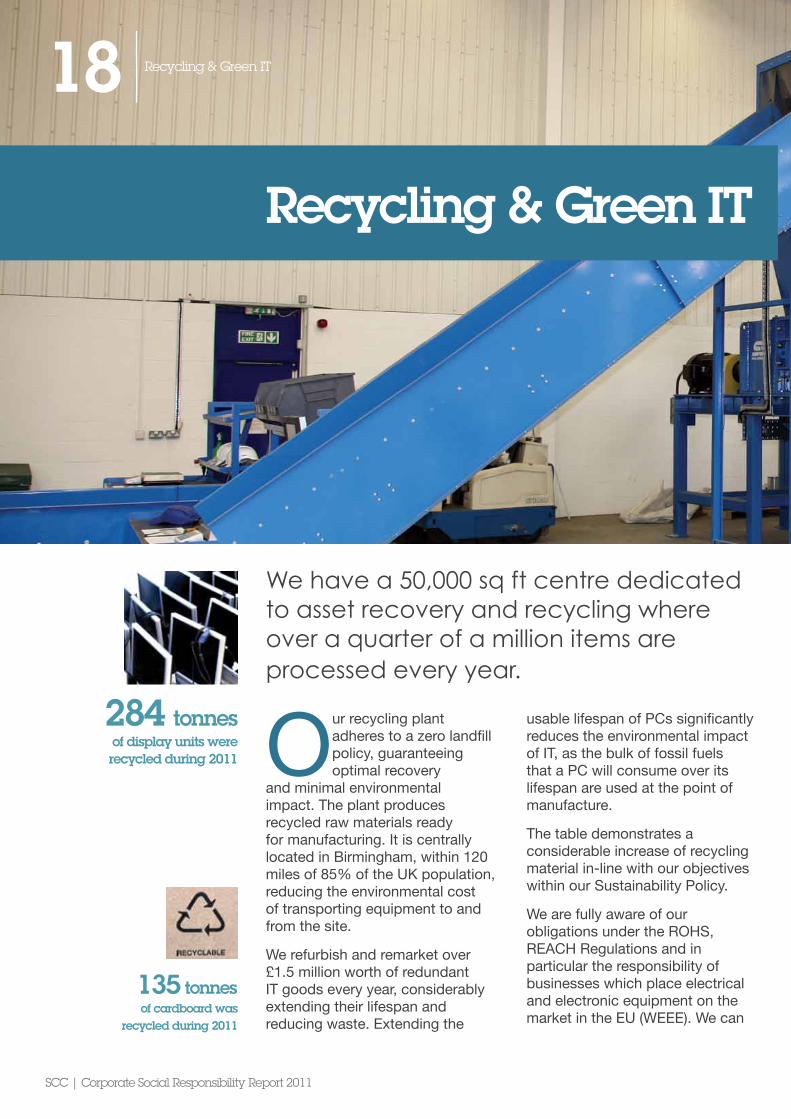
We have a 50,000 sq ft centre dedicated to asset recovery and recycling where over a quarter of a million items areprocessed every year.
Our recycling plant adheres to a zero landfill policy, guaranteeing optimal recovery
and minimal environmental impact. The plant produces recycled raw materials ready for manufacturing. It is centrally located in Birmingham, within 120 miles of 85% of the UK population, reducing the environmental cost of transporting equipment to and from the site.
We refurbish and remarket over £1.5 million worth of redundant IT goods every year, considerably extending their lifespan and reducing waste. Extending the
usable lifespan of PCs significantly reduces the environmental impact of IT, as the bulk of fossil fuels that a PC will consume over its lifespan are used at the point of manufacture.
The table demonstrates a considerable increase of recycling material in-line with our objectives within our Sustainability Policy.
We are fully aware of our obligations under the ROHS, REACH Regulations and in particular the responsibility of businesses which place electrical and electronic equipment on the market in the EU (WEEE). We can
Recycling & Green IT
284 tonnesof display units were recycled during 2011
135 tonnesof cardboard was
recycled during 2011

SCC | Corporate Social Responsibility Report 2011
19 Recycling & Green IT
also confirm we have put in place policies and procedures to ensure that new electrical and electronic equipment which we place on the market on or
after 1st July 2006 does not contain hazardous substances as defined under the ROHS Regulations.
During the period January – November 2011 we recycled the following:
Material Tonnage 2010 Tonnage 2011 IncreaseDisplay Unit 320 284 -Ferrous Metals 286 391 105Cardboard 135 194 59Cables 38 66 28Batteries 19 17 -Non-Ferrous Metals 16 23 7PSUs 15 56 41Shrink Wrap 14 17 3Toners 9 11 2Polystyrene 5 6 1Paper 5 6 1Copper 2 5 3
Use of Recycled Material or Products We use recycled materials in its operations including:
• Full pre-audit of all business essential requests by Group Purchasing Manager in order to ensure no “over-ordering” of supplies
• Introduction of paper recycling scheme throughout all Head Office departments
• Implementation of re-use process at our distribution sites of wood pallets, internal and external packaging
• All plastic, polystyrene and cardboard and non hazardous WEEE are recycled at our Neo Park facility where it is feasible to do so
£1.5We refurbish and remarket over
million worth of redundant IT
goods every year

SCC | Corporate Social Responsibility Report 2011
20
We have a long history of supporting the communities directly touched by our business and we believe that building andmaintaining relationships of trust in the community is vital tothe sustainable future of our business.
Community Engagement
Community Engagement
Our investment is structured in two areas.
Our strategic programme focuses on addressing issues relating to financial systems and poverty in the UK. The Rigby Foundation, a registered charity, which operates independently of the business, delivers this programme.
At a corporate level we have a significant giving programme supporting employee, as well as community, interests.
Our primary activity will involve corporate fundraising days for
charities recommended by our employees.
The number and size of charities will vary throughout the year. However, it is our aim that these fundraising events will:
• Partner local charities which focus on social and environmental needs relevant to that community
• Support local sports and arts organisations that provide opportunities for our employees to maintain a healthy work/life balance
• Build long-term relationships with schools close to our main office sites
SCC | Corporate Social Responsibility Report 2011
21 Charity Contribution
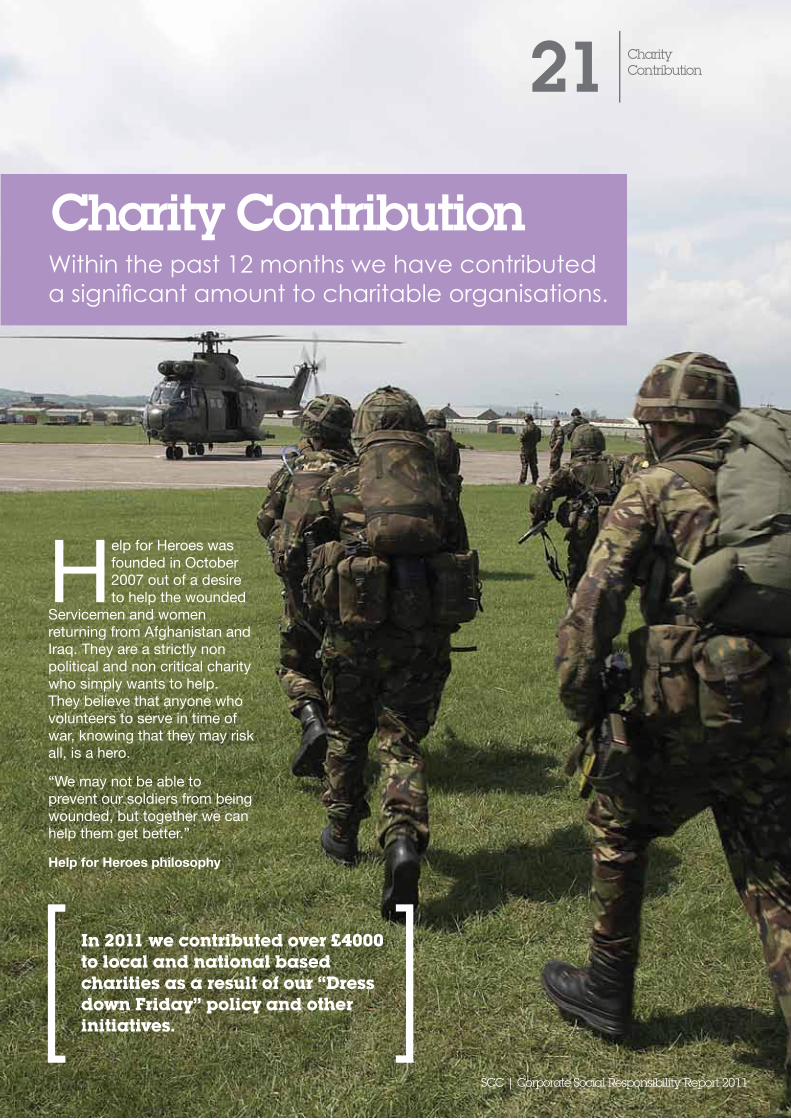
Help for Heroes was founded in October 2007 out of a desire to help the wounded
Servicemen and women returning from Afghanistan and Iraq. They are a strictly non political and non critical charity who simply wants to help. They believe that anyone who volunteers to serve in time of war, knowing that they may risk all, is a hero.
“We may not be able to prevent our soldiers from being wounded, but together we can help them get better.”
Help for Heroes philosophy
Within the past 12 months we have contributed a significant amount to charitable organisations.
Charity Contribution
In 2011 we contributed over £4000 to local and national based charities as a result of our “Dress down Friday” policy and other initiatives.
22
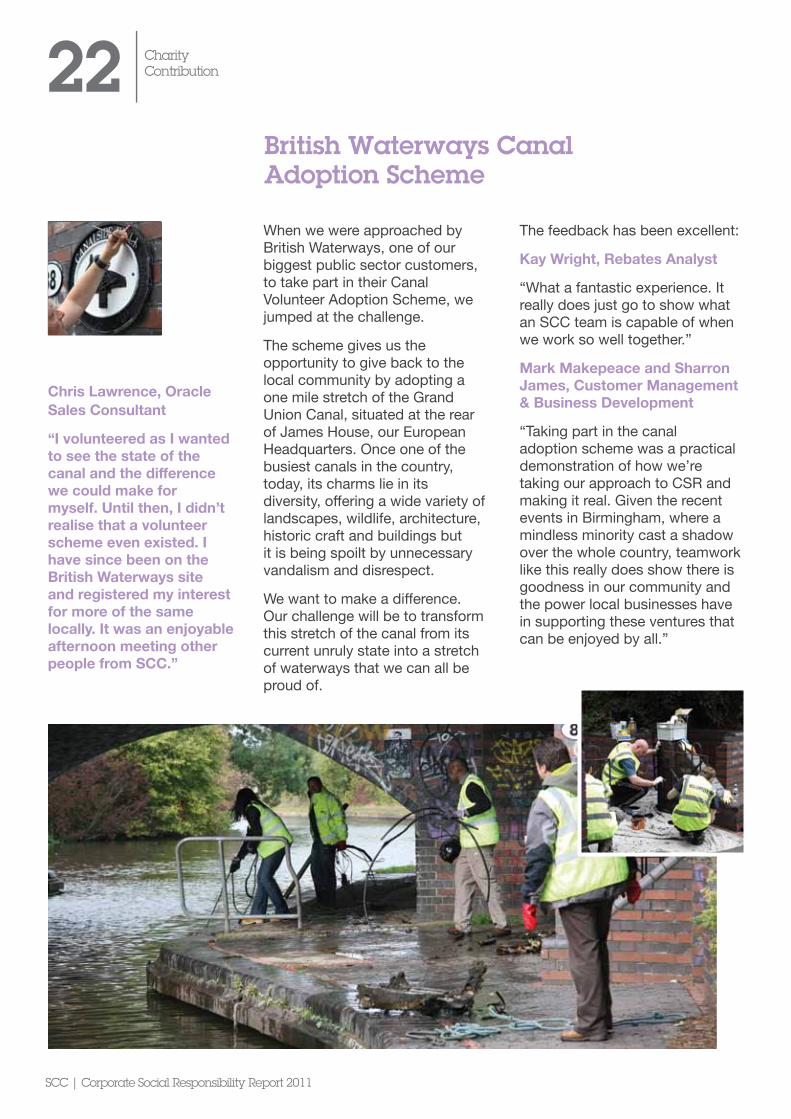
When we were approached by British Waterways, one of our biggest public sector customers, to take part in their Canal Volunteer Adoption Scheme, we jumped at the challenge.
The scheme gives us the opportunity to give back to the local community by adopting a one mile stretch of the Grand Union Canal, situated at the rear of James House, our European Headquarters. Once one of the busiest canals in the country, today, its charms lie in its diversity, offering a wide variety of landscapes, wildlife, architecture, historic craft and buildings but it is being spoilt by unnecessary vandalism and disrespect.
We want to make a difference. Our challenge will be to transform this stretch of the canal from its current unruly state into a stretch of waterways that we can all be proud of.
The feedback has been excellent:
Kay Wright, Rebates Analyst
“What a fantastic experience. It really does just go to show what an SCC team is capable of when we work so well together.”
Mark Makepeace and Sharron James, Customer Management & Business Development
“Taking part in the canal adoption scheme was a practical demonstration of how we’re taking our approach to CSR and making it real. Given the recent events in Birmingham, where a mindless minority cast a shadow over the whole country, teamwork like this really does show there is goodness in our community and the power local businesses have in supporting these ventures that can be enjoyed by all.”
Charity Contribution
SCC | Corporate Social Responsibility Report 2011
British Waterways Canal Adoption Scheme
Chris Lawrence, Oracle Sales Consultant
“I volunteered as I wanted to see the state of the canal and the difference we could make for myself. Until then, I didn’t realise that a volunteer scheme even existed. I have since been on the British Waterways site and registered my interest for more of the same locally. It was an enjoyable afternoon meeting other people from SCC.”
23
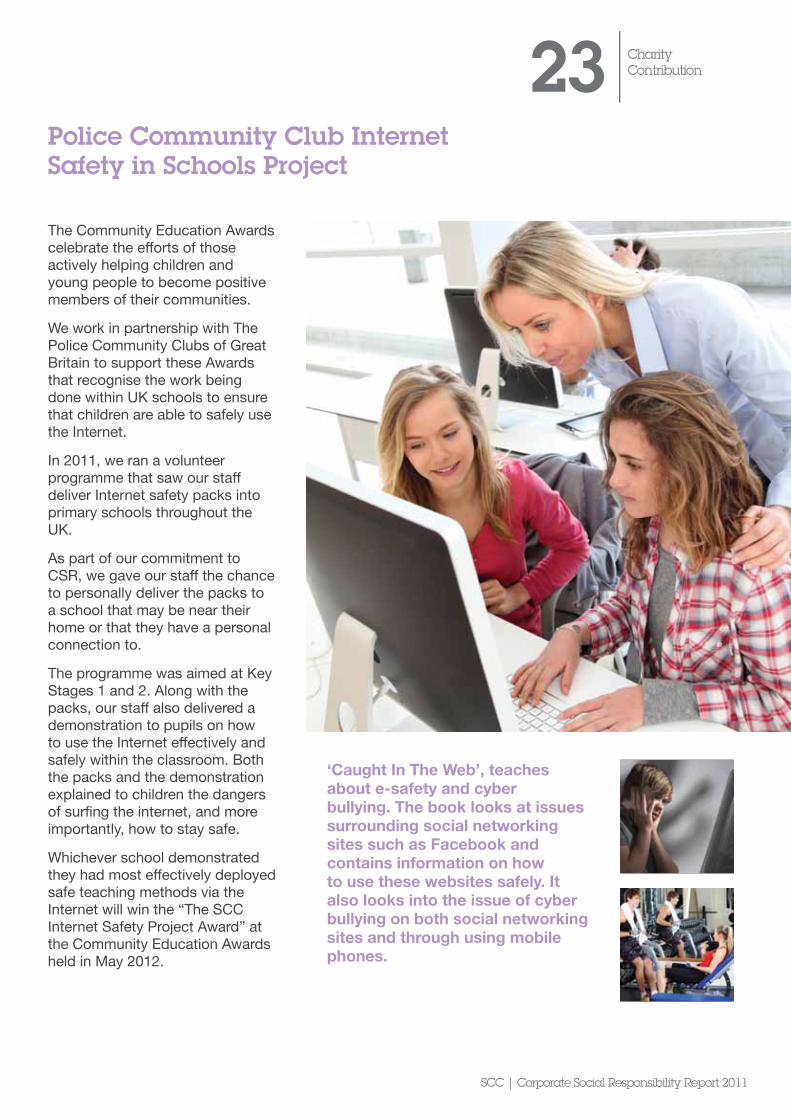
The Community Education Awards celebrate the efforts of those actively helping children and young people to become positive members of their communities.
We work in partnership with The Police Community Clubs of Great Britain to support these Awards that recognise the work being done within UK schools to ensure that children are able to safely use the Internet.
In 2011, we ran a volunteer programme that saw our staff deliver Internet safety packs into primary schools throughout the UK.
As part of our commitment to CSR, we gave our staff the chance to personally deliver the packs to a school that may be near their home or that they have a personal connection to.
The programme was aimed at Key Stages 1 and 2. Along with the packs, our staff also delivered a demonstration to pupils on how to use the Internet effectively and safely within the classroom. Both the packs and the demonstration explained to children the dangers of surfing the internet, and more importantly, how to stay safe.
Whichever school demonstrated they had most effectively deployed safe teaching methods via the Internet will win the “The SCC Internet Safety Project Award” at the Community Education Awards held in May 2012.
Charity Contribution
SCC | Corporate Social Responsibility Report 2011
Police Community Club Internet Safety in Schools Project
‘Caught In The Web’, teaches about e-safety and cyber bullying. The book looks at issues surrounding social networking sites such as Facebook and contains information on how to use these websites safely. It also looks into the issue of cyber bullying on both social networking sites and through using mobile phones.

24 Our People
We recognise that the working environment includes the
way in which the workload is managed as well as the physical conditions in which the work takes place.
As a leading Technology Solutions Provider, we believe that having a management ethos committed, within operational constraints, to addressing the needs and expectations of employees, is likely to contribute toward optimum business effectiveness.
Our approach is simple and supported by our family values.
Moreover, we are determined to fulfil our responsibilities to our employees.
We will endeavor to manage these in an effective manner, believing that a sound and demonstrable investment in our employees is, as a responsible business, a fundamental part of our success.
In addition, the company will constantly strive to encourage feedback from our employees, through online and offline feedback methods, in order to
enable their opinions to shape and improve the company in which they work and contribute to the success of.
All employees should have the benefit of a working environment that makes a positive contribution to their own sense of well-being, personal development and security.
Our People
SCC | Corporate Social Responsibility Report 2011
200members of staff and800
Within the last 2 years we have trained over
managers in the principles of Health
and Safety
25 Our People
SCC | Corporate Social Responsibility Report 2011
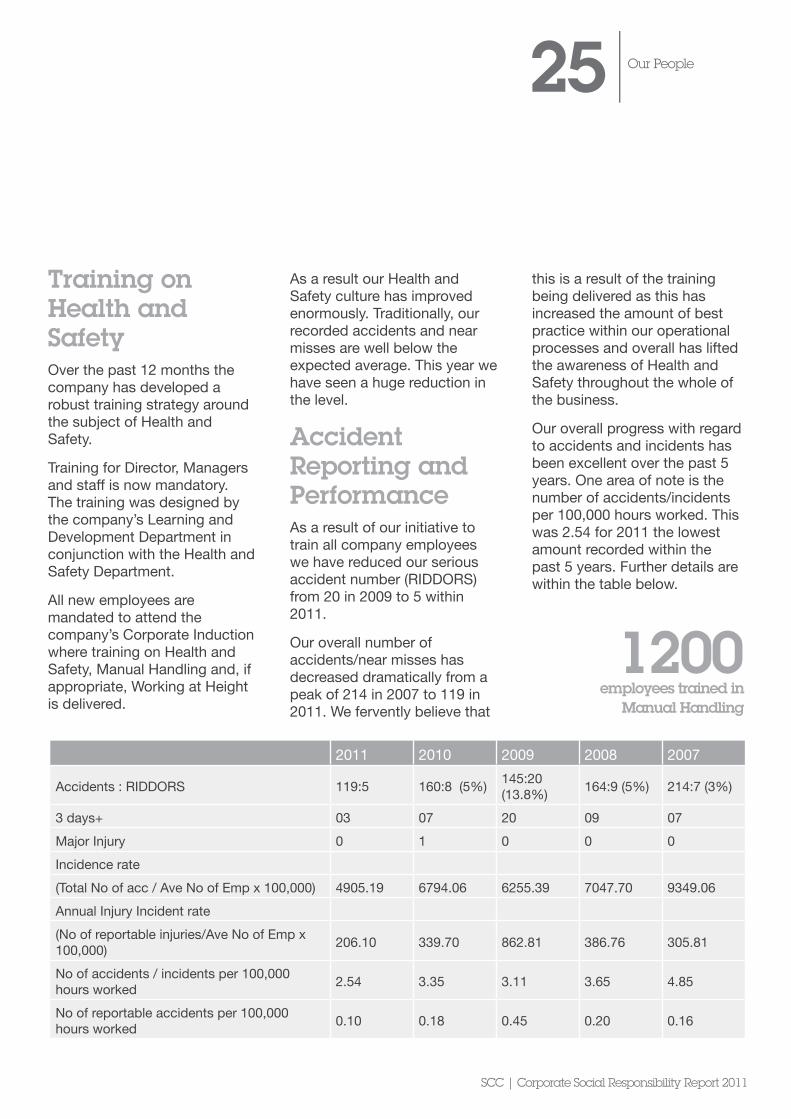
2011 2010 2009 2008 2007
Accidents : RIDDORS 119:5 160:8 (5%) 145:20 (13.8%) 164:9 (5%) 214:7 (3%)
3 days+ 03 07 20 09 07Major Injury 0 1 0 0 0Incidence rate(Total No of acc / Ave No of Emp x 100,000) 4905.19 6794.06 6255.39 7047.70 9349.06Annual Injury Incident rate (No of reportable injuries/Ave No of Emp x 100,000) 206.10 339.70 862.81 386.76 305.81
No of accidents / incidents per 100,000 hours worked 2.54 3.35 3.11 3.65 4.85
No of reportable accidents per 100,000 hours worked 0.10 0.18 0.45 0.20 0.16
Training on Health and SafetyOver the past 12 months the company has developed a robust training strategy around the subject of Health and Safety.
Training for Director, Managers and staff is now mandatory. The training was designed by the company’s Learning and Development Department in conjunction with the Health and Safety Department.
All new employees are mandated to attend the company’s Corporate Induction where training on Health and Safety, Manual Handling and, if appropriate, Working at Height is delivered.
As a result our Health and Safety culture has improved enormously. Traditionally, our recorded accidents and near misses are well below the expected average. This year we have seen a huge reduction in the level.
Accident Reporting and PerformanceAs a result of our initiative to train all company employees we have reduced our serious accident number (RIDDORS) from 20 in 2009 to 5 within 2011.
Our overall number of accidents/near misses has decreased dramatically from a peak of 214 in 2007 to 119 in 2011. We fervently believe that
this is a result of the training being delivered as this has increased the amount of best practice within our operational processes and overall has lifted the awareness of Health and Safety throughout the whole of the business.
Our overall progress with regard to accidents and incidents has been excellent over the past 5 years. One area of note is the number of accidents/incidents per 100,000 hours worked. This was 2.54 for 2011 the lowest amount recorded within the past 5 years. Further details are within the table below.
1200employees trained in
Manual Handling

26 Engaging the Workforce
Distance DietersAs part of our Building a Better Workplace policy we decided to focus on health and wellbeing of staff, particularly diet and nutritional awareness.
Consequently, we decided to employ the services of Distance Dieters to help individuals understand the subject of healthy diet and exercise as a means of increasing energy and productivity within the workplace.
The 12 week individually based programme was funded by the company. In 2011 50 members of staff took up the challenge.
Each member had the common goal of improving their health, energy and productivity in the workplace. Good health is important in the workplace as it enhances overall wellbeing, self- confidence and positivity.
Our overall aim was to address health by addressing food and diet, weight, energy and productivity. The programme gave a full understanding on how our body deals with food enables us to avoid the post-lunch, ‘graveyard shift’ slump and keep alert and energised throughout the day. Individuals were shown how
to manage their health, emotional wellbeing and weight by creating their own personal eating and exercise blueprint.
The results were impressive with 85% stating that they had:
• Attained their weight loss/weight gain goals
• Made the necessary changes to their diets to improve health, wellbeing and productivity
• Reported a marked increase in their energy making them productive throughout the working day and avoiding the afternoon downtime and energy slump
Engaging the Workforce
SCC | Corporate Social Responsibility Report 2011
The 12 week individually based programme was funded by the company

27 Engaging the Workforce
SCC | Corporate Social Responsibility Report 2011
As part of our initiative to promote better health amongst our staff, we signed up to take part in the Government’s Cycle-to-work scheme, giving all employees the opportunity to acquire a brand new bike and accessories up to the value of £1,000 completely tax, NI and VAT free. This has been a very successful scheme with a significant amount of employees’ now proud owners of brand new bikes that they use to cycle to work and keep fit.
Cycle-to-work scheme
The average cyclist saves
over £600 a year in car running costs
and burns over 8,391 calories cycling to work
each month
Technology Solutions Provider
United Kingdom
Headquarters, BirminghamJames House,Warwick Road,Birmingham,B11 2LETel: +44 (0) 121 766 7000
BelfastNella House,Units 1&2, Dargan Crescent,Belfast,BT3 9JPTel: +44 (0) 289 037 0160
Bracknell1 Arlington Square,Downshire Way,Bracknell,Berkshire,RG12 1WATel: +44 (0) 1344 409 800
Bristol9-10 Fountain Court,New Leaze,Bradley Stoke,Bristol,BS32 4LATel: +44 (0) 845 356 3041
GlasgowBlock 14, Unit A12,42 Coltness Lane,Queenslie Industrial Estate,Glasgow,G33 4DRTel: +44 (0) 141 774 7998
LeedsApplied House,Killingbeck Drive,York Road,Leeds,LS14 6UFTel: +44 (0)845 351 0683
LivingstonUnit 1, B2 Brewster Square,Brucefield Industrial Park,Livingston,EH54 9BJTel: +44 (0) 845 351 0986
LondonLevel 2, City Tower40 Basinghall Street,London, EC2V 5DETel: +44 (0) 845 355 0101
Newcastle Kings Court,Kingsway South,Team Valley Trading Estate,Gateshead,NE11 0SHTel: +44 (0) 845 357 0096
NottinghamThe Axis Building,Units 1&2, Edison VillageNottingham Science & Technology Park,Nottingham,NG7 2RFTel: +44 (0) 845 356 3042
Warrington710 Birchwood BoulevardBirchwood,Warrington,WA3 7QYTel: +44 (0) 845 351 0990
France
Head Office, Nanterre96 Rue des Trois Fontanot 92744 Nanterre CedexTel: +33 (0) 1 41 91 33 33
Netherlands
BodegravenTolnasingel 22411 PV BodegravenPostbus 532410 AB BodegravenTel: +31 (0) 172 634 200
Romania
IasiServices Romania, Niciman Street, 2 700521 Iasi,Jud. IasiRomania Tel: +40 33 24 03 030
Spain
Head Office, MadridAvenida de los Encuartes, 19 - 2ºC 28760 TRES CANTOS (Madrid)Telf: + 34 91 436 88 00
About SCCSCC is Europe’s largest independent technology solutions provider around the infrastructure, and is part of Specialist Computer Holdings (SCH) plc. The Group has regional operations in seven different countries, employs over 7,000 professional staff and has delivered sustained, profitable growth for some 36 years, with annual turnover exceeding £3 billion.
Long term partnerships with the world’s leading solutions providers combine with SCC’s services capabilities to create a rapid return on an investment in IT. It has an enviable track record of successfully helping European-based companies and Government organisations better manage their technology infrastructure, remove cost and create business advantage.
www.scc.com