corporate social responsibility: exploring …december 2018 corporate social responsibility:...
TRANSCRIPT

DECEMBER 2018
Corporate Social Responsibility: Exploring determinants and complementarities
GUILLAUME DELAUTRE BRUNO DANTE ABRIATA
ISSN 2306-0875
R E S E A R C H D E P A R T M E N T WORKING PAPER NO. 38


Research Department Working Paper No. 38
Corporate Social Responsibility: Exploring determinants and complementarities
Guillaume Delautre* Bruno Dante Abriata†
December 2018 International Labour Office
* Research Department, International Labour Organization (ILO). Corresponding author: [email protected] † Consultant. Email: [email protected]


Acknowledgements
The authors would like to thank Guillermo Montt (Research Department, ILO) and Konstantinos Papadakis (Governance Department, ILO) for their helpful and constructive comments that greatly contributed to improving this working paper, and the participants to the Brown Bag Lunch Seminar for their stimulating discussion. The authors are also grateful to Mauricio Gallardo Altamirano and Marco Fugazza, for their advice on methodological issues. The authors remain of course responsible for all errors contained in the text.
This research benefited from the financial support of the French government as part of the cooperation agreement between the French government and the ILO.

Abstract
In the last decades, the social responsibility of business has been a growing source of mobilization by public and private actors and debate among scholars. The objective of this analysis is twofold. First, it aims at complementing the literature on the economic and institutional determinants of companies’ commitment on this issue. To this purpose, we place a special emphasis on the institutional factors related to labour relations. Second, this article also analyses the diversity of firms’ policies through the lens of potential complementarity/substitutability between the different dimensions of CSR and the possible trade-offs between the various stakeholders. We argue that even if firms’ behaviours depend on their economic characteristics, institutions (especially those related labour relations) play an important role in its shaping. Besides, our results support the idea that CSR should be seen as a complement to strong social regulations. Additionally, our findings suggest that freedom of association and corporate governance might have a crosscutting positive influence on other dimensions of CSR. Regarding the effect on the firm's economic performance, we provide evidence that CSR dimensions related to internal employees have a positive effect, but we find little evidence about different dimensions complementing or substituting each other in this sense.

Table of contents
Acknowledgements ............................................................................................................................... v
Abstract ................................................................................................................................................. vi
Table of contents ................................................................................................................................. vii
List of equations, figures & tables .................................................................................................... viii
1. Introduction ................................................................................................................................... 1
2. Conceptual framework ................................................................................................................. 2
2.1 Why firms engage in Corporate Social Responsibility? ......................................................... 2
2.2 Why institutions matter in Corporate Social Responsibility? ................................................. 4
2.3 Looking for complementarities between the different CSR dimensions ................................ 6
2.4 Complementarity in CSR: three definitions ............................................................................ 7
3. Data and descriptive statistics ...................................................................................................... 8
3.1 Sources .................................................................................................................................... 8
3.2 Constructed and transformed variables ................................................................................. 11
3.3 Descriptive statistics ............................................................................................................. 12
4. Methodology and research design ............................................................................................. 13
4.1 Firm characteristics associated to engagement in labour-related CSR ................................. 13
4.2 Passive complementarity....................................................................................................... 15
4.3 Active complementarity ........................................................................................................ 15
4.4 Productive complementarity ................................................................................................. 17
5. Results .......................................................................................................................................... 19
5.1 Determinants ......................................................................................................................... 19
5.2 Passive complementarity....................................................................................................... 22
5.3 Active complementarity ........................................................................................................ 24
5.4 Productive complementarity ................................................................................................. 28
Conclusion and policy discussion....................................................................................................... 30
References ............................................................................................................................................ 33
Appendices ........................................................................................................................................... 38
Appendix A: Complete descriptive statistics ................................................................................ 38
Appendix B: Factor analysis ......................................................................................................... 41
Appendix C: Computation of Total Factor Productivity ............................................................... 42
Appendix D: Regression tables – active complementarity ........................................................... 43
Appendix E: Additional information on productive complementarity.......................................... 48
List of equations
Equation 1: Fractional Probit, firm characteristics associated to engagement in labour-related CSR 14 Equation 2: Linear models, firm characteristics associated to engagement in labour-related CSR .... 14 Equation 3: Linear models, effect of FOA and CGV on other subdimensions ................................... 16 Equation 4: Fractional response models, effect of FOA and CGV on other subdimensions ............... 17 Equation 5: Effect of CSR subdimensions and their interactions on productivity .............................. 18
List of figures
Figure 1: Impact of Respect of Freedom of Association on other subdimensions ............................... 25 Figure 2: Impact of Corporate Governance on other subdimensions ................................................... 26 Figure 3: Frequency distribution of pairwise correlations between all subdimensions ....................... 39
List of tables
Table 1: Weights of each subdimension in synthetic indicators of second stage ............................. 1111 Table 2: Determinants of internal CSR (INT) .................................................................................... 200 Table 3: Determinants of external CSR (EXT) .................................................................................. 211 Table 4: Factor analysis results, unrotated loadings ......................................................................... 2222 Table 5: Rotated factor loadings (pattern matrix) and unique variances .............................................. 22 Table 6: Productive complementarity .................................................................................................. 28 Table 7: Descriptive statistics – all variables ................................................................................... 3838 Table 8: Firms by sector – Disaggregated classification ...................................................................... 39 Table 9: Number of firms by sector – Aggregated classification ......................................................... 40 Table 10: Observations by year – FOA and CGV non-missing ......................................................... 400 Table 11: Impact of Freedom of Association on Non-Discrimination at Workplace........................... 43 Table 12: Impact of Freedom of Association on Health and Safety ................................................ 4444 Table 13: Impact of Freedom of Association on Social Factors in the Supply Chain ......................... 45 Table 14: Impact of Freedom of Association on Promotion of Social and Economic Development... 46 Table 15: Impact of Freedom of Association on Environmental Strategy ........................................... 47 Table 16: Information on SysGMM ..................................................................................................... 48

Corporate Social Responsibility: Exploring determinants and complementarities 1
1. Introduction
In the last decades, the social responsibility of business has been a growing source of debate and mobilization by public and private actors. Concerning labour issues, globalization and the expansion of global value chains in countries with weak regulating capacity have led to more social and environmental expectations from the civil society towards enterprises. An increasing number of companies responded to this pressure by taking more or less formalized commitments and communicating on their operations and values. Beyond reporting, CSR practices have often taken the form of private labour governance mechanisms, also known as private compliance initiatives (PCIs1), which first appeared in labour intensive sectors such as the garment, sportswear and electronics industries and expanded later in other sectors. These mechanisms might be led by individual enterprises, employers’ organizations or industry associations and for the most part rely on codes of conduct, social auditing, and certification or labelling.
The emergence of CSR has also been an intense issue of debate among scholars. However, until recently, most of the literature has considered CSR practices as a “black box” of external requirements which need to be justified from a purely economic perspective (Brammer et al, 2012). Therefore, this research has often been driven by (or in opposition to) agency theory (Jensen and Meckling, 1976) and tried to measure to what extent CSR was value-enhancing for the company. In recent years, this perspective has nevertheless been challenged by scholars from the institutional tradition. These authors have tried to explain the diversity in firms’ CSR practices by looking at the influence of institutions.
In this paper, we address the question of why forms and practices of corporate social responsibility (CSR) differ so much between firms. This paper follows a first article (Delautre, 2017) where we highlighted the relatively uneven practices according to country or origin, sector and other socioeconomic characteristics. We showed for example that companies originating from Western Europe clearly stand out as disclosing more voluntary effort in general and pointed out the selectivity of companies towards the various dimensions of labour-related CSR, and especially with regard to freedom of association.
We also try to complement the existing literature through two main research questions. First, what are the determinants of firms’ engagement in labour related issues? This part will explore the determinants of internal (targeted at internal employees) and external (targeted at external stakeholders) CSR commitments. In this purpose, we will complement the analysis of the specific characteristics of the firms (such as the size, sector etc.) with indicators related to the institutions of labour relations from their country of origin. Second, is it possible to identify complementarity or substitutability between the different dimensions of CSR? Here, the aim is to look specifically at the articulation between the labour-related CSR policies targeted at employees, and between these and the other dimensions targeted at external stakeholders (suppliers’ employees and local communities), the environment and the corporate governance (the shareholders). The issue of the articulation of CSR dimensions has generally been left aside in most of the literature until now. One of the few examples is however the study carried out by Cavaco and Crifo (2014) which explored the positive association of CSR practices with regard
1 ILO has defined PCIs as “private mechanisms voluntarily established by lead firms or groups of enterprises to monitor compliance with codes of conducts or other specific standards” (ILO: Decent work in global supply chains, Report IV, International Labour Conference, 105th session, Geneva, 2016)

2 ILO Working Paper No. 38
to firms’ economic performance.
The article starts with a presentation of the conceptual framework in which we make a critical review on how the issue of CSR has been considered by research in management studies and through institutional approaches in the last decades and we introduce the issue of complementarity between CSR dimensions. In this part, we define three different types of complementarity (passive, active and productive). Next, we present the database, the methodology developed by VigeoEiris and the variables. In section 4, we present and explain the empirical strategy, and then in section 5, we present and discuss the results. We argue that even if firms’ behaviours depend on their economic characteristics, institutions, and especially those related to labour relations, play an important role in its shaping and that CSR should be seen as a complement to strong social regulations. We also provide evidence that the different dimensions of CSR can be articulated in an effective way for all the stakeholders of the firm and for its economic performance. We conclude this article by discussing the main findings and by proposing avenues for further research.
2. Conceptual framework
2.1 Why firms engage in Corporate Social Responsibility?
Corporate Social Responsibility (CSR) has become in the last twenty years an intense issue of research in social sciences. However, as explained by Brammer et al. (2012), for many years, the discussion has been heavily driven by Milton Friedman’s well-known criticism considering executives responding to calls for socially responsible practices as theft, stealing money and resources from those considered as the real owners of the enterprises, i.e. the shareholders (Friedman, 1970). For many economists in accordance with agency theory (Jensen and Meckling, 1976), CSR has long been seen as an activity entailing two major risks for corporate resources: the misappropriation to unrightful claimants and the misallocation to inefficient activities (Margolis and Walsh, 2003). Most of the first empirical studies in the business literature derived from this starting point and has tried to take position on the economic value of CSR. This research tried to understand why companies engage in CSR but without calling into question the shareholder wealth maximisation paradigm. In most of this literature, CSR is also seen as a purely voluntary behaviour of companies which aims at improving the situation of different stakeholders (workers, suppliers, environment etc.) in ways that go beyond what companies are legally required to do.
As a consequence of looking for an antidote to scepticism towards corporate responsibility (Margolis and Walsh, 2003), empirical research has largely focused on searching for a positive relation between corporate social performance (CSP) and corporate financial performance (CFP). In other words, the idea was to know if CSR was value-enhancing for the company or not. Different direct or indirect mechanisms might link CSP and CFP. According to Turban and Greening (1997, 2000), a higher level of corporate social performance may provide a competitive advantage by attracting more applicants. These authors showed that job applicants have indeed a higher self-image when they work in a socially responsive firm. CSR can also be seen as an investment policy in human resources which helps to reduce the employees’ turnover rate, retain the best productive workers and reduce the risk of conflict over the long term (Jones, 2010 and Galbreath, 2010). Several researchers have pointed to reputation gains, arguing that public commitments made by companies might bring public relations benefits and give positive signals towards customers, investors and employees (Orlitzky et al, 2003), which would

Corporate Social Responsibility: Exploring determinants and complementarities 3
turn into positive economic outcomes over the long term. Nevertheless, this reputation strategy might differ sensibly from one sector to another or from one country to another and depend heavily on the degree of interest and knowledge of consumers2. Regarding more specifically labour related CSR, measures and programmes targeted at internal employees on health and safety or non-discrimination for example can also be considered as social investment with potential important impacts on productivity and economic performance in the medium or long term.
However, the results of the research linking CSP and CFP have been so far mixed. The meta-analysis carried out by Orlitzky et al. (2003) and later by Margolis and Walsh (2009) showed a small and positive relation between the two. According to Orlitzky et al, CSP and CFP are generally positively correlated across a wide variety of industries, this link being weaker when solely corporate environmental performance (CEP) is taken into account. With a larger dataset, Margolis et al. find a positive but small effect, especially when CFP is measured through accounting based measures. The direction of causation between CSP and CFP is nevertheless largely ambiguous in most of the studies. Allouche and Laroche (2005) pointed out the limits of many of econometric studies such as the heterogeneity in the measurement of CSP (largely due to the ambiguity of the concept) and CFP and the weak reliability of certain analysis due to limited datasets or questionable methods. Also, in a large majority of cases, these findings only concern at best companies from the developed economies3. Another major limit of this research trend is that it often misses the potential diversity of the CSR policies implemented by firms. These studies are indeed generally based on overall scoring indicators synthetizing very diverse information and the articulation of the labour, environmental and business dimensions in firms’ strategy are also rarely analysed.
In the same vein of research, many studies have tried to define the determinants of corporate social responsibility. Once again, the majority of these studies have primarily focused on the internal factors of the firms and based their analysis on the disclosure of CSR activities (such as reporting activities). Factors such as company size and profitability are generally seen as positively correlated with CSR disclosure which can also depend on the industry (Fifka, 2013). However, when the political or cultural factors are taken into account, the CSR disclosure agenda of firms vary quite substantially. Ali et al. (2017) found important differences between countries according to their level of development. In developed countries, firms’ behaviour is largely influenced by specific stakeholders such as regulators, shareholders and civil society, while in developing countries, CSR policy can be more heavily influenced by foreign stakeholders such as international buyers, foreign investors, international media, and international regulatory bodies.
2 There is no doubt for instance that the collapse of the Rana Plaza factory in Bangladesh in 2013 has increased significantly the level of awareness of European and North-American consumers on the risks faced by workers in the garment sector’s supply chains.
3 A large majority of the empirical research is based on the methodology and dataset developed by KLD which only covers US firms. Due to limited data availability, the relationship between CSR and economic performance is for example under-analysed in developing countries. The research carried out by Kapoor and Sandhu (2010) which found a positive impact of CSR on corporate profitability on a panel of 93 companies operating in India is one of the exceptions.

4 ILO Working Paper No. 38
2.2 Why institutions matter in Corporate Social Responsibility?
This finding encourages us to better take into account the institutional aspect of CSR policies. Influenced by Mark Granovetter’s seminal work on the social embeddedness of markets (1985), another perspective on CSR has emerged since the 2000’s which aimed at analysing the role of institutions on the behaviour of companies and its diversity (Brammer et al, 2012). For these researchers, firms’ practices in terms of CSR must be analysed with regard to their institutional ecosystems (not only formal institutions, such as laws, trade unions and civil society groups, but also informal institutions such as religious norms, consumption practices and cultural traditions). From this perspective, CSR should be resituated in a social space (or a grey zone) between voluntary practices and socially binding responsibilities. According to Campbell (2007), a broad set of institutional elements should be taken into account when analysing the diversity of CSR policies, from the regulatory conditions to the role of private actors and labour institutions.
In this paper, we focus our analysis on labour related CSR issues. In this specific case, several institutional elements must be taken into account when analysing the diversity and the level of commitments of companies. The first element is of course the role of public authorities, which directly imposes constraints to firms by defining and imposing a series of (minimal) social norms. However, according to Hendrickx et al (2016), labour governance is in a process of increasing complexity where standards and instruments of different origins (public or private but also national or international) and natures (promotion, incentive and mandatory) are interacting at the global level. Public authorities can also seek to influence firms’ practices through non-binding instruments. At the global level, several initiatives have been taken in order to provide guidance to firms in the elaboration and implementation of the different dimensions of their CSR policy4.
In recent years, national or regional authorities have also taken legislative initiatives which go further the pure promotion of CSR practices by requiring the enterprises to publicly disclose information on specific aspects of their operations. Some of these initiatives explicitly rely on the purchasing decisions of better informed consumers and investors in order to draw focus to labour rights and working conditions (Philips et al, 2018). This is the case of the United Kingdom Modern Slavery Act and the California Transparency in Supply Chain Act which put a special emphasis on forced labour and human trafficking issues. Other public initiatives seek to have better informed investors and shareholders on the social and environmental externalities of the company in order to lead them towards more sustainable investment. For example, the European Union has taken a directive in 2014 which requires public entities with an average of at least 500 employees to prepare a non-financial statement as a part of their annual report. In China, the Stock Regulatory Commission (CSRC) has also taken measures since 2008 to make CSR reporting mandatory for certain listed companies. This type of mandatory regulation seems to have significant effects on the quantity and the quality of disclosure by companies (Ioannou and Serafeim, 2015)5. Finally, and in a complementary perspective, several public authorities have also taken initiatives which explicitly aim at better conciliating the interests of the various
4 The most referenced international instruments are the UN Guiding Principles on Business and Human Rights (2011), the ILO Tripartite Declaration on MNEs (four versions since 19774), and the OECD Guidelines for Multinational Enterprises (seven versions since 1976) and the UN Global Compact (2000).
5 The research made on the Chinese case tend to show that the qualitative and quantitative effects of this legislation on companies is widely affected by the type of dependence of the companies towards the government (Marquis and Qian, 2014, Wang et al, 2017).
Corporate Social Responsibility: Exploring determinants and complementarities 5
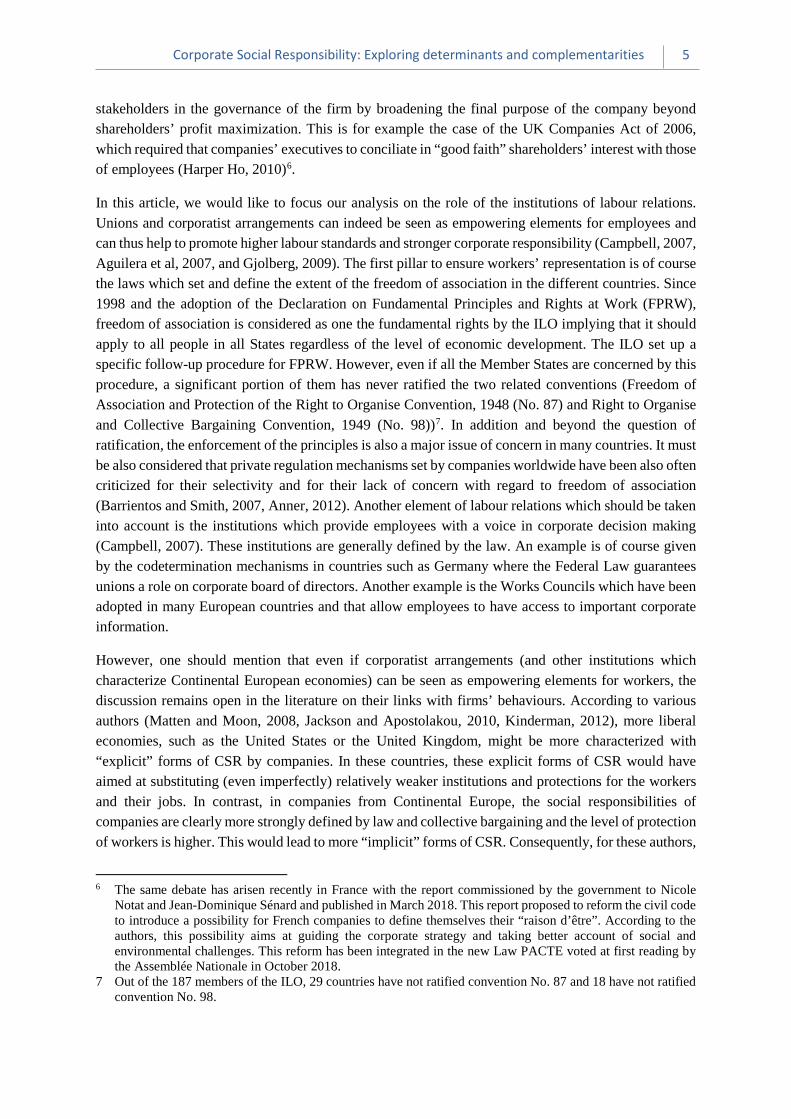
stakeholders in the governance of the firm by broadening the final purpose of the company beyond shareholders’ profit maximization. This is for example the case of the UK Companies Act of 2006, which required that companies’ executives to conciliate in “good faith” shareholders’ interest with those of employees (Harper Ho, 2010)6.
In this article, we would like to focus our analysis on the role of the institutions of labour relations. Unions and corporatist arrangements can indeed be seen as empowering elements for employees and can thus help to promote higher labour standards and stronger corporate responsibility (Campbell, 2007, Aguilera et al, 2007, and Gjolberg, 2009). The first pillar to ensure workers’ representation is of course the laws which set and define the extent of the freedom of association in the different countries. Since 1998 and the adoption of the Declaration on Fundamental Principles and Rights at Work (FPRW), freedom of association is considered as one the fundamental rights by the ILO implying that it should apply to all people in all States regardless of the level of economic development. The ILO set up a specific follow-up procedure for FPRW. However, even if all the Member States are concerned by this procedure, a significant portion of them has never ratified the two related conventions (Freedom of Association and Protection of the Right to Organise Convention, 1948 (No. 87) and Right to Organise and Collective Bargaining Convention, 1949 (No. 98))7. In addition and beyond the question of ratification, the enforcement of the principles is also a major issue of concern in many countries. It must be also considered that private regulation mechanisms set by companies worldwide have been also often criticized for their selectivity and for their lack of concern with regard to freedom of association (Barrientos and Smith, 2007, Anner, 2012). Another element of labour relations which should be taken into account is the institutions which provide employees with a voice in corporate decision making (Campbell, 2007). These institutions are generally defined by the law. An example is of course given by the codetermination mechanisms in countries such as Germany where the Federal Law guarantees unions a role on corporate board of directors. Another example is the Works Councils which have been adopted in many European countries and that allow employees to have access to important corporate information.
However, one should mention that even if corporatist arrangements (and other institutions which characterize Continental European economies) can be seen as empowering elements for workers, the discussion remains open in the literature on their links with firms’ behaviours. According to various authors (Matten and Moon, 2008, Jackson and Apostolakou, 2010, Kinderman, 2012), more liberal economies, such as the United States or the United Kingdom, might be more characterized with “explicit” forms of CSR by companies. In these countries, these explicit forms of CSR would have aimed at substituting (even imperfectly) relatively weaker institutions and protections for the workers and their jobs. In contrast, in companies from Continental Europe, the social responsibilities of companies are clearly more strongly defined by law and collective bargaining and the level of protection of workers is higher. This would lead to more “implicit” forms of CSR. Consequently, for these authors,
6 The same debate has arisen recently in France with the report commissioned by the government to Nicole Notat and Jean-Dominique Sénard and published in March 2018. This report proposed to reform the civil code to introduce a possibility for French companies to define themselves their “raison d’être”. According to the authors, this possibility aims at guiding the corporate strategy and taking better account of social and environmental challenges. This reform has been integrated in the new Law PACTE voted at first reading by the Assemblée Nationale in October 2018.
7 Out of the 187 members of the ILO, 29 countries have not ratified convention No. 87 and 18 have not ratified convention No. 98.
6 ILO Working Paper No. 38
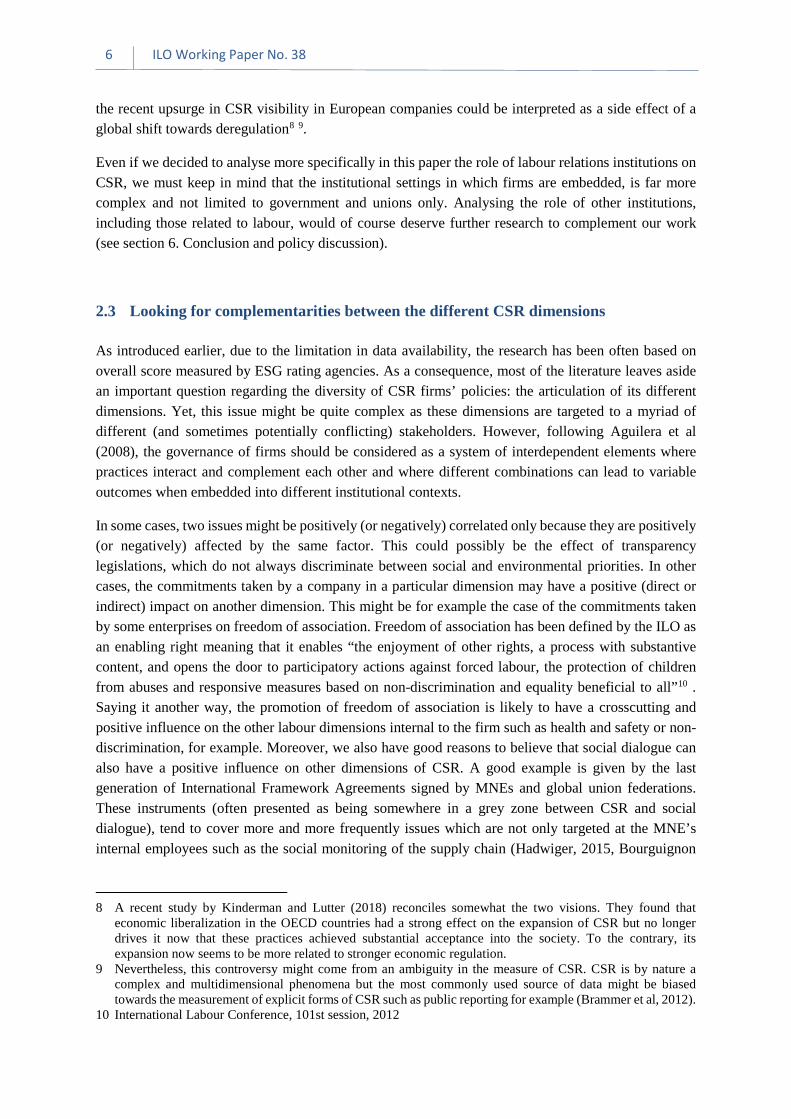
the recent upsurge in CSR visibility in European companies could be interpreted as a side effect of a global shift towards deregulation8 9.
Even if we decided to analyse more specifically in this paper the role of labour relations institutions on CSR, we must keep in mind that the institutional settings in which firms are embedded, is far more complex and not limited to government and unions only. Analysing the role of other institutions, including those related to labour, would of course deserve further research to complement our work (see section 6. Conclusion and policy discussion).
2.3 Looking for complementarities between the different CSR dimensions
As introduced earlier, due to the limitation in data availability, the research has been often based on overall score measured by ESG rating agencies. As a consequence, most of the literature leaves aside an important question regarding the diversity of CSR firms’ policies: the articulation of its different dimensions. Yet, this issue might be quite complex as these dimensions are targeted to a myriad of different (and sometimes potentially conflicting) stakeholders. However, following Aguilera et al (2008), the governance of firms should be considered as a system of interdependent elements where practices interact and complement each other and where different combinations can lead to variable outcomes when embedded into different institutional contexts.
In some cases, two issues might be positively (or negatively) correlated only because they are positively (or negatively) affected by the same factor. This could possibly be the effect of transparency legislations, which do not always discriminate between social and environmental priorities. In other cases, the commitments taken by a company in a particular dimension may have a positive (direct or indirect) impact on another dimension. This might be for example the case of the commitments taken by some enterprises on freedom of association. Freedom of association has been defined by the ILO as an enabling right meaning that it enables “the enjoyment of other rights, a process with substantive content, and opens the door to participatory actions against forced labour, the protection of children from abuses and responsive measures based on non-discrimination and equality beneficial to all”10 . Saying it another way, the promotion of freedom of association is likely to have a crosscutting and positive influence on the other labour dimensions internal to the firm such as health and safety or non-discrimination, for example. Moreover, we also have good reasons to believe that social dialogue can also have a positive influence on other dimensions of CSR. A good example is given by the last generation of International Framework Agreements signed by MNEs and global union federations. These instruments (often presented as being somewhere in a grey zone between CSR and social dialogue), tend to cover more and more frequently issues which are not only targeted at the MNE’s internal employees such as the social monitoring of the supply chain (Hadwiger, 2015, Bourguignon
8 A recent study by Kinderman and Lutter (2018) reconciles somewhat the two visions. They found that economic liberalization in the OECD countries had a strong effect on the expansion of CSR but no longer drives it now that these practices achieved substantial acceptance into the society. To the contrary, its expansion now seems to be more related to stronger economic regulation.
9 Nevertheless, this controversy might come from an ambiguity in the measure of CSR. CSR is by nature a complex and multidimensional phenomena but the most commonly used source of data might be biased towards the measurement of explicit forms of CSR such as public reporting for example (Brammer et al, 2012).
10 International Labour Conference, 101st session, 2012

Corporate Social Responsibility: Exploring determinants and complementarities 7
and Mias, 2018) and the environmental impact of the company (ILO, 2018).
In addition, it is also interesting to analyse the impact of different patterns or combinations of CSR policies on firms’ performance. In one of the very few studies exploring the issue of the complementarity and substitutability between the various CSR dimensions at the firm level, Cavaco and Crifo (2014) made an attempt to go beyond the absence of consensus in business literature on the relationship between social and economic performances. Using the same data than us, these authors managed to show that, for a sample of European companies, some forms of socially responsible behaviour are positively associated with firm performance while others are not. Human resources and business behaviour towards customers and suppliers appear as relative complements in terms of performance while environment and business behaviours seem to be relatively substitutable.
The link between labour related CSR dimensions and the practices aimed at strengthening the control of shareholders on firms’ governance also deserves a special attention. Following VigeoEiris framework, we classify these practices as “corporate governance” (CGV) practices in the balance of this article11. As we have seen before from a pure agency theory perspective, CSR and corporate governance appear as two contradictory purposes. Indeed, for these academics, corporate governance mechanisms aim at preventing the misuse of corporate’s resources towards ineffective purposes, such as CSR initiatives. This theoretical perspective has been nevertheless challenged by Harjoto and Jo (2011) who found that if CSR engagement can be explained in some cases by misinvestment, in general, the major rational for it is conflict resolution between managers and non-investing stakeholders. Besides, CSR is positively associated with good governance characteristics, such as board independence. According to these authors, the conflict resolution role of CSR is even fruitful as it helps to enhance the operating performance and firm value. The same authors have later found that the direction of the causality goes from corporate governance towards CSR (Jo and Harjoto, 2012)12.
2.4 Complementarity in CSR: three definitions
According to the Oxford Dictionary (Oxford University Press, 2018), complementarity is “a relationship or situation in which two or more different things improve or emphasize each other's qualities.” Then, in terms of firms’ CSR policies, we can interpret it as the relationship between different CSR actions in which they mutually reinforce each other’s benefits to any of the firm’s stakeholders, whose interests comprehend economic, institutional, social and environmental issues. This definition is very close to the one suggested by Aguilera et al (2008)13. In light of the literature reviewed and the available data, we propose to consider three different types of complementarity (when relations are positive) or substitutability (negative):
- “Passive”, when changes in a certain subdimension are correlated with changes in another one because of some force driving managers to make simultaneous changes in both of them at the same time;
11 Even if CGV practices are not usually considered as part of CSR, we argue that they can be considered as provisions targeted especially at one of the firm’s stakeholders, the shareholders.
12 Similar results have been found by Ferrell et al. (2017) who showed that CSR is generally associated with tighter cash constraints and better connection between managerial pay and performance. CSR is also related to legal protection of shareholders rights and protection of minority shareholders.
13 According to these authors, “complementarities refer to the overall bundles of practices that are aligned to mutually enhance the ability to achieve effective corporate governance”.

8 ILO Working Paper No. 38
- “Active”, when there is a direct causal relation between changes in two different subdimensions; and
- “Productive”, when the two subdimensions have a joint impact on firms’ performance, and which in turn can be characterized as: 1) Partial, when the joint impact is greater than the individual ones but smaller than the sum of them. It is a case of “decreasing returns” to CSR, possibly because the different subdimensions affect productivity through the same channel; 2) Additive, when the joint impact equals the sum of individual effects, suggesting that the channels through which they impact are independent; 3) Synergic (only for complementarity), when the joint impact is positive and higher than the sum of individual effects, so that one subdimension reinforces the effect of the other one, or 4) Antagonic (only for substitutability), when the joint impact is negative and lower than the sum of individual effects and 5) Irrelevant or inexistent, in all other cases.
Regarding productive complementarity, it is worth noting that it adds a new insight to the existing literature. So far, empirical work has focused on the joint effect of different CSR actions on the firm’s financial performance. Here, we focus on productivity instead, which entails some major differences with the financial approach. In fact, while the impact of CSR on profits (ROA and ROI) or market perception of firm performance (Tobin’s Q) is relevant mainly for shareholders and other investors, the impact on TFP will be relevant for a broader set of stakeholders since it will mean that CSR adds value (or generates costs) that can be appropriated (or will be shared) by many different type of stakeholders. For instance, in the case of a positive impact, the surplus could be appropriated by shareholders through greater profits, workers through greater wages, government through tax collection or the community through greater involvement by the firm in local development.
3. Data and descriptive statistics
3.1 Sources
We rely on the data provided by the social rating agency VigeoEiris, which covers more than 3,000 of the most capitalized companies listed on the stock market worldwide. VigeoEiris provides scores to investors and assets managers on six macro-domains (Human rights, Human resources, Business Behavior, Corporate Governance, Environment and Community Involvement) subdivided in 38 sub-dimensions (for a detailed presentation of VigeoEiris data, please refer to Delautre, 2017). VigeoEiris promotes a relatively “normative” approach to CSR, which assesses firms' accountability with regard to international standards, among them ILO conventions (Zarlowski, 2007). Additionally, it provides a sector classification of which we make use when needing a relatively high level of disaggregation (see APPENDIX A)14.
14 We make use of all the sector classifications in the Factset database in order to fill missing values in VigeoEiris’ sector classification. As a result, the original sector variable also suffers certain changes because some sectors are redefined in order to match the information from the other classifications.

Corporate Social Responsibility: Exploring determinants and complementarities 9
For each subdimension15, VigeoEiris provides three kinds of sub-scores, established on a scale from 0 to 100: 1) the level of commitments (known as “leadership” in VigeoEiris methodology), measuring their visibility, exhaustiveness and degree of ownership by the company; 2) the level of implementation of these commitments, measuring their means, coverage and scope; and 3) the results measured through indicators, stakeholders’ feedback and company responsiveness to public controversies. For methodological matters, our analysis relies on the two first scores only (commitments and implementation). We are not using the scores related to results because we consider indeed that the public nature of the information (especially on controversies) used to calculate the scores may introduce a bias that could bring into question the comparability of the data. This information relies primarily on the capacity for workers and other stakeholders to activate freedom of association or press freedom (and more generally the rule of law) which is not unfortunately possible everywhere in the world.
To assess the determinants of engagement in CSR and the assessment of active and productive complementarities, we retain ten subdimensions. The five core subdimensions in our analysis are labour-related. Three of them are targeted to internal stakeholders (freedom of association, non-discrimination at the workplace and health and safety) and two are targeted at external ones (integration of social criteria in the monitoring of the supply chain and promotion of social and economic development). This list is completed by five other subdimensions which will allow us to explore the issue of complementarities. Four of them have to do with corporate governance, more specifically to accountability towards shareholders and the last one is the sub-domain “environmental strategy”, which assesses the quality of the commitments defining clear objectives and appropriate measures to ensure management of the environmental impacts of the company’s products and services16.
In the analysis of passive complementarity only, we retain six additional subdimensions. Three of them are related to labour (Promotion of Labour Relations, Responsible Management of Restructurings, and Career Management), two are associated to environment (Integration of Environmental Factors in the Supply Chain and Minimising Environmental Impacts from Energy Use), and the last one has to do with transparency (Prevention of Corruption). We do not go deeper into these six subdimensions since the main reason for retaining them is that factor analysis is relevant when there are a relatively large number of highly correlated variables.
We also use data from Factset 2015. This allows us to complete the dataset with indicators on firms’ characteristics and to calculate total factor productivity as performance indicator. More specifically, we make use of the following variables: total number of employees, value of assets (total and domestic), labour related expenses, operating income before depreciation, total equity, age and sector. Regarding
15 The computation of the scores has several stages and has an important impact in our empirical approach. The first one is the “activation” of subdimensions in each sector according to their relevance in terms of nature, exposure and corporate risk. Then, the data is obtained by surveying firms that answer standardized forms containing binary response questions. Out of 100, scores above 60 are considered “Advanced”, between 50 and 60 “Robust”, 30-50 “Limited”, and below 30 “Weak”. Hence, this process affects our empirical strategies in two ways: first, by reducing sample size because the subdimensions that are not activated for a certain firm represent a missing value, and second, leading us to consider the CSR indicators as fractional variables as they are the result of averaging across ratios with possible values between 0 and 1.
16 Other indicators belonging to the environmental dimension were excluded because of methodological reasons. Most of them had a relatively low number of non-missing values and their inclusion would lead to a major shrinkage of the sample size when running regressions. The selected subdimension, Environmental Strategy, on the contrary, has enough non-missing values and is highly correlated with all the other sub-domains in its dimension.

10 ILO Working Paper No. 38
the latter, we rely on the “sectorid” variable when needing a relatively aggregated sector classification17.
Following the discussion in the previous section on the role of labour relations institutions, we propose to complete the database with information related to the quality and the institutions of labour relations in the country of origin of the company. The first information is provided by the labour rights indicators by Kucera and Sari (2016), which measures trade union rights at the country level. This indicator, 𝐿𝐿𝐿𝐿𝐿𝐿𝐿𝐿𝐿𝐿𝐿𝐿_𝑅𝑅𝑅𝑅𝑅𝑅ℎ𝑡𝑡𝑡𝑡, takes into account at the same time the violation in law, i.e. the degree of conformity of the national legislation with the rights to freedom of association and collective bargaining as defined by the ILO, and in practice, i.e. the number and the severity of the acts committed in violation to these rights. This index is based on the coding of violations in textual sources from the ILO supervisory system, national legislations and other related reports. In addition, we also retained for the analysis two indicators from the CBR dataset on Labour Regulation Indexes (Adams, Bishop, & Deakin, 2016), which provides data on labour laws in 117 countries from the 1970s to the present day. The regulation is coded and scores (from 0, in case of absence of protection to workers, to 1, in case of the highest level of protection) are calculated. The indicators (variables 3018 and 3119 in the aforementioned paper) have to do with codetermination, and they evaluate the right for workers to nominate board-level directors and the obligation regarding information and consultation of workers.
17 As in the previous case, we also rely on the VigeoEiris variable as well as on the other Factset sector classifications in order to fill missing values; as a result, the original “sectorid” variable also suffers certain changes due to modifications in the definitions of sectors.
18 “Equals 1 if the law gives unions and/or workers the right to nominate board-level directors in companies of a certain size. Equals 0 otherwise. Scope for further gradations between 0 and 1 to reflect changes in the strength of the law” (Adams, Bishop, & Deakin, 2016).
19 “Equals 1 if the works councils or enterprise committees have legal powers of co-decision making. Equals 0.67 if works councils or enterprise committees must be provided by law under certain conditions but do not have the power of co-decision making. Equals 0.5 if works councils or enterprise committees may be required by law unless the employer can point to alternative or pre-existing alternative arrangements. Equals 0.33 if the law provides for information and consultation of workers or worker representatives on certain matters but where there is no obligation to maintain a works council or enterprise committee as a standing body. Equals 0 otherwise. Scope for further gradations between 0 and 1 to reflect changes in the strength of the law” (Adams, Bishop, & Deakin, 2016).

Corporate Social Responsibility: Exploring determinants and complementarities 11
3.2 Constructed and transformed variables
Our work makes use of several constructed indicators. The objective is threefold. First of all, several steps of the research design require data which are not directly available but that can be extracted or approximated using information from directly available data. Second, constructed indicators, when they condense information from two or more variables into a single one, they help increase validity of results in regression procedures by reducing the number of instruments. And third, also by condensing information, constructed indicators narrow down the scope of the research when there are a great number of variables of interest available.
Table 1: Weights of each subdimension in synthetic indicators of second stage
Synthetic Indicator Subdimension Weight
INTERNAL CSR (INT) Respect of Freedom of Association (FOA) 31.3% Non Discrimination at Place of Work (ND) 33.6% Improvement of Health and Safety (HS) 35.1%
EXTERNAL CSR (EXT) Promotion of Social and Economic Development (PSED) 50.0%
Integration of Social Factors in Supply Chain (SSC) 50.0%
CORPORATE GOVERNANCE (CGV)
Board of Directors 25.0% Audit and Control 28.4% Shareholders 17.7% Executives Remuneration 28.9%
CSR subdimensions are subject to two stages of aggregation in order to obtain constructed variables. As a general technique we use PCA (Principal Components Analysis) because we are trying to synthetize the information from several indicators into a single one. The first stage occurs between “angles” within each of the 38 CSR subdimensions. This means that, for each subdimension, we perform a PCA using the values for Leadership and Implementation20. The second stage occurs across CSR subdimensions. As seen in Table 1, we perform PCA on three groups of variables in order to obtain three synthetic CSR indicators: 𝐼𝐼𝐼𝐼𝐼𝐼, 𝐸𝐸𝐸𝐸𝐼𝐼 and 𝐶𝐶𝐺𝐺𝐺𝐺. The first one corresponds to issues targeted at companies’ internal employees and aggregates freedom of association (𝐹𝐹𝐹𝐹𝐹𝐹), non-discrimination (𝐼𝐼𝑁𝑁) and health and safety (𝐻𝐻𝐻𝐻). The second one expresses social issues targeted at external stakeholders such as workers in the supply chain (𝐻𝐻𝐻𝐻𝐶𝐶) and local communities (𝑃𝑃𝐻𝐻𝐸𝐸𝑁𝑁). The third one corresponds to corporate governance and synthetizes all the four subdimensions taking part in the CGV domain (Board of Directors, Audit and Internal Controls, Shareholders, and Executive Remuneration) according to the VigeoEiris methodology.
We also synthetize the information obtained from the CBR dataset. The two aforementioned indicators are converted into a single synthetic indicator through simple averaging21. Variables 30 (Codetermination: board membership) and 31 (Codetermination and information/consultation of workers) are synthetized into 𝐶𝐶𝐿𝐿𝐶𝐶𝐶𝐶𝑡𝑡𝐶𝐶𝐿𝐿𝐶𝐶𝑅𝑅𝐶𝐶𝐿𝐿𝑡𝑡𝑅𝑅𝐿𝐿𝐶𝐶, an indicator of de jure workers’ participation rights in the firm.
Some of the potential determinants of CSR are also constructed. The degree of internationalization of the firm’s assets, 𝐼𝐼𝐶𝐶𝑡𝑡𝐼𝐼𝐹𝐹𝑡𝑡𝑡𝑡𝐶𝐶𝑡𝑡𝑡𝑡, is computed as 𝐼𝐼𝐶𝐶𝑡𝑡𝐼𝐼𝐹𝐹𝑡𝑡𝑡𝑡𝐶𝐶𝑡𝑡𝑡𝑡 = 1 − (𝑁𝑁𝐿𝐿𝐶𝐶𝐶𝐶𝑡𝑡𝑡𝑡𝑅𝑅𝐷𝐷 𝐹𝐹𝑡𝑡𝑡𝑡𝐶𝐶𝑡𝑡𝑡𝑡 𝐼𝐼𝐿𝐿𝑡𝑡𝐿𝐿𝑇𝑇 𝐹𝐹𝑡𝑡𝑡𝑡𝐶𝐶𝑡𝑡𝑡𝑡⁄ ).
20 Since we have only these two angles, the procedure is equivalent to computing their (non-weighted) average. As a result, we obtain the synthetic indicator for each subdimension.
21 Because, as we mentioned before, when there are only two variables, it is the same as a PCA.

12 ILO Working Paper No. 38
As for equity growth, 𝑅𝑅, it is computed as a growth rate, 𝑅𝑅 = 𝑇𝑇𝐿𝐿𝑅𝑅(𝐸𝐸𝐸𝐸𝐿𝐿𝑅𝑅𝑡𝑡𝐸𝐸𝑡𝑡)− 𝑇𝑇𝐿𝐿𝑅𝑅(𝐸𝐸𝐸𝐸𝐿𝐿𝑅𝑅𝑡𝑡𝐸𝐸𝑡𝑡−1).
Additionally, we construct 𝐼𝐼𝐹𝐹𝑃𝑃, a variable that approximates total factor productivity. We use Factset data on labour expenses, net income, assets and number of employees in order to compute productivity as a “Solow residual”. Firm value added at a certain year is computed as the sum of operating income before depreciation and labour expenditures and then regressed on capital (measured by assets) and labour (number of employees) and the residual is captured and interpreted as TFP. This regression is performed separately for each sector in order to account for heterogeneity in capital/labour ratios. Detailed explanations and formulae are presented in APPENDIX C.
It is also worth giving details on the way we use 𝐿𝐿𝐿𝐿𝐿𝐿𝐿𝐿𝐿𝐿𝐿𝐿_𝑅𝑅𝑅𝑅𝑅𝑅ℎ𝑡𝑡𝑡𝑡. First of all, since the indicator only presents values for 2012 and 2015, and since within variation across time is negligible, we use a “Between” approach: computing each country average and allocating it to every year. Additionally, for interpretation purposes, we also apply a linear transformation to the original score. As it ranges between 0 (no violations, best score) and 10 (maximum violations, worst possible score), we turn into a score that increases as situation improves (violations decrease) and rescale it so that the bounds are between 0 and 1. Let 𝐿𝐿𝐿𝐿𝐿𝐿𝐿𝐿𝐿𝐿𝐿𝐿_𝑅𝑅𝑅𝑅𝑅𝑅ℎ𝑡𝑡𝑡𝑡𝑜𝑜𝑜𝑜𝑜𝑜𝑜𝑜 be the original score, then we transform it into 𝐿𝐿𝐿𝐿𝐿𝐿𝐿𝐿𝐿𝐿𝐿𝐿_𝑅𝑅𝑅𝑅𝑅𝑅ℎ𝑡𝑡𝑡𝑡 = 1 −�𝐿𝐿𝐿𝐿𝐿𝐿𝐿𝐿𝐿𝐿𝐿𝐿_𝑅𝑅𝑅𝑅𝑅𝑅ℎ𝑡𝑡𝑡𝑡𝑜𝑜𝑜𝑜𝑜𝑜𝑜𝑜 10⁄ �.
3.3 Descriptive statistics
Our dataset consists of a panel of 3,126 firms along 31 years (1986-2016). This number of firms is determined by the possibility of identifying each firm simultaneously in the VigeoEiris and the Factset datasets. As for the time span, it is determined by the oldest and newest observations available among Factset (going from 1986 to 2015) and VigeoEiris (2003 to 2016) data, resulting in a panel ranging across 31 years. Table 9 shows the main descriptive statistics.
The panel is strongly unbalanced. In the VigeoEiris data, for instance, variables related to corporate governance can have as twice as much non-missing values as the ones related to supply chain behaviour. By definition, the activation of this last indicator depends on the complexity and the nature of supply chains in each sector. In several sectors such as Banking or IT services, this issue is consequently not examined. Additionally, each firm presents on average less than four non-missing values along 14 years, partly because, for most firms, observations are (presumably) reported every two years. Factset data presents some major unbalances as well, due to missing observations for labour expenditures and implausible values for domestic sales and domestic assets as they were greater than total sales and assets, respectively, or also negative, so that they were eliminated. Data from the CBR Labour Regulation Index (Adams, Bishop, & Deakin, 2016) are almost fully complete since they correspond to the country level and are available for every year between 1970 and 2013. Data on labour rights by Kucera and Sari (2016), as mentioned, are only available for 2012 and 2015, so that their observation count is comparatively very low.
The data also shows clearly that most variation happens among firms rather than within. When computing the ratio of between-variance to within-variance, all but one variable (Age22) present values
22 This is logical to happen because of the panel dimensions (3,126) and the way that Age was constructed, that restrains maximum age to 29.

Corporate Social Responsibility: Exploring determinants and complementarities 13
higher than 1, actually ranging between 1.48 and 74.0523, with a median of 3.73 and a mean of 6.00. For VigeoEiris scoring data, this ratio is always greater than 3.10. This pattern is also observed in the transformed and constructed variables. This is an important matter for the empirical design, since it indicates that models focusing on between-variation should not be neglected.
The other notable feature of the data is the high correlation among all CSR subdimensions. We compute the 630 feasible pairwise correlation coefficients between 36 subdimensions and plot them as a histogram in Figure 3. All the coefficients are positive and significant at 1%, and half of them are above 0.46. This suggests that, besides the causal relations between the different subdimensions of CSR, there might be common forces affecting many subdimensions simultaneously. In fact, this setting of high correlations should be suitable for a Factor Analysis, as we explain in the following section.
4. Methodology and research design
Drawing on the research findings presented earlier, the aim of our analysis is twofold. By focusing mainly on labour-related CSR dimensions, it aims at complementing the literature on the determinants of firms’ engagement. The specific characteristics of the firms such as the size and the sector will be taken into account but we will also complement the analysis with institutional factors related to labour rights. This article also aims at analysing the diversity of firms’ policies through the lens of the potential of complementarity/substitutability between the different CSR dimensions. In this regard, we will focus our attention on the articulation between the different labour-related CSR policies targeted at internal stakeholders (the employees), and also between these and three other dimensions: the labour-related CSR policies targeted at external stakeholders (suppliers’ employees and local communities), the environment and the corporate governance (the shareholders).
4.1 Firm characteristics associated to engagement in labour-related CSR
We first seek to identify the firms’ characteristics that are associated with higher scores in our synthetic indicators, INT and EXT. To this end, these indicators are regressed on a set of relevant firm attributes. Papke and Wooldridge (1996) point out that, in such cases, linear regression models can lead to prediction out of the bounds, so that we make use fractional Probit (‘FP’) regressions as descripted below, using the Stata®24 command fracglm (Williams, 2009).
It is important to make a clarification regarding the use of this command. As it requires that the values of the dependent variable belong to the [0;1] segment, we divide it by 100. After the regression, the marginal coefficients are divided by the standard deviation of the dependent variable, so that the coefficients are expressed in number of standard deviations.
23 The highest value is an outlier and corresponds to 𝐿𝐿𝐿𝐿𝐿𝐿𝐿𝐿𝐿𝐿𝐿𝐿_𝑅𝑅𝑅𝑅𝑅𝑅ℎ𝑡𝑡𝑡𝑡. Although institutional settings tend to be very stable, this ratio is inflated by the fact of having only two years available, very close to each other, against 3,126 firms. The CBR indicators, with almost no missing years, show ratios between 3.8 and 7.6.
24 StataCorp (2011).

14 ILO Working Paper No. 38
Equation 1: Fractional Probit, firm characteristics associated to engagement in labour-related CSR
𝑬𝑬�𝑪𝑪𝑪𝑪𝑪𝑪𝒔𝒔𝒔𝒔𝒔𝒔𝒊𝒊,𝒕𝒕�𝑿𝑿𝒊𝒊,𝒕𝒕𝜷𝜷� = 𝚽𝚽���𝜷𝜷𝒉𝒉𝑿𝑿𝒉𝒉𝒊𝒊,𝒕𝒕 + 𝜷𝜷𝒔𝒔𝒔𝒔,𝒉𝒉𝑿𝑿𝒉𝒉,𝒊𝒊,𝒕𝒕𝟐𝟐 �
𝒌𝒌𝟏𝟏
𝒉𝒉=𝟏𝟏
+ � 𝜷𝜷𝒋𝒋𝑿𝑿𝒋𝒋,𝒊𝒊,𝒕𝒕
𝒌𝒌𝟏𝟏+𝒌𝒌𝟐𝟐
𝒋𝒋=𝒌𝒌𝟏𝟏+𝟏𝟏
�
The expectation of 𝐶𝐶𝐻𝐻𝑅𝑅𝑠𝑠𝑠𝑠𝑠𝑠 (which represents INT or EXT, depending on the chosen dependent variable) conditional on our set of regressors 𝐸𝐸 and their respective coefficients 𝛽𝛽 is equal to the standard normal cumulative density function Φ valued at the expression in brackets, where the first summation contains the 𝑘𝑘1 continuous variables 𝐸𝐸ℎ that could potentially have a non-linear statistical association with 𝐶𝐶𝐻𝐻𝑅𝑅𝑠𝑠𝑠𝑠𝑠𝑠 (number of employees, internationalization, equity growth) and the second one comprehends the other 𝑘𝑘2 regressors (age, labour rights indicator, codetermination indicator, sector, year).
Additionally, we estimate the ‘Between’ fractional Probit (BFP), a modified version of the previous model. In this case, all variables are averaged at their individual means, so that our dataset becomes a cross section of each individual’s time average for every numeric variable. This approach, in spite of reducing sample size and suppressing within-firm variation, can provide useful insights because most variation is actually occurring between firms rather than within them. This is particularly important in the case of one of our institutional indicators because most of its variation is across firms but is very stable across time.
We also include, for comparison purposes, two linear models, ‘Between’ (BE) and Fixed-Effects or ‘Within’ (FE), under the following functional form, where the “-” stress symbol on top indicates the individual mean of the variable (BE model), and the “=” symbol indicates that the individual mean has been subtracted from the variable (FE model). In both cases, all CSR variables are divided by their own standard deviation before running the regression.
Equation 2: Linear models, firm characteristics associated to engagement in labour-related CSR
𝑪𝑪𝑪𝑪𝑪𝑪������𝒔𝒔𝒔𝒔𝒔𝒔𝒊𝒊,𝒕𝒕 = ��𝜷𝜷𝒉𝒉𝑿𝑿�𝒉𝒉𝒊𝒊,𝒕𝒕 + 𝜷𝜷𝒔𝒔𝒔𝒔,𝒉𝒉𝑿𝑿�𝒉𝒉,𝒊𝒊,𝒕𝒕𝟐𝟐 �
𝒌𝒌𝟏𝟏
𝒉𝒉=𝟏𝟏
+ � 𝜷𝜷𝒋𝒋𝑿𝑿�𝒋𝒋,𝒊𝒊,𝒕𝒕
𝒌𝒌𝟏𝟏+𝒌𝒌𝟐𝟐
𝒋𝒋=𝒌𝒌𝟏𝟏+𝟏𝟏
+ 𝜺𝜺𝒊𝒊,𝒕𝒕
𝑪𝑪𝑪𝑪𝑪𝑪������𝒔𝒔𝒔𝒔𝒔𝒔𝒊𝒊,𝒕𝒕 = ��𝜷𝜷𝒉𝒉𝑿𝑿�𝒉𝒉𝒊𝒊,𝒕𝒕 + 𝜷𝜷𝒔𝒔𝒔𝒔,𝒉𝒉𝑿𝑿�𝒉𝒉,𝒊𝒊,𝒕𝒕𝟐𝟐 �
𝒌𝒌𝟏𝟏
𝒉𝒉=𝟏𝟏
+ � 𝜷𝜷𝒋𝒋𝑿𝑿�𝒋𝒋,𝒊𝒊,𝒕𝒕
𝒌𝒌𝟏𝟏+𝒌𝒌𝟐𝟐
𝒋𝒋=𝒌𝒌𝟏𝟏+𝟏𝟏
+ 𝜺𝜺𝒊𝒊,𝒕𝒕
In these models, as well as in those presented in the following sections, country dummies are omitted. This is because of its collinearity with our time-invariant and country-specific variable of interest, Labour Rights. If country controls were included, they would confound with that indicator and distort its coefficient.

Corporate Social Responsibility: Exploring determinants and complementarities 15
4.2 Passive complementarity
Passive complementarity is assessed using Factor Analysis (FA)25. This technique seeks to explain covariation among a set of 𝐼𝐼 observed variables 𝐸𝐸𝑘𝑘 by assuming each of them as a linear combination of some underlying unobserved 'common' factors plus a unique component, where each common factor 𝑍𝑍𝑜𝑜 explains a share 𝜆𝜆𝑘𝑘𝑜𝑜2 of 𝐸𝐸𝑘𝑘’s variation. Common factors are orthogonal to each other and to unique components, which in turn are also orthogonal to each other.26
The straightforward interpretation of the results obtained by this technique is that the common factors are forces influencing the observed variables simultaneously. Then, having set a threshold 𝜏𝜏, any pair of subdimensions 𝐸𝐸𝑘𝑘 with 𝐹𝐹𝐴𝐴𝐻𝐻(𝜆𝜆𝑘𝑘𝑜𝑜) > 𝜏𝜏 for the same factor 𝑍𝑍𝑜𝑜 will be considered passively complementary if both 𝜆𝜆𝑘𝑘𝑜𝑜 have the same sign or passively substitute if different.
FA is performed using the Stata® command factor (StataCorp, 2013). In order to make the results more relevant, we extend the analysis to all the subdimensions with more than 5,500 observations, resulting in 16 variables to be explained by common factors. The threshold 𝜏𝜏 is set at 0.40 and the rotation method is “Varimax”.
4.3 Active complementarity
Given the large number of possible combinations between two (or more) CSR subdimensions, we chose to retain and analyse only the causal effects linking Respect of Freedom of Association (FOA) or Corporate Governance (CGV) on one side and the five other subdimensions related to workers’ welfare, external CSR and environment on the other. The selection of FOA is led by the will to test its enabling power on other areas while the selection of CGV aims at testing the potential conflicts between shareholders and other stakeholders’ rights which have been a central issue in the business or economic literature (see chapter 2). Then, in order to assess their effect, we regress the five target subdimensions (Non-discrimination at Workplace, Health and Safety, Social Factors in Supply Chain, Promotion of Social and Economic Development and Environmental Strategy) on the two cross-cutting areas and on control variables for firm size (number of employees), age, year, sector, codetermination, and trade union rights.
Identification of the causal effects can be hindered by endogeneity. First of all, there is time-invariant heterogeneity. Firms may have differences in their willingness to engage into CSR in the long term that cannot be explained by the observed variables. Moreover, this heterogeneity can also extend to their disposition to formally document and disclose their policies and to their ability to report it27. Second, we have path dependence. It is reasonable to think that policies do not extinct after one year, but that they are strongly persistent along time and that new policies are built on the previous ones. Third, there is reversed causality, because cross-cutting CSR policies can be motivated by changes in other areas. Finally, we have omitted variable bias, which corresponds to the effect of time-varying unobservables
25 See Kim and Mueller (1978), Habdi (2003), Torres-Reyna (2010) and Katchova (2013). 26 See APPENDIX B for further methodological details on FA. 27 These differences can partly be explained by size because big firms can more easily dedicate resources to these
kinds of tasks. Still, even after controlling for size, there might be other unobservable reasons explaining these differences.

16 ILO Working Paper No. 38
on our CSR indicators.
We address these endogeneity issues using the “System-GMM” (SysGMM) estimator (Arellano & Bover, 1995; Blundell & Bond, 1998). In this sense, we follow Cavaco and Crifo (2014), who choose this estimator to address endogeneity when also using VigeoEiris CSR scores as explanatory variables.
The estimator is implemented through the xtabond2 Stata® command (Roodman, 2009). Since we should not expect either FOA or CGV to have immediate impact on the other dimensions, these variables enter as lags. In order to control for path dependence, we also include the dependent variable, lagged. In all cases we choose second instead of first lags because most firms present observations every 2 years, so that using lags 1 or 3 reduces the sample by around 80%28. Following Roodman’s (2007) warning about instrument proliferation, we choose sets of instrumental variables that keep instrument count far below the number of firms29.
Additionally, we implement a “Within” or Fixed-Effects (FE) linear estimator. Although it is not as sophisticated as SysGMM in terms of controlling for all the endogeneity sources, it is a useful and intuitive estimator that still controls for time-invariant heterogeneity. Moreover, we include the lagged dependent variable as regressor in an attempt to control for past dependence (keeping in mind that this still generates biased estimates30) and rely on the use of the lags of FOA and CGV to avoid reverse causality.
Both SysGMM and FE, can be represented as follows:
Equation 3: Linear models, effect of FOA and CGV on other subdimensions
𝑪𝑪𝑪𝑪𝑪𝑪𝒔𝒔𝒔𝒔𝒔𝒔𝒔𝒔𝒊𝒊,𝒕𝒕 = 𝜷𝜷𝟎𝟎 + 𝜷𝜷𝟏𝟏𝑪𝑪𝑪𝑪𝑪𝑪𝒔𝒔𝒔𝒔𝒔𝒔𝒔𝒔𝒊𝒊,𝒕𝒕−𝟐𝟐 + 𝜷𝜷𝟐𝟐𝑭𝑭𝑭𝑭𝑭𝑭𝒊𝒊,𝒕𝒕−𝟐𝟐 + 𝜷𝜷𝟑𝟑𝑪𝑪𝑪𝑪𝑪𝑪𝒊𝒊,𝒕𝒕−𝟐𝟐 + 𝜷𝜷𝟒𝟒𝑬𝑬𝑬𝑬𝑬𝑬𝒊𝒊,𝒕𝒕−𝟐𝟐 + �𝜷𝜷𝒋𝒋𝑿𝑿𝒋𝒋,𝒊𝒊,𝒕𝒕
𝒌𝒌+𝟓𝟓
𝒋𝒋=𝟓𝟓
+ 𝜺𝜺𝒊𝒊,𝒕𝒕
As we can see in Equation 3, the dependent variable (𝐶𝐶𝐻𝐻𝑅𝑅𝑠𝑠𝑠𝑠𝑠𝑠𝑠𝑠), the variables of interest (FOA and CGV) and the control for firm size (EMP) enter as second lags. The sixth term of the right hand side is a set of additional control variables: age, labour rights, codetermination, sector and year. In the case of the SysGMM estimator, since there are actually two equations being estimated simultaneously, each observation enters twice: once in its original value (the “levels” equation) and also as first difference (“difference” equation). Further lags of first differences and levels are used as instruments.31 As for the Within model, all observations enter as the difference to the individual means.
In spite of having a fractional response dependent variable, our preference for linear estimates is well founded. In fact, we follow Schuster and Maertens (2013) in using dynamic panel GMM estimators in this case. As these authors point out, the literature has not come up yet with a convincing and widely accepted non-linear estimator to deal with fractional response variables and endogeneity in an
28 This also forces us to only report AR(2) and AR(4) autocorrelation tests (skipping AR[1] and AR[3]), given that controlling for those lags is inconvenient.
29 “GMM-style” instruments consist of lags of the dependent and independent variables, ranging from 4th to 12th, depending on the specification, whereas “IV-style instruments” are year, sector and age.
30 However, this has limitation, pointed out by Nickell (1981), which is a downward bias in the estimate of coefficient for the lagged dependent variable.
31 For detailed information on the instruments sets, see APPENDIX D.
Corporate Social Responsibility: Exploring determinants and complementarities 17
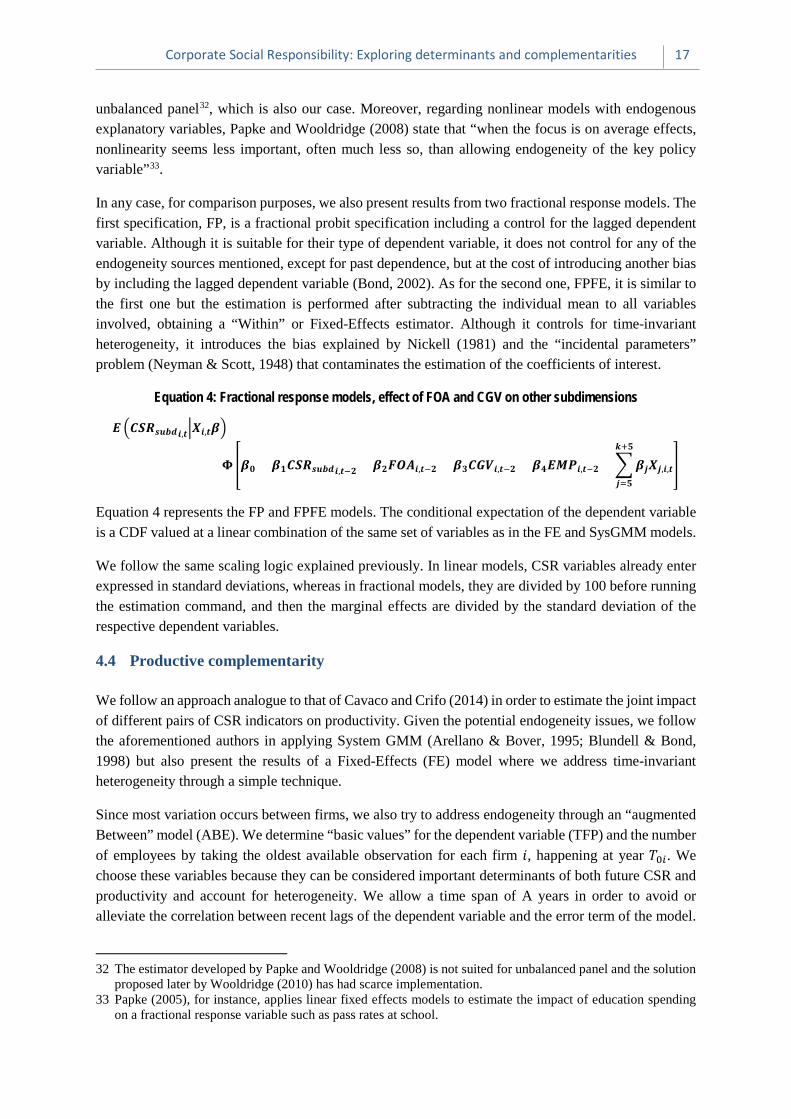
unbalanced panel32, which is also our case. Moreover, regarding nonlinear models with endogenous explanatory variables, Papke and Wooldridge (2008) state that “when the focus is on average effects, nonlinearity seems less important, often much less so, than allowing endogeneity of the key policy variable”33.
In any case, for comparison purposes, we also present results from two fractional response models. The first specification, FP, is a fractional probit specification including a control for the lagged dependent variable. Although it is suitable for their type of dependent variable, it does not control for any of the endogeneity sources mentioned, except for past dependence, but at the cost of introducing another bias by including the lagged dependent variable (Bond, 2002). As for the second one, FPFE, it is similar to the first one but the estimation is performed after subtracting the individual mean to all variables involved, obtaining a “Within” or Fixed-Effects estimator. Although it controls for time-invariant heterogeneity, it introduces the bias explained by Nickell (1981) and the “incidental parameters” problem (Neyman & Scott, 1948) that contaminates the estimation of the coefficients of interest.
Equation 4: Fractional response models, effect of FOA and CGV on other subdimensions
𝑬𝑬 �𝑪𝑪𝑪𝑪𝑪𝑪𝒔𝒔𝒔𝒔𝒔𝒔𝒔𝒔𝒊𝒊,𝒕𝒕�𝑿𝑿𝒊𝒊,𝒕𝒕𝜷𝜷�
= 𝚽𝚽�𝜷𝜷𝟎𝟎 + 𝜷𝜷𝟏𝟏𝑪𝑪𝑪𝑪𝑪𝑪𝒔𝒔𝒔𝒔𝒔𝒔𝒔𝒔𝒊𝒊,𝒕𝒕−𝟐𝟐 + 𝜷𝜷𝟐𝟐𝑭𝑭𝑭𝑭𝑭𝑭𝒊𝒊,𝒕𝒕−𝟐𝟐 + 𝜷𝜷𝟑𝟑𝑪𝑪𝑪𝑪𝑪𝑪𝒊𝒊,𝒕𝒕−𝟐𝟐 + 𝜷𝜷𝟒𝟒𝑬𝑬𝑬𝑬𝑬𝑬𝒊𝒊,𝒕𝒕−𝟐𝟐 + �𝜷𝜷𝒋𝒋𝑿𝑿𝒋𝒋,𝒊𝒊,𝒕𝒕
𝒌𝒌+𝟓𝟓
𝒋𝒋=𝟓𝟓
�
Equation 4 represents the FP and FPFE models. The conditional expectation of the dependent variable is a CDF valued at a linear combination of the same set of variables as in the FE and SysGMM models.
We follow the same scaling logic explained previously. In linear models, CSR variables already enter expressed in standard deviations, whereas in fractional models, they are divided by 100 before running the estimation command, and then the marginal effects are divided by the standard deviation of the respective dependent variables.
4.4 Productive complementarity
We follow an approach analogue to that of Cavaco and Crifo (2014) in order to estimate the joint impact of different pairs of CSR indicators on productivity. Given the potential endogeneity issues, we follow the aforementioned authors in applying System GMM (Arellano & Bover, 1995; Blundell & Bond, 1998) but also present the results of a Fixed-Effects (FE) model where we address time-invariant heterogeneity through a simple technique.
Since most variation occurs between firms, we also try to address endogeneity through an “augmented Between” model (ABE). We determine “basic values” for the dependent variable (TFP) and the number of employees by taking the oldest available observation for each firm 𝑅𝑅, happening at year 𝐼𝐼0𝑜𝑜. We choose these variables because they can be considered important determinants of both future CSR and productivity and account for heterogeneity. We allow a time span of A years in order to avoid or alleviate the correlation between recent lags of the dependent variable and the error term of the model.
32 The estimator developed by Papke and Wooldridge (2008) is not suited for unbalanced panel and the solution proposed later by Wooldridge (2010) has had scarce implementation.
33 Papke (2005), for instance, applies linear fixed effects models to estimate the impact of education spending on a fractional response variable such as pass rates at school.

18 ILO Working Paper No. 38
Then, all the observations taking place at year 𝑡𝑡 ≥ (𝐼𝐼0𝑜𝑜 + 𝐹𝐹) are used to compute the average values of the dependent and all the other independent variables. These observations are then used to run a “between model” that additionally controls for the “basic values” of TFP and employment.
Finally, we develop a new specification, “MAXT”. This model regresses the latest available TFP observation of each firm on the earliest available observations for all the explanatory variables (including the lagged dependent variable) subject to the firm having at least four observations. It this way, it maximizes the time distance between both sides of the equation and guarantees that it is equal or greater than three years. The idea is to take advantage of the time dimension of the Factset data using long lags of the variables in order to control for omitted variable bias, heterogeneity and path dependency but avoiding the excessively high correlation that recent lags of TFP and employment would have with the current value of the dependent variable that would act as confounder and mask the effect of our variables of interest.
The empirical strategy is represented by Equation 5. Productivity (more precisely, the logarithm of TFP) is explained by 𝐼𝐼𝐼𝐼𝐼𝐼, 𝐸𝐸𝐸𝐸𝐼𝐼,𝐶𝐶𝐺𝐺𝐺𝐺, 𝐸𝐸𝐼𝐼𝐺𝐺 and the interactions of 𝐼𝐼𝐼𝐼𝐼𝐼 with the other three (𝐶𝐶𝐻𝐻𝑅𝑅𝑗𝑗 in the equation), all of which enter with past values as the effect is not expected to be immediate. As controls we include past TFP, labour rights, employment, codetermination and dummies for year and sector.
Equation 5: Effect of CSR subdimensions and their interactions on productivity
𝐥𝐥𝐥𝐥𝐥𝐥𝑻𝑻𝑭𝑭𝑬𝑬𝒊𝒊,𝒕𝒕 = 𝜷𝜷𝟎𝟎 + 𝜷𝜷𝟏𝟏 𝑻𝑻𝑭𝑭𝑬𝑬𝒊𝒊,𝒕𝒕−𝑭𝑭 + 𝜷𝜷𝟐𝟐𝑬𝑬𝑬𝑬𝑬𝑬𝒊𝒊,𝒕𝒕−𝑭𝑭 + 𝜷𝜷𝟑𝟑𝑰𝑰𝑰𝑰𝑻𝑻𝒊𝒊,𝒕𝒕−𝑩𝑩
+ ��𝜷𝜷𝒋𝒋𝑪𝑪𝑪𝑪𝑪𝑪𝒋𝒋,𝒊𝒊,𝒕𝒕−𝑩𝑩 + 𝜷𝜷𝒋𝒋+𝟑𝟑�𝑰𝑰𝑰𝑰𝑻𝑻𝒊𝒊,𝒕𝒕−𝑩𝑩𝑪𝑪𝑪𝑪𝑪𝑪𝒋𝒋,𝒊𝒊,𝒕𝒕−𝑩𝑩��𝟔𝟔
𝒋𝒋=𝟒𝟒
+ 𝜷𝜷𝟏𝟏𝟎𝟎𝑳𝑳𝑳𝑳𝒔𝒔𝑳𝑳𝒔𝒔𝒓𝒓𝑪𝑪𝒊𝒊𝑹𝑹𝒉𝒉𝒕𝒕𝒔𝒔𝒊𝒊
+ 𝜷𝜷𝟏𝟏𝟏𝟏𝑪𝑪𝑳𝑳𝒔𝒔𝑪𝑪𝒕𝒕𝑪𝑪𝒓𝒓𝑪𝑪𝒊𝒊𝒔𝒔𝑳𝑳𝒕𝒕𝒊𝒊𝑳𝑳𝒔𝒔𝒊𝒊,𝒕𝒕 + 𝑪𝑪𝑪𝑪𝑺𝑺𝒕𝒕𝑳𝑳𝒓𝒓𝒊𝒊 + 𝒀𝒀𝑪𝑪𝑳𝑳𝒓𝒓𝒕𝒕 + 𝜺𝜺𝒊𝒊,𝒕𝒕
The lags in the explanatory variables are presented as a numbers A and B. For SysGMM and FE we choose 𝐹𝐹 = 3 and 𝐴𝐴 = 1 in order to strike a balance between sample size and the use of the time dimension. In ABE, 𝐼𝐼𝐹𝐹𝑃𝑃 and 𝐸𝐸𝐸𝐸𝑃𝑃 correspond to the oldest observation while all other variables are transformed into individual means using all available observations three years after the oldest one, so that, in a way, it could be considered 𝐹𝐹 = 3 and 𝐴𝐴 = 0. In the MAXT model, as we have the newest observation for each individual for the dependent variable and the oldest ones for all the explanatory variables, subject to having at least 4 observations per each firm, 𝐹𝐹 ≥ 3 and 𝐴𝐴 ≥ 3, depending on the number of observations for each firm.
It is important to take into account the units in which variables are measured. Productivity is expressed in logarithms and CSR indicators are measured in standard deviations. Hence, the coefficients of interest should be interpreted as the percentage change of productivity associated to a change in one standard deviation in the regressor.

Corporate Social Responsibility: Exploring determinants and complementarities 19
5. Results
5.1 Determinants
The following tables describe the determinants of internal and external CSR. The results are similar for both variables: age, internationalization, size and the quality of the institutional framework for labour relations are positively associated with the two CSR indicators. Other things being equal, firms operating in the mining and utilities sectors have, on average, higher scores for both indicators as well. On the contrary, growth rate of the firm’s equity is negatively associated with both CSR indicators. Some variables present non-linear effects but the case of reversion in the sign of the effect seems unlikely to happen. In general, results are robust to changes in specifications.
Table 2 presents the results on Internal CSR. All specifications show that an additional year of age relates to an increase in INT of 0.01 to 0.034 standard deviations. The coefficients on internationalization are presented on the basis of a change of 100 percentile points, so we can interpret them as an increase of 1 percentile points in this variable being associated to an increase of up to 0.008 standard deviations in INT. Both BE specifications indicate that, rather than linear, the effect is decreasing, but without getting to the point of being negative since the reversion would occur only for values above 130%, which is implausible. In the same regressions, firm size, measured by the number of employees, is positively associated with INT as well, with a magnitude ranging between 0.278 and 0.352 standard deviations per increase of 100,000 employees. The relation is also decreasing here, with the effect reversing at around 2.25 million workers for specifications 1 and 3 and at 1.25 million for specification 2, which is also highly improbable. On the contrary, equity growth is negatively associated with INT, and specification 2 shows also a non-linear effect that reduces the absolute value of the coefficient but hardly reversing it since both effects compensate only at a growth rate of 180%, a very rare case unless there was a very large equity issuance. As for the quality of labour market institutions, both variables show positive associations with internal CSR in the between models: an increase of one standard deviation in codetermination relates to increase in CSR of up to 0.044 standard deviations, while a similar change in the labour rights index is associated with an increase in INT of 0.178 to 0.243 deviations. On the contrary, the linear FE specification (column 4) presents a negative coefficient on the codetermination indicator, but it can be neglected as most variance in the variable occurs across countries, not across time.

20 ILO Working Paper No. 38
Table 2: Determinants of internal CSR (INT)
Dep. Var. 1 2 3 4
INT FP (Fractional Probit)
BFP (Between Fractional Probit)
BE (Linear Between)
FE (Linear Within)
Age 0.0151 *** 0.0200 *** 0.0096 *** 0.0339 *** 0.0000 0.0000 0.0000 0.0000 Internationalization 0.7946 *** 0.5206 *** 0.5501 *** -0.0240 0.0000 0.0000 0.0001 0.9279 Internationalization^2 -0.5232 *** -0.3448 *** -0.3798 *** 0.0726 0.0006 0.0000 0.0099 0.7561 NumEmployees 0.2784 *** 0.3520 *** 0.2876 *** 0.0066 0.0000 0.0000 0.0000 0.9237 NumEmployees^2 -0.0122 *** -0.0282 *** -0.0125 *** -0.0033 0.0000 0.0000 0.0000 0.4969 EquityGrowth -0.1814 *** -0.6660 *** -0.2552 *** -0.0383 ** 0.0000 0.0000 0.0000 0.0330 EquityGrowth^2 -0.0037 0.2711 *** -0.0192 0.0033 0.8559 0.0000 0.2580 0.6924 Codetermination 0.0162 0.0141 *** 0.0442 *** -0.0225 *** 0.1694 0.0000 0.0006 0.0011 LabourRights 0.2426 *** 0.1817 *** 0.1781 *** 0.0000 0.0000 0.0000 Top Sectors Utilities Utilities Mining Mining Mining Utilities Manufact. Manufact. Std. Errors Cluster (id) Robust Robust Observations 5,891 1,930 5,891 5,891 Firms 1,930 1,930 1,930 1,930 Adj. R^2 0.275 0.111 Pseudo R^2 0.038 0.042 p-values in italics * *p<0.10, **p<0.05, *** p<0.10
Table 3 shows that results for external CSR are globally similar to those of internal CSR, but with certain nuances. Both between models (2-3) exhibit positive and decreasing association of internationalization and size with the dependent variable, with size possibly reversing the sign of the effect at 1.4 million employees. Sectors play a similar role as in INT, with Utilities, Mining and Manufacturing as the ones with the highest significant coefficients. Labour rights are also positively associated with external CSR, showing that an increase of one standard deviation is associated to a rise in EXT of 0.13 to 0.20 standard deviations. However, the case with the codetermination indicator is different. When included in the regression without the labour rights indicator, the coefficient is positive and significant, as expected, but it becomes negative or insignificant otherwise. This suggests that both indexes relate with EXT through the same channel but with labour rights dominating. Another important difference with the previous table is in the coefficients for equity growth. Although the linear term is also negative, in models 1 and 2 the quadratic term does not bring the net effect closer to zero but it increases it in magnitude instead, keeping the negative sign, and suggesting that firms accelerate their aversion towards external CSR as they grow faster.

Corporate Social Responsibility: Exploring determinants and complementarities 21
Table 3: Determinants of external CSR (EXT)
Dep. Var. 1 2 3 4
EXT FP (Fractional Probit)
BFP (Between Fractional Probit)
BE (Linear Between)
FE (Linear Within)
Age 0.0115 *** 0.0097 *** 0.0062 *** 0.0661 *** 0.0002 0.0000 0.0079 0.0000 Internationalization 0.3998 * 0.6303 *** 0.5623 *** -0.5448 * 0.0890 0.0000 0.0048 0.0801 Internationalization^2 -0.1805 -0.4259 *** -0.3739 * 0.4265 0.4291 0.0000 0.0594 0.1176 NumEmployees 0.2732 *** 0.3367 *** 0.2851 *** -0.0296 0.0000 0.0000 0.0000 0.6821 NumEmployees^2 -0.0105 *** -0.0229 *** -0.0109 *** -0.0085 0.0000 0.0000 0.0000 0.1198 EquityGrowth -0.2732 *** -0.3564 *** -0.2716 *** -0.045 0.0000 0.0000 0.0004 0.1228 EquityGrowth^2 -0.069 ** -0.3651 *** -0.0681 -0.0138 0.0164 0.0000 0.2015 0.4726 Codetermination -0.0095 -0.0252 *** 0.0059 0.0039 0.5639 0.0000 0.7166 0.6924 LabourRights 0.1979 *** 0.128 *** 0.1388 *** 0.0000 0.0000 0.0000 Top Sectors Mining Utilities Mining Mining Utilities Mining Utilities Utilities Health Manufact. Manufact. Manufact. Std. Errors Cluster (id) Robust Robust Observations 3255 1211 3255 3255 Firms 1211 1211 1211 1211 Adj. R^2 0.219 0.233 Pseudo R^2 0.047 0.052 p-values in italics * p<0.10, **p<0.05, *** p<0.10
The interpretation of most of the results is straightforward and in line with most of the literature. In general, we observe that mature firms are more prone to commit and/or make reference to CSR. The bigger, older and more internationalized they are, the higher the CSR index. However, this could also be a consequence of the greater ability and resources they have to report their policies, and not necessarily of better compliance in practice. In contrast, results also suggest that more dynamic firms tend to be less compliant, possibly indicating that managers in this kind of companies tend to neglect these issues and maybe postpone them until the firm is more mature and exposed. Institutions are also important determinants of CSR, and the results suggest that those related to codetermination and collective bargaining have influence on the welfare policies for internal workers (INT) but not clearly for external ones, while the Labour Rights indicator, positively associated with both INT and EXT, might be reflecting more general attributes of labour and social CSR institutions across the country.
These results should be interpreted with caution as they try to characterize compliant firms rather than to establish causality. That is, we did not attempt to control for endogeneity (as we do in some of the other sections) but to assess which characteristics are associated with higher compliance. Additionally, it must be noticed that no country dummies were included, and this is because we are interested in the

22 ILO Working Paper No. 38
coefficient for Labour Rights, which is country specific and time invariant and, thus collinear with a complete set of country dummies.
5.2 Passive complementarity
We find convincing evidence on the existence of passive complementarity. The data shows there are two common factors simultaneously determining a large number of CSR subdimensions. One factor explains all CSR subdimensions related to social and environmental issues, while the other explains all those referred to corporate governance. Hence, according to our definitions from section 4.2, there are two groups of subdimensions, clearly defined, within which there is passive complementarity.
Table 4: Factor analysis results, unrotated loadings34
Factor analysis/correlation Number of observations 2408 Method: principal factors Retained factors 2 Rotation: (unrotated) Number of parameters 31
Factor Eigenvalue Difference Proportion Cumulative Factor1 7.19 5.36 0.77 0.77 Factor2 1.83 1.27 0.20 0.97 Factor3 0.57 0.23 0.06 1.03
Table 5: Rotated factor loadings (pattern matrix) and unique variances35
Variable Factor1 Factor2 Uniqueness Board of directors (Corporate Governance) 0.69 0.50 Audit and internal controls 0.80 0.32 Shareholders 0.47 0.78 Executive remuneration 0.83 0.31 Promotion of the social and economic development 0.64 0.56 Integration of environmental factors in the supply chain 0.80 0.34 Integration of social factors in the supply chain 0.77 0.36 Prevention of corruption 0.55 0.48 0.47 Environmental strategy and eco-design 0.78 0.38 Minimising environmental impacts from energy use - Energy 0.68 0.50 Promotion of labour relations 0.74 0.46 Responsible management of restructurings 0.68 0.53 Career management and promotion of employability 0.79 0.36 Improvement of health and safety conditions 0.80 0.31 Respect for freedom of association and the right to collective bargaining 0.74 0.44
Non-Discrimination 0.72 0.38
34 Only the three factors with higher eigenvalues are shown. 35 Only the loadings above the threshold of 0.4 are displayed.

Corporate Social Responsibility: Exploring determinants and complementarities 23
Table 4 shows the results of the factor analysis. In order to strike a good balance between number of variables and sample size, we keep the 16 variables with the highest number of observations, each of them with no less than 5,500. As a result of missing values, only 2,408 observations are left available for the analysis, which starts indicating that with only two common factors (those with eigenvalues higher than 1) we manage to explain 97% of the joint variance in the data. The third factor already has an eigenvalue smaller than 1, which means that it does not have enough explanatory power and is thus not retained.
Table 5 presents the variables corresponding to each factor. Each loading is the square root of the share of the variable’s variance explained by the factor. After applying Varimax rotation and setting a threshold of 0.4 as the criterion to display loadings, we obtain the results seen in the table. All variables corresponding to the domains of Community Involvement, Business Behaviour, Environment, Human Resources and Human Rights are explained only by Factor 1, which in turn does not explain any variables from other dimensions. As for Factor 2, it only explains variables from the domain of Corporate Governance, and all variables of this domain are explained exclusively by this factor. There is only one exception, one that actually confirms the rule: Prevention of Corruption corresponds to the sphere of Business Behaviour but is also very closely related to Corporate Governance since shareholders and directors demand honesty and transparency from managers, and in our analysis appears as being almost equally explained by both factors with a loading greater than the threshold.
A possible interpretation of this passive complementarity refers to managers’ behaviour before different stakeholders. In factor analysis, the nature of each common factor is approximated by looking for a common conceptual link or determinant between all the variables explained by the same factor. In our case, all subdimensions explained mainly by Factor 1 can be a priori characterized as being driven by non-profit interests (laws, regulations, demands from workers, pressure from NGOs and civil society, etc.) since they consist of actions that certainly imply higher expenditures in the short term without certain nor immediate effects in terms of profits. For instance, meeting environmental or social standards, safeguarding local communities and including social provisions into suppliers’ contracts could increase the cost for the firm without necessarily translating into an even higher increase in income in the short term. On the contrary, all subdimensions explained by Factor 2 are driven by an interest in profitability. Shareholders are interested in aligning executives’ remuneration with their interest, setting effective audit and control mechanisms and establishing a board of directors capable of exercising power over management and hold accountable to them, because in this way they can push managers to pursue the maximization of shareholders’ value.
It is interesting to compare this result with those of Orlitzky et al (2017). These authors found similar statistical results but provided an alternative explanation, that CSR and corporate governance might be influenced by different factors or stakeholders. Through a variance decomposition analysis, they demonstrated that firm-level factors (such as organizational culture) are especially important for certain CSR dimensions such as those targeted at local communities, environment and employees. However, corporate governance might be a more systemic issue, depending more importantly on the broader institutional setting. The authors explained these results by the fact that CSR is mainly predetermined by the strategic opportunities which can be anticipated at the firm level. It also depends very much on the organizational culture of the company. To the contrary, good corporate governance practices can be more imposed by the regulation authorities.

24 ILO Working Paper No. 38
The exercise we have presented has, however, certain limitations. It assumes that the “common factors” actually exist and that they directly impact on the variables of interest. Nevertheless, this is no more than a way of interpreting what the factor analysis ultimately does: examining interdependency among a set of variables. Moreover, this interpretation is the result of an educated guess, since FA can hardly provide a straightforward idea on the nature of the factor. Finally, there is the arbitrariness of the threshold as well, that we set at a level that associates as many variables as possible to one and only one factor. However, if we set the threshold at a higher level, some variables could become unexplained, while some could be explained by two factors if we set the value lower, possibly changing the interpretations.
5.3 Active complementarity
The evidence suggests that CSR subdimensions might be actively complementing each other. Figure 1 shows the estimated coefficients corresponding to the effect of an increase in FOA of one standard deviation on the other five variables of interest, also expressed in standard deviations. As for Figure 2, it does the analogue task but regarding the effect of the CGV. In both cases we present the results from four different types of models, each of them implemented in five specifications, so that these figures are showing the output from 40 different regressions36. We mainly rely on the SysGMM results, but we also check that the other specifications do not openly contradict these results. In the whole, we observe that there are not any negative and significant coefficients, but actually most of the coefficients are positive and significant. Additionally, the evidence suggests that FOA and CGV might have different effects for each area.
36 Complete output from regressions, including validity tests for SysGMM, presented in APPENDIX D.

Corporate Social Responsibility: Exploring determinants and complementarities 25
Figure 1: Impact of Respect of Freedom of Association on other subdimensions
The regression results shown in Figure 1suggest a positive impact of the score in FOA on future scores in Non-discrimination (ND), Health and Safety (HS), Social Factors in the Supply Chain (SSC) and Environmental Strategy (ENV). In these cases, and for all four models, the 0 value is outside the coefficients’ 90%-confidence intervals. According to the SysGMM estimates, an increase of one standard deviation in FOA seems to cause, two years later, increases of 0.19 standard deviations in ND and HS and of 0.10 standard deviations in SSC and ENV. In other words, the results indicate that current improvements (deteriorations) in FOA might drive firms to improve (deteriorate) CSR in those four subdimensions as well in the future. Although the coefficients cannot be deemed as strictly comparable, it is worth noting that the highest and most significant values correspond to the internal CSR dimensions (ND and HS), endorsing the hypothesis of FOA being an enabling right that opens the door for improvements in other areas related to workers’ welfare. The results also indicate that environmental policies and monitoring of social factors in the supply chain can be fostered by previous improvements in FOA, but the causal link is weaker. It may be explained by the fact that workers from the incumbent firm might not be primarily concerned with these issues. Instead, a possible channel between FOA and these two subdimensions could be the managements’ “CSR priority list”. Environmental issues might entail legal responsibilities for the firm, but they are not likely to directly affect own workers nor the production process. As for SSC, it does not affect internal workers either, and, although it can relate to disruptions in the production process, this can only happen indirectly (through input disruption). Hence, it is reasonable to explain this significant yet weaker link from FOA to ENV and SSC through the manager’s prioritization decisions.
0.19*** 0.19***
0.10* 0.11 0.10*
0.00
0.05
0.10
0.15
0.20
0.25
Non Disc HealthSafety
SocialSChain
Prom Dev EnvPolicy
SysGMM
0.06***
0.05*** 0.05**
0.00
0.04*
-0.010.000.010.020.030.040.050.060.07
Non Disc HealthSafety
SocialSChain
PromDev
EnvPolicy
FE
0.011***0.0105***
0.008**
-0.0016
0.007*
-0.0040-0.00200.00000.00200.00400.00600.00800.01000.01200.0140
Non Disc HealthSafety
SocialSChain
PromDev
EnvPolicy
FPFE
0.05***
0.06***
0.05*** 0.05***0.04***
0.0000
0.0100
0.0200
0.0300
0.0400
0.0500
0.0600
0.0700
Non Disc HealthSafety
SocialSChain
PromDev
EnvPolicy
FP
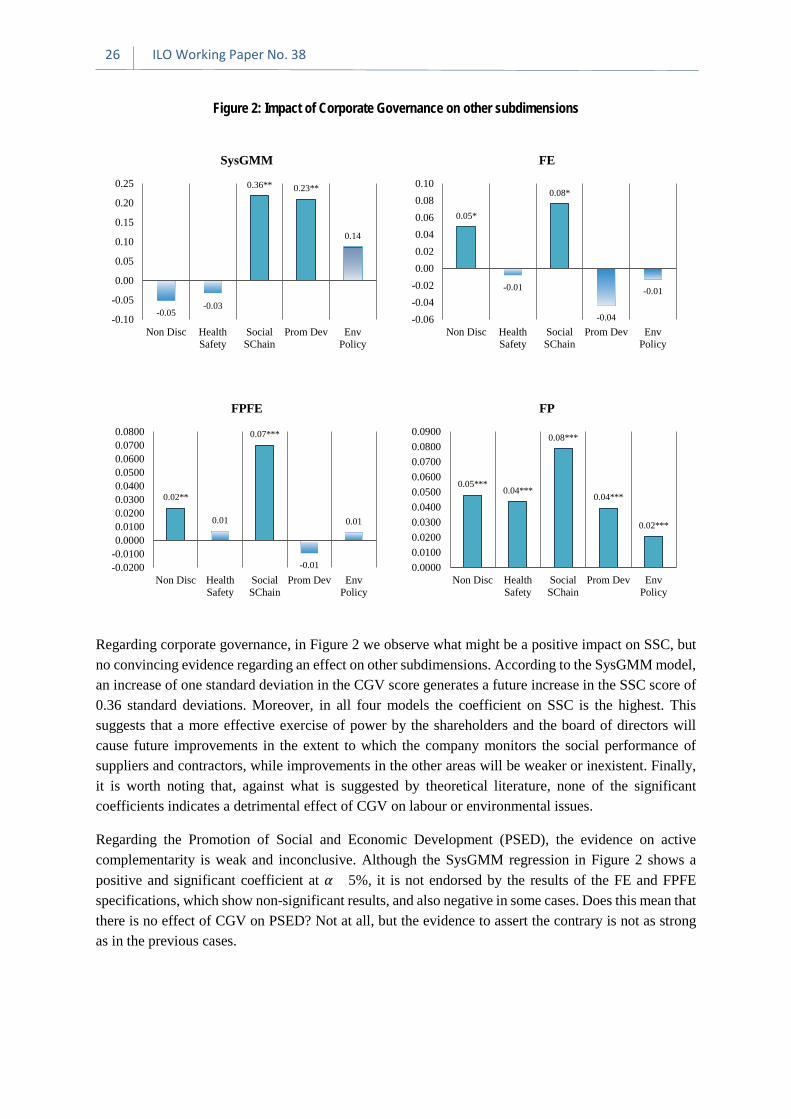
26 ILO Working Paper No. 38
Figure 2: Impact of Corporate Governance on other subdimensions
Regarding corporate governance, in Figure 2 we observe what might be a positive impact on SSC, but no convincing evidence regarding an effect on other subdimensions. According to the SysGMM model, an increase of one standard deviation in the CGV score generates a future increase in the SSC score of 0.36 standard deviations. Moreover, in all four models the coefficient on SSC is the highest. This suggests that a more effective exercise of power by the shareholders and the board of directors will cause future improvements in the extent to which the company monitors the social performance of suppliers and contractors, while improvements in the other areas will be weaker or inexistent. Finally, it is worth noting that, against what is suggested by theoretical literature, none of the significant coefficients indicates a detrimental effect of CGV on labour or environmental issues.
Regarding the Promotion of Social and Economic Development (PSED), the evidence on active complementarity is weak and inconclusive. Although the SysGMM regression in Figure 2 shows a positive and significant coefficient at 𝛼𝛼 =5%, it is not endorsed by the results of the FE and FPFE specifications, which show non-significant results, and also negative in some cases. Does this mean that there is no effect of CGV on PSED? Not at all, but the evidence to assert the contrary is not as strong as in the previous cases.
-0.05-0.03
0.36** 0.23**
0.14
-0.10
-0.05
0.00
0.05
0.10
0.15
0.20
0.25
Non Disc HealthSafety
SocialSChain
Prom Dev EnvPolicy
SysGMM
0.05*
-0.01
0.08*
-0.04
-0.01
-0.06-0.04-0.020.000.020.040.060.080.10
Non Disc HealthSafety
SocialSChain
Prom Dev EnvPolicy
FE
0.02**
0.01
0.07***
-0.01
0.01
-0.0200-0.01000.00000.01000.02000.03000.04000.05000.06000.07000.0800
Non Disc HealthSafety
SocialSChain
Prom Dev EnvPolicy
FPFE
0.05***0.04***
0.08***
0.04***
0.02***
0.00000.01000.02000.03000.04000.05000.06000.07000.08000.0900
Non Disc HealthSafety
SocialSChain
Prom Dev EnvPolicy
FP

Corporate Social Responsibility: Exploring determinants and complementarities 27
In sum, the econometric results provide evidence of what could be interpreted as active complementarities. FOA seems to act as an enabling policy area that pushes the others while CGV does not seem to be detrimental to CSR policies targeted at internal employees and environment and even seem to lead to better awareness with regard to workers in the supply chain. After controlling for endogeneity, FOA shows a clear positive association with both internal (ND and HS) and external (ENV and SSC) issues, and the evidence might be suggesting as well that the effect is higher on the former than on the later. CGV, on the contrary, is only showing a positive effect on SSC.
Different mechanisms could explain this set of results. First of all, the causal relation from FOA to ND and HS is based on the nature of FOA as an enabling right that empowers workers to later increase their welfare at work through better safeguards against discrimination and enhanced health and safety conditions. Second, the effect of FOA on SSC could be explained by different factors. A first factor could be reputation effect which requires in-house improvements as a precondition to requiring improvements by suppliers. However, this relation might be also the sign of a certain solidarity between unions at global level. Interestingly, in recent years, global unions have pushed for a better consideration towards workers in global supply chains for example through specific provisions in international framework agreements. And third, the causal effects of FOA on ENV and of CGV on SSC, along with the relative sizes of the coefficients corresponding to the effects of FOA (ND, HS, ENV and SSC, in decreasing order), can be explained by the way managers possibly set their priorities in terms of CSR. Improvements in FOA have a stronger effect in labour-related CSR dimensions like HS and ND not only because they enable rights, but also because workers’ empowerment can generate demands that managers might have to deal with in the first place in order to avoid dangers of disruption in the production process. To a lesser extent, as labour related demands are met, managers’ time and resources are freed to move to on to a second order of priorities. ENV and SSC could match this concept, because leaving unattended environmental issues or issues related to bad conditions in suppliers’ facilities, does not directly threaten the production process (like those related to internal labour) and can even if some cases leads to higher costs. But they can still generate a risk for the reputation of the lead company towards customers and investors in the medium/long term.
We must take into account the limitations of these results. SysGMM is our preferred specification but it still presents two major shortcomings. This estimator relies on the assumption that instruments are exogenous, which, besides the statistical tests presented, is not guaranteed. Moreover, as previously discussed, it is a linear model trying to explain a fractional outcome. Linear FE also presents this last problem, and regarding endogeneity it only controls for time-invariant heterogeneity and ignores between-variation. FP and FPFE are appropriate for fractional dependent variables, but the only control for endogeneity is on time-invariant heterogeneity in the second model.

28 ILO Working Paper No. 38
5.4 Productive complementarity
The evidence suggests a positive effect of Internal CSR on productivity but nothing conclusive on complementarities. Table 6 presents the results from four different models which regress total factor productivity on CSR indicators, their interactions and control variables. All of them have a positive and significant coefficient involving Internal CSR and no negative and significant coefficients involving any other CSR indicator. Only one of the models indicates synergic complementarity between internal CSR and Corporate Governance. Only one of the specifications shows another significant effect, one of environmental policy, but no additional effects nor complementarities are observed besides.
Table 6: Productive complementarity37
Dep. Var. 1 2 3 4 Log TFP SysGMM FE ABE MAXT
Past log TFP 0.36 *** -0.01 0.37 *** 0.30 *** 0.00 0.82 0.00 0.00 Emp 0.08 *** 0.08 ** 0.00 0.01 INT 0.12 * 0.00 0.10 *** 0.07 * 0.06 0.91 0.01 0.06 ENV 0.09 0.04 * 0.01 0.00 0.19 0.09 0.72 0.95 CGV -0.07 -0.03 -0.02 0.02 0.44 0.27 0.61 0.52 EXT 0.05 0.01 0.02 0.01 0.49 0.69 0.68 0.76 INT*ENV -0.04 -0.02 0.00 0.01 0.18 0.18 0.85 0.48 INT*CGV 0.02 0.02 * 0.02 -0.01 0.74 0.09 0.27 0.53 INT*EXT -0.03 -0.01 -0.02 -0.02 0.69 0.40 0.37 0.48 Labour Rights 0.01 0.14 ** 0.05 *** 0.83 0.03 0.01 Codetermination 0.01 -0.02 * 0.04 *** 0.04 *** 0.80 0.07 0.00 0.01 Years Yes Yes No No Sectors Yes No Yes Yes Std Error Robust Robust Robust Robust
Model System GMM Least Squares - Within
Fractional Probit - Within
Fractional Probit - Pooled
Obs 2002 2036 2753 1137 Firms 796 825 1019 1137 Non-collinear instruments in SysGMM: 172
The effects of Internal CSR on productivity are observed both in the medium and long runs. Model 1 indicates that, for a given firm, improving labour-related CSR performance by one standard deviation of the indicator generates a 12% increase in productivity one year later. According to Model 2, such a rise in INT has no effect on its own but, if done jointly with a similar relative improvement in CGV, the improvement in future TFP will be of 2%; additionally, the model shows that ENV is positively associated, but this is not robust across the specifications. As for the long run, the last two models show
37 See APPENDIX E for information on exogeneity and AR tests.

Corporate Social Responsibility: Exploring determinants and complementarities 29
that more productive firms have higher Internal CSR scores. In Model 3 we can see that an increase of one standard deviation in Internal CSR is associated with 10% higher productivity. Interestingly, the use of a more stringent control for endogeneity in Model 4 (“MAXT”) results in a lower yet positive and significant increase of 7% in future38 TFP per additional standard deviation of INT.
Only one of our specifications is suggesting productive complementarity between Internal CSR and CGV. Model 2 shows signs of synergic complementarity, because the joint effect of both policies is higher than the sum of the isolated effects. According to the results, increasing either Internal CSR or CGV without changing the other one does not cause any effects on productivity. However, if both policies are applied together, productivity increases by 2% by every standard deviation of increase in both explanatory variables. However, the other specifications do not support the existence of such complementarity.
These results are opened to interpretation. Regarding the impact of Internal CSR on productivity, a possible explanation could come from a social investment and reputation perspective following Turban and Greening (2007 and 2010). Firms with higher INT values provide better working conditions and consequently attract more talented individuals and retain the ones they have already trained. This interpretation is particularly relevant for model 3, which compares average values across firms, so that what matters for productivity is not so much the absolute value of the indicators but their value relative to the other firms, who might be competing against each other to attract talent. In models 1 and 2, that focus on within variation, and in model 4, that identifies a long term effect, the interpretation could be more related to the intrinsic effect on the productivity of individual workers: retention in the firm thanks to internal CSR might allow individual and collective learning to take place.
Finally, and more importantly, beyond all the evidence found on positive effects and complementarity, we must stress the fact that no evidence at all was found either on negative effects of or productive substitutability between CSR policies. This is a very important finding because, even in the absence of the effects explained before, it would mean that benefits for workers can be achieved without harming productivity.
Again, we must take into account the limitations of our results. In this case, our dependent variable is linear and continuous, but we still have potential endogeneity issues. Again, the satisfactory results of the Hansen tests do not guarantee that our instruments in the SysGMM are exogenous, and FE only controls for time invariant heterogeneity while neglecting variation between firms. And as for ABE and MAXT, nothing guarantees that the use of oldest available lag of the dependent variable is an adequate control for heterogeneity, path dependency and omitted variable bias.
38 Only firms with at least four observations in each relevant variable are kept, so that the delay in the impact is of 3 or more years.

30 ILO Working Paper No. 38
Conclusion and policy discussion The first aim of this research was to identify the determinants of labour-related CSR commitments taken by major firms. Our main findings are relatively in line with the literature on this issue: the more a company is visible, the more it tends to take public commitment with regards to labour and social issues. The level of commitment and measures is indeed positively associated with the age, the size and the internationalization. This relation is however not linear and the effect decreases with size and level of internationalization. The negative association with the growth rate of equity (combined with the positive association with age) can also indicate that more mature companies, which tend to have lower level of profits, take higher commitments. This result holds for both social commitments targeted at internal employees and external stakeholders. The evidence shows as well a strong sector heterogeneity. Everything else being equal, companies in the sectors of utilities, mining, and to a lesser extent manufacturing tend to commit more than other companies. The reasons for this higher level of commitment might vary quite a lot from one sector to another. The mining industry has been the target of many campaigns by NGOs in the last decades for the harsh working conditions in the lowest tier of its value chain39. Many companies in the utilities sector are former public companies and have for major clients public authorities, which might be more in demand of social responsibility. Finally, the rate of unionization is traditionally higher in the manufacturing industry.
More importantly, the integration of indicators related to the institutional context in the country of origin gives a more nuanced image of CSR than the one prevailing in the business literature. CSR is not a purely voluntary behaviour nor is completely determined by firms’ characteristics. The quality of labour rights and labour institutions seems to influence significantly the level of commitments and measures. Companies originating from countries where labour rights are higher and are well enforced tend to take higher CSR commitments for their own employees but also for external stakeholders (suppliers and local communities). In addition, the level of commitment is also positively associated with the degree of involvement of workers in corporate decisions. In companies originating from countries where higher obligations have been defined in terms information and consultation of workers and of possibility of codetermination, the level of commitment towards internal employees is also higher. These results echo previous research which showed that CSR practices must be seen as complements to strong institutions rather than substitutes to weak institutions (Jackson and Rathert, 2017). In the last decade, we can say that the expansion of labour-related CSR policies seems to be more related to stronger social regulations and capacity of workers to use their voice collectively.
The other aim of this research was to analyse the diversity of firms’ policies through the lens of possible complementarity or substitutability between the different CSR dimensions. In that respect, our results strengthen our convictions that freedom of association should be considered as an enabling right which is likely to have a crosscutting positive influence on other dimensions of CSR. Indeed, an increase in the level of commitment and measures in terms of freedom of association generally is associated with a higher level of commitments and measures on other CSR subdimensions related to internal employees (non-discrimination and health and safety) measured two years after. Besides, this effect is not limited to the company’s own employees. The evidence also suggests that an increase in the level of
39 Kucera and Principi (2014) found that the sector of mining and extraction was the only industry where the level of foreign direct investment was negatively associated with the level of democracy in the country of destination. In the case of this specific sector, we could thus reasonably make the assumption that CSR policies taken by major companies aim at substituting weak local institutions in countries of operation.

Corporate Social Responsibility: Exploring determinants and complementarities 31
commitment and measures to freedom of association causes an increase, albeit of a lesser magnitude, in the level of commitment and measures for the social monitoring of the supply chain and for the environmental strategy. Regarding the effect of freedom of association on socioeconomic impact on local communities, the evidence is however rather weak and inconclusive. In the past, many researchers have pointed out the rather selectivity of private regulations towards the most easily detectable violations of labour standards (such as wages, working hours and occupational health and safety), their weakness to ensure social rights such as freedom of association and the low level of involvement of workers in the different steps of these mechanisms (Barrientos and Smith, 2007; Anner, 2012; Marx and Wouters, 2016). In this research, we show that social dialogue and private mechanisms of corporate social responsibility should not be considered as contradictory and can be articulated into an effective way in order to ensure better rights and higher standards. Putting in place the conditions for effective social dialogue in an enterprise is likely to create an environment that enables the firm to better conciliate its various economic, social and environmental responsibilities.
The relationship between corporate social responsibility and corporate governance also deserves a special attention. While we showed that both issues do not depend on the same external factors (section 5.2 on passive complementarity), they should not however be seen as antagonic practices. The literature deriving from the agency theory sees CSR as an irresponsible behaviour diverting the enterprise from its sole and reasonable objective of profit maximisation. To the contrary, we did not find any evidence that the better governed firms from the perspective of shareholders (those with higher commitments in terms of corporate governance) take less commitments targeted at internal employees. Higher standards of corporate governance are even positively associated with higher commitments towards external employees in the supply chains. Poor working conditions in the supply chain is apparently seen as a potential business risk for shareholders. Regarding other external targets (local communities and environment), results are however more ambiguous.
In addition, our research also complements the already abundant (and rather inconclusive) literature on the link between corporate social responsibility and economic performance. According to various econometric specifications, CSR dimensions related to internal employees seems to have a positive effect on the total factor productivity of the company. The results holds for both longitudinal and “between” models which supports the ideas that the companies with a higher level of CSR attract or retain the more talented individuals but also that an individual and collective learning process is at play over the medium/long term. For a given firm, improving labour-related CSR performance by one standard deviation of the indicator is related with a future increase in productivity (in the range of 7% to 12%). Nevertheless, we did not find evidence of effects of other CSR variables (when taken individually), related to external stakeholders or to environment, on the economic performance of the firm. None of these coefficients are significantly different from 0 (albeit in a majority of cases, they are positive).
We also try to complement the literature on the relationship between corporate social responsibility and performance by searching for possible productive complementarities between subdimensions in the continuation of the work realized by Cavaco and Crifo (2014). Our results in this perspective are however still limited. Only in one of the four models we used, we found evidence of productive complementarity between CSR targeted at internal employees and corporate governance policies. However, the absence of substitutability relations is nevertheless an important result in itself, because it suggests that improvements in a certain subdimension of CSR should not generate any negative

32 ILO Working Paper No. 38
impact in other subdimensions’ productive impacts and thus imply an economic cost for the whole society.
Finally, we should point out some of the shortcomings of our current work. In our view, one of the main limitations of this research arises from the lack of information on the companies’ involvement in other countries either through foreign subsidiaries or through global supply chains. Consequently, we have not been able to measure the influence of countries of operations or supply in firms’ CSR behaviours. By definition, multinational companies are exposed to a broad set of stakeholders in their country of origin and abroad who can be able or not (depending on the State of Law) to express their interests through individual and collective voice mechanisms. Multinationals also have to face substantial differences (or gaps) in terms of regulation and compliance mechanisms by the public authorities. In a study based on a large set of European multinational companies and their foreign subsidiaries, Jackson and Rathert (2017) showed for example that CSR can work both as a complement of institutionalized stakeholder power in their country of origin and as a substitute for its absence in their countries of operation. We recognize that this issue represents an important issue for further research.
We also recognize that by definition the data used in this paper rely on the public information voluntarily disclosed by these companies and consequently favours a relatively explicit conception of CSR (Matten and Moon, 2008). This reflects the challenges in measuring CSR and this bias is common to most of the empirical literature related to this topic (Brammer et al, 2012). However, if we can acknowledge that CSR practices might vary substantially in quality and quantity from one company to another, the behaviour of most of the major companies in the world is now scrutinized by a large group of actors from the civil society (but also by for-profit actors, such as ESG rating agencies). There is no doubt that this growing pressure urges these companies to be more transparent. In this paper, we thus made the assumption that firms have an incentive to disclose the main elements of their CSR policy.
In this article, we also made the choice to assess the role of the institutional setting on the basis of several indexes measuring labour rights and workers’ participation and not take into account the entire complexity of firms’ institutional embeddedness. We recognize that further research would be needed to better reflect the interplay between different models of institutional settings and labour-related CSR policies. In the sphere of labour institutions, we could also analyse how certain characteristics of the workforce and labour markets such as skills (Aguilera and Jackson, 2003) or employment protection yield different outcomes in terms of CSR by giving more or less power to workers in influencing corporate decision. Beyond, other mechanisms and institutions may indeed influence corporates’ decisions such as (to name but a few) the availability of private actors in promoting and monitoring firms’ behaviours, the degree of competition between firms (Campbell 2007), or the type of legal systems (common law vs civil law) (Liang et al, 2017)40.
40 Liang and Renneboog (2017) have demonstrated that companies from common law countries, where ex post settling-up mechanisms (judicial resolutions) are more prevalent, have fewer CSR practices than companies from civil law countries where firms’ behaviour is generally more restricted ex ante by rule-based mechanisms.

Corporate Social Responsibility: Exploring determinants and complementarities 33
References
Adams, Z., Bishop, L., & Deakin, S. 2017. CBR Labour Regulation Index (Dataset of 117 Countries), Univeristy of Cambridge, Centre for Business Research.
Aguilera, R.V., Jackson, G. 2003. "The cross-national diversity of corporate governance: dimensions and determinants", Academy of Management Review, Vol. 28, No. 3, pp. 447-465
Aguilera, R.V., Filatotchev, I., Gospel, H., Jackson, G. 2008. "An Organizational Approach to Comparative Corporate Governance: Costs, Contingencies, and Complementarities", in Organization Science, Vol. 19, No. 3, May-June, pp. 475-492
Allouche, J., Laroche, P. 2005. Responsabilité sociale et performance financière des entreprises : une synthèse de littérature, Colloque “Responsabilité sociale des entreprises : réalité, mythe ou mystification ?”, Mars 2005, Nancy, France
Ali, W., Frynas, J.G., Mahmood, Z. 2017. "Determinants of Corporate Social Responsibility (CSR) Disclosure in Developed and Developing Countries: A Literature Review: Determinants of CSR Disclosure", in Corporate Social Responsibility and Environmental Management, Vol. 24, Issue 4, July/August, pp. 273-294
Anner, M. 2012. "Corporate social responsibility and freedom of association rights: The precarious quest for legitimacy and control in global supply chains", in Politics & Society, 40, pp. 609–644.
Arellano, M., & Bover, O. 1995. "Another look at the instrumental variable estimation of error-components models", in Journal of Econometrics, Vol. 68, Issue 1, pp. 29–51.
Barkemeyer, R., Preuss, L., Lee, L. 2015. "On the effectiveness of private transnational governance regimes—Evaluating corporate sustainability reporting according to the Global Reporting Initiative", in Journal of World Business, 50, pp. 312-325
Barrientos, S., Smith, S. 2007. "Do workers benefit from ethical trade? Assessing codes of labour practice in global production systems", in: Third World Quarterly, 28, pp. 713–729.
Blundell, R., & Bond, S. 1998. "Initial conditions and moment restrictions in dynamic panel data models", in Journal of Econometrics, Vol. 87, pp. 115–143.
Bond, S. 2002. "Dynamic panel data models: a guide to micro data methods and practice", in Portuguese Economic Journal, Vol. 1, Issue 2, pp. 141–162.
Bourguignon, R., Mias, A. (coord). 2017. Les accords-cadres internationaux: étude comparative des ACI conclus par les entreprises françaises, rapport pour le bureau de l'OIT pour la France
Brammer, S., Jackson, G., Matten, D. 2012. "Corporate social responsbility and institutional theory: new perspectives on private governance", in Socio-Economic Review, 10, pp. 3-28
Campbell, J.L. 2007. "Why would corporations behave in socially responsible ways? An institutional theory of corporate social responsibility", in Academy of Management Review, Vol. 32, No. 3, pp. 946-967

34 ILO Working Paper No. 38
Cavaco, S., & Crifo, P. 2014. "CSR and financial performance: complementarity between environmental, social and business behaviours", in Applied Economics, Vol. 46, Issue 27, pp. 3323-3338.
Delautre, G. 2017. Uneven practices in voluntary labour commitments: an exploration of major listed companies through the VigeoEiris database, ILO Research Department Working Paper No. 22, November
Ferrell, A., Liang, H., Renneboog, L. 2016. "Socially responsible firms, in Journal of Financial Economics, Vol. 122, Issue 3, pp. 585-606
Fifka, M.S. 2013. "Corporate Responsibility Reporting and its Determinants in Comparative Perspective - a Review of the Empirical Literature and a Meta-analysis: Corporate Responsibility Reporting and its Determinants", in Business Strategy and the Environment, Vol. 22, Issue 1, pp. 1-35.
Friedman, M. 1970. "The Social Responsibility of Business is to Increase its Profits", in The New York Times Magazine, September 13, 1970.
Galbreath, J. 2010. "How does corporate social responsibility benefit firms? Evidence from Australia", in European Business Review, Vol. 22, pp. 411-431
Gjolberg, M. 2009. "The origin of corporate social responsibillty: global forces or national legacies?", in Socio-Economic Review, Vol. 7, Issue 4, pp. 605-637
Granovetter, M. 1985. "Economic Action and Social Structure: The Problem of Embeddedness", in American Journal of Sociology, Vol. 91, No. 3, pp. 481-510
Greening, D.W., Turban, D.B. 2000. "Corporate Social Performance as a Competitive Advantage in Attracting a Quality Workforce", in Business & Society, Vol. 39, Issue 3, pp. 254 - 280
Habdi, H. 2003. "Factor Rotations in Factor Analyses", Lewis-Beck M., Bryman, A., Futing Liao, T. (ed) Encyclopedia of Social Sciences Research Methods, Thousand Oaks (CA), Sage.
Hadwiger, F. 2015. "Global framework agreements: Achieving decent work in global supply chains", Background paper, International Labour Office (Geneva)
Harjoto, M. A., Jo, H. 2011. "Corporate governance and CSR Nexus", in Journal of Business Ethics, Vol. 100, No. 1, pp. 45-67
Harjoto, M. A., Jo, H. 2012. "The causal effect of Corporate governance on Corporate Social Responsibility", in Journal of Business Ethics, Vol. 106, No. 1, pp. 53-72
Harper Ho, V., 2010. “Enlightened Shareholder Value”: Corporate Governance Beyond the Shareholder-Stakeholder Divide, in Journal of Corporation Law, Vol. 36, No. 1, p. 59
Hendrickx, F., Marx, A., Rayp, G., Wouters, J. 2016. "The architecture of global labour governance", in International Labour Review, Vol. 155, pp. 339–355.
Ioannou, I., Serafeim, G. 2012. "What drives corporate social performance? The role of national-level institutions", in Journal of International Business Studies, Vol. 43, pp. 834-864

Corporate Social Responsibility: Exploring determinants and complementarities 35
Ioannou, I., Serafeim, G. 2017. "The consequences of mandatory corporate sustainability reporting", Harvard Business School Research Working Paper No. 11-100
International Labour Organization. 2018. Greening with Jobs, World Employment and Social Outlook report 2018 (Geneva)
Jackson, G., Apostolakou, A. 2010. "Corporate Social Responsibility in Western Europe: An Institutional Mirror or Substitute?", in Journal of Business Ethics, Vol. 94, Issue 3, pp. 371-394
Jackson, G., Rathert, N. 2017. "Private Governance as Regulatory Substitute or Complement? A Comparative Institutional Approach to CSR Adoption by Multinational Corporations", in Dörrenbächer, C. and Geppert, M. (ed.), Multinational Corporations and Organization Theory: Post Millennium Perspectives (Research in the Sociology of Organizations, Volume 49) Emerald Publishing Limited, pp. 445 - 478
Jensen, M.C., Meckling, W.H. 1976. "Theory of the Firm: Managerial Behavior, Agency Costs and Ownership Structure", in Journal of Financial Economics, Vol. 3, No. 4, pp. 305-360
Jones, D.A. 2010. "Does serving the community also serve the company? Using organizational identification and social exchange theories to understand employee responses to a volunteerism programme", in Journal of Occupational an Organizational Psychology, Vol. 83, pp. 857-878
Kapoor, S., Sandhu, H.S. 2010. "Does it pay to be socially responsible? An empirical examination of impact of corporate social responsibility on financial performance", in Global Business Review, 11:2, pp. 185-208
Katchova, A. (2013). Principal Component Analysis. Retrieved July 21, 2018, from Econometrics Academy Website: https://sites.google.com/site/econometricsacademy/econometrics-models/principal-component-analysis
Kim, J.-O., & Mueller, C. 1978. "Factor Analysis. Statistical Methods and Practical Issues", Sage University Paper series on Quantitative Applications in the Social Sciences, series 07-014. Beverly Hills, CA, Sage
Kinderman, D. 2012. ""Free us up so we can be responsible!" The co-evolution of Corporate Social Responsibility and neo-liberalism in the UK, 1977-2010", in Socio-Economic Review, Vol. 10, pp. 29-57
Kinderman, D., Lutter, M. 2018. "Explaining the growth of CSR within OECD countries", MPIfG Discussion Paper, 18/2
Kucera, D., Principi, M. 2014. "Democracy and foreign direct investment at the industry level: evidence for US multinationals", in Review of World Economics, Vol. 150, No. 3, pp. 595-617
Kucera, D., Sari, D. 2016. "New Labour Rights Indicators: Method and Results", Working Paper 002, Center for Global Workers' Rights
Liang, H., Renneboog, L. 2017. "On the foundations of corporate social responsibility", in The Journal of Finance, Vol. 72, Issue 2, pp. 853-910

36 ILO Working Paper No. 38
Lucchini, A., Moisello, A.M. 2017. "CSR disclosure, Visibility and media pressure - International evidence from the apparel and textile industry", in European Journal of Economics, Finance and Administrative Sciences, Vol. 93, pp. 5-29
Margolis, J.D., Walsh, J.P. 2003. "Misery loves companies: rethinking social initiatives by business", in Administrative Science Quarterly, Vol. 48, No. 2, pp. 268-305
Margolis, J., Elfenbein, H., Walsh, J. 2009. "Does it pay to be good… and does it matter? A meta-analysis of the relationship between corporate social and financial performance", Harvard University, working paper
Marquis, C., Qian, C. 2014. "Corporate social responsibility reporting in China: symbol or substance?", in Organization Science, Vol. 25, No. 1, pp. 127-148
Marx, A., Wouters, J. 2016. "Redesigning enforcement in private labour regulation: Will it work?", in International Labour Review, Vol. 155, pp. 435–459.
Matten, D., Moon, J. 2008. ""Implicit" and "Explicit" CSR: a conceptual framework for a comparative understanding of corporate social responsibility", in Academy of Management Review, Vol. 33, No. 2, pp. 404-424
Neyman, J., & Scott, E. 1948. "Consistent Estimates Based on Partially Consistent Observations", in Econometrica, Vol. 16, No. 1, pp. 1–32.
Nickell, S. 1981. "Biases in Dynamic Models with Fixed Effects", in Econometrica, Vol. 49, No. 6, pp. 1417-1426.
Orlitzky, M., Schmidt, F., Rynes, S. 2003. "Corporate social and financial performance: a meta-analysis", in Organization Studies, March, Vol. 24, No. 3, pp. 403-441
Orlitzky, M., Louche, C., Gond, J-P., Chapple, W. 2017. "Unpacking the Drivers of Corporate Social Performance: A Multilevel, Multistakeholder, and Multimethod Analysis", in Journal of Business Ethics, Vol. 144, pp. 21-40
Papadakis, K. ed. 2008. "Cross-border social dialogue and agreements: an emerging global industrial relations framework?", International Institute for Labour Studies (Geneva, ILO).
Papadakis, K. ed. 2011. "Shaping global industrial relations: the impact of international framework agreements", International Labour Organization Century Series (New York, Palgrave Macmillan).
Papke, L. 2005. "The effects of spending on test pass rates: Evidence from Michigan", in Journal of Public Economics, Vol. 89, Issues 5-6, pp. 821-839
Papke, L. E., & Wooldridge, J. M. 1996. "Econometric Methods for Fractional Response Variables with an Application to 401(k) Plan Participation Rates", in Journal of Applied Econometrics, Vol. 11, Issue 6, pp. 619-632
Papke, L., & Wooldridge, J. 2008. "Panel data methods for fractional response variables with an application to test", in Journal of Econometrics, Vol. 145, Issues 1-2, pp. 121–133.

Corporate Social Responsibility: Exploring determinants and complementarities 37
Phillips, N., LeBaron, G., Wallin, S. 2018. "Mapping and Measuring the Effectiveness of Labour-related Disclosure Requirements for Global Supply Chains", International Labour Organizaiton, Research Department Working Paper No. 32
Roodman, D. 2009. "A Note on the Theme of Too Many Instruments", Oxford Bulleting of Economics and Statistics, Vol. 71, Issue 1, pp. 135-158
Roodman, D. 2009. "How to do xtabond2: An introduction to difference and system GMM in Stata", Stata Journal, Vol. 9, Issue 1, pp. 86-136.
Schuster, M., & Maertens, M. 2013. "Do private standards create exclusive supply chains? New evidence from the Peruvian asparagus export sector", in Food Policy, Vol. 43, pp. 291-305.
StataCorp. 2011. Stata Statistical Software: Release 12, College Station, TX, StataCorp LP.
StataCorp. 2013. Stata 13 Base Reference Manual, College Station, TX, Stata Press.
Torres-Reyna, O. 2010. Getting Started in Factor Analysis (using Stata 10), Retrieved July 21, 2018, from Data and Statistical Services - Princeton University: https://dss.princeton.edu/training/Factor.pdf
Turban, D.B., Greening, D.W. 1996. "Corporate Social Performance and Organizational Attractiveness to Prospective Employees", in The Academy of Management Journal, Vol. 40, No. 3, pp. 658-672
Vigneau, L., Humphreys, M., Moon, J. 2015. " How Do Firms Comply with International Sustainability Standards? Processes and Consequences of Adopting the Global Reporting Initiative", in Journal of Business Ethics, Vol. 131, pp. 469-486
Wang, J., Tian, G., Fan, W., Luo, D. 2017. "The Effect Of Mandatory Regulation On Corporate Social Responsibility Reporting Quality: Evidence from China", in The Journal of Applied Business Research, Vol. 33, No. 1, pp. 67-86
Williams, R. 2009. "Using Heterogeneous Choice Models to Compare Logit and Probit Coefficients Across Groups", in Sociological Methods & Research, Vol. 37(4), pp. 531-559
Wooldridge, J. 2010. "Correlated Random Effects Models with Unbalanced Panels", Mimeo
Zarlowski, P. 2007. “Marketing corporate social responsability in a national context : The case of social rating agencies in France”, in den Hond, F., de Bakker, F., Neergaard, P. (ed.) Managing corporate social responsibility in action : talking, doing and measuring, pp. 167–186

38 ILO Working Paper No. 38
Appendices
Appendix A: Complete descriptive statistics
Table 7: Descriptive statistics – all variables
Variable Observations
Firms Mean Min Max Standard Deviation
Unit Total Average per firm Overall Within Between
Respect for freedom of association and the right to collective bargaining
10,972 3.54 3,103 14 0 100 19 9 14 Points (0-100)
Non-Discrimination 11,412 3.66 3,119 39 0 100 25 12 22 Points (0-100) Promotion of labour relations 9,567 3.88 2,463 21 0 100 24 10 19 Points (0-100)
Responsible management of restructurings 9,301 3.10 2,997 11 0 100 19 8 15 Points (0-100)
Career management and promotion of employability 10,860 3.51 3,091 32 0 100 20 9 17 Points (0-100)
Improvement of health and safety conditions 11,189 3.60 3,106 37 0 100 23 10 20 Points (0-100)
Integration of social factors in the supply chain 6,972 3.18 2,190 27 0 96 26 11 22 Points (0-100)
Promotion of the social and economic development 8,016 3.25 2,463 28 0 100 22 10 19 Points (0-100)
Prevention of Corruption 9,789 3.38 2,892 38 0 94 22 11 20 Points (0-100) Environmental Strategy and Eco-Design 11,529 3.69 3,125 43 0 100 24 11 22 Points (0-100)
Minimising environmental impacts from energy use 11,154 3.61 3,086 35 0 100 23 11 21 Points (0-100)
Integration of environmental factors in the supply chain
5,707 3.25 1,755 28 0 95 23 10 20 Points (0-100)
Board of directors 11,529 3.69 3,125 43 0 100 26 12 23 Points (0-100) Audit and internal Controls 11,507 3.68 3,123 50 0 100 25 11 23 Points (0-100) Shareholders 11,487 3.68 3,120 53 0 100 27 13 25 Points (0-100) Executive remuneration 11,507 3.68 3,123 35 0 100 26 10 24 Points (0-100) Age 68,891 23.29 2,958 12 0 29 8 8 4 Year Employees 62,999 20.41 3,086 28,486 1 2,300,000 63,056 28,456 53,013 Unit Labour expenditure 35,366 14.31 2,472 1,261 0 79,371 2,867 1,372 2,186 Million USD Operating income before depreciation 60,948 20.62 2,956 1,451 -54,513 81,836 3,728 2,248 2,913 Million USD
Assets 66,276 22.41 2,958 32,914 0 3,664,354 149,334 88,101 128,399 Million USD
Domestic assets 36,416 13.20 2,759 21,397 0 3,270,108 110,323 57,434 101,903 Million USD
Sales 66,822 22.60 2,957 8,963 0 485,651 21,034 11,681 17,063 Million USD Domestic sales 43,985 15.38 2,860 6,147 0 357,559 14,496 7,011 12,407 Million USD Equity 65,403 22.12 2,957 5,333 0 293,194 13,375 8,493 10,494 Million USD Labour rights 6,040 2.00 3,020 0.63 0.00 1.00 0.26 0.03 0.26 Points (0-1) CBR30 - Codetermination: board membership 93,363 29.87 3,126 0.11 0.00 1.00 0.28 0.10 0.26 Points (0-1)
CBR31 - Codetermination and information /consultation of workers
93,363 29.87 3,126 0.34 0.00 1.00 0.32 0.14 0.29 Points (0-1)
Internal CSR 10,542 3.42 3,078 30.32 0.00 93.54 18.59 7.30 16.26 Points (0-1) External CSR 5,791 2.94 1,970 27.47 0.00 94.50 20.93 8.12 18.23 Points (0-1) CGV 11,487 3.68 3,120 44.33 0.00 95.58 21.14 7.32 20.23 Points (0-1) Codetermination 93,363 29.87 3,126 0.43 0.00 1.00 0.40 0.17 0.36 Points (0-1) Log TFP 28,714 11.86 2,421 -0.31 -7.24 4.39 0.78 0.36 0.74 Logs Intz Assets 36,416 13.20 2,759 0.43 0.00 1.00 0.35 0.18 0.32 Fraction of 1 Intz_Sales 43,985 15.38 2,860 0.38 0.00 1.00 0.30 0.15 0.28 Fraction of 1

Corporate Social Responsibility: Exploring determinants and complementarities 39
Figure 3: Frequency distribution of pairwise correlations between all subdimensions
Table 8: Firms by sector – Disaggregated classification
Aerospace 32 Agriculture, Hunting, Forestry and Fishing 1 Automobiles 86 Beverage 46 Building Materials 47 Business Support Services 85 Chemicals 128 Education 6 Electric Components & Equipment 42 Energy 36 Financial Services - General 531 Financial Services - Real Estate 171 Food 100 Health Care Equipment & Services 163 Heavy Construction 45 Home Construction 17 Hotel, Leisure Goods & Services 64 Industrial Goods & Services 88 Luxury Goods & Cosmetics 36 Mechanical Components & Equipment 91 Mining & Metals 168 Oil Equipment & Services 55 Other 39 Other Community, Social and Personal Services 16 Public Admin and Defence; Compulsory Social Security 5 Publishing 57 Software & IT Services 86 Technology-Hardware 142 Telecommunications 177 Tobacco 14 Transport & Logistics 82 Travel & Tourism 52 Waste & Water Utilities 176 Wholesale and Retail 242 Total 3,126
0.025
0.050
0.075
0.100
0.125
0.150
0.175
0.200
0.225
0.250
0.275
0.300
0.325
0.350
0.375
0.400
0.425
0.450
0.475
0.500
0.525
0.550
0.575
0.600
0.625
0.650
0.675
0.700
0.725
0.750
0.775
0.800
0
10
20
30
40
50
60
70
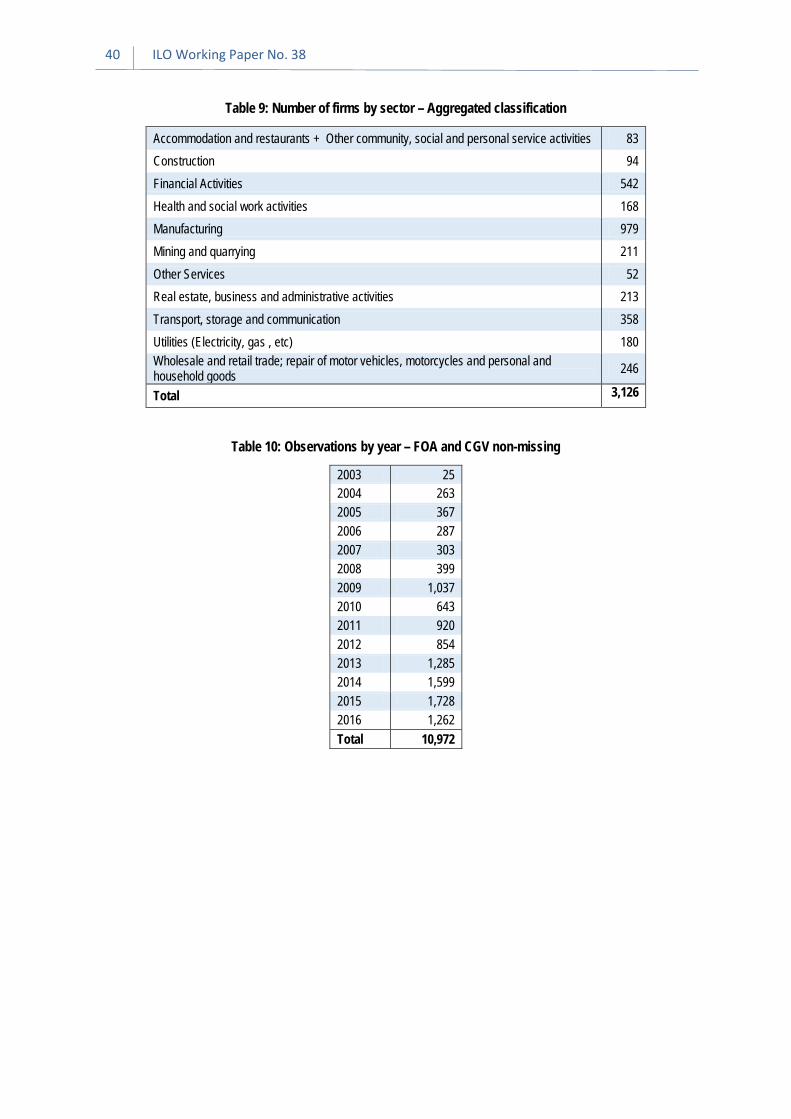
40 ILO Working Paper No. 38
Table 9: Number of firms by sector – Aggregated classification
Accommodation and restaurants + Other community, social and personal service activities 83 Construction 94 Financial Activities 542 Health and social work activities 168 Manufacturing 979 Mining and quarrying 211 Other Services 52 Real estate, business and administrative activities 213 Transport, storage and communication 358 Utilities (Electricity, gas , etc) 180 Wholesale and retail trade; repair of motor vehicles, motorcycles and personal and household goods 246
Total 3,126
Table 10: Observations by year – FOA and CGV non-missing
2003 25 2004 263 2005 367 2006 287 2007 303 2008 399 2009 1,037 2010 643 2011 920 2012 854 2013 1,285 2014 1,599 2015 1,728 2016 1,262 Total 10,972

Corporate Social Responsibility: Exploring determinants and complementarities 41
Appendix B: Factor analysis
The analysis can be represented as a simultaneous equations model where 𝐸𝐸 factors 𝐹𝐹𝑜𝑜 determine the 𝐼𝐼 observed variables 𝐸𝐸𝑘𝑘 through the same number of linear combinations 𝜆𝜆𝑘𝑘 = (𝜆𝜆𝑘𝑘1𝜆𝜆𝑘𝑘2 … 𝜆𝜆𝑘𝑘𝑘𝑘)′, where each 𝜆𝜆𝑘𝑘𝑜𝑜 element is known as a ‘factor loading’:
Equation 6: Equation system of the factor analysis
𝐸𝐸1 = 𝜆𝜆11𝐹𝐹1 + 𝜆𝜆12𝐹𝐹2 + ⋯+ 𝜆𝜆1𝑘𝑘𝐹𝐹𝑘𝑘𝐸𝐸2 = 𝜆𝜆21𝐹𝐹1 + 𝜆𝜆22𝐹𝐹2 + ⋯+ 𝜆𝜆2𝑘𝑘𝐹𝐹𝑘𝑘
⋮𝐸𝐸𝑁𝑁 = 𝜆𝜆𝑁𝑁1𝐹𝐹1 + 𝜆𝜆𝑁𝑁2𝐹𝐹2 + ⋯+ 𝜆𝜆𝑁𝑁𝑘𝑘𝐹𝐹𝑘𝑘
As explained previously, the total variance of the original variables can be explained in terms of the common factors and the unique components. The proportion of variance in 𝐸𝐸𝑘𝑘 explained by 𝐹𝐹𝑜𝑜 is measured by 𝜆𝜆𝑘𝑘𝑜𝑜2 , whereas the sum of such proportions across all factors is known as ‘communality’ and simply means the share of variance explained by the common factors. The remaining variance, symbolized by 𝜃𝜃𝑘𝑘2, is known as ‘uniqueness’. In sum, we can explain the total variance of 𝐸𝐸𝑘𝑘using the following equation:
Equation 7: Communality and uniqueness
�𝜆𝜆𝑘𝑘𝑜𝑜2𝑘𝑘
𝑜𝑜=1
= 1 − 𝜃𝜃𝑘𝑘2
In order to facilitate interpretation of the results, choices must be made in terms of factor retention, factor rotation and threshold for 𝐹𝐹𝐴𝐴𝐻𝐻(𝜆𝜆𝑘𝑘𝑜𝑜). As for the first one, it easies interpretation by providing a criterion to minimize the number of factors kept for further analysis. In order to do so, we apply Kaiser’s rule, by which only factors with eigenvectors higher than 1 are kept, and this, in turn, means that all of them explain an equal or greater variation than any of the original variables. Regarding factor rotation, it helps interpretation by reinforcing the association of each variable with a smaller number of factors (ideally, only one) than in the case of unrotated factors. To this end, we present the VARIMAX and PROMAX rotations. Finally, the threshold 𝜏𝜏 for 𝐹𝐹𝐴𝐴𝐻𝐻(𝜆𝜆𝑘𝑘𝑜𝑜) will indicate the value above which a factor will be considered relevant, which will certainly affect the number of factors to which a variable is considered to be associated.

42 ILO Working Paper No. 38
Appendix C: Computation of Total Factor Productivity
Assuming a Cobb-Douglas production function, we model output 𝑌𝑌 of firm 𝑅𝑅 in period 𝑡𝑡 as a function of labour 𝐿𝐿, capital 𝐾𝐾 and a residual component 𝐹𝐹. Labour is measured by the number of employees, capital by the book value of assets and output is estimated as the value added, in turn computed as the sum of wages and profits. As for coefficients 𝛼𝛼 and 𝜎𝜎, they represent returns to scale of production factors.
Equation 8: Production function
𝑌𝑌𝑜𝑜,𝑡𝑡 = 𝐿𝐿𝑜𝑜,𝑡𝑡𝛼𝛼 𝐾𝐾𝑜𝑜,𝑡𝑡𝜎𝜎 𝐹𝐹𝑜𝑜,𝑡𝑡
Furthermore, these coefficients also indicate the optimal combination of labour and capital. Deriving the optimal quantities, we have that for each unit of labour 𝛼𝛼
𝜎𝜎 units of capital are necessary.
Equation 9: Derivation of K/L ratio in equilibrium
𝐶𝐶𝑌𝑌/𝐶𝐶𝐿𝐿 = 𝛼𝛼𝐿𝐿𝑜𝑜,𝑡𝑡𝛼𝛼−1𝐾𝐾𝑜𝑜,𝑡𝑡𝜎𝜎 𝐹𝐹𝑜𝑜,𝑡𝑡
𝐶𝐶𝑌𝑌/𝐶𝐶𝐾𝐾 = 𝜎𝜎𝐿𝐿𝑜𝑜,𝑡𝑡𝛼𝛼 𝐾𝐾𝑜𝑜,𝑡𝑡𝜎𝜎−1𝐹𝐹𝑜𝑜,𝑡𝑡
𝛼𝛼𝐿𝐿𝑜𝑜,𝑡𝑡𝛼𝛼−1𝐾𝐾𝑜𝑜,𝑡𝑡𝜎𝜎 𝐹𝐹𝑜𝑜,𝑡𝑡 = 𝜎𝜎𝐿𝐿𝑜𝑜,𝑡𝑡𝛼𝛼 𝐾𝐾𝑜𝑜,𝑡𝑡𝜎𝜎−1𝐹𝐹𝑜𝑜,𝑡𝑡 𝛼𝛼𝜎𝜎𝐾𝐾𝑜𝑜,𝑡𝑡∗ = 𝐿𝐿𝑜𝑜,𝑡𝑡∗
A more precise formulation should take into account sector heterogeneity. Returns to scale and, hence, the ratio of labour to capital, should be expected to differ significantly across sectors. Moreover, the use of assets book value as a proxy for capital stock introduces further heterogeneity in the labour-capital ratio 𝛼𝛼 𝜎𝜎⁄ .Additionally, since we use nominal value added as a proxy for output, we must allow for sector heterogeneity in the residual component, reflecting differences in product characteristics, monopoly power and other market features that can impact on, for example, the profit margin per unit41. Thus, we adequate our model by adding sector subscripts 𝐷𝐷 to to 𝛼𝛼 and 𝜎𝜎 and reformulating 𝐹𝐹 as the product of a sector constant 𝐶𝐶 and a firm-year idiosyncratic component 𝑍𝑍, which corresponds to time-variant and firm-specific productivity:
Equation 10: Production function with sector heterogeneity
𝑌𝑌𝑜𝑜,𝑡𝑡 = 𝐿𝐿𝑜𝑜,𝑡𝑡𝛼𝛼𝑐𝑐𝐾𝐾𝑜𝑜,𝑡𝑡
𝜎𝜎𝑐𝑐𝐶𝐶𝑐𝑐𝑍𝑍𝑜𝑜,𝑡𝑡
Taking logs and setting 𝜀𝜀𝑜𝑜,𝑡𝑡 = 𝑇𝑇𝐿𝐿𝑅𝑅𝑍𝑍𝑜𝑜,𝑡𝑡, we obtain our regression model:
Equation 11: Econometric specification
𝑇𝑇𝐿𝐿𝑅𝑅𝑌𝑌𝑜𝑜,𝑡𝑡 = 𝛼𝛼𝑐𝑐 𝑇𝑇𝐿𝐿𝑅𝑅𝐿𝐿𝑜𝑜,𝑡𝑡 + 𝜎𝜎𝑐𝑐 𝑇𝑇𝐿𝐿𝑅𝑅𝐾𝐾𝑜𝑜,𝑡𝑡 + 𝑇𝑇𝐿𝐿𝑅𝑅𝐶𝐶𝑐𝑐 + 𝜀𝜀𝑜𝑜,𝑡𝑡
Since this is a growth accounting estimation, we estimate our equation using an OLS model and retrieve the residuals 𝜀𝜀�̂�𝑜,𝑡𝑡, which in our model are equivalent to the estimated logarithm of firm-specific TFP.
41 For example, greater market power allows the firm increase mark-up and reduce output, rising profits. If profit increase overwhelms the smaller wage mass, then we will have a greater nominal value added with fewer output.

Corporate Social Responsibility: Exploring determinants and complementarities 43
Appendix D: Regression tables – active complementarity
Table 11: Impact of Freedom of Association on Non-Discrimination at Workplace
Dep. var. 1 2 3 4 ND SysGMM FE FP-FE FP L2.ND 0.58 *** 0.17 *** 0.29 *** 1.75 *** 0.00 0.00 0.00 0.00 L2.FOA 0.19 *** 0.06 *** 0.01 *** 0.05 *** 0.00 0.00 0.00 0.00 L2.CGV -0.05 0.05 * 0.02 ** 0.05 *** 0.34 0.09 0.02 0.00 L2.EMP 0.03 0.05 0.00 0.02 *** 0.11 0.16 0.52 0.00 Age 0.04 0.00 0.03 *** 0.12 0.67 0.00 Labour rights 0.02 0.03 *** 0.54 0.00 Codetermination -0.01 -0.02 * -0.01 *** 0.00 0.58 0.08 0.00 0.18 Years Yes Yes Yes Yes Sectors Yes No No Yes Std Error Robust Robust Robust Robust
Model System GMM Least Squares - Within
Fractional Probit - Within
Fractional Probit - Pooled
Obs 4242 4257 4257 4242 Firms 1648 1663 1663 1648 Non-collinear instruments in SysGMM: 168 p-values in italics * p<0.10, **p<0.05, *** p<0.10
p-values of relevant tests for Specification 1 (SysGMM) Hansen 0.40 GMM instr: Unrestricted Hansen 0.23 Diff-in-Hansen 0.72 IV instr: Unrestricted Hansen 0.29 Diff-in-Hansen 0.71 AR(2) 0.00 AR(4) 0.80

44 ILO Working Paper No. 38
Table 12: Impact of Freedom of Association on Health and Safety
Dep. var. 1 2 3 4 HS SysGMM FE FP-FE FP L2.HS 0.50 *** 0.14 *** 0.17 *** 1.90 *** 0.00 0.00 0.00 0.00 L2.FOA 0.19 *** 0.05 *** 0.01 *** 0.06 *** 0.00 0.01 0.01 0.00 L2.CGV -0.03 -0.01 0.01 0.04 *** 0.48 0.76 0.54 0.00 L2.EMP 0.05 ** 0.07 * 0.00 0.01 *** 0.03 0.08 0.38 0.00 Age 0.03 0.00 0.03 *** 0.20 0.69 0.00 Labour rights 0.04 0.04 *** 0.22 0.00 Codetermination 0.01 -0.02 * 0.00 *** 0.00 0.85 0.05 0.00 0.22 Years Yes Yes Yes Yes
Sectors Yes No No Yes
Std Error Robust Robust Robust Robust
Model System GMM Least Squares - Within
Fractional Probit - Within
Fractional Probit - Pooled
Obs 4088 4103 4103 4088 Firms 1634 1649 1649 1634 Non-collinear instruments in SysGMM: 223 p-values in italics * p<0.10, **p<0.05, *** p<0.10
p-values of relevant tests for Specification 1 (SysGMM) Hansen 0.38 GMM instr: Unrestricted Hansen 0.44 Diff-in-Hansen 0.72 IV instr: Unrestricted Hansen 0.36 Diff-in-Hansen 0.95 AR(2) 0.00 AR(4) 0.43

Corporate Social Responsibility: Exploring determinants and complementarities 45
Table 13: Impact of Freedom of Association on Social Factors in the Supply Chain
Dep. var. 1 2 3 4 SSC SysGMM FE FP-FE FP L2.SSC 0.66 *** 0.17 *** 0.36 *** 2.34 *** 0.00 0.00 0.00 0.00 L2.FOA 0.10 * 0.05 ** 0.01 0.05 *** 0.099 0.04 0.16 0.00 L2.CGV 0.22 ** 0.08 * 0.07 *** 0.08 *** 0.01 0.06 0.00 0.00 L2.EMP 0.02 -0.08 0.00 ** 0.00 0.47 0.29 0.02 1.00 Age 0.05 ** 0.00 0.01 0.04 0.24 0.47 Labour rights 0.05 0.02 0.11 0.17 Codetermination -0.02 0.00 0.00 *** 0.00 0.54 0.94 0.01 0.35 Years Yes Yes Yes Yes
Sectors Yes No No Yes
Std Error Robust Robust Robust Robust
Model System GMM Least Squares - Within
Fractional Probit - Within
Fractional Probit - Pooled
Obs 2456 2465 2465 2456 Firms 1017 1026 1026 1017 Non-collinear instruments in SysGMM: 192 p-values in italics * p<0.10, **p<0.05, *** p<0.10
p-values of relevant tests for Specification 1 (SysGMM) Hansen 0.45 GMM instr: Unrestricted Hansen 0.81 Diff-in-Hansen 0.74 IV instr: Unrestricted Hansen 0.87 Diff-in-Hansen 0.53 AR(2) 0.00 AR(4) 0.78

46 ILO Working Paper No. 38
Table 14: Impact of Freedom of Association on Promotion of Social and Economic Development
Dep. var. 1 2 3 4 PSED SysGMM FE FP-FE FP L2.PSED 0.55 *** 0.18 *** 0.19 ** 2.33 *** 0.00 0.00 0.02 0.00 L2.FOA 0.11 0.00 0.00 0.05 *** 0.19 0.94 0.82 0.00 L2.CGV 0.21 ** -0.04 -0.01 0.04 *** 0.01 0.29 0.61 0.00 L2.EMP 0.03 -0.15 *** 0.00 0.01 *** 0.43 0.00 0.57 0.01 Age 0.11 0.00 0.01 0.58 0.55 0.49 Labour rights 0.09 ** 0.06 *** 0.01 0.00 Codetermination -0.02 -0.01 0.00 ** 0.00 0.65 0.52 0.05 0.95 Years Yes Yes Yes Yes
Sectors Yes No No Yes
Std Error Robust Robust Robust Robust
Model System GMM Least Squares - Within
Fractional Probit - Within
Fractional Probit - Pooled
Obs 2663 2675 2675 2663 Firms 1176 1188 1188 1176 Non-collinear instruments in SysGMM: 204 p-values in italics * p<0.10, **p<0.05, *** p<0.10
p-values of relevant tests for Specification 1 (SysGMM) Hansen 0.47 GMM instr: Unrestricted Hansen 0.71 Diff-in-Hansen 0.65 IV instr: Unrestricted Hansen 0.78 Diff-in-Hansen 0.45 AR(2) 0.03 AR(4) 0.34

Corporate Social Responsibility: Exploring determinants and complementarities 47
Table 15: Impact of Freedom of Association on Environmental Strategy
Dep. var. 1 2 3 4 ENV SysGMM FE FP-FE FP L2.ENV 0.55 *** 0.18 *** 0.33 *** 2.02 *** 0.00 0.00 0.00 0.00 L2.FOA 0.10 * 0.04 * 0.01 ** 0.04 *** 0.06 0.05 0.03 0.00 L2.CGV 0.09 -0.01 0.01 0.02 *** 0.25 0.66 0.53 0.00 L2.EMP 0.04 -0.02 0.00 0.01 *** 0.13 0.78 0.87 0.00 Age 0.13 0.00 0.02 ** 0.27 0.50 0.02 Labour rights 0.08 *** 0.03 *** 0.01 0.00 Codetermination 0.02 0.02 * 0.00 0.00 0.13 0.08 0.74 0.27 Years Yes Yes Yes Yes
Sectors Yes No No Yes
Std Error Robust Robust Robust Robust
Model System GMM Least Squares - Within
Fractional Probit - Within
Fractional Probit - Pooled
Obs 4277 4292 4292 4277 Firms 1652 1667 1667 1652 Non-collinear instruments in SysGMM: 244 p-values in italics * p<0.10, **p<0.05, *** p<0.10
p-values of relevant tests for Specification 1 (SysGMM) Hansen 0.40 GMM instr: Unrestricted Hansen 0.47 Diff-in-Hansen 0.46 IV instr: Unrestricted Hansen 0.31 Diff-in-Hansen 0.89 AR(2) 0.02 AR(4) 0.39

48 ILO Working Paper No. 38
Appendix E: Additional information on productive complementarity
Table 16: Information on SysGMM
p-values of relevant tests for Specification 1 (SysGMM) Hansen 0.40 GMM instr: Unrestricted Hansen 0.41 Diff-in-Hansen 0.42 IV instr: Unrestricted Hansen 0.21 Diff-in-Hansen 0.90 AR(1) 0.37 AR(2) 0.25 AR(3) 0.51 AR(4) 0.53