corporate restructuring: empirical evidence on the...
TRANSCRIPT

1
Corporate Restructuring: Empirical Evidence on the Approval of the
Reorganization Plan
Abstract
When a corporation presents a reorganization plan, it expects its creditors to approve the
plan. This paper provides empirical evidence regarding the likelihood of approval based
on reorganization plans for creditors in Brazil that require approval by employees, and
secure and unsecure debtholders. Using a sample of 120 reorganization plans proposed
by corporations from 2005 to 2014, we find that (i) the labor class of creditors is likely
to approve the reorganization plan even when the plan is rejected; (ii) plans with more
heterogeneous payment for classes are less likely to be accepted; (iii) plans are less
likely to be accepted when there are more unsecure creditors; and (iv) plans with
divestment proposals are more likely to be accepted. Finally, as expected given the
seniority position of secured debt, plans are less likely to be accepted when the portion
of secured debt is higher, and the reverse is true for unsecured debt.
JEL classification: G32;G33
Keywords: Corporate restructuring; reorganization plan; bankruptcy.

2
1 Introduction
When a company faces financial distress it may choose to devise a
reorganization plan. Such a plan must be presented to its creditors who ultimately vote
to approve the reorganization plan or subject the company to bankruptcy proceedings.
This paper examines this decision making process. We present empirical evidence
regarding the approval of reorganization plans, as we believe that a clear gap exists in
how each class of creditors decides to approve or reject reorganization plans during the
creditors' general meeting. Collectively, our results show that debtholders’ behavior
depends on their claim rights. Moreover, asset disposal facilitates the approval of
reorganization plans.
The literature on law and finance states that debt restructuring can be considered
a complex decision process involving a firm and its lenders, and stresses that debt
reorganization plans and claimholders’ relative recoveries in court depend on how
disputes between creditors are resolved (Gilson, Hotchkiss, and Ruback, 2000).
Empirical evidence demonstrates the importance of bankruptcy law to the credit market
and enforcement by courts.
A country’s bankruptcy laws provide the basis for helping claimholders resolve
uncontemplated conflicts during debt restructuring. Therefore, in designing bankruptcy
laws, policymakers must consider numerous reorganization procedures to reduce the
likelihood that a firm is dismantled inefficiently.
We provide an analysis based on Kaplan and Stromberg (2002) and Kaplan and
Stromberg (2004) using databases suffering from sample bias not present in data from
quasi-experiments. Therefore, we do not address causality in our study. However, to our
knowledge, this is the first study to examine the likelihood of acceptance of
reorganization plans by considering the decision process of each class of claimholders
and the characteristics of the plans. As Kordana and Posner (1999) note, little attention
has been devoted to the examination of the correspondence between voting rules during
reorganizations. Moreover, Thadden, Berglof and Roland (2010) suggest that many
conflicts of interests are solved ex post during the bankruptcy or reorganization period.
Hence, our descriptive results corroborate the topic by providing evidence on the
characteristics surrounding creditor’s decision making process.
We present empirical evidence about the characteristics of voting on
reorganization plans by separately conducting the analyses according to the outcome of

3
the vote on the plan. Hence, this paper investigates a very important issue from not only
a theoretical perspective but also a managerial point of view.
Following the requirements specified by Brazilian bankruptcy law 11,101, we
attempt to establish the likelihood of acceptance of reorganization plans when firms
present them to each claimholder during the creditors’ general meeting. We aim to
understand how different classes of creditors vote in approving or rejecting recovery
plans by controlling for the conditions specified in the reorganization plans. We analyze
data collected from 2005 to 2014; we use 2005 as the starting year because the new
Brazilian bankruptcy law entered into force in this year.
Why do we use Brazilian data in our study? Under Brazilian bankruptcy law
single creditors’ votes are considered in the decision to reorganize or liquidate a
company, where claimholders meet with each other in an Assembly to decide the future
of the company. Given this context, it may be easier to identify differences in voting
power, incentives and influence from both classes of creditors and individual
claimholders since we can observe the interaction among creditors during this meeting.
In the US, indenture trustees act on behalf of creditors: therefore, claimholders do not
meet to vote on reorganization plans. Although creditors vote by following a different
procedure, Ponticelli (2012) shows that similarities exist between Brazilian bankruptcy
law and the US bankruptcy code. Further, Anapolsky and Woods (2013) present more
details about the similarities and differences in reorganization rules between the two
countries.
Under new Brazilian bankruptcy law, creditors play a more important role in
company restructuring because of the voting procedure for reorganization plans. After
choosing to restructure its debt in court, a firm must create a reorganization plan that
aims to present a solution for its financial distress. Unlike Chapter 11 in the US
bankruptcy code, Brazilian bankruptcy law does not require a claim administrator to
organize and provide information on all claims and claimholders. Moreover, when a
creditor does not approve the reorganization plan presented by a specific firm, the
different classes of creditors decide whether to allow recover or to subject the firm to
bankruptcy together in an Assembly, where the labor, secured and unsecured creditors
vote on the plan.
All three classes of creditors must vote to approve the plan. With regard to
secured and unsecured creditors, the plan must be accepted by a majority of creditors at
the meeting (number criteria) and at least half of the total debt value for each class must

4
be represented during the vote (value criteria). By contrast, for labor creditors, only a
majority vote is required (number criteria). These two criteria allow firms to avoid
opportunistic behavior from creditors, where some creditors might refuse to approve the
plan if they do not receive special treatment. If the plan is rejected, the firm enters
bankruptcy.
We use data from Vara de Falências e Recuperação Judicial in São Paulo and
from firms’ website. Based on data on 120 restructuring plans from 2005 to 2014 we
find that the labor class of creditors approves the reorganization plan even when the
plan is ultimately rejected. Moreover, we find that approved plans have a smaller
portion of debt discounted and higher grace period on average than rejected and
modified plans. Further, rejected reorganization plans have higher disparities in
payment proposals within the same class of creditors, and reorganization plans that were
modified during the creditors’ meeting have higher disparities in payment proposals
among the classes of creditors.
To evaluate the likelihood of acceptance of reorganization plans, we run probit
regressions. We find that asset disposal increases the likelihood of restructuring plan
approval. One possible interpretation of this finding is that collateral is an important
determinant of recovery plan acceptance. Creditors seem to generally prefer that firms
liquidate a portion of their assets since it facilitates their ability to receive cash. We also
find that secured debt creditors have lower incentives than the other classes to creditors
to accept reorganization plans; moreover, since they are the last class of creditors to
receive payment after liquidation, unsecured creditors are more likely to accept
reorganization plans. We also find that high debt values from banks in the junior class
are negatively related to plan acceptance and that payment disparities among all classes
of creditors seem to reduce the likelihood of acceptance.
This paper is structured as follows: The second section discusses the related
literature. The third section describes our data. The fourth section describes the
empirical strategy of analysis. The fifth section reports empirical results and a related
discussion. The final section concludes the paper.
2 Related Literature
The implementation of a bankruptcy process by law raises some concerns regarding its
effects on security prices, default losses, priority rules and financial reorganization.

5
According to Gilson (2012), academic research on bankruptcy has been concentrated in
four main areas: bankruptcy resolution, bankruptcy costs (Haugen and Senbet, 1978,
1988; Weiss, 1990), governance changes in bankruptcy and the effects of bankruptcy on
stock prices (Eberhart, Moore, and Roenfeldt, 1990). This research focuses on
bankruptcy resolution.
We are interested in understanding creditors’ decision making about the
restructuring process. According to Djankov, McLiesh, and Shleifer (2007) there is a
group of papers that connect legal protection for creditors and judicial efficiency. For
instance, Claessens and Klapper (2005) argue that greater judicial efficiency is strongly
associated with greater use of bankruptcy, although the combination of stronger creditor
rights and greater judicial efficiency leads to less use of bankruptcy.
We would like to highlight the studies that seem to explain why the resolution of
financial distress varies across countries. Gennaioli and Rossi (2010) show that strong
creditor protection increases the efficiency of the resolution of financial distress because
it provides judicial incentives.
Based on a sample of 49 countries, La Porta et al. (1997) find that countries with
poor investor protection (legal rules and quality of law enforcement) have smaller and
narrower capital markets. To construct a measure of the efficiency of debt enforcement,
Djankov et al. (2008) compare debt enforcement for the same kind of business in 88
different countries. They find that institutions that regulate insolvency usually perform
poorly owing to their inefficient bankruptcy procedures.
Penati and Zingales (1997) reveal the importance of understanding the legal
environment in which a restructuring process occurs because of its effects on parties’
outside options. For example, the Italian bankruptcy code includes two main procedures
(liquidation and reorganization) for addressing an insolvent company.
In the case of bankruptcy liquidation, the bankruptcy court appoints a trustee
who shuts down the firm and sells its assets (or even sells the whole business). The
absolute priority rule then determines how the proceeds of the sale are divided among
the claimants (Franks and Torous, 1989, 1994).
Since we focus on the reorganization process for distressed firms, it is important
to examine guidance provided regarding the power of law. In this regard, Platt and Platt
(2008) examine factors that seem to predict financial distress in the US, Europe and
Asia: they find that differences in accounting rules, legal practices, environmental laws

6
and business practices between regions may limit the degree of convergence in the area
of financial distress. Indeed, bankruptcy law varies considerably around the world.
Several studies have examined the main characteristics of restructuring
processes around the world. According to Hotchkiss et al. (2008), who specifically
focus on the restructuring of distressed firms in the UK, Sweden, France, Germany and
Japan, the degree to which companies’ business is protected from creditors also varies
considerably.
Moreover, Franks, Nyborg, and Torous (1996) describe the restructuring process
on the UK and argue that creditors who receive some company assets as collateral
generally have an interest in acquiring such assets. Thus, legislation that provides broad
protection for lenders can permit the restructuring of viable enterprises. As one can see,
a wide variety of papers have discussed the bankruptcy law of countries around the
world, where some have focused on similarities and others, on differences.
In studying the primary effects of the new Brazilian bankruptcy law, Araujo and
Funchal (2009) find that the new law has had a rapid and strong impact on the number
of bankruptcies in Brazil. According to these authors, expansion of the credit market is
observable. Moreover, Kadiyala (2011) investigates the impact of bankruptcy law
reform on capital markets in Brazil and, based on an empirical analysis of four different
stock indexes (Bovespa, IBX, IGCX and ITAG), shows that aggregate stock market
indexes reacted positively by the time that new rules were signed into law. These results
are consistent with those of La Porta et al. (1997), who find that better bankruptcy laws
lead to increased equity values.
Following Quian and Straham’s (2007) argument that the quality of the legal
environment shapes the characteristics and terms of bank loans around the world,
Araujo, Ferreira and Funchal (2012) evaluate the empirical consequences of the
bankruptcy reform on credit markets by using a quasi-experimental approach to
compare Brazilian firms with non-Brazilian firms (companies from Argentina, Chile
and Mexico). The result shows that increased protection is responsible for both an
increase in the amount of long-term debt and a reduction in the cost of capital.
Funchal and Clovis (2009) study firms’ capital structure and bankruptcy law
design to examine the effect of changes in priorities among creditors, and find a
significant impact on firm’s financial policy in line with lower costs of capital.
Exploiting the quality of court enforcement across Brazilian judicial districts,
Ponticelli (2012) shows that efficient court enforcement helps sustain higher capital

7
investment and productivity for companies. Thus, firms that face better court
enforcement benefit in terms of access to external financing, investment and
productivity.
According to the studies noted earlier, some efforts have been made to
understand the impact of the new Brazilian bankruptcy law on both markets and
companies. Because we decided to analyze restructuring data from courts while
incorporating additional information from reorganization plans, our paper must
corroborate previous work since it intends to present and analyze information provided
in reorganization plans.
2.1 Analysis of the Approval of Reorganization Plans
Under the new Brazilian bankruptcy law, court-based restructuring permits different
means of restructuring, such as a potential change in corporate control, the stipulation of
special terms and conditions for payments of obligations, and the right of veto for
creditors regarding restructuring plans. Results regarding the new Brazilian bankruptcy
law show that many companies have chosen to adopt a restructuring plan in order to
address their financial problems. Figure 1 shows the decline in bankruptcy trials after
the implementation of the new Brazilian restructuring law.
Moreover, the total number of restructuring cases has increased in each year
after the new law entered into force. Until 2005, bankruptcy in Brazil was ruled by Law
7,661. We argue that Law 7,661 did not offer conditions for the recovery of
economically viable companies that faced financial distress. The old reorganization
procedure (known as concordata) only postponed corporate debt. Moreover, as the main
shortcomings of the previous system, the liquidation process was characterized by
extensive bureaucracy, optimal recovery could generally not be achieved in situations of
distress, and firms faced difficulties in obtaining new debt to restructure their business.
Moreover, the insolvency process did not effectively protect credit rights after
liquidation.
As Brazilian financial restructuring now more closely resembles that in Chapters
7 and 11 in the US bankruptcy code, we can clarify their similarities. Table I shows the
characteristics of Brazilian bankruptcy law and US bankruptcy code for court and
private workout restructuring.

8
According to Araujo, Ferreira and Funchal (2012), creditors play a more
significant role in the restructuring procedure under the new Brazilian bankruptcy law
because they are involved in the negotiation and voting on the reorganization plan. In
brief, the new law imposes to two primary changes to increase the chance of a
successful reorganization. First, debtors are protected by the court for a period of 180
days in which creditors cannot seize any of the firm’s goods, even those provided as
collateral. Second, lenders of new funding post-bankruptcy enjoy absolute priority.
Moreover, one can also identify some modifications regarding the new liquidation
procedure.
The new Brazilian bankruptcy law states that creditors must vote on the
reorganization plan, although the alternative of a court-appointed new manager was
rejected. Despite the improvements of the new law, it complicates the process of
resolving firms’ debts by forcing heterogeneous creditors to vote together. As noted
earlier, all three classes of creditors must vote to approve the final plan. Yet, Brown
(1989) finds that heterogeneous groups of creditors are more concerned with receiving
guarantees, whereas homogenous creditors are primarily concerned with participating in
the restructuring process.
Previous studies have examined the relation between bankruptcy law and credit
and capital markets, while others have connected micro-economic issues to the
Brazilian law reform. Nevertheless, our research aims to elucidate how creditors make
decisions regarding reorganization plans. We believe that through an initial analysis of
reorganization plans, we can obtain interesting results.
Reorganization plans must be approved at the creditors’ meeting, where
creditors are divided into three classes for their vote. It is important to highlight that tax
creditors and creditors holding loans supported by fiduciary alienation of assets are not
subject to recovery: therefore, they do not vote on reorganization plans.
Secured creditors vote as a class and represent an amount up to the value of their
collateral. Moreover, when creditors demand more than their collateral value, they can
vote as both secured and unsecured creditors, and they then represent exactly the same
amount they own for each category. Debtors can indicate the period that they believe to
be reasonable by which to pay their secured and unsecured creditors. However,
according to article 54 of Law 11.101/2005, debtors cannot stipulate a period greater
than one year for labor debt in their restructuring plan.

9
Once a company has decided to undergo court restructuring, the process by
which creditors’ acceptance or rejection of the reorganization plan proceeds through the
following steps:
1. The firm must present the reorganization plan in court within sixty days after
deciding to undergo a restructuring process
2. The judge communicates that the recovery plan has been received and sets a
deadline for creditors to present any objection
3. Labor, secured and unsecured creditors (or, potentially, only one or two
classes) vote on the reorganization plan to accept, reject or postpone it in
order to demand of additional changes. All the three classes of creditors must
vote to approve the plan for it to be approved; otherwise, the firm undergoes
bankruptcy
Further, the bankruptcy law establishes the following order of debt priority
when a firm opts for bankruptcy or when its restructuring plan is rejected in the
creditors’ meeting:
1. Labor debt up to the limit of 150 minimum wages per worker
2. Secured debt up to the limit of the collateral
3. Tax debt
4. Payment for debtholders with specific and general privileges
5. Unsecured debt
3. Data Description
We use data from different sources to create our sample. First, we collected some court
restructuring plans from “Vara de Falências e Recuperação Judicial” in São Paulo, we
then obtained a wide variety of restructuring plans from Google®
since the data are
public and usually available on the websites of firms and judicial trustees. We consider
information from both private and public companies’ restructuring plans.
Our sample includes 120 firms for which we have information about labor,
secured and unsecured funding from banks and nonbank creditors. Since 2005, there
have been only a few restructuring process for public companies: therefore, the main
part of our sample comprises private firms. We collected data from 3 different
documents on firms’ reorganization processes, and we analyzed the reorganization plan
itself, the minutes from the creditors’ meeting and the relation of each creditor that

10
presents a description of the amount of money to be recovered. As table II shows, our
sample is more concentrated in the industrial and noncyclical sectors and less
concentrated in the basic materials sectors.
Figure II shows the characteristics of each category of debt in our sample, and,
Figure III provides information regarding the number of firms in our sample according
to the year of restructuring and the State.
As Figure II shows, a higher portion of unsecured debt belongs to trade
creditors, and unsurprisingly, a higher portion of secured debt belongs to banks.
Furthermore, the majority of firms’ debt is unsecured. Figure III shows that the greatest
number of restructuring processes in our sample occurred in 2012, followed by 2009.
Moreover, as Figure IV shows Sao Paulo is the State with the greatest portion of firms
undergoing restructurings in our sample.
Tables III and IV summarize the basic statistics for each variable collected from
the documents mentioned above. The definitions of the variables are also provided in
the notes to the tables. As shown, firms’ average age (from birth to the restructuring
date) is about 31 years. Regarding the number of banks, the statistics show that
approximately seven banks are involved in the restructuring process per firm. The
descriptive statistics also show that one firm received funding from 18 different banks
(the maximum number of banks involved in the process).
3.1 Sample Selection Issues
The data in our sample were not provided by a quasi-experiment. Since we collected our
data by searching for information provided on the websites of firms, lawyers and judge
trustees, our sample may present some kind of bias. Because we have a nonrandom
sample, we can only analyze the possible direction of the bias rather than completely
eliminate it. One possible type of bias may be related to the region as we have a higher
concentration of firms in the South and Southeast and only a few firms in the North and
Northeast (table IV).
However, this distribution of firms is in line with the populations of the judicial
districts in Brazil. The State of São Paulo has the higher number of civil courts. Further,
in his analysis of judicial districts in Brazil, Ponticelli (2012) finds that the country is
divided into 2,738 judicial districts, with a higher concentration of judicial districts and
courts dealing with bankruptcy in Southeast and a higher concentration of companies in

11
the South and Southeast of Brazil. The characteristics of our sample are in line with
these characteristics.
While we cannot conclude that any bias related to region is completely
eliminated, the concentration of reorganization cases in our data is nevertheless
consistent with the concentration of reorganization cases of Brazilian companies.
There may also be some kind of bias related to the electronic collection of the
data. For example, the data can be easily found on large firms’ websites. Although
information for such firms is public and thus available to courts, private and smaller
companies might not face the same pressure to disclosure the details of their
reorganization to all stakeholders.
Larger private or public companies usually display all information and archives
related to reorganization on their websites. Moreover, larger firms can hire more
structured law firms that do the job for them. However, the greatest number of
reorganizations in Brazil involves small and private companies. In figure III, we present
the characteristics of our sample by separating firms in our sample by type. These data
were collected from the websites of lawyers or judicial trustees where we collected
information about the restructuring plan, the minutes of the creditors’ meeting and the
list of claims from creditors. In Brazil, judicial trustees are appointed by the court, but a
specific lawyer may receive more complicated cases based on his reputation or
knowledge about bankruptcy situations.
Fortunately, we can check the minutes of the Assembly to determine whether a
lawyer represented the recovering firm or a judicial trustee was in charge of the case.
With such information, we can determine whether there is a pattern related to lawyers in
our sample data. Figure V shows the distribution of cases in our sample involving the
same lawyer. One can see that the cases are spread out among different lawyers, which
reduces the possibility that a specific lawyer is driving our result. Nevertheless, there
may still be the possibility that a specific lawyer has more complex or easier recovering
cases.
Although we have shown the characteristics of our data to analyze the potential
for bias in our data we cannot made definitive conclusions since we do not have a
random sample. We are quite confident that any bias in our sample is related the
concentration of cases handled by lawyers and belonging to particular regions.

12
4. Empirical Strategy of Analysis
This paper involves both a descriptive and an econometric analysis of the main
characteristics of reorganization plans by type of vote. It is important to highlight that
we do not intend to identify a causal relation between the variables since we are not
conducting a controlled experiment provided by an exogenous shock. We provide an
initial analysis of reorganization plans by type of vote, and we then conduct an
econometric analysis to calculate controlled correlations between the independent
variables and the likelihood that creditors initially accept the plan (i.e., without
modification).
For this purpose, we divide the study into two parts: 4.1 a descriptive analysis of
the characteristics of the reorganization process and, 4.2 a relational analysis of
reorganization plans by type of vote involving econometric regressions.
4.1 Descriptive Analysis
This part of the paper aims to provide empirical evidence of the characteristics of the
reorganization plans by separating the reorganization plans according to the Assembly
results. Specifically, since plans can be approved, modified or rejected, we decided to
capture the characteristics of each plan and compare them according to the possible
results of the Assembly. We first provide an analysis based on the characteristics of the
quorum required to vote on the reorganization plan, which indicates the portion of
creditors that attended the creditors’ meeting to vote on the plan and the portion of
creditors that accepted the plan.
We further conduct a descriptive analysis on the proposal that debtors presented
to claimholders regarding payment. This part of the analysis examines the portion of
debt discounted from the original debt value, the grace period suggested by debtors to
postpone the first payment and the correction form of the debt payment provided during
the reorganization period.
We also perform a descriptive analysis of disparities in payment proposals
among creditors. It is important to identify all cases in which the debtor presented a
different payment proposal for both the same and different classes of claimholders. The
last part of the analysis provides a descriptive measurement of firms’ financial distress.
For this purpose, we use a financial distress proxy that gives us some insight about

13
differences between more or less complex situations of distress when creditors may be
able to evaluate whether the reorganizing firms’ asset are sufficient to settle the debt. In
addition, we use an economic distress proxy to captures the conditions surrounding a
firm, which may affect the firm’s ability to generate cash and thus relate to more or less
complex reorganization cases.
4.2 Econometric Regressions
To identify which kind of outcome one can expect for a restructuring plan, we decided
to adopt a probit regression. Our model aims to determine the likelihood that a firms’
restructuring plan is accepted when creditors do not demand additional changes.
Therefore, our research question is as follows: What are the main determinants of
reorganization plan acceptance for each class of creditors? At a first glance, we would
like to evaluate the factors that affect creditors’ decision about the reorganization plan.
How do heterogeneous creditors behave in the decision process for reorganization
plans? Does the decision to accept reorganization plans lies with banks? Does it concern
specifying collateral?
Giambona, Lopes-de-Silanes, and Matta (2013) argue that because there are
different classes of debt, reorganization plans are often rejected in Chapter 11
proceedings. Previous works have also stressed that the allocation of resources to
different claimholders that is specified in a recovery plan is as important as the potential
value that the restructuring will engender. Further, Brown (1989) argues that problems
can rise in the presence of heterogeneous creditors.
Following these studies, we evaluate the likelihood of approval according to the
categories of creditors. Accordingly, as explanatory variables in our regressions we
adopt the ratio of each debt category to the total debt and the number of creditors.
Concerning the restructuring process, Senbet and Wang (2010) state that
creditors generally prefer asset liquidation, since such a procedure facilitates their
ability to receive cash. Moreover, Giambona, Lopes-de-Silanes, and Matta (2013) show
that higher asset verifiability increases both the probability of Chapter 11 filings and the
debt capacity of firms. In our empirical model, we examine the effect of asset disposal
when a collateral asset for debt payment is specified in the reorganization plan.
It is important to highlight that we are considering only variables from the
reorganization plans, the minute of the creditors’ meetings and the list of creditors

14
presented by the judicial trustee. Ultimately, we aim to determine the likelihood that a
firm’s reorganization plan is accepted by its claimholders during the creditors’ meeting.
For this purpose, we run regressions with labor, secured and unsecured debt as
the explanatory variables and we model each regression while controlling for a group of
variables that each category of creditors should consider in voting on the reorganization
plan.
In addition to the amount of debt from heterogeneous creditors mentioned
above, we also consider the amount of secured and unsecured bank loans with claims at
the creditors’ meeting as a control measure. There is no consensus based on empirical
evidence about the role of banks in the approval of reorganization plans. According to
Gilson (1990), Brown (1989) and James (1996), banks help reduce holdout and
information problems in private restructuring. However, Helwege (1999) argues that
bank debt is related to a slower debt restructuring process. Although we cannot specify
the expected sign for bank debt in our empirical investigation, bank debt nevertheless
seems to be necessary to include as a control variable in our regressions.
Finally, we also control for the period of time stated by the firms by which to
settle their debt, the type of firm, disparities in payment proposals among creditors and
modifications in corporate ownership. Since the reorganization plan is made before
creditors vote, all explanatory variables are specified for the period before the
acceptance, requested modification or rejection of the plan.
Our first empirical model is designed for labor creditors. As specified earlier,
such creditors are the first category of creditors to receive any amount of money if a
plan is rejected. According to law, this category of creditors must receive payment from
debtors within a one-year period. Hence, we do not need to run a regression that
controls for the period of time stated by the firm to pay its debtholders for this group of
creditors. Since we include many of the same variables in subsequent equations below,
we avoid repeating the definition of each variable for all the equations. Therefore, for
each equation, we repeat the definition for the dependent variable and provide the
definitions for the control variables that were not mentioned for previous equations.
Since the vote for approval must meet both value and number criteria, we run
separate regressions for creditors’ portion of debt and the number of creditors with
claims. After presenting the results for each case, we run a regression with both the
portion of debt and number of creditors as explanatory variables for the classes of
creditors. Our first equation is specified as follows:

15
tt
ttttt
ureorgOwnershipClassesDif
DebtTotalDisposalAssetTypeLabory
+++
+++++=
−
−−−−
__
(ln)__
615
141312110
ββ
βββββ
(1)
ty = Dummy variable that equals 1 if the reorganization plan is accepted
without changes and 0 if it is either accepted with modifications suggested by the
creditors or rejected.
Labor = Ratio of labor debt to total debt. The variable Labor is the first class of
the firm’s debt.
Type = Dummy variable that equals 1 for corporations (S.A firms).
Asset_Disposal = Dummy variable that equals 1 if the firm chooses a collateral
asset for debt payment in the restructuring plan.
Total_Debt(ln) = The variable is measured as the logarithm of the firm’s total
debt.
Diff_Classes = Dummy variable that equals 1 for disparities in the payment
proposals among the three classes of claimholders.
Ownership_Reorg = Dummy variable that equals 1 for changes in corporate
control.
To separate the value criteria from the number criteria, we repeat equation 1 by
changing the variable labor above to the number of labor creditors that a firm must pay.
We further run a regression in which both the value and number criteria are considered
in the same equation.
In the first equation, we are interested in the sign of the variables labor and asset
disposal. It is difficult to determine how labor creditors should behave with respect to
reorganization plans, since there are no observable conditions for which to control in the
plan analysis, such as employment. Labor creditors are the first category of creditors to
receive payment in the case of bankruptcy: therefore, they have incentives to reject the
plan when creditors are perceived to have an advantage. Nevertheless, if workers
believe in their firm and if they fear that they may face problems when returning to the
labor market, they have incentives to approve the plan. In this equation, we expect only
asset disposal to have a positive sign owing to the guarantee of cash, as noted in Senbet
and Wang (2010) and Giambona, Lopes-de-Silanes, and Matta (2013).

16
According to Brown, James, and Mooradian (1994), evidence indicates that asset
sales benefit creditors more than equityholders in cases of distress. Moreover, Asquith,
Gertner, and Scharfstein (1994) show that asset sales represent an important means for
firms to avoid bankruptcy.
The null hypothesis of our equations is that none of the variables mentioned
below influences the acceptance of the restructuring plan. Based on previous works, we
propose the following hypotheses:
Hypothesis H1: Asset disposal may influence creditors to accept the
reorganization plan. Therefore, we expect to find a positive sign for asset disposal in our
regressions (β>0).
Hypothesis H1 must hold for all regressions in this paper. With regard to secured
creditors, we believe that our task is easier. Equation 2 is specified as follows:
(2)
ty = Dummy variable that equals 1 if the reorganization plan is accepted
without changes and 0 if it is either accepted with modifications suggested by creditors
or rejected.
Secured = Ratio of secured debt to total debt.
SBL = Variable that specifies the portion of bank loans that constitute secured
debt.
Dif_Same_Class = Dummy variable that equals 1 for disparities in payment
proposals within the same class of claimholders.
P = The variable Payment_years is the period of time stated by the firm to settle
its debt.
ttt
tttttt
uPreorgOwnershipClassSameDifClassesDif
DebtTotalDisposalAssetTypeSBLSecuredy
++++
++++++=
−−
−−−−−
198716
15141312110
____
(ln)__
ββββ
ββββββ

17
For equation 2, we again separate the value criteria from the number criteria. For
his purpose, we repeat equation 2 by changing the variable Secured above to the number
of secured creditors that a firm must pay. We further run a regression in which both the
value and number criteria are considered in the same equation.
Secured creditors own assets as collateral and receive payment after labor
debtors in the case of bankruptcy. Therefore, we believe that this category of creditors
also has incentives to reject the reorganization plan. According to Brouwer (2006),
some countries attempt to attenuate the conflict that arises from secured creditors’ right
to claim their collateral by applying an automatic stay. However, such a measure may
not be sufficient to convince creditors to accept the reorganization plan. In addition to
the control variables included in the first equation, we added two more variables related
to secured creditors’ decision to accept the plan. For this kind of creditor, we believe
that the period of time stated by a firm to settle its debt and the amount of secured bank
loans can influence the likelihood that the restructuring plan is accepted. In addition,
using equation 2, we run a regression focused on secured debt by controlling for labor
debt as well as all other control variables included in equation 2.
Therefore, we specify our second hypothesis as follows:
Hypothesis H2: Secured creditors have incentives to reject the reorganization
plan. Therefore, we expect to find a negative sign for the coefficient of this variable
(β<0).
Finally, we analyze the same decision with respect to unsecured creditors. As
these creditors are the last group of creditors to receive any value from liquidation, they
have incentives to accept the reorganization plan. The incentives of this class of
creditors are clearly more aligned with shareholders than those of the other classes.
Junior creditors are out of the money in most cases, and the decision to continue the
business (even if it is inefficient) can provide an upside for this class according to
Gertner and Scharfstein (1991). Focusing on unsecured creditors, equation 3 is specified
as follows:
(3)
υββββ
ββββββ
+++++
++++++=
−−
−−−−−
198716
15141312110
____
(ln)__sec
tt
tttttt
PreorgOwnershipClassSameDifClassesDif
DebtTotalDisposalAssetTypeUBLuredUny

18
ty = Dummy variable that equals 1 if the reorganization plan is accepted
without changes and 0 if it is either accepted with modifications suggested by creditors
or rejected.
Unsecured = Ratio of unsecured debt to total debt
UBL = Unsecured bank loan indicates the portion of bank loans that constitute
unsecured debt.
We impose the same modification in equation 3 regarding the separation of the
value and number criteria specified for the previous equations. We present our third
hypothesis as follows:
Hypothesis H3: Unsecured creditors have incentives to approve the
reorganization plan. Therefore, we expect to find a positive sign for the coefficient of
this variable (β>0).
We also run more regressions in which we use the different classes as
explanatory variables in the same equation. Due to perfect collinearity, it is not possible
to run a complete model considering all classes at the same time. Therefore, we must
consider one class or combine two classes for each regression. Table XVI shows the
variance inflation factors. It reveals that multicollinearity is not a problem in our model.
5. Empirical Results and Discussion
This section reports the empirical results from our descriptive and econometric analyses.
Table V presents results regarding the quorum of creditors who voted on the plan during
the creditors’ general meeting. For approved plans without modifications, the results
reveal that more secured creditors were present to vote on the plan than labor and
unsecured creditors. However, the rate of acceptance is higher among labor creditors
than among the other classes. The results for the modified plans are similar.
Furthermore, the number of no shows at the vote is higher among unsecured
creditors for approved plans, yet for modified and rejected plans, the number of no
shows among labor creditors is similar to that among unsecured creditors. The analysis
of rejected plans is interesting. Secured creditors show the highest portion of rejections,

19
while labor creditors rejected the plan in only 10.42% (mean) of the cases in the sample.
In fact, when the plan was initially accepted the lowest portion of labor creditors to
accept the plan is 96%. Thus, labor creditors approved the plan in most of the cases,
even when the other classes decided to reject it.
Table VI shows the proposal of payment to claimholders according to the
outcome of the vote in the Assembly. The average portion of debt discounted is higher
for rejected plans, while the average grace period (13.11 months) is higher for modified
plans.
Table VI, part B, also reveals that inflation indexes were used as the main
strategy for correcting debt payments for rejected plans, while floating interest rates
were the main strategy used in the other cases.
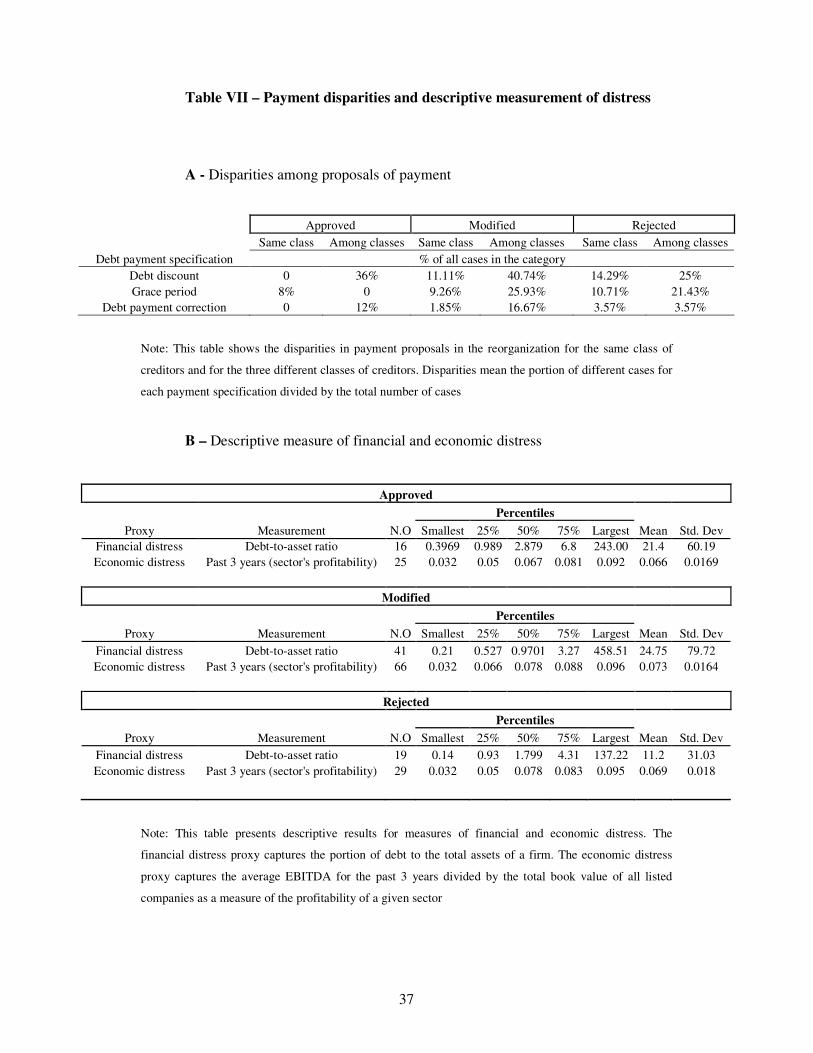
We also examine the different means of payment that the debtor suggested for
each class of creditors in the reorganization plan. Regarding the disparities in payment
proposals, table VII shows that plans approved with no modifications are more
homogenous among claimholders. Moreover, modified plans show the greatest
disparities in payment proposals among classes, whereas rejected plans show the
greatest disparities in payment proposals within the same class of creditors.
Table VII, part B, presents the descriptive statistics for financial and economic
distress measures. The analysis of financial distress shows that the average debt-to-asset
ratio is lower for rejected plans than the accepted and modified plans. One possible
explanation for this result is that creditors in senior positions prefer to reject the plan
when they are at least at the money. The results regarding sector profitability are similar
regardless the outcome of the vote on the plan. For our econometric regressions, we
could not adopt proxies for financial and economic distress because of the limited the
number of observations, as we lost more than 60 observations in our regression
controlling for the debt-to-asset ratio. Therefore, we decided to exclude the variables
from our econometric regressions.
As shown for our first probit, regression in table VIII, the coefficient for the
variable Asset_Disposal is positive and significant. The interpretation of this result is
quite simple, since having a greater amount of collateral for debt increases the
likelihood that the restructuring plan will be accepted. Claimholders vote on the plan
within an environment of uncertainty: therefore, it benefits all creditors to associate an
asset with collateral. This result thus seems to confirm that creditors generally prefer to

20
liquidate a portion of the firm’s assets, since such a procedure facilitates their ability to
receive cash. This finding supports the first hypothesis of our study.
The difference among classes is significant when year fixed effects are taken
into account. However, we did not find significant coefficients for the remaining
variables.
The empirical results for the second equation are presented in table X. As
shown, the relationship between the portion of secured credit debt and the likelihood of
acceptance is significant and negative. This result is in agreement with Senbet and
Wang (2010) and Giambona, Lopes-de-Silanes, and Matta (2013). As mentioned above,
secured creditors seem to have incentives to liquidate a company and to get their money
back. In addition to secured debt, asset disposal and disparities in payment proposals
among the classes are significant in the regression. The sign for asset disposal remains
positive sign and disparities in payment proposals among classes shows a negative sign.
Regarding payment_years, one could expect a negative sign in the regression
because it represents the period of time stated by the firms to settle their debt: therefore,
a shorter period is better for claimholders. However, the coefficient is not statistically
significant. In addition, the coefficient of the variable secured bank loan is not
statistically significant. As explained earlier, this variable could show either a positive
or a negative sign.
Table XII presents the same analysis for equation 3 where we focus on the role
of unsecured creditors. As shown, the variable unsecured, measured as a portion of
unsecured debt to total debt, is positively related to the likelihood that the
reorganization plan is accepted without modifications. This result supports the third
hypothesis of this paper. One can also see that the coefficient for the number of
unsecured creditors has a negative sign.
Increasing the number of creditors involved in the vote on a reorganization plan
can engender more coordination problems, and our results support such a statement. As
explained earlier, unsecured creditors have incentives to approve the restructuring plan,
since they receive payment after other creditors. The coefficient for the variable asset
disposal remains positive and significant in table XII. Further, the coefficient for the
difference among classes remains significant in the same direction, and the variable
total debt is also significantly and positively related to the likelihood of acceptance.
Since higher levels of debt distance creditors from at-the-money positions in the
case of liquidation, we believe that the direction of the sign is accurate.

21
The coefficient for the portion of unsecured bank debt has a negative and
significant sign in our regressions. One possible explanation for this result is that the
coordination problem among creditors is exacerbated when the portion of debt to be
recovered by banks in junior classes is also higher. Moreover, in some cases the same
bank had senior and junior claims, and such a situation may attenuates out-of-money
positions in the case of liquidations: therefore, such creditors may have higher
incentives to reject the plan. The remaining tables report the same result when
additional control variables are taken into account. The variable asset disposal remains
positive and significant in these tables.
The greatest number of reorganizations in Brazil involves small and private
companies. These companies have less access to credit markets, especially to public
debt. Hence, they usually use a bigger share of trade credit. Therefore, the results can
suffer from bias on trade credit incentives.
6. Concluding Remarks
In this paper, we study the likelihood of acceptance of reorganization plans based on a
sample of 120 Brazilian firms for the period from 2005 to 2014. Restructuring seems to
provide a helpful alternative for companies in poor financial situations when they could
preserve their organizational values and allow financially distressed firms to seek growth
opportunities for investment after an episode of failure. To our knowledge, this is the first
paper to evaluate the main drivers of the approval of reorganization plans during the
creditors’ meeting.
Some important results are notable in this paper. First, we show that asset
disposal facilitates the approval of reorganization plans as collateral is an important
determinant of recovery plan acceptance. Indeed, collateral helps reduce creditor’s loss
expectations during the set of challenges that a firm undergoing restructuring is facing.
Second, we confirm that secured debt creditors have lower incentives to accept
reorganization plans. Since these creditors have a specific amount in collateral, they
may prefer to liquidate the company rather than wait for its recovery. Third, a higher
portion of unsecured creditors seems to be related to higher likelihood of acceptance.
Since these creditors are more similar to equityholders and are usually out of the money,
they may have incentives to approve the plan even if doing so is not best decision for
creditors as a whole.

22
This study also has some limitations. Unfortunately, we do not examine
causality in this paper. However, since our purpose in this study was to show the
characteristics of reorganization plans by the type of vote, our econometric results
merely corroborate our descriptive analysis by controlling for certain variables show
only the relation. In addition, our sample may suffer from selection bias even though we
showed possible direction of such bias.
Future research can be conducted to analyze whether firms whose reorganization
plan was approved achieved success through recovery. We could not analyze this issue
in this paper because most of the firms are still in recovery.
References
Anapolsky, J.M., Woods, J.F., 2013. Pitfalls in Brazilian bankruptcy law for
international bond investors. J. Bus. Tech. Law 8, 397-450.
Araujo, A.P., Ferreira, R.V.X., Funchal B., 2012. The Brazilian bankruptcy law
experience. J. Corp. Financ. 18, 994–1004.
Araujo, A.P., Funchal, B., 2009. A Nova Lei de Falências Brasileira: Primeiros
Impactos. J. Polit. Econ. 29 (3), 191-212.
Asquith, P., Gertner, R., Scharfstein, D., 1994. Anatomy of financial distress: an
examination of junk-bond issuers. Q. J. Econ. 109, 625-658.
doi:10.2307/2118416.
Brouwer, M., 2006. Reorganization in US and European bankruptcy law. Eur. J. Law
Econ. 22 (1), 5-20. doi:10.1007/s10657-006-8978-2.
Brown, D.T., 1989. Claimholder incentive conflicts in reorganization: the role of
bankruptcy law. Rev. Finan. Stud. 2 (1), 109–123. doi:10.1093/rfs/2.1.109.
Brown, D.T., James, C.M., Mooradian, R.M., 1994. Asset sales by financially distressed
firms. J. Corp. Financ. 1 (2), 233-257. doi:10.1016/0929-1199(94)90004-3.
Claessens, S., Klapper, L., 2005. Bankruptcy around the world: explanations of its
relative use. Am. Law Econ. Rev. 7 (1), 253-283. doi:10.1093/aler/ahi004.
Djankov, S., Hart, O., McLiesh, C., Shleifer, A., 2008. Debt enforcement around the
world. J. Polit. Econ. 116 (6), 1105–1149. doi:10.1086/595015.
Djankov, S., McLiesh, C., Shleifer, A., 2007. Private credit in 129 countries. J. Finan.
Econ. 84 (2), 299–329. doi:10.1016/j.jfineco.2006.03.004.

23
Eberhart, A.C., Moore, W.T., Roenfeldt, R.L., 1990. Security pricing and deviations
from the absolute priority rule in bankruptcy proceedings. J. Finance 45 (5),
1457-1469. doi:10.1111/j.1540-6261.1990.tb03723.x.
Franks, J.R., Nyborg, K.G., Torous, W.N., 1996. A comparision of US, UK, and
German insolvency codes. Finan. Manag. 25 (3), 86-101. doi:10.2307/3665810.
Franks, J.R., Torous, W.N., 1989. An Empirical investigation of U.S. Firms in
reorganization. J. Finance 44 (3), 747-770. doi:10.1111/j.1540-
6261.1989.tb04389.x.
Franks, J.R., Torous, W.N., 1994. A comparison of financial recontracting in distressed
exchanges and chapter 11 reorganizations. J. Finan. Econ. 35 (3), 349-370.
doi:10.1016/0304-405X(94)90037-X.
Funchal, B., Clovis, M., 2009. Firm’s Capital Structure and Bankruptcy Law Design.
Journal of Financial Economic Policy. 3 (1), 264-275. doi:
10.1108/17576380911041737.
Gennaioli, N., Rossi, S., 2010. Judicial discretion in corporate bankruptcy. Rev. Financ.
Stud. 23 (11), 4078-4114. doi:10.1093/rfs/hhq079.
Gertner, R., Scharfstein, D., 1991. A theory of workouts and the effects of
reorganization law. J. Finance 46 (4), 1189-1222. doi:10.1111/j.1540-
6261.1991.tb04615.x.
Giambona, E., Lopez-de-Silanes, F., Matta, R., 2013. Improved Creditor Protection and
Verifiability in the U.S. Working Paper. Available at
https://editorialexpress.com/cgi-
bin/conference/download.cgi?db_name=sbe35&paper_id=22 (Acessed 23
August 2014).
Gilson, S.C., 2012. Creating Value through Corporate Restructuring: Case Studies in
Bankruptcies, Buyouts, and Breakups, second ed. Wiley, Hoboken, NJ.
Gilson, S.C., Hotchkiss, E.S., Ruback, R.S., 2000. Valuation of bankrupt firms. Rev.
Finan. Stud. 13 (1), 43-74. doi:10.1093/rfs/13.1.43.
Haugen, R.A., Senbet, L.W., 1978. The insignificance of bankruptcy costs to the theory
of optimal capital structure. J. Finance 33 (2), 383-393. doi:10.1111/j.1540-
6261.1978.tb04855.x.
Haugen, R.A., Senbet, L.W., 1988. Bankruptcy and agency costs: their significance to
the theory of optimal capital structure. J. Finan. Quant. Anal. 23 (1), 27–38.
doi:10.2307/2331022.

24
Helwege, Jean.,1999. How long do junk bonds spend in default. J.Finance 54, 341-357.
Hotchkiss, E.S., John, K., Mooradian, R., Thorburn, K.S., 2008. Bankruptcy and the
Resolution of Financial Distress. Working Paper. Available at
http://mba.tuck.dartmouth.edu/Pages/Faculty/Karin.Thorburn/publications/Ch14
-N53090.pdf. (Acessed 15 January 2014).
James, C., 1996. Bank Debt Restructurings and the Compositions of Exchange Offers in
Financial Distress. J. Finance 51, 711- 727.
Kadiyala, P., 2011. Impact of bankruptcy law reform on capital markets in Brazil.
Investment Management and Financial Innovations 8, 31-41.
doi:10.2139/ssrn.1345076.
Kaplan, S., Stromberg, P., 2002. Financial contracting theory meets the real world: an
empirical analysis of venture capital contracts. Rev. Econ. Stud. 2003, 281-315.
Kaplan, S., Stromberg, P., 2004. Characteristics, contracts, and actions: evidence from
venture capitalist analyses. J. Finance 5, 2177-2210.
Kordana, K.A., Posner, E., 1999. A positive theory of Chapter 11. NYUL Rev. 74, 161-
234.
La Porta, R., Lopez-De-Silanes, F., Shleifer, A., Vishny, R.W., 1997. Legal
determinants of external finance. J. Finance 52 (3), 1131–1150.
doi:10.1111/j.1540-6261.1997.tb02727.x.
Penati, A., Zingales, L., 1997. Efficiency and Distribution in Financial Restructuring:
The Case of Ferruzzi Group. Working Paper. Available at
http://faculty.chicagobooth.edu/finance/papers/ferfin.pdf. (Acessed 8 September
2013).
Platt, H., Platt, M., 2008. Financial distress comparison across three global regions.
Journal of Risk and Financial Management 1, 129-162.
doi:10.3390/jrfm1010129.
Ponticelli, J., 2012. Court Enforcement and Firm Productivity: Evidence from a
Bankruptcy Reform in Brazil. Job Market Paper – University Pompeu Fabra,
Barcelona.
Qian, J., Strahan, P.E., 2007. How laws and institutions shape financial contracts: the
case of bank loans. J. Finance 62 (6), 2803–2834. doi:10.1111/j.1540-
6261.2007.01293.x.
Senbet, L.W., Wang, T.Y., 2010. Corporate financial distress and bankruptcy: a survey.
FNT Finance 5 (4), 243–335. doi:10.1561/0500000009.

25
Thadden, E.L. von, Berglof, E., Roland, G., 2010. The design of corporate debt
structure and bankruptcy. Rev. Finan. Stud. 23, 2648 – 2679.
Weiss, L.A., 1990. Bankruptcy resolution: direct costs and violation of priority of
claims. J. Finan. Econ. 27 (2), 285-314. doi:10.1016/0304-405X(90)90058-8.

26
Figures and Tables
Figure I: Number of bankruptcy and restructuring cases after Law 11,101/05
Note: Data collected from Serasa®. Source: Own elaboration
01000
2000
3000
2004 2006 2008 2010 2012 2014Year
Bankruptcy Restructuring

27
Figure II: Distribution of debt
A. Portion of unsecured debt B. Portion of secured debt
Note: SBL means Secured Bank Loan and STC means Secured Trade Credit. UBL means Unsecured
bank loan and UTC means Unsecured trade credit. Source: Own elaboration
C. Kind of debt D. Bank loan (BL) and trade Credit (TC)
to total debt
%Labor %Secured
%Unsecured
Kind of Debt
%SBL %STC
Secured Funding
%UBL %UTC
Unsecured Funding
BL/TD TC/TD
Kind of Funding to Total Debt

28
Figure III. Distribution of the sample per year and per type
A. Portion of firms in the sample per year
0
510
15
20
25
Fim
s
2004 2006 2008 2010 2012 2014Year
B. Portion of firms in the sample per type
Types of Business Entity
0
20
40
60
80
100
S.A LTDA
Type
Fir
ms

29
Figure IV. Distribution of the sample per State and per region
A. Portion of firms in the sample per State
Source: Own elaboration.
B. Portion of firms in the sample per region
Firms by State
0
10
20
30
40
50
60
SP RS GO SC RJ MT MG PE RO PA
State
Brazilian States:
GO = Goias MG = Minas Gerais MT = Mato Grosso PA = Para
PE = Pernambuco RO = Rondônia RJ = Rio de Janeiro
RS = Rio Grande do Sul SC = Santa Catarina SP = Sao Paulo
Firms by Region
0
10
20
30
40
50
60
70
Southeast South Center West Northeast North
Region

30
Figure V: Distribution of cases held by the same lawyer
Note: This graph reports the number of reorganizations held by the same lawyer

31
Table I: Brazilian bankruptcy law and US bankruptcy code
Note: Own elaboration. Adapted from Ponticelli (2012)
Brazilian: Law
11,101 US bankruptcy code
Automatic Stay
Debtor is protected by the
court for a period of 180
days .
All litigation against the
debtor is stayed until it can
be resolved in court.
Court Restructuring
Creditor committees
The three classes of
creditor (labor, secured
and unsecured) can discuss
and approve or reject the
reorganization plan.
Debtor’s plans must be
confirmed by the three
classes of creditors.
Debtor in possession
financing
Lenders of new funding
post-bankruptcy enjoy
absolute priority.
The same. New lenders
enjoy first priority.
Brazilian Law 11,101:
Only possible for secured and unsecured lenders. After reviewing and accepting
creditors’ proposal, the plan can then be approved in court.
Out-of-court Restructuring
US bankruptcy code:
Pre-agreement that allows a firm to contemporaneously file for Chapter 11 and file a
reorganization plan to short procedure.

32
Table II. Sector representation (total number of firms in the sample)
Note: Own elaboration following the Bloomberg sector’s classification.
Sector # Firms %
Industrial 44 36.67%
Consumer, Noncyclical 38 31.67%
Consumer, Cyclical 18 15.00%
Utilities 14 11.67%
Energy 4 3.33%
Basic Materials 2 1.67%
Sum 120 100.00%

33
Table III – Descriptive statistics. Summary statistics of the variables collected
from restructuring plans
Total Sample
Variable NOBS Measurement Mean Std. Dev Min Max
Labor_debt% 120 % 0.0329 0.0685 0 0.5547
Secured_debt% 120 % 0.1784 0.223 0 0.9081
Unsecured_debt% 120 % 0.7886 0.2314 0.0854 1
Secured_bank_loan% 114 % 0.361 0.4138 0 1
Unsecured_bank_loan% 114 % 0.4083 0.321 0 1
Labor_debt # 112 Numerical 349.52 1064 0 7,278
Secured_debt # 115 Numerical 2.852 4.3774 0 31
Unsecured_debt # 115 Numerical 306.74 472.73 2 2,754
Concentration of top 10 creditors 109 % 0.6815 0.1891 0.173 0.994
Concentration of top 10 creditors (no Banks) 109 % 0.3293 0.2211 0.003 0.924
Number_of_Banks 110 Numerical 6.51 3.6086 0 18
Firm_Age 111 Years 31.33 23.22 4 120
Payment_years 114 Years 11 4.14 3 22
Past 3 years (sector's profitability average) 120 % 0.071 0.017 0.032 0.0966
Debt-to-asset ratio 76 % 21 66.164 0 458.515
Note: The table reports descriptive statistics from firms’ restructuring plans and list of creditors since the
enactment of the new Brazilian bankruptcy law. The variable Labor debt (%) is the portion of the first
class of firms’ debt. The variable Secured debt (%) represents the portion of the second class of firms’
debt. The variable Unsecured is the portion of the third class of the firms’ debt. Secured_bank_loan%
shows the portion of bank loans that constitute secured debt. Unsecured_bank_loan% shows the portion
of bank loans that constitute unsecured debt. Labor #, Secured # and Unsecured # are the number of labor,
secured and unsecured debtholders respectively. Top 10 (%) is the proportion of the debt held by the 10
debtholders with the highest amount of debt, and Top 10 (%, no banks) is the proportion of the debt held
by the 10 debtholders with the highest amount of debt, excluding banks. The variable Number_of_Banks
presents the number of banks operating in the list of creditors. The variable Payment_years is the period
of time stated by the firms to settle their debt. The variable Firm_Age indicates the period of time from
birth to the restructuring year. The variable Past 3 years reports the average EBITDA divided by the total
book value of all listed companies as a measure of the profitability of a given sector considering the last
three years before the reorganization petition. The variable Debt-to-asset ratio indicates the portion of
debt to the total assets of a firm. Source: Own elaboration

34
Table IV - Descriptive statistics. Summary statistics of the variables by
reorganization outcome
Approved
Variable NOBS Measurement Mean
Std.
Dev. Min Max
Labor_debt% 25 Ratio 0.0314 0.0423 0 0.168
Secured_debt% 25 Ratio 0.1637 0.2355 0 0.745
Unsecured_debt% 25 Ratio 0.8048 0.2432 0.139 1
Secured_bank_loan% 25 Ratio 0.3744 0.4233 0 1
Unsecured_bank_loan% 25 Ratio 0.3358 0.2975 0 0.99
Labor_debt # 25 Numerical 342.45 700.61 0 2,509
Secured_debt # 25 Numerical 2 3.041 0 13
Unsecured_debt # 25 Numerical 336.84 423.93 18 1,521
Concentration of top 10 creditors 25 Ratio 0.6789 0.1667 0.25 1
Concentration of top 10 creditors (No Banks) 25 Ratio 0.3274 0.2516 0.003 0.914
Number_of_Banks 25 Numerical 5.08 1.998 2 10
Firm_Age 25 Years 30.14 19.09 4 71
Payment_years 25 Years 10.02 3.45 4 17
Modified
Variable NOBS Measurement Mean
Std.
Dev. Min Max
Labor_debt% 65 Ratio 0.0189 0.259 0 0.095
Secured_debt% 65 Ratio 0.1681 0.2093 0 0.908
Unsecured_debt% 65 Ratio 0.8128 0.2111 0.085 1
Secured_bank_loan% 61 Ratio 0.3377 0.4074 0 1
Unsecured_bank_loan% 61 Ratio 0.3683 0.2338 0 0.84
Labor_debt # 60 Numerical 476.81 1365.45 0 7,278
Secured_debt # 61 Numerical 3.57 5.318 0 31
Unsecured_debt # 61 Numerical 381.62 567.97 8 2,754
Concentration of top 10 creditors 56 Ratio 0.6752 0.1947 0.239 0.994
Concentration of top 10 creditors (No Banks) 56 Ratio 0.349 0.2141 0.017 0.924
Number_of_Banks 58 Numerical 7.24 3.9 2 18
Firm_Age 64 Years 35.73 26.34 6 120
Payment_years 61 Years 11.32 4.5 4 22
Rejected
Variable NOBS Measurement Mean
Std.
Dev. Min Max
Labor_debt% 29 Ratio 0.0655 0.1231 0 0.555
Secured_debt% 29 Ratio 0.214 0.2455 0 0.903
Unsecured_debt% 29 Ratio 0.7203 0.257 0.094 1
Secured_bank_loan% 28 Ratio 0.4 0.4307 0 1
Unsecured_bank_loan% 28 Ratio 0.56 0.447 0 1
Labor_debt # 28 Numerical 82.82 228.2 0 1,157
Secured_debt # 29 Numerical 2.06 2.658 0 11
Unsecured_debt # 29 Numerical 123.31 129.14 2 511
Concentration of top 10 creditors 28 Ratio 0.6966 0.2022 0.173 0.97
Concentration of top 10 creditors (No Banks) 28 Ratio 0.2915 0.209 0.03 0.897
Number_of_Banks 28 Numerical 6.25 3.73 0 16
Firm_Age 26 Years 21.46 13.43 5 48
Payment_years 28 Years 9.37 3.632 3 19
Note: Own Elaboration. The variable descriptions are presented in table III

35
Table V – Quorum and vote analysis of the reorganizations
Initially approved plans – Quorum of votes
Percentiles
Measurement Smallest 25% 50% 75% Largest Mean Std.Dev
Labor (%) 0 0.64 0.94 1 1 0.7684 0.3145
Secured (%) 0.75 1 1 1 1 0.971 0.078
Unsecured (%) 0.1 0.46 0.575 0.66 1 0.588 0.217
Initially approved plans – Votes in favor of plan acceptance
Percentiles
Measurement Smallest 25% 50% 75% Largest Mean Std.Dev
Labor (%) 0.96 1 1 1 1 0.998 0.0085
Secured (%) 0.53 0.68 1 1 1 0.8548 0.1875
Unsecured (%) 0.52 0.63 0.77 0.95 1 0.7647 0.1694
Modified plans - Quorum of votes
Percentiles
Measurement Smallest 25% 50% 75% Largest Mean Std.Dev
Labor (%) 0 0.51 0.725 0.97 1 0.6553 0.3111
Secured (%) 0.12 0.9 1 1 1 0.8954 0.2236
Unsecured (%) 0.01 0.535 0.75 0.855 1 0.675 0.26
Modified plans - Votes in favor of acceptance (modified plan)
Percentiles
Measurement Smallest 25% 50% 75% Largest Mean Std.Dev
Labor (%) 0.51 1 1 1 1 0.96 0.1047
Secured (%) 0.5 0.81 1 1 1 0.8956 0.1623
Unsecured (%) 0.52 0.65 0.8 0.91 1 0.7846 0.1591
Rejected plans - Quorum of votes
Percentiles
Measurement Smallest 25% 50% 75% Largest Mean Std.Dev
Labor (%) 0 0.16 0.57 1 1 0.5475 0.4093
Secured (%) 0.21 0.89 1 1 1 0.8981 0.2371
Unsecured (%) 0.23 0.42 0.53 0.84 1 0.6 0.2379
Rejected plans - Votes in favor of rejecting the plan
Percentiles
Measurement Smallest 25% 50% 75% Largest Mean Std.Dev
Labor (%) 0 0 0 0 1 0.1042 0.2854
Secured (%) 0.02 0.99 1 1 1 0.8984 0.2717
Unsecured (%) 0 0.46 0.68 0.85 1 0.6081 0.3085
Note: This table presents the percentage of quorum and outcome of the votes during the creditors’ general
meeting for each possible result.

36
Table VI - Proposal of payment to claimholders
A. Debtor’s proposal to claimholders
Approved
Percentiles
Measurement Smallest 25% 50% 75% Largest Mean Std. Dev
Debt discount (% of Debt) 0 0 0.2 0.375 0.6 0.195 0.2092
Grace period (Months) 0 12 24 24 48 20.4 11.357
Modified
Percentiles
Measurement Smallest 25% 50% 75% Largest Mean Std. Dev
Debt discount (% of Debt) 0 0 0.3 0.5 0.7 0.27 0.2516
Grace period (Months) 0 9 12 24 60 15.92 13.11
Rejected
Percentiles
Measurement Smallest 25% 50% 75% Largest Mean Std.Dev
Debt discount (% of Debt) 0 0 0.4 0.5 0.8 0.313 0.2739
Grace period (Months) 12 12 22 24 36 19.23 7.72
Note: Own Elaboration. This table shows the descriptive results of all payment proposals according to the
results of the Assembly. Debt discount is the portion of debt discounted from the original debt value.
Grace period is the period from the plan vote to the first creditor’s payment
B. Correction form of the debt payment during the reorganization period
Correction form of the debt payment
Approved Modifed Rejected
Correction form % of the total % of the total % of the total
Inflation (only) 23.08% 10.26% 41.18%
Inflation + fixed interest rate 3.85% 2.56% 0.00%
Fixed interest rate 19.23% 17.95% 5.88%
Floating interest rate 23.08% 43.59% 35.29%
N.I 30.77% 25.64% 17.65%
TOTAL 100.00% 100.00% 100.00%
Note: The variable N.I indicates the portion of reorganization plans that did not presented a correction
form of the debt payment
37
Table VII – Payment disparities and descriptive measurement of distress
A - Disparities among proposals of payment
Note: This table shows the disparities in payment proposals in the reorganization for the same class of
creditors and for the three different classes of creditors. Disparities mean the portion of different cases for
each payment specification divided by the total number of cases
B – Descriptive measure of financial and economic distress
Approved
Percentiles
Proxy Measurement N.O Smallest 25% 50% 75% Largest Mean Std. Dev
Financial distress Debt-to-asset ratio 16 0.3969 0.989 2.879 6.8 243.00 21.4 60.19
Economic distress Past 3 years (sector's profitability) 25 0.032 0.05 0.067 0.081 0.092 0.066 0.0169
Modified
Percentiles
Proxy Measurement N.O Smallest 25% 50% 75% Largest Mean Std. Dev
Financial distress Debt-to-asset ratio 41 0.21 0.527 0.9701 3.27 458.51 24.75 79.72
Economic distress Past 3 years (sector's profitability) 66 0.032 0.066 0.078 0.088 0.096 0.073 0.0164
Rejected
Percentiles
Proxy Measurement N.O Smallest 25% 50% 75% Largest Mean Std. Dev
Financial distress Debt-to-asset ratio 19 0.14 0.93 1.799 4.31 137.22 11.2 31.03
Economic distress Past 3 years (sector's profitability) 29 0.032 0.05 0.078 0.083 0.095 0.069 0.018
Note: This table presents descriptive results for measures of financial and economic distress. The
financial distress proxy captures the portion of debt to the total assets of a firm. The economic distress
proxy captures the average EBITDA for the past 3 years divided by the total book value of all listed
companies as a measure of the profitability of a given sector
Approved Modified Rejected
Same class Among classes Same class Among classes Same class Among classes
Debt payment specification % of all cases in the category
Debt discount 0 36% 11.11% 40.74% 14.29% 25%
Grace period 8% 0 9.26% 25.93% 10.71% 21.43%
Debt payment correction 0 12% 1.85% 16.67% 3.57% 3.57%

38
Table VIII - Probit results for labor debt by value and number
Plan_Acceptance- Equation 1 -Labor Decision
Labor - Value criteria Labor - Number criteria
Variables %Labor %Labor Variables #Labor #Labor
Labor debt (%) -2.369 -2.621 Labor debt (#) -0.0001 -0.00008
(2.8324) (2.7866) (0.0001) (0.0001)
Type 0.1183 0.1895 Type 0.3207 0.3583
(0.4182) (0.3868) (0.4245) (0.3888)
Asset_Disposal 0.40081 0.5253** Asset_Disposal 0.5058* 0.6686**
(0.2825) (0.2642) (0.2918) (0.2748)
Ln_Total_Debt 0.1271 0.1111 Ln_Total_Debt 0.1587 0.1289
(0.1034) (0.0984) (0.1093) (0.1023)
Dif_Classes -0.4504 -0.3048 Dif_Classes -0.5518* -0.3388
(0.2851) (0.2688) (0.3042) (0.2805)
Ownership_reorg 0.3142 0.4444 Ownership_reorg 0.2203 0.3672
(0.3111) (0.2926) (0.3319) (0.3078)
Constant -2.5471 -2.4411 Constant -3.0557 -2.8112*
(1.897) (1.6106) (1.9057) (1.6429)
Year FE? Yes No Year FE? Yes No
Observations 116 119 Observations 108 112
Pseudo-R2 0.1501 0.1186 Pseudo-R2 0.1847 0.1414
Note: Plan_Acceptance is a dummy variable that takes the value of 1 if the reorganization plan is
accepted without changes and 0 if the reorganization plan is either accepted with modifications suggested
by the creditors or rejected. ***, ** and * denote significance at the 1% level, 5% level and 10% level
respectively. Standard errors are shown in parentheses

39
Table IX - Probit results for labor debt (value and number together)
Note: Plan_Acceptance is a dummy variable that takes the value of 1 if the reorganization plan is
accepted without changes and 0 if the reorganization plan is either accepted with modifications suggested
by the creditors or rejected. ***, ** and * denote significance at the 1% level, 5% level and 10% level
respectively. Standard errors are shown in parentheses
Plan_Acceptance - Equation 1 - Labor Decision
Labor - Value and number criteria
Variables % and #
Labor debt (%) -2.6129 -3.3078
(3.023) (3.0049)
Labor debt (#) -00011 -0.0004
(0.00013) (0.0001)
Type 0.4516 0.5273
(0.2953) (0.4167)
Asset_Disposal 0.4674 0.5253**
(0.2953) (0.2642)
Ln_Total_Debt 0.1182 0.0833
(0.1183) (0.1103)
Dif_Classes -0.5173* -0.3218
(0.3078) (0.2849)
Ownership_reorg 0.2927 0.4297
(0.3452) (0.3179)
Constant -2.2241 -1.998
(2.1135) (1.7945)
Year FE? Yes No
Observations 108 112
Pseudo-R2 0.1904 0.1506

40
Table X - Probit results for secured debt by value and number
Note: Plan_Acceptance is a dummy variable that takes the value of 1 if the reorganization plan is
accepted without changes and 0 if the reorganization plan is either accepted with modifications suggested
by the creditors or rejected. ***, ** and * denote significance at the 1% level, 5% level and 10% level
respectively. Standard errors are shown in parentheses
Plan_Acceptance- Equation 2 - Secured Decision
Secured - Value criteria Secured - Number criteria
Variables Variables
Secured debt (%) -1.3496* -1.0951* Secured debt (#) -0.1283 -0.1888
(0.7727) (0.6735) (0.3586) (0.3101)
SBL 0.2431 0.0041 SBL 0.05429 -0.1603
(0.3965) (0.355) (0.3753) (0.3361)
Type 0.3001 0.4004 Type 0.1439 0.2929
(0.4435) (0.4136) (0.434) (0.4086)
Asset_Disposal 0.6565** 0.7436** Asset_Disposal 0.5617* 0.6626**
(0.3288) (0.3053) (0.3224) (0.2999)
Ln_Total_Debt 0.1801 0.1511 Ln_Total_Debt 0.2006* 0.1695
(0.1097) (0.1009) (0.1125) (0.1057)
Dif_Classes -0.5838* -0.3606 Dif_Classes -0.6425** -0.3984
(0.317) (0.2853) (0.3107) (0.2814)
Dif_Same_Class -0.402 -0.379 Dif_Same_Class -0.4011 -0.3519
(0.35) (0.3359) (0.3457) (0.3333)
Ownership_reorg 0.171 0.3153 Ownership_reorg 0.1032 0.2885
(0.3549) (0.3233) (0.35) (0.3211)
Payment_time_years -0.2336 -0.2582 Payment_time_years -0.1927 -0.2324
(0.3573) (0.3356) (0.3529) (0.0332)
Constant -3.2211 -2.686 Constant -3.4985* -3.0211*
(2.0196) (1.6068) (1.865) (1.664)
Year FE? Yes No Year FE? Yes No
Observations 105 108 Observations 105 108
Pseudo-R2 0.1933 0.1547 Pseudo-R2 0.1721 0.1387

41
Table XI - Probit results for secured debt
Plan_Acceptance- Equation 2 - Secured Decision
Secured - Value and number criteria
Variables % and #
Secured debt (%) -1.6489* -1.2868
(0.9109) (0.8255)
Secured debt (#) 0.2671 0.0153
(0.421) (0.0377)
SBL 0.2911 0.0245
(0.4044) (0.3587)
Type 0.3615 0.4368
(0.4563) (0.4239)
Asset_Disposal 0.6389* 0.7346**
(0.3306) (0.3062)
Ln_Total_Debt 0.1543 0.1347
(0.1167) (0.1085)
Dif_Classes -0.5834* -0.3559
(0.3164) (0.2853)
Dif_Same_Class -0.3957 -0.3741
(0.3509) (0.3365)
Ownership_reorg 0.1657 0.3228
(0.3552) (0.3238)
Payment_time_years -0.0212 -0.02441
(0.036) (0.338)
Constant -2.7797 -2.449
(1.9251) (1.7047)
Year FE? Yes No
Observations 105 108
Pseudo-R2 0.1962 0.1558
Note: Plan_Acceptance is a dummy variable that takes the value of 1 if the reorganization plan is
accepted without changes and 0 if the reorganization plan is either accepted with modifications suggested
by the creditors or rejected. ***, ** and * denote significance at the 1% level, 5% level and 10% level
respectively. Standard errors are shown in parentheses

42
Table XII – Probit results for unsecured debt by value and number
Plan_Acceptance - Equation 3 - Unsecured Decision
Unsecured - Value criteria Unsecured - Number criteria
Variables Variables
Unsecured debt (%) 1.6466** 1.3930** Unsecured debt (#) -0.0014*** -0.0010**
(0.8181) (0.6828) (0.0005) (0.0008)
UBL -1.1455** -1.1278** UBL -1.1320** -1.1110**
(0.539) (0.5224) (0.4786) (0.4666)
Type 0.5091 0.5247 Type 0.5031 0.576
(0.4631) (0.4315) (0.4945) (0.4513)
Asset_Disposal 0.6912** 0.8114*** Asset_Disposal 0.6951** 0.8064**
(0.3339) (0.3114) (0.3451) (0.3162)
Ln_Total_Debt 0.1067 0.08633 Ln_Total_Debt 0.3853** 0.2627**
(0.1149) (0.1056) (0.1517) (0.1272)
Dif_Classes -0.5758* -0.4173 Dif_Classes -1.0367** -0.6482**
(0.3175) (0.2924) (0.3601) (0.3015)
Dif_Same_Class -0.3514 -0.3057 Dif_Same_Class -0.4973 -0.2857
(0.3549) (0.3408) (0.3773) (0.341)
Ownership_reorg 0.2836 0.3593 Ownership_reorg 0.4563 0.2763
(0.3668) (0.3354) (0.3794) (0.3438)
Payment_time_years -0.0155 -0.2066 Payment_time_years -0.0116 -0.0217
(0.03658) (0.3444) (0.03721) (0.0344)
Constant -2.9885 -2.5506 Constant -6.9084*** -3.9847**
(2.0642) (1.759) (2.6734) (2.023)
Year FE? Yes No Year FE? Yes No
Observations 105 108 Observations 105 108
Pseudo-R2 0.2359 0.1986 Pseudo-R2 0.2784 0.225
Note: Plan_Acceptance is a dummy variable that takes the value of 1 if the reorganization plan is
accepted without changes and 0 if the reorganization plan is either accepted with modifications suggested
by the creditors or rejected. ***, ** and * denote significance at the 1% level, 5% level and 10% level
respectively. Standard errors are shown in parentheses

43
Table XIII - Probit results for unsecured debt
Plan_Acceptance - Equation 3 - Unsecured Decision
Unsecured - Value and number
criteria
Variables
Unsecured debt (%) 1.7764** 1.5624**
(0.8433) (0.7017)
Unsecured debt (#) -0.0015*** -0.0011***
(0.0005) (0.00044)
UBL -1.2891*** -1.2354**
(0.5548) (0.5386)
Type 0.7974 0.8046
(0.5167) (0.4732)
Asset_Disposal 0.8123** 0.9548***
(0.3591) (0.3318)
Ln_Total_Debt 0.3729** 0.2716**
(0.1601) (0.4733)
Dif_Classes -0.9174** -0.5668*
(0.3746) (0.3132)
Dif_Same_Class -0.6023 -0.4493
(0.3891) (0.3548)
Ownership_reorg 0.2293 0.3628
(0.3972) (0.3572)
Payment_time_years -0.1793 -0.0306
(0.3799) (0.0357)
Constant -7.5088*** -5.348**
(2.8419) (2.2522)
Year FE? Yes No
Observations 105 108
Pseudo-R2 0.312 0.2588
Note: Plan_Acceptance is a dummy variable that takes the value of 1 if the reorganization plan is
accepted without changes and 0 if the reorganization plan is either accepted with modifications suggested
by the creditors or rejected. ***, ** and * denote significance at the 1% level, 5% level and 10% level
respectively. Standard errors are shown in parentheses

44
Table XIV – Probit results for labor and secured variables and for labor and
unsecured variables
Note: Plan_Acceptance is a dummy variable that takes the value of 1 if the reorganization plan is
accepted without changes and 0 if the reorganization plan is either accepted with modifications suggested
by the creditors or rejected. ***, ** and * denote significance at the 1% level, 5% level and 10% level
respectively. Standard errors are shown in parentheses
Plan_Acceptance - Labor, Secured and Unsecured Decision
Labor and secured - Value and number criteria Labor and unsecured - Value and number criteria
Variables Variables
Secured debt (%) -1.4368 -1.08 Unsecured debt (%) 1.5580* 1.3649*
(0.9592) (0.8806) (0.8945) (0.7401)
Secured debt (#) 0.02634 0.1478 Unsecured debt (#) -0.0015** -0.0013**
(0.0444) (0.3905) (0.0006) (0.0005)
SBL 0.2116 -0.3306 UBL -1.0718* -1.0632*
(0.4323) (0.3778) (0.6493) (0.6056)
Labor debt (%) -2.3059 -3.1524 Labor debt (%) -1.4243 -2.2062
(3.28) (3.0985) (3.6838) (3.6377)
Labor debt (#) -0.0001 -0.00007 Labor debt (#) 0.0003 0.0001
(0.0001) (0.00013) (0.0001) (0.0001)
Type 0.6244 0.7027 Type 0.9197 0.9818*
(0.4905) (0.4537) (0.5465) (0.5105)
Asset_Disposal 0.6428* 0.7577** Asset_Disposal 0.7778** 0.9134***
(0.3414) (0.3161) (0.3731) (0.3422)
Ln_Total_Debt 0.1517 0.1029 Ln_Total_Debt 0.3466** 0.2285
(0.1363) (0.1252) (0.1676) (0.1416)
Dif_Classes -0.5837* -0.3213 Dif_Classes -0.85704 -0.4745
(0.3421) (0.304) (0.3886) (0.3243)
Dif_Same_Class -0.3941 -0.3791 Dif_Same_Class -0.6033 -0.4573
(0.3664) (0.3484) (0.3961) (0.36)
Ownership_reorg 0.2073 0.3424 Ownership_reorg 0.2023 0.3414
(0.3828) (0.3439) (0.4119) (0.3722)
Payment_time_years -0.2254 -0.0292 Payment_time_years -0.0197 -0.032
(0.3568) (0.3401) (0.37755) (0.03591)
Constant -2.8387 -1.8292 Constant -7.031084** -4.4917*
(2.4916) (1.9934) (2.8714) (2.398)
Year FE? Yes No Year FE? Yes No
Observations 102 105 Observations 102 105
Pseudo-R2 0.2157 0.1692 Pseudo-R2 0.3034 0.2522

45
Table XV – Probit results for secured and unsecured debt
Plan_Acceptance - Secured and Unsecured Decision
Secured and unsecured - Value and number criteria
Variables
Secured debt (%) -1.6345 -0.197
(3.4578) (3.2719)
Secured debt (#) 0.8398 0.04966
(0.0525) (0.04352)
SBL 0.2561 0.0732
(0.468) (0.3932)
Unsecured debt (%) 1.2181 2.0115
(3.1877) (3.0221)
Unsecured debt (#) -0.0018*** -0.0013***
(0.0006) (0.0004)
UBL -1.2987** -1.2446**
(0.5705) (0.5503)
Type 1.0483 0.9785*
(0.58515) (0.5115)
Asset_Disposal 0.8033** 0.9389***
(0.3771) (0.3385)
Ln_Total_Debt 0.3608** 0.2369*
(0.168) (0.1402)
Dif_Classes -1.0158** -0.5601*
(0.4007) (0.3199)
Dif_Same_Class -0.5921 -0.4446
(0.4111) (0.3663)
Ownership_reorg 0.1722 0.3868
(0.4139) (0.3644)
Payment_time_years -0.0109 -0.0273
(0.0392) (0.0362)
Year FE? Yes No
Observations 105 108
Pseudo-R2 0.3322 0.2688
Note: Plan_Acceptance is a dummy variable that takes the value of 1 if the reorganization plan is
accepted without changes and 0 if the reorganization plan is either accepted with modifications suggested
by the creditors or rejected. ***, ** and * denote significance at the 1% level, 5% level and 10% level
respectively. Standard errors are shown in parentheses

46
Table XVI - Variance Inflation Factor (VIF)
Variance inflation factors
Variables – labor Variables – secured Variables - unsecured
labor debt secured debt unsecured debt
Variables VIF 1/VIF Variables VIF 1/VIF Variables VIF 1/VIF
type 1.75 0.57 secured_debt (#) 1.21 0.82 unsecured_debt (#) 1.81 0.55
log_debt 1.84 0.54 SBL 1.59 0.62 UBL 1.57 0.63
ownership_reorg 1.19 0.83 type 1.84 0.54 type 1.77 0.56
asset Disposal 1.16 0.86 Asset Disposal 1.34 0.74 asset Disposal 1.30 0.76
dif_classes 1.08 0.92 log_debt 2.20 0.45 log_debt 2.84 0.35
mean VIF 1.40 Dif_classes 1.09 0.91 dif_classes 1.12 0.89
dif_same_class 1.09 0.90 dif_same_class 1.09 0.91
ownership_reorg 1.34 0.74 ownership_reorg 1.35 0.74
payment_years 1.20 0.83 payment_years 1.17 0.86
mean VIF 1.43 mean VIF 1.56
Source: own elaboration