corporate report - kansai.com · kansai paint is proud to be party to a 3-year agreement as the ......
TRANSCRIPT

KA
NSA
I PAIN
T CO
., LTD. C
orporate Report 2016
Corporate ReportYear Ended March 31, 2016
2016

Contents
Corporate BrandOur “ALESCO” brand name is formed from the Latin
word “ALES,” meaning “wing” and “ESCO,” which
stands for “Excellent Specialty Company.” In Latin,
“alesco” itself means to grow and mature. Therefore,
“ALESCO” expresses the concept of Kansai Paint
growing continuously and flying with its wings spread
toward the future as a leading specialty company.
The “ALESCO” corporate brand expresses to the
world the image of the superb quality and excellent
value of Kansai Paint and its Group companies.
Established in 1918, Kansai Paint Co., Ltd. has grown
into Japan’s most progressive manufacturer in
various fields related to coatings.
Today, the company enjoys a well-established
position as one of the world’s leading
paint manufacturers.
The various products provided by the Kansai
Paint Group are highly valued and trusted in a broad
variety of fields, due to the important role our
coatings play, such as protection, beautification,
special functionality, and environmental sensitivity.
Moreover, with Kansai Paint’s proprietary
research and development capabilities at its core, the
Company is providing its clients around the world
with unparalleled customer service by expanding its
manufacturing, distribution, and sales
activities worldwide.
Five-Year Summary of Selected Financial Data …… 01A Message from the President ……………………… 02Management Philosophy and Vision ……………… 04Board of Directors …………………………………… 06
Business Review ALESCO at a Glance ………………………… 08 Business Overview by Segment …………… 10 Research and Development Operations …… 12 New Products ……………………………… 14
Environmental Activities Policies on Environmental Conservation … 16 Environmental Management ……………… 17 ALES ECO PLAN 2015 ……………………… 18 Formulation of ALES ECO PLAN 2018 …… 20 Green Procurement and
Supply Chain Management ………………… 21 Management of Chemical Substances …… 22 Environmental Conservation Activities …… 23
Social Activities Occupational Safety and Health …………… 26 Treatment of Employees …………………… 28 Consumer Protection ……………………… 29 Social Action Programs …………………… 30
Financial Section …………………………………… 31Directory ……………………………………………… 61
Profile
Company ProfileName: Kansai Paint Co., Ltd.Head office: 6-14, Imabashi 2-chome,
Chuo-ku, Osaka 541-8523, Japan
Date established: May 17, 1918
Capitalization: 25,658 million yenNumber of employees: 12,491 (consolidated)
Principal business lines: Manufacturing and sale of paints Design, manufacturing, and sale of coating equipment Control and undertaking of painting work Design of color schemes
Corporate website: http://www.kansai.co.jp/

Kansai Paint Co., Ltd. Corporate Report 2016 1
Five-Year Summary of Selected Financial Data (Years ended March 31, 2016, 2015, 2014, 2013 and 2012)
Consolidated Basis
* 1: For convenience only, U.S. dollar amounts in this report have been translated from Japanese yen at the rate of ¥112.68 to U.S.$1.00, the exchange rate at March 31, 2016.
* 2: Net income per share is calculated based on the weighted average number of common shares in issue during the year.
100,000
200,000
300,000
400,000
(Millions of yen)
20162015201420132012
328,119349,334
320,454294,053
256,591
• Net sales
(Millions of yen)
5,000
20,000
15,000
10,000
25,000
30,000
35,000
20162015201420132012
28,344
20,40921,560
17,758
13,996
• Net income attributable to owners of the parent
5,000
10,000
15,000
20,000
25,000
30,000
35,000
20162015201420132012
(Millions of yen)
31,580
34,772
29,636
24,171
19,315
• Operating income
(Millions of yen)
100,000
200,000
300,000
400,000
500,000
20162015201420132012
430,198400,092
362,625
319,410
448,085
• Total assets
10,000
20,000
30,000
40,000
50,000
20162015201420132012
(Millions of yen)
32,437
25,636
47,431
36,86739,087
• Income before income taxes and non-controlling interests
(Millions of yen)
50,000
150,000
100,000
200,000
250,000
300,000
350,000
20162015201420132012
303,627 293,903
258,016
222,798
192,788
• Net assets
Millions of yen Thousands of U.S. dollars *1
2016 2015 2014 2013 2012 2016
For the year:
Net sales ¥328,119 ¥349,334 ¥320,454 ¥294,053 ¥256,591 $2,911,954
Operating income 34,772 31,580 29,636 24,171 19,315 308,591
Income before income taxes and non-controlling interests 47,431 36,867 39,087 32,437 25,636 420,935
Net income attributable to owners of the parent 28,344 20,409 21,560 17,758 13,996 251,544
At year end:
Total assets ¥430,198 ¥448,085 ¥400,092 ¥362,625 ¥319,410 $3,817,874
Net assets 293,903 303,627 258,016 222,798 192,788 2,608,298
Yen U.S. dollars *1
Per share amounts:
Net income *2 ¥106.41 ¥76.61 ¥80.91 ¥66.62 ¥52.70 $0.94
2 Kansai Paint Co., Ltd. Corporate Report 2016
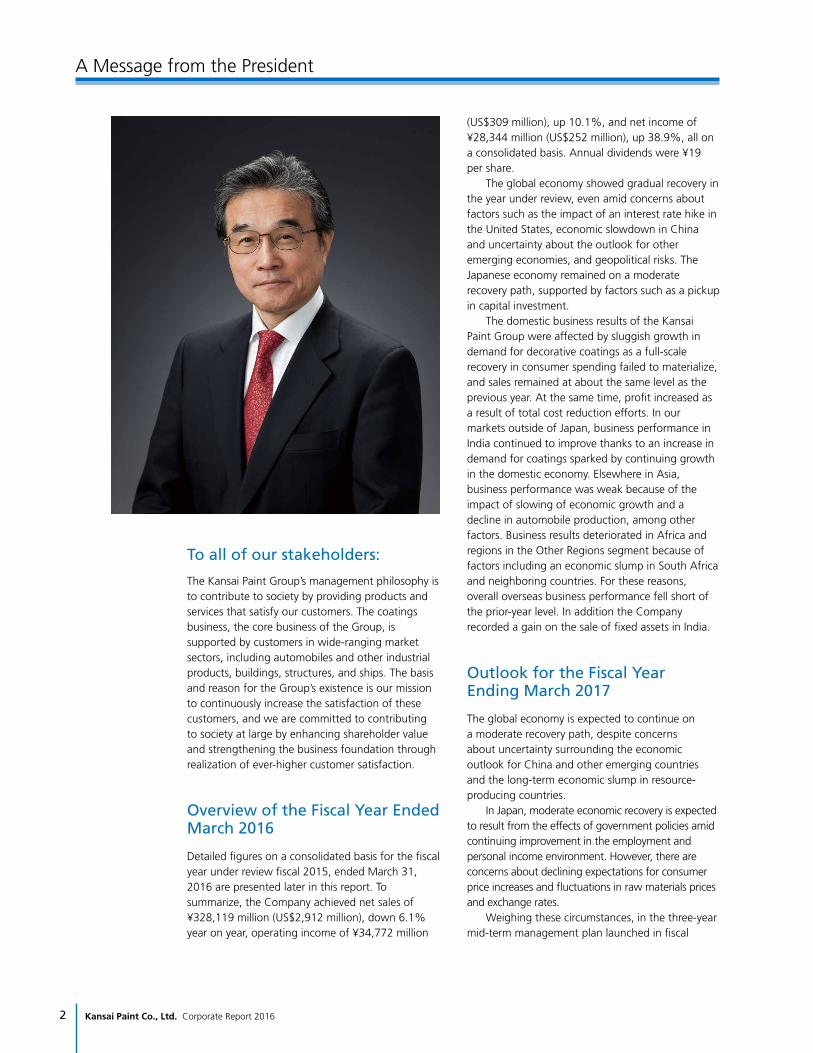
A Message from the President
The Kansai Paint Group’s management philosophy is to contribute to society by providing products and services that satisfy our customers. The coatings business, the core business of the Group, is supported by customers in wide-ranging market sectors, including automobiles and other industrial products, buildings, structures, and ships. The basis and reason for the Group’s existence is our mission to continuously increase the satisfaction of these customers, and we are committed to contributing to society at large by enhancing shareholder value and strengthening the business foundation through realization of ever-higher customer satisfaction.
Detailed figures on a consolidated basis for the fiscal year under review fiscal 2015, ended March 31, 2016 are presented later in this report. To summarize, the Company achieved net sales of ¥328,119 million (US$2,912 million), down 6.1% year on year, operating income of ¥34,772 million
(US$309 million), up 10.1%, and net income of ¥28,344 million (US$252 million), up 38.9%, all on a consolidated basis. Annual dividends were ¥19 per share. The global economy showed gradual recovery in the year under review, even amid concerns about factors such as the impact of an interest rate hike in the United States, economic slowdown in China and uncertainty about the outlook for other emerging economies, and geopolitical risks. The Japanese economy remained on a moderate recovery path, supported by factors such as a pickup in capital investment. The domestic business results of the Kansai Paint Group were affected by sluggish growth in demand for decorative coatings as a full-scale recovery in consumer spending failed to materialize, and sales remained at about the same level as the previous year. At the same time, profit increased as a result of total cost reduction efforts. In our markets outside of Japan, business performance in India continued to improve thanks to an increase in demand for coatings sparked by continuing growth in the domestic economy. Elsewhere in Asia, business performance was weak because of the impact of slowing of economic growth and a decline in automobile production, among other factors. Business results deteriorated in Africa and regions in the Other Regions segment because of factors including an economic slump in South Africa and neighboring countries. For these reasons, overall overseas business performance fell short of the prior-year level. In addition the Company recorded a gain on the sale of fixed assets in India.
The global economy is expected to continue on a moderate recovery path, despite concerns about uncertainty surrounding the economic outlook for China and other emerging countries and the long-term economic slump in resource-producing countries. In Japan, moderate economic recovery is expected to result from the effects of government policies amid continuing improvement in the employment and personal income environment. However, there are concerns about declining expectations for consumer price increases and fluctuations in raw materials prices and exchange rates. Weighing these circumstances, in the three-year mid-term management plan launched in fiscal
Overview of the Fiscal Year Ended March 2016
Outlook for the Fiscal Year Ending March 2017
To all of our stakeholders:

Kansai Paint Co., Ltd. Corporate Report 2016 3
2016, the Kansai Paint Group will aim for further improvement in business results and expansion of business activities under the key policies continued from the previous management plan: accelerated globalization, increased profitability, and strengthening of the group management foundation. For the fiscal year ending March 31, 2017,(fiscal 2016(, we have set targets of net sales of ¥340,000 million (US$3,017 million), operating income of ¥36,500 million (US$324 million), and net income of ¥25,000 million (US$222 million), all on a consolidated basis. We plan to pay annual dividends of ¥22 per share for fiscal 2016.
The Group has launched a three-year mid-term business plan beginning in fiscal 2016 and is engaging in business activities based on the following key policies.
1. Accelerated Globalization Strengthen the competitiveness of overseas businesses, focused on emerging economies with high growth prospects, by meeting market needs and optimizing cost and quality, and further strengthen the Group’s presence in overseas markets. Increase the overseas business contribution to consolidated business performance by accelerating business expansion through entry into untapped regions and market sectors.
2. Increased Profitability Pursue further profit growth through business-scale expansion and efficiency improvement. In Japan, maintain and increase market share and boost profitability by means of total cost reduction attained through optimization of the organizational structure and business processes and the resulting increase in competitiveness.
3. Strengthening of the Group Management Foundation Strengthen the management foundation to support acceleration of globalization and maximize synergies through the sharing and effective utilization of the Group’s enterprise resources.
The Kansai Paint Group aspires to become a truly global company that competes and thrives on the world stage by providing highly competitive products and services in markets all over the world. As part of this effort, Kansai Paint has entered into an Official Global Partner agreement with the world-famous football team Manchester United. This cooperative relationship increases the brand power and recognition of the Group and its products and effectively contributes to business development in countries and regions in all parts of the world. Just as Manchester United is supported by fans everywhere, the Kansai Paint Group will achieve growth by providing coatings that satisfy greater numbers of customers around the world. We hope that you find this corporate report a useful source of information about the business activities of the Kansai Paint Group.
Kansai Paint is proud to be party to a 3-year agreement as the Global Paint Partner of Manchester United, known as the club with 650 million fans worldwide. This affiliation will serve to improve the image of the Kansai Paint brand, and we intend to utilize this relationship in promotional campaigns in all our territories.
Hiroshi IshinoPresident and Representative Director
Management Strategies
Closing Thoughts

Management Philosophy and Vision
Auditor
General Shareholders’ Meeting
Appointments/ Dismissals
Audits
Coordination
Appointments/Dismissals
Internal Audit
Board of Directors
President Management Committee
Affiliate Administration
Office
Internal Directors External Directors
Appointments/ Dismissals
Financial Audits
Corporate Governance Organization
Executive Officers Corporate Governance Committee*Company
Departments and Affiliate Companies
Board of Auditors
External Auditor
Internal Auditor
* Corporate Governance Committee: The President serves as chairman, and the committee members are directors from each company division. The committee oversees matters such as internal control functions, compliance, risk management, and information management.
4 Kansai Paint Co., Ltd. Corporate Report 2016
Corporate Mission
(Established January 1967)
Management Philosophy
Our corporate mission is to contribute to society by providing eco-friendly and value-added coating materials and services that satisfy our customers. To realize new innovations in coating materials, we have defined our philosophy so that our employees are eager to
undertake new challenges, and so that we can combine our wisdom and knowledge to create future products. We aim to use our products and services to make continuous contributions to society.
1. To further build company credibility with the public and to contribute to society by providing products and services that achieve customer satisfaction.
2. To build on our knowledge and strive for technological innovations in order to improve the company’s performance.
3. To harness the collective efforts of all individuals in order to maximize company returns.
On the basis of harmony between business activities and environmental conservation, Kansai Paint aims to be an industry leader that ranks among the world’s most trusted companies by developing coatings that are markedly superior in quality, performance, new functionality, and cost
performance while at the same time pursuing global business development with keen awareness of the importance of compliance and risk management. We will contribute to the development of a sustainable society through these sound, continuous business activities.
This internal control organization assures healthy business administration and audits.
The Kansai Paint Concept of Corporate Social Responsibility
Corporate Governance Organization (As of June 2016)
Kansai Paint Group Response to Stakeholders (Stance)
Employees
• Realization of comfort and fulfillment for employees• Maintenance of a safe, worker-friendly workplace environment• Respect for character and individuality and fostering of a climate that rewards willingness to
take on challenges• Support for character and skills development through work
Customers• The provision of safe products and services that match customer needs, offer excellent
cost performance and high added value, and have low environmental impacts
Industry groups
• Engagement in active interchange and information exchange with the industry as a member of the paint and coatings industry
• Active contribution to the development of voluntary control regulations for the reduction of hazardous substances
Business partners• Good-faith dealings with all business partners• Establishment and observance of fair and proper trading conditions
Shareholders and investors• Increase of corporate value from sustained growth through strengthening of
existing business in Japan, development of new businesses, and expansion of overseas businesses• Accurate disclosure of useful information relating to business activities
Local communities• Co-existence and co-prosperity with society• Active interchanges with local communities
Global environment• Products friendly to the global environment• Autonomous, proactive environmental conservation initiatives
Kansai Paint Co., Ltd. Corporate Report 2016 5
Risk Management
Information Management
To comply with laws and regulations and fulfill our corporate social responsibility, Kansai Paint has established the Code of Ethics, Code of Conduct and Code of Behavior and clearly set out conduct guidelines that make “profit and fairness” the cornerstone of corporate activities. We also distribute a corporate ethics
handbook and continuously provide compliance education via company newsletters. Furthermore, we have set up a consultation desk for reporting compliance violations and appropriately deal with any reports through accurate information collection and disclosure.
In the Kansai Paint Policy and Initiatives with Respect to the Corporate Governance Code, established on September 25, 2015, the Company has expressed the following stance on the nature of engagement with stakeholders.
The Company established the Risk Management Committee for the purpose of preventing and responding to risks that may have a significant impact on the business, has formulated the Risk Management Guidelines and Risk Management Manual, and is developing a risk management system to respond to various potential risks.
In addition, the Company has prepared the Action Manual to prepare against risks identified, taking into consideration the nature and characteristics of the business, and constantly strives to operate and maintain a risk management to rapidly obtain information about crises, whether in Japan or overseas, ascertain the situation, and take appropriate response measures.
To ensure the legality of the business activities of Group companies and promote efficient operation, the Company properly handles and collects information necessary for the conduct of business activities and correctly records and retains the results in accordance with laws and regulations. To increase the transparency of business activities, the Company endeavors
to disclose in an accurate and timely manner matters stipulated by laws and regulations, important information concerning business management, and information useful to society relating to business activities except for information recognized as trade secrets under normal social conventions.
Engagement with Stakeholders
Compliance Promotion
6 Kansai Paint Co., Ltd. Corporate Report 2016
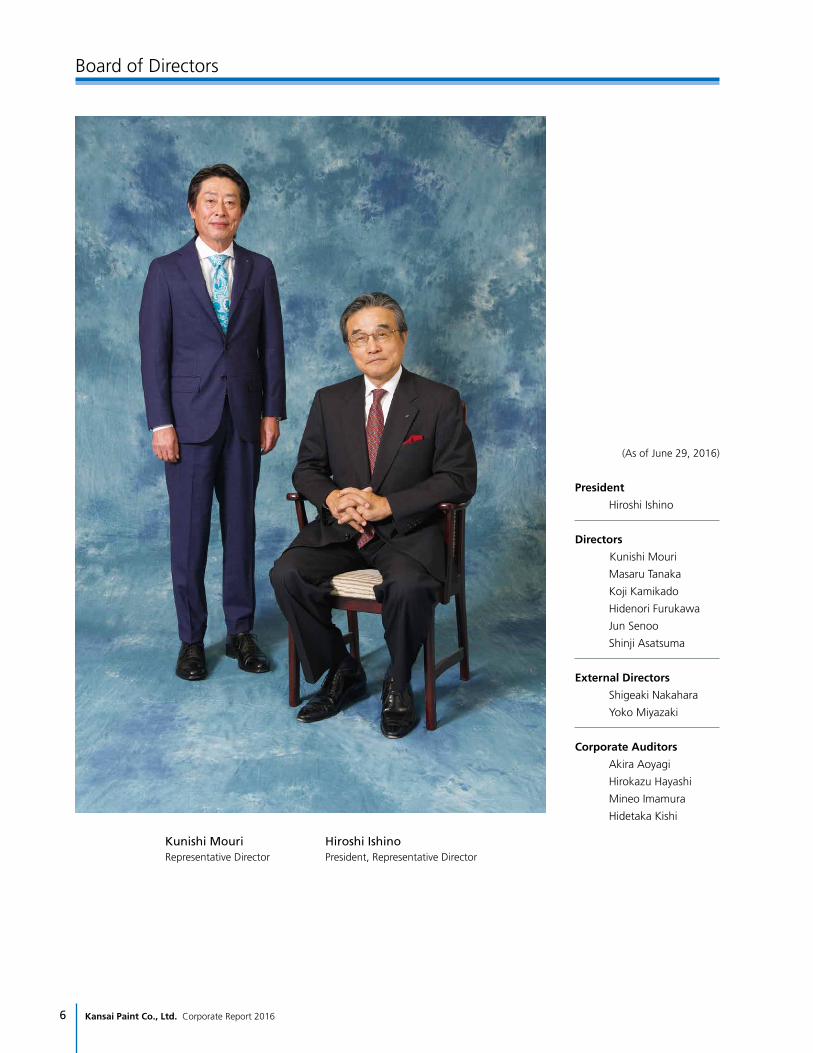
Board of Directors
(As of June 29, 2016)
President
Hiroshi Ishino
Directors
Kunishi Mouri
Masaru Tanaka
Koji Kamikado
Hidenori Furukawa
Jun Senoo
Shinji Asatsuma
External Directors
Shigeaki Nakahara
Yoko Miyazaki
Corporate Auditors
Akira Aoyagi
Hirokazu Hayashi
Mineo Imamura
Hidetaka Kishi
Hiroshi IshinoPresident, Representative Director
Kunishi MouriRepresentative Director
Kansai Paint Co., Ltd. Corporate Report 2016 7
BusinessReview08 ALESCO at a Glance
10 Business Overview by Segment
12 Research and Development Operations
14 New Products

38%
8 Kansai Paint Co., Ltd. Corporate Report 2016
Product Sales Ratio
Automotive CoatingsMain Products and ServicesAutomotive coatings are classified as coatings for new cars used by automobile manufacturers and as automotive refinish paints used in auto body shops. Automotive coatings for new cars are paints applied by automobile manufacturers and paints applied at auto parts factories, using automatic application lines with high-temperature curable paints. Automotive refinish paints are intended for use in body shops for vehicles damaged in accidents, etc.
Product Sales Ratio
Industrial CoatingsMain Products and ServicesIndustrial coatings are used with a wide range of industrial products, including construction vehicles, industrial machines, agricultural equipment, home electronics, beverage cans, pre-coated metals, and various types of building materials. For this area, different types of coating performance, coating methods, and application conditions are required for various types of industrial products. In order to meet these needs, we provide an exceptionally wide and diverse range of paints, coatings, and services.
ALESCO at a GlanceBusiness Review
25%

25% 7%
Kansai Paint Co., Ltd. Corporate Report 2016 9
Product Sales Ratio
Main Products and Services
Decorative Coatings
Decorative coatings include coatings to protect structures such as residential houses and buildings from deterioration, as well as coatings used to enhance the beauty of structures. These coatings are classified as exterior coatings or interior coatings, depending on where they are used, and are also classified according to the type of application — coatings for new structures and coatings for repairs. These coatings are used in close proximity to the human living environment, so recently there has been a growing demand for eco-friendly products in this area.
Product Sales Ratio
Marine and Protective CoatingsMain Products and ServicesThis area encompasses marine coatings used with marine structures in order to provide long-term protection from corrosion for steel structures and protective coatings for structures on land. Marine structures include ships, offshore structures, and marine containers, while structures on land include bridges, tanks, and plants. Coatings are available for new structures and for maintenance applications.

10 Kansai Paint Co., Ltd. Corporate Report 2016
Japan In the automotive coatings market sector, although automobile production declined year on year, sales were at the prior-year level due to coating exports and other factors. Sales rose sharply in the marine coatings sector as a result of recovery in the shipbuilding market and sales expansion efforts. Full-scale recovery failed to materialize in the decorative coatings and protective coatings sectors, despite a pickup in capital investment and emerging signs of recovery in market conditions. Market conditions were weak in the industrial coatings and automotive refinish paints sectors, and sales fell short of the prior-year level. As a result of the above, overall segment sales remained at the level of the previous year. At the same time, profit increased thanks to declining raw materials prices and total cost reduction efforts. Sales in Japan were ¥155,367 million, up 0.9% from the previous term, and ordinary profit was ¥21,470 million, up 20.9%.
India In the automotive coatings sector, the Group worked to further increase market share amid continuously rising automobile production. The Group engaged in sales promotion activities in the decorative coatings sector as well, especially during the demand season, at a time of continuing demand expansion spurred by growth in the Indian economy. As a result, business results improved substantially on a local currency basis. However, performance on a yen basis was adversely affected by currency conversion. As a result, sales in India were ¥65,800 million, down 5.4% from the previous year, and ordinary profit was ¥9,196 million, up 17.9%.
Business Overview by SegmentBusiness Review

Kansai Paint Co., Ltd. Corporate Report 2016 11
Asia In Thailand, automobile production showed no signs of a full-scale recovery, and demand remained weak. Business results in Indonesia were affected by a decrease in automobile production resulting from weakness in the Indonesian economy. In China, overall sales decreased due to factors such as weak demand for construction machinery, despite signs of sales recovery in the automotive sector, partly as a result of the introduction of tax incentives for compact cars in the second half of the fiscal year. Equity in earnings of affiliates in China rose on an increase in the share of sales to non-Japanese automakers. The overall business results for Asia declined year on year, in part because of the impact of currency conversion. In addition, we continued to amortize goodwill resulting from the acquisition in fiscal 2012 of Indonesia-based PT. Kansai Prakarsa Coatings. As a result, sales in Asia were ¥58,898 million, down 11.1% from the previous term, and ordinary profit was ¥7,651 million, down 7.7%.
Africa Despite continuing sales promotion efforts, sales fell slightly on a local currency basis at a time of weakness in the economies of South Africa and neighboring countries. Investment in sales promotion and other factors put pressure on profits, and substantial currency conversion effects contributed to weak business results. As a result, sales in Africa were ¥29,252 million, down 26.0% from the previous year, and ordinary loss, including goodwill amortization, was ¥595 million.
Other Regions In Turkey, although growth continued, the impact of depreciation of the Turkish lira on raw materials prices and other factors put pressure on profits, and currency conversion substantially affected the business results. Whereas automobile production in North America increased, growth in automobile production in Europe was sluggish, and equity in earnings of affiliates decreased. As a result of these factors, sales in Other Regions were ¥18,802 million, down 6.1% from the previous term, and ordinary profit was ¥1,993 million, down 17.9%.

Business Review
12 Kansai Paint Co., Ltd. Corporate Report 2016
Research and Development Operations
The Kansai Paint Group’s total R&D expenditure in the fiscal year under review amounted to ¥5,046 million. A total of 649 Group employees are engaged in R&D activities at this time.
The status of the Group’s main R&D activities is as follows.
The Company’s basic research, aimed at the discovery of new materials that can be applied globally, is focused on accumulating core technologies useful for coatings. It covers key research areas including polymer synthesis, new cross-linking reactions, pigment dispersion, surface control, rheology control, and environmental improvement technologies. In basic analysis, we establish new technologies for
The Kansai Paint Group operates four research institutes and one research center where the Company’s technology departments collaborate with those of Group companies in efficient, wide-ranging research and development activities for the timely development of technologies and products adapted to market needs. As the Group accelerates global business development, the Company is further strengthening collaboration with Group companies and undertaking development of new technologies suited to the world’s markets while fostering world-class R&D personnel.

Kansai Paint Co., Ltd. Corporate Report 2016 13
the analysis of phenomena in the film formation process and film performance and functions, areas in which it is extremely difficult to originate evaluation technologies, and contribute to product development through detailed and accurate observation. We are working to establish a highly reliable global research system by sharing technologies acquired through these activities with Group companies, providing guidance concerning quality control, the environment, and safety, and offering consulting and other services to customers. In our color and design research activities, in the field of automotive coatings we have developed and proposed advanced color groups that reflect the results of research and analysis of the latest color trends conducted at motor shows in Japan and overseas. In particular, we have
designing materials that will further reduce environmental impacts, such as a low-temperature curing, thin-film system. In the industrial coatings field, we are developing and seeking to apply a non-chromium type primer for the pretreatment of steel plates and engaging in technical development related to process efficiency and conversion to waterborne coatings. In the decorative coatings and protective coatings fields, we are converting to waterborne coatings and focusing effort on researching and commercializing functionally enhanced coatings, such as heat-shielding, anti-bacterial, and multicolor coatings. At the same time, we are developing evaluation technologies and equipment required to develop these coatings and working to increase coating development efficiency and bring products in development closer to completion. Research and development expenditure by segment during the fiscal year under review was ¥4,163 million for Japan, ¥336 million for India, ¥68 million for Africa, and ¥477 million for Other Regions.
continuously conducted surveys of automotive color trends in Asian countries that have driven color proposal activities. We are developing color application technologies for improving the weather resistance and color stability of waterborne coatings and have applied them in high-value-added design development. In the field of color optical science, we are conducting research on the application of computerized color design and working to improve paint color adoption rate by automobile manufacturers. In painting and coating systems development, we are developing technologies for realizing eco-friendly paint and painting with the aim of contributing to a sustainable society. In the automotive coatings field, we have further progressed research and development for expanding and diversifying use of our highly rated Waterborne 3-Wet Coating System, an eco-friendly technology that is both process-efficient and energy-efficient, and are

Business Review
14 Kansai Paint Co., Ltd. Corporate Report 2016
New Products
Background and Issue Addressed
Infectious disease prevention is an important social challenge
Winner of the Nikkei Sangyo Shimbun
Award, the highest award in the 2015 Nikkei
Superior Products and Services Awards
Creating Healthy, Safe, Comfortable Living Spaces
ALES Mushiyoke Clean® repels insect pests
It is unpleasant and annoying when spiders, winged ants, moths, or other insects alight on walls. Kansai Paint has developed ALES Mushiyoke Clean®, a coating that repels insect pests when coated on room walls. This product is expected to be effective in preventing infectious diseases.
A Problem-Solving Initiative
Kansai Paint has blended into a coating a pharmacological agent that repels midges, termites, and other insects. This ingredient affects the nervous systems of insects that alight on coated room surfaces, making it difficult for them to remain in the room!
The Nikkei Superior Products and Services Awards are conferred annually on particularly excellent new productsand services. This year, Nikkei Inc. independently selectedcandidate products and services from among some 20,000 entrants. Award-winning products and services were then chosen by a knowledgeable panel of judges.
Blending an insect repellent (a pyrethroid agent) into the coating wards off insects by affecting the nervous systems (causing discomfort) of insects that alight on (come into contact with) coated room surfaces.
Many insect pest species, after entering a room, tend to spend more time on walls or the ceiling than flying.
Contact with the insect repellent
Here’s why it’s effective!
An insect enters a room.
The insect alights on a wall or ceiling.
The insect leaves the wall or ceiling.
More time is spent at rest than flying.

Kansai Paint Co., Ltd. Corporate Report 2016 15
16 Policies on Environmental Conservation
17 Environmental Management
18 ALES ECO PLAN 2015
20 Formulation of ALES ECO PLAN 2018
21 Green Procurement and Supply Chain Management
22 Management of Chemical Substances
23 Environmental Conservation Activities
EnvironmentalActivities

RC CommitteeCommittee Chairman:President
User- and Customer-RelatedEnvironmental Safety Committee
RC Committee for Company-wide Promotion of Quality Control and Environmental Protection
Environmental Safety &Health Committee
SecretariatQA & Environment Division
RC Top Management ReviewCompany President, Directors, Executive Officers, Auditors
Activities
• Reduce toxic substances in products
• Development of eco-products
• Fulfillment of a system for dealing with environmental laws and regulations
• Dealing with PL (Product liability)
• Reduce the burden on the environment during production operations
• Securing of safety and health
• Environmental conservation
Activities Activities
Reflection in Company-widePDCA activities
ALES ECO PLANP D
ISO 14001 Activities
Site Environmental Policies
Objectives,Targets, Plans
Implementationand Operation
Management ReviewInternal Audits, Monitoring,Measurement, etc.
Environmental & ProductSafety Committee
P D
A C
PLAN
CCHECK
AACTION
DO
16 Kansai Paint Co., Ltd. Corporate Report 2016
Corporate Policies on Environmental Conservation(Stipulated in Fundamental Rules regarding the Conservation of the Global Environment)
Policies on Environmental ConservationEnvironmental Activities
Basic Policies
1. To supply products after full consideration of their potential impacts on people and the environment.
2. To undertake proactive countermeasures to cope with the potential effects of products on people and the environment.
3. To contribute to society while raising awareness about the environment, safety and health.
4. To disclose and provide information related to the environment, safety and health.
• Environmental Conservation (Responsible Care) Organization Chart

Kansai Paint Co., Ltd. Corporate Report 2016 17
Environmental ManagementEnvironmental Activities
Responsible Care Audit by Top Management
Management of Chemical Substances
In the responsible care audit by top management, each committee reports to the president (in his capacity as chairman of the Responsible Care Committee) and top management executives on the implementation status of activities during the fiscal year and reviews planned activities to ensure efficient and effective groupwide activities.
Many countries are adopting chemical product regulations to achieve the World Summit on Sustainable Development (WSSD) goals, including the Regulation on Registration, Evaluation, Authorisation and Restriction of Chemicals (“REACH”) in Europe. In Asia, in particular, the institution of laws and regulations governing chemicals is proceeding rapidly. Kansai Paint operates in Europe, North America, China, Taiwan, South Korea, Southeast Asia, India, and Africa. We are striving to gather information on regulations in these countries and regions through industry organizations, consulting firms, and other sources. In addition, we have already complied with Globally Harmonized System of Classification and Labelling of Chemicals (GHS) labeling on safety data sheets (SDS) in countries where GHS has been introduced. We will also proceed with GHS compliance in Thailand, Indonesia, and other countries when they introduce GHS in the future.
The committees reported on environmental regulations in Japan and overseas, safety and health initiatives, and activities to reduce harmful substances in fiscal 2015, and obtained confirmation of the ALES ECO PLAN 2018 three-year plan launched in fiscal 2016. They will now engage in activities based on this plan.
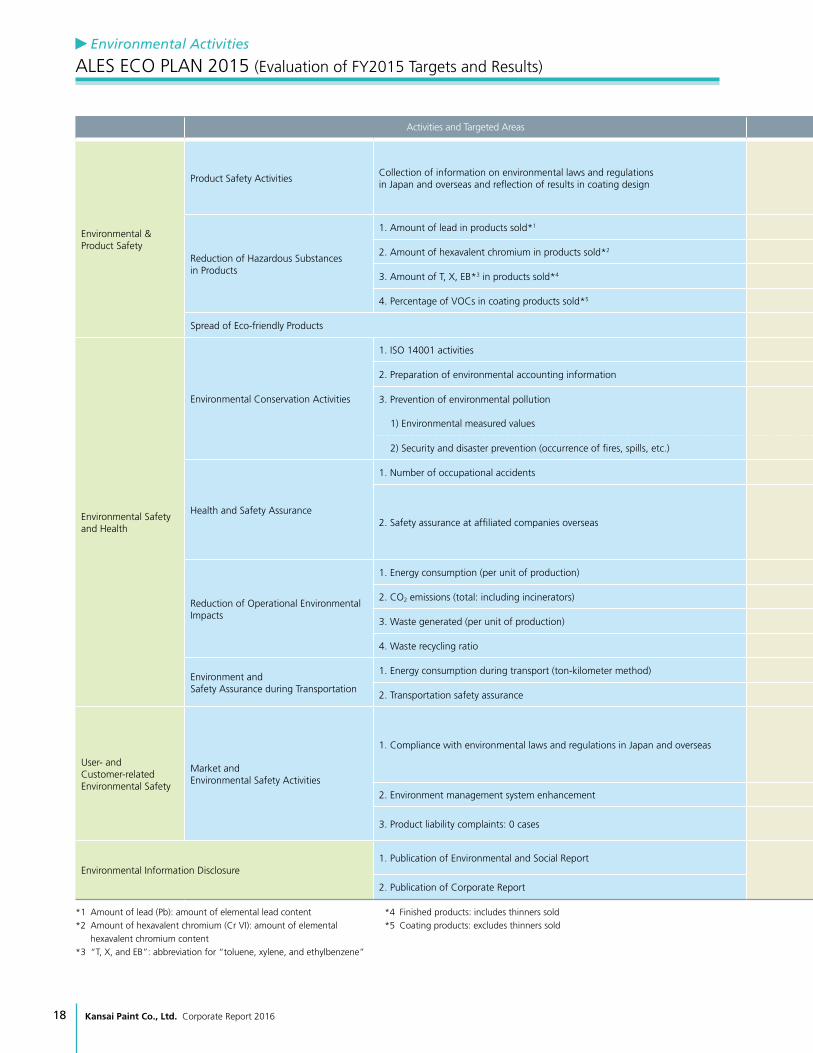
Activities and Targeted Areas Final Year (FY2015) Targets FY2015 Results Evaluation
Environmental & Product Safety
Product Safety ActivitiesCollection of information on environmental laws and regulations in Japan and overseas and reflection of results in coating design
• Maintenance of strict compliance with environmental laws and regulations in Japan
• Development of control guidelines for chemical substance control regulations prescribed by international conventions
• Responded to and complied with amended environmental laws and regulations in Japan
• Confirmed whether international conventions relating to control regulations for chemical substances subject to control exist
Target achieved
Reduction of Hazardous Substances in Products
1. Amount of lead in products sold*1 80% reduction from the FY2003 level 92% reduction from the FY2003 level Target achieved
2. Amount of hexavalent chromium in products sold*2 70% reduction from the FY2003 level 74% reduction from the FY2003 level Target achieved
3. Amount of T, X, EB*3 in products sold*4 30% reduction from the FY2003 level 32% reduction from the FY2003 level Target achieved
4. Percentage of VOCs in coating products sold*5 FY2012 results (22.8%) or lower 21.7% Target achieved
Spread of Eco-friendly Products FY2012 results (98%) or higher 98% Target achieved
Environmental Safety and Health
Environmental Conservation Activities
1. ISO 14001 activities Continued implementation Continued implementation Target achieved
2. Preparation of environmental accounting information Continued publication Continued publication Target achieved
3. Prevention of environmental pollution
1) Environmental measured values Within standard values Within standard values Target achieved
2) Security and disaster prevention (occurrence of fires, spills, etc.) 0 cases 0 cases Target achieved
Health and Safety Assurance
1. Number of occupational accidents Accidents involving loss of at least 1 workday: 0 cases Accidents involving loss of at least 1workday: 1 case Target not achieved
2. Safety assurance at affiliated companies overseasProvision of safety education to local employees simultaneously with safety diagnosis at affiliated companies overseas
• Provision of safety education in Japan to overseas employees (KNPL: 4 persons; ASEAN: 5 persons)
• Provision of safety education to local employees simultaneously with safety diagnosis in India (KNPL: 4 plants)
Target achieved
Reduction of Operational Environmental Impacts
1. Energy consumption (per unit of production) 3.0% reduction from the FY2012 level 9.0% reduction Target achieved
2. CO2 emissions (total: including incinerators) 21% reduction from the FY1990 level 31.9% reduction Target achieved
3. Waste generated (per unit of production) 3.0% reduction from the FY2012 level 16.4% reduction Target achieved
4. Waste recycling ratio Maintenance of 99% or higher Full-year average: 99.8% Target achieved
Environment and Safety Assurance during Transportation
1. Energy consumption during transport (ton-kilometer method) 5.0% reduction from the FY2011 level 13.5% reduction from the FY2011 level Target achieved
2. Transportation safety assurance Entrenchment of safe operating practices Maintenance of 100% labelling Target achieved
User- and Customer-related Environmental Safety
Market and Environmental Safety Activities
1. Compliance with environmental laws and regulations in Japan and overseas
• Entrenchment of a system for complying with environmental regulations in Japan
• Consideration and development of a system for complying with environmental regulations overseas in accordance with market developments
• Response to amendment of relevant government and ministerial ordinances (Ordinance on Prevention of Hazards due to Specified Chemical Substances, etc.)
• Response to amendment of JIS standards Implementation continuing for each item
2. Environment management system enhancement Development of required systems Revision of labelling/SDS system
3. Product liability complaints: 0 cases 0 claims related to the Product Liability LawKansai Paint, Kansai Paint Sales, NKM Coatings, Kanpe Hapio: 0 claims
Environmental Information Disclosure1. Publication of Environmental and Social Report
Continued publicationJune publication of Environmental and Social Report (Japanese) Information
disclosed as planned2. Publication of Corporate Report August publication of Corporate Report (English)
18 Kansai Paint Co., Ltd. Corporate Report 2016
ALES ECO PLAN 2015 (Evaluation of FY2015 Targets and Results)
*1 Amount of lead (Pb): amount of elemental lead content
*2 Amount of hexavalent chromium (Cr VI): amount of elemental
hexavalent chromium content
*3 “T, X, and EB”: abbreviation for “toluene, xylene, and ethylbenzene”
*4 Finished products: includes thinners sold
*5 Coating products: excludes thinners sold
Environmental Activities

Activities and Targeted Areas Final Year (FY2015) Targets FY2015 Results Evaluation
Environmental & Product Safety
Product Safety ActivitiesCollection of information on environmental laws and regulations in Japan and overseas and reflection of results in coating design
• Maintenance of strict compliance with environmental laws and regulations in Japan
• Development of control guidelines for chemical substance control regulations prescribed by international conventions
• Responded to and complied with amended environmental laws and regulations in Japan
• Confirmed whether international conventions relating to control regulations for chemical substances subject to control exist
Target achieved
Reduction of Hazardous Substances in Products
1. Amount of lead in products sold*1 80% reduction from the FY2003 level 92% reduction from the FY2003 level Target achieved
2. Amount of hexavalent chromium in products sold*2 70% reduction from the FY2003 level 74% reduction from the FY2003 level Target achieved
3. Amount of T, X, EB*3 in products sold*4 30% reduction from the FY2003 level 32% reduction from the FY2003 level Target achieved
4. Percentage of VOCs in coating products sold*5 FY2012 results (22.8%) or lower 21.7% Target achieved
Spread of Eco-friendly Products FY2012 results (98%) or higher 98% Target achieved
Environmental Safety and Health
Environmental Conservation Activities
1. ISO 14001 activities Continued implementation Continued implementation Target achieved
2. Preparation of environmental accounting information Continued publication Continued publication Target achieved
3. Prevention of environmental pollution
1) Environmental measured values Within standard values Within standard values Target achieved
2) Security and disaster prevention (occurrence of fires, spills, etc.) 0 cases 0 cases Target achieved
Health and Safety Assurance
1. Number of occupational accidents Accidents involving loss of at least 1 workday: 0 cases Accidents involving loss of at least 1workday: 1 case Target not achieved
2. Safety assurance at affiliated companies overseasProvision of safety education to local employees simultaneously with safety diagnosis at affiliated companies overseas
• Provision of safety education in Japan to overseas employees (KNPL: 4 persons; ASEAN: 5 persons)
• Provision of safety education to local employees simultaneously with safety diagnosis in India (KNPL: 4 plants)
Target achieved
Reduction of Operational Environmental Impacts
1. Energy consumption (per unit of production) 3.0% reduction from the FY2012 level 9.0% reduction Target achieved
2. CO2 emissions (total: including incinerators) 21% reduction from the FY1990 level 31.9% reduction Target achieved
3. Waste generated (per unit of production) 3.0% reduction from the FY2012 level 16.4% reduction Target achieved
4. Waste recycling ratio Maintenance of 99% or higher Full-year average: 99.8% Target achieved
Environment and Safety Assurance during Transportation
1. Energy consumption during transport (ton-kilometer method) 5.0% reduction from the FY2011 level 13.5% reduction from the FY2011 level Target achieved
2. Transportation safety assurance Entrenchment of safe operating practices Maintenance of 100% labelling Target achieved
User- and Customer-related Environmental Safety
Market and Environmental Safety Activities
1. Compliance with environmental laws and regulations in Japan and overseas
• Entrenchment of a system for complying with environmental regulations in Japan
• Consideration and development of a system for complying with environmental regulations overseas in accordance with market developments
• Response to amendment of relevant government and ministerial ordinances (Ordinance on Prevention of Hazards due to Specified Chemical Substances, etc.)
• Response to amendment of JIS standards Implementation continuing for each item
2. Environment management system enhancement Development of required systems Revision of labelling/SDS system
3. Product liability complaints: 0 cases 0 claims related to the Product Liability LawKansai Paint, Kansai Paint Sales, NKM Coatings, Kanpe Hapio: 0 claims
Environmental Information Disclosure1. Publication of Environmental and Social Report
Continued publicationJune publication of Environmental and Social Report (Japanese) Information
disclosed as planned2. Publication of Corporate Report August publication of Corporate Report (English)
Kansai Paint Co., Ltd. Corporate Report 2016 19
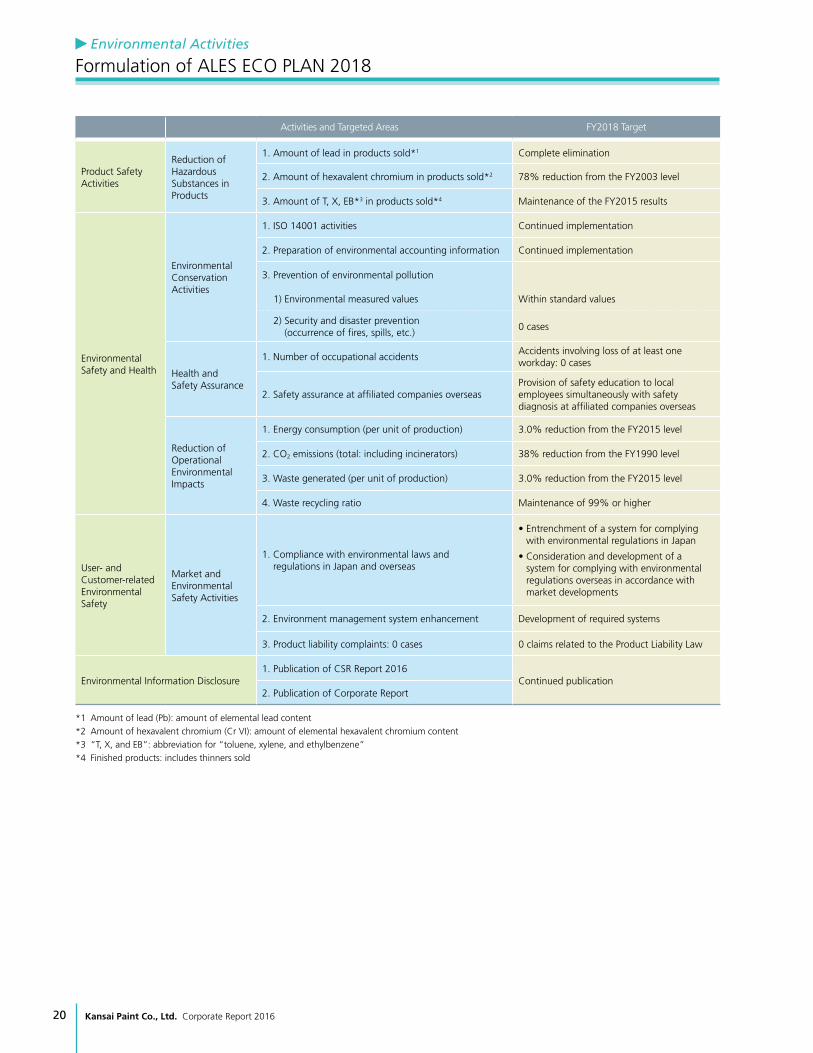
Activities and Targeted Areas FY2018 Target
Product Safety Activities
Reduction of Hazardous Substances in Products
1. Amount of lead in products sold*1 Complete elimination
2. Amount of hexavalent chromium in products sold*2 78% reduction from the FY2003 level
3. Amount of T, X, EB*3 in products sold*4 Maintenance of the FY2015 results
Environmental Safety and Health
Environmental Conservation Activities
1. ISO 14001 activities Continued implementation
2. Preparation of environmental accounting information Continued implementation
3. Prevention of environmental pollution
1) Environmental measured values Within standard values
2) Security and disaster prevention (occurrence of fires, spills, etc.)
0 cases
Health and Safety Assurance
1. Number of occupational accidentsAccidents involving loss of at least one workday: 0 cases
2. Safety assurance at affiliated companies overseasProvision of safety education to local employees simultaneously with safety diagnosis at affiliated companies overseas
Reduction of Operational Environmental Impacts
1. Energy consumption (per unit of production) 3.0% reduction from the FY2015 level
2. CO2 emissions (total: including incinerators) 38% reduction from the FY1990 level
3. Waste generated (per unit of production) 3.0% reduction from the FY2015 level
4. Waste recycling ratio Maintenance of 99% or higher
User- and Customer-related Environmental Safety
Market and Environmental Safety Activities
1. Compliance with environmental laws and regulations in Japan and overseas
• Entrenchment of a system for complying with environmental regulations in Japan
• Consideration and development of a system for complying with environmental regulations overseas in accordance with market developments
2. Environment management system enhancement Development of required systems
3. Product liability complaints: 0 cases 0 claims related to the Product Liability Law
Environmental Information Disclosure1. Publication of CSR Report 2016
Continued publication2. Publication of Corporate Report
20 Kansai Paint Co., Ltd. Corporate Report 2016
Formulation of ALES ECO PLAN 2018Environmental Activities
*1 Amount of lead (Pb): amount of elemental lead content
*2 Amount of hexavalent chromium (Cr VI): amount of elemental hexavalent chromium content
*3 “T, X, and EB”: abbreviation for “toluene, xylene, and ethylbenzene”
*4 Finished products: includes thinners sold

Kansai Paint Co., Ltd. Corporate Report 2016 21
Green Procurement and Supply Chain Management
Supply Chain Management
Green Procurement
Kansai Paint requests raw materials producers to engage in rigorous management of harmful substances and meet the requirements of customers.
Green purchasing refers to the prioritized selection and purchasing of products and services with low environmental impacts, not solely on the basis of quality and price. The practice is based on the Act on Promoting Green Purchasing,
enacted in April 2001. Kansai Paint, together with Group companies in Japan, promotes the purchasing of office supplies and other Eco Mark certified products and goods that comply with the Act on Promoting Green Purchasing.
Green procurement refers to the selection and procurement of materials for containers, wrappings, parts, and raw materials that are environmentally friendly. The corporate philosophy of the Kansai Paint Group is to “Conserve resources and protect the environment to build and sustain an affluent society,” and we have implemented a strict system for managing materials procurement.
Kansai Paint procurement policies• Kansai Paint promises to conduct fair and impartial business
transactions in accordance with a legal mindset.• Kansai Paint maintains a wide open door for business
transactions, both in Japan and abroad.• In the spirit of green procurement, Kansai Paint gives
preference to business partners that have established environmental management systems.
• Kansai Paint creates fair cooperative relationships based on an equal footing with business partners and strives to continuously enhance partnerships.
Classifications of materials usedKansai Paint discloses to business partners the raw materials management classifications established in accordance with hazardous properties using the Kansai Paint Environmental Management Substances List and other means and strives to obtain raw materials with low environmental impacts.
Green Purchasing
Environmental Activities
Banned Raw Materials
Materials containing more than a defined amount of banned substances whose use is prohibited regardless of the reason.
Restricted Raw Materials
Raw materials containing more than a defined amount of restricted substances whose use is reduced or limited to certain applications.
Dangerous and Hazardous Raw Materials
Raw materials containing more than a defined amount of dangerous or hazardous substances whose use is subject to more rigorous manage-ment than general raw materials.
Regular Raw Materials
Raw materials whose use is subject to normal management.
Supplier greenness survey
Kansai Paint continuously ascertains the greenness of raw materials producers from whom we have purchased a certain threshold amount through confirmation of ISO 14001 certification status.
Raw materials management
When exporting to countries requiring compliance with the End-of Life Vehicles (ELV) Directive, Restricting the use of Hazardous Substances (RoHS) Directive, and other regulations, we are required to submit documents such as certificates of non-use of harmful substances in paints. We request raw materials producers to strictly control harmful substances in raw materials used in specific applications and obtain certificates of non-use of controlled substances or evidence of non-inclusion as necessary.
Environmental conservation
When outsourcing work that may have a signifi-cant impact on the environment to shipping companies, waste disposal companies, and other contractors, we communicate work procedures and requirements and request their cooperation in reducing the occurrence of accidents and mistakes and environmental conservation.

22 Kansai Paint Co., Ltd. Corporate Report 2016
Management of Chemical Substances
Amount of lead contained in products sold(relative amount with FY2003 taken as 100)We are reducing the amount of lead compounds used in products, using “Amount of Lead Contained in Products Sold” as a performance index. In FY2015, we discontinued products that use coloring pigments containing lead or chromium or found substitute pigments. The amount of lead compounds in products sold in FY2015 was 8% of the FY2003 level, and the reduction rate of 92% was higher than the reduction target in ALES ECO PLAN 2015. The Japan Paint Manufacturers Association (JPMA) has issued a declaration regarding the elimination of pigments
containing lead. In line with the JPMA declaration, we will continue to reduce the amount of lead compounds in order to completely eliminate them by FY2018.
Amount of hexavalent chromium contained in products sold (relative amount with FY2003 taken as 100)We are reducing the amount of hexavalent chromium compounds used in products, using “Amount of Hexavalent Chromium Contained in Products Sold” as a performance index. We have made progress in eliminating or finding substitutes for some coloring pigments and anticorrosive pigments that contain lead or chromium. The amount of hexavalent chromium compounds in products sold in FY2015 was 26% of the FY2003 level, and the reduction rate of 74% was higher than the reduction target in ALES ECO PLAN 2015. Although anticorrosive pigments that contain hexavalent chromium are mainly used for applications that require long-
term durability and their reduction entails other issues, such as the need to confirm durability, we will continue to develop and offer alternative products and reduce the use of hexavalent chromium.
Toluene, xylene and ethylbenzene contained in products sold (relative amount with FY2003 taken as 100)We are continuously reducing the amount of toluene, xylene, and ethylbenzene (hereafter, T, X, and EB) in our products. We have transitioned from solvent-based coatings to waterborne coatings, substituted less hazardous alternative solvents for T, X, and EB, and developed a market for coatings that do not contain PRTR substances. Nevertheless, the amount of T, X, and EB in products sold in FY2015 was 68% of the FY2003 level, and the reduction rate of 32% was nearly the same as in fiscal 2014, because of growth in sales volumes of some solvent-based antifouling and anticorrosive paints. We will continue to develop products that use alternative
solvents and continuously reduce the amount of T, X, and EB in products sold.
VOC percentage contained in coating products soldIn ALES ECO PLAN 2015, we set a target of maintaining the VOC percentage contained in coating products sold at the FY2012 level of 22.8%. The VOC percentage in FY2015 was 21.7%, less than the FY2012 level, and we achieved our target. We will continue to develop the market for waterborne paint products, high-solid paints, and other low-VOC products and strive to prevent VOC levels from increasing.
20
40
60
80
100
2014201320122011200920072003FY
(%)100
48
75
31 29 2410
2015
8
• Change in the Amount of Lead in Products Sold
20
40
60
80
100
2014201320122011200920072003
(%)100
47
66
36 33 34 30
2015
26
FY
• Change in the Amount of Hexavalent Chromium in Products Sold
• Change in the Amount of T, X, and EB in Coating and Thinner Products Sold
• Change in the Percentage of VOCs in Paint Products Sold
Environmental Activities
(%)
40
20
60
80
100
20142013201220112007 20092003
100
72
97
76 73 71 68
2015
68
FY
(%)
10
20
30
2014201320122011200920072003
24.422.5 22.5 22.4 22.8 22.7 22.6
2015
21.7
FY

(t-CO2)
Total CO2 emissionsin production division
Total CO2 emissionsin technology division
2014 2015201320122011
10,000
20,000
30,000
40,000
30,900 30,400
25,700
32,100
27,000
FY
11,70012,300 12,200 12,900 12,000
Total energyconsumption
in production division
Total energyconsumption
in technology division
533
640 620 624575
(106MJ)
2014201320122011 2015
100
200
300
500
600
700
400257266 262 277 260
FY
(t-CO2)
100
200
300
2014201320122011 2015FY
CO2 emissions per production unit
144 144 135 129 127
(106MJ)
Energy consumptionper production unit
2014201320122011 2015
2,000
2,500
3,000
3,500
FY
2,6302,870 2,890
2,760 2,750
(t)
4
8
12
2014201320122011
0.5
10.5
0.06 0.5
7.7
0.09 0.4
5.6
0.02 0.4
3.5
0.0012015
1.5
3.4
0.02
SOx
NOx
Dust
FY
Kansai Paint Co., Ltd. Corporate Report 2016 23
Environmental Conservation Activities
Reduction of CO2 Emissions
Energy Conservation
Air Pollution Control at Production Plants
In FY2015, the amount of carbon dioxide emitted by the production division was sharply reduced to 25,700 tons as a result of two factors: a 2.8% decline in production volume from the FY2014 level due to reorganization of the Amagasaki
Plant and the installation of cogeneration facilities at the Hiratsuka Plant. CO2 emissions per unit of output were 127 kg-CO2/ton, down 1.6% from the FY2014 level.
The amount of energy used by the production division in FY2015 decreased by approximately 7.3% from the FY2014 level, resulting in a decrease of 5.4% in energy consumption per production unit from the FY2014 level. This result is
attributable to power-saving measures taken at worksites and the practice of more efficient production methods. We intend to continue engaging in energy conservation activities.
• Change in CO2 Emissions by Division
• Change in Energy Consumption by Division
• Change in SOx, NOx, and Dust Emissions Sulfur oxides (SOx)Sulfur oxides are generated when fuels such as heavy oil and kerosene and waste materials that contain sulfur are burned. SOx comprise sulfur dioxide and small amounts of sulfur trioxide.
Nitrogen oxides (NOx)Nitrogen oxides are contained in exhaust gases from boilers, incinerators, trucks, and other equipment. NOx comprise nitrogen monoxide, nitrogen dioxide, and other gases.
DustDust is defined in the Air Pollution Control Law as particulate matter comprising soot and cinders that is generated accompanying the combustion of fuels and other materials or the use of electricity as a heat source.
• Change in CO2 Emissions per Production Unit
• Change in Energy Consumption per Production Unit
Environmental Activities

(t)
24,20023,040 23,150
20,290
Amount of generatedindustrial waste
18,000
22,000
26,000
2014201320122011
18,260
2015FY
Final landfill disposal0.0%
FY2015 Reuse 67.8%
Sale21.4%
External recycling10.7%
Amount of waste generated18,260 tons
External intermediate processing0.2%
Environmental Activities
24 Kansai Paint Co., Ltd. Corporate Report 2016
Water Resource Reduction and Water Pollution Prevention
Waste Reduction Initiatives
Water pollution prevention at production plantsThe amount of COD discharge, an indicator of the amount of water pollutants discharged, decreased by approximately 5.4% from the FY2014 level in FY2015. The decrease is attributable to a review of wastewater treatment plant management methods at each production plant, which stabilized the quality of treated water. Kansai Paint will continue efforts to prevent water pollution by strengthening plant management to ensure that wastewater treatment plants operate appropriately.
Water conservation at production plantsWater usage in FY2015 decreased by approximately 15.7% from the FY2014 level, and water usage per unit of production also decreased by 13.1%, as a result of a decline in production volume. Kansai Paint will continue efforts to efficiently use water resources as cooling water and boiler steam water.
Kansai Paint launched a company-wide waste reduction team in 1999 to contribute to the creation of a recycling-oriented society by promoting the “3Rs” of industrial waste: reducing the generation of industrial waste (Reduce), recycling of waste that is generated (Recycle), and reusing materials (Reuse). As a result of efforts to achieve zero emissions of industrial waste generated through production activities, the production division has maintained zero emissions since FY2005 and achieved a high recycling rate of 99.8% in FY2015. Reorganization of the Amagasaki Plant contributed to a reduction of approximately 21% from the FY2013 level in the amount of industrial waste generated in FY2015.
Environmental Conservation Activities
(103m3)
200
400
600
800
2014201320122011
298 282 265 261
288
88
284
105
308
88
318
91
707 678 654 638
2015
195
289
53
537
Tap water
Groundwater
Industrialwater
FY
• Change in Water Usage
(L /kg)
1.00
2.00
3.00
5.00
4.00
2014201320122011 2015
2.653.17 3.17
2.89 3.05
FY
• Change in Water Usage per Unit of Production
• Change in the Amount of Industrial Waste Generated (Production Division)
• Breakdown of Waste Recycling and Amount of Waste Generated
(t)
1.00
2.00
3.00
2014201320122011 2015
0.88
1.98
0.93
1.801.86
FY
• Change in the Amount of COD Discharge
Recycling rate =
The Kansai Paint Group’s definition of zero emissions:A state of zero emissions is achieved when the annual recycling rate is 99% or higher.
(Reuse + Sell + Recycle externally) x 100
Amount of waste generated

Kansai Paint Co., Ltd. Corporate Report 2016 25
SocialActivities26 Occupational Safety and Health
28 Treatment of Employees
29 Consumer Protection
30 Social Action Programs
26 Kansai Paint Co., Ltd. Corporate Report 2016
Safety Initiatives at Overseas Affiliates
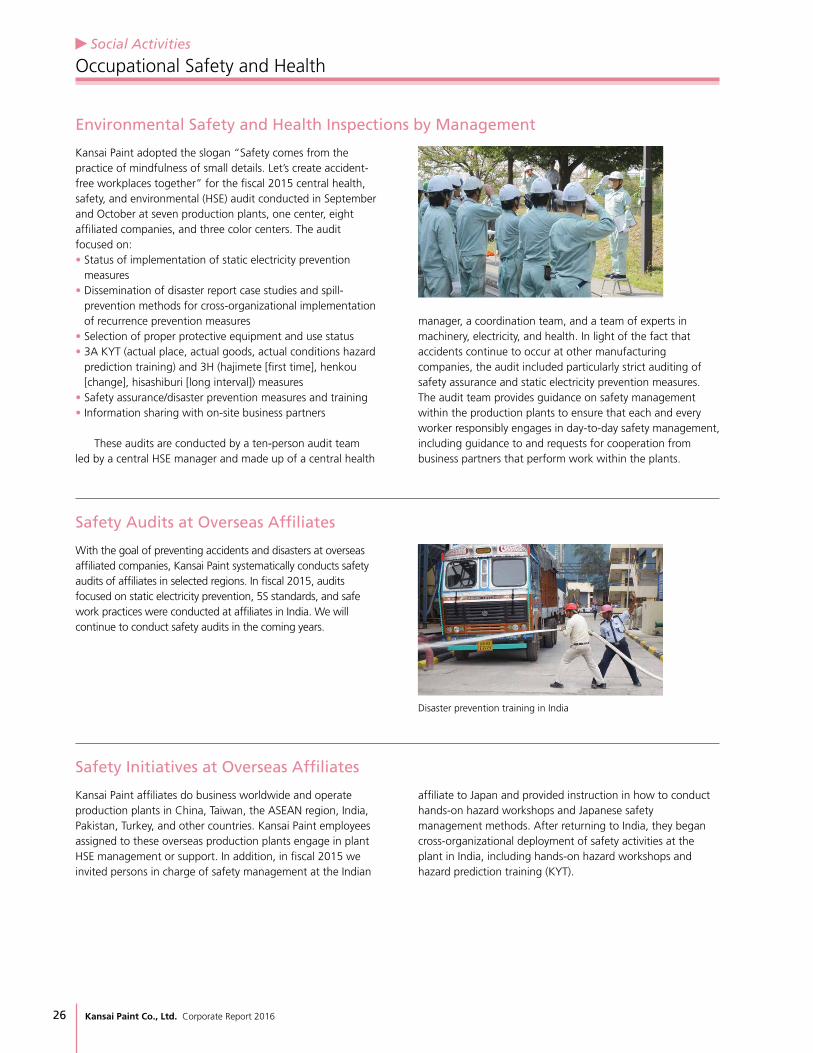
Kansai Paint adopted the slogan “Safety comes from the practice of mindfulness of small details. Let’s create accident-free workplaces together” for the fiscal 2015 central health, safety, and environmental (HSE) audit conducted in September and October at seven production plants, one center, eight affiliated companies, and three color centers. The audit focused on:• Status of implementation of static electricity prevention
measures • Dissemination of disaster report case studies and spill-
prevention methods for cross-organizational implementation of recurrence prevention measures
• Selection of proper protective equipment and use status• 3A KYT (actual place, actual goods, actual conditions hazard
prediction training) and 3H (hajimete [first time], henkou [change], hisashiburi [long interval]) measures
• Safety assurance/disaster prevention measures and training• Information sharing with on-site business partners
These audits are conducted by a ten-person audit team led by a central HSE manager and made up of a central health
manager, a coordination team, and a team of experts in machinery, electricity, and health. In light of the fact that accidents continue to occur at other manufacturing companies, the audit included particularly strict auditing of safety assurance and static electricity prevention measures. The audit team provides guidance on safety management within the production plants to ensure that each and every worker responsibly engages in day-to-day safety management, including guidance to and requests for cooperation from business partners that perform work within the plants.
With the goal of preventing accidents and disasters at overseas affiliated companies, Kansai Paint systematically conducts safety audits of affiliates in selected regions. In fiscal 2015, audits focused on static electricity prevention, 5S standards, and safe work practices were conducted at affiliates in India. We will continue to conduct safety audits in the coming years.
Kansai Paint affiliates do business worldwide and operate production plants in China, Taiwan, the ASEAN region, India, Pakistan, Turkey, and other countries. Kansai Paint employees assigned to these overseas production plants engage in plant HSE management or support. In addition, in fiscal 2015 we invited persons in charge of safety management at the Indian
Occupational Safety and HealthSocial Activities
Environmental Safety and Health Inspections by Management
Safety Audits at Overseas Affiliates
Disaster prevention training in India
affiliate to Japan and provided instruction in how to conduct hands-on hazard workshops and Japanese safety management methods. After returning to India, they began cross-organizational deployment of safety activities at the plant in India, including hands-on hazard workshops and hazard prediction training (KYT).

Kansai Paint Co., Ltd. Corporate Report 2016 27
Occupational Safety and Health Activities
Health Management
Kansai Paint conducts various activities each year with the goal of eliminating accidents and disasters. All Group employees participate in a comprehensive safety inspection conducted in July. During September and October, senior management conducts a central health, safety, and environmental (HSE) audit at 19 plants. Safety audits are conducted every year at 33 color centers nationwide and once every 2 to 3 years at overseas plants. In addition, we strive to inculcate safe work practices by means including hazard prediction training that covers non-routine work and cross-organizational information dissemination at zero accident presentations. Following a decrease in the number of accidents resulting in no loss of workdays in fiscal 2014, which reversed an uptrend, the number regrettably increased year on year in fiscal 2015, and an accident resulting in loss of workdays occurred as well. We will further energize safety activities and strive to prevent accidents by means such as raising safety awareness and increasing the hazard sensitivity of each employee.
The Health and Hygiene Subcommittee was established within the Environment Safety and Health Committee as a dedicated organization that engages in health management for employees of Kansai Paint and affiliated companies. In fiscal 2015, it worked to improve mental health care for employees, mainly through Employee Assistance Program (EAP) services, in accordance with the Mental Health Promotion Plan.
Mental health care and follow-up after periodic health examinations• In fiscal 2015, the following mental health training was
conducted.
Trainees Training content
New employees Self-care
Newly appointed supervisors Line care and self-care
Employees newly transferred overseas Self-care
Serving supervisors Line care and self-care
Mid-career employees Self-care
• In mental health training for newly appointed and serving supervisors, case studies were used to confirm the duty of care and the role of supervisors in mental health support and promote understanding of things to bear in mind in the workplace, and introduced communication techniques beneficial in team member support as well as methods of overcoming crises.
• Ahead of an amendment to the Industrial Safety and Health Act mandating that employers conduct stress checks for employees, Kansai Paint conducted stress check tests and followed up by means including EAP counseling.
• Kansai Paint periodically holds training seminars in each region to deepen employee understanding of mental health care and lifestyle-related diseases. We have also instituted a system for following up on employees diagnosed with medical conditions after periodic health examinations and are striving to maintain and promote the health of employees.
Mental Health Training (Nagoya Office)
5
107
99
4
12
001
01
5 5
3
67
4
Minor injuriesNumber of industrial accidents
2014201320122011201020092008200720062005
5
1 1 1
7
2015
Lost-work injuries
FY
• Change in the Number of Occupational Accidents
Frequency ratio
2014201320122011201020092008200720062005
(number of victims) / Total man-hours) × 1,000,000Frequency ratio for accidents = (Lost-work accidents
1.4
0.7
1.20
0.30 0.28 0.29
0.00 0.00
0.29
0.00
0.30
2015
0.300.56
FY
• Change in the Frequency of Occupational Accidents
Severity
2014201320122011201020092008200720062005
0.1
0.03 0.01 0.02 0.01 0.00 0.00 0.01 0.00 0.00
0.2
2.5
Severity = (Lost-work days / Total man-hours) × 1,000
2015
0.00
2.29
FY
• Change in the Severity of Occupational Accidents

Training for Top Management
Training for Supervisors
Training for New Employees (Practice Teaching)
Occupational Training
Selective Training
Training for Middle Management
Training for Mid-Career Employees
Outside Seminars
Function-Specific Training
Common Training (QC, Safety, etc.)
Internationalization Training
OJT (Educational
Fundamentals)
Social Activities
28 Kansai Paint Co., Ltd. Corporate Report 2016
Human Resource Development and Training
Equal Opportunities for Women and Men
Employment of Persons with Disabilities
Addressing Human Rights Issues
Benefits Program
Kansai Paint is enhancing the human resource development plan with the aim of increasing motivation, the most important factor in human development.
Human resource development concept and structureKansai Paint has defined five themes as key pillars of the human resource development plan: assistance with self-development, a long-term human resource development plan, expansion of professional duties, transformation of organizational culture, and a training system.
Systematically organized training systemAs shown in the diagram, the Kansai Paint training system is systematically organized in matrix form, with various types of training centered on OJT (on-the-job training) corresponding to training objectives and levels. The objective is to enhance the specialized skills of employees and foster their overall competency as professionals.
Kansai Paint is steadily implementing the principles codified in the Equal Employment Opportunity Law of Japan. We have incorporated maternal protection measures for female employees in the Rules of Employment and recognize a wide
range of rights of female workers. Moreover, there is no difference between men and women in terms of pay and benefits and no difference in treatment on the basis of gender. We also actively promote female managers.
Kansai Paint creates workplace environments that enable persons with disabilities to play an active role in each occupational category and strives to expand employment opportunities through year-round recruitment. In FY2015, the
employment rate of persons with disabilities was 1.68%, below the legal quota of 2.0%. We will continue to actively pursue improvement efforts.
Kansai Paint places importance on individual lifestyles and pursues individuality. Our benefit program includes annual paid holidays, special paid holidays, accumulated paid holidays (used for nursing care, volunteer work, and sick leave), and refreshment holidays. In addition, to promote utilization of paid holidays, we enable employees to take up to 28 half-day paid holidays per year (amounting to 14 workdays).
We provide support to enable employees with children to balance work and childrearing, such as childcare leave, a short-time working system available until children enter elementary school, and the provision of childcare subsidy vouchers for temporary childcare.
Treatment of Employees
In keeping with the fundamental principle that a company exists for the happiness of people and society, the Kansai Paint Group strives to maintain wholesome working environments where people are free from harassment or discrimination because of race, nationality, age, gender, religious beliefs, lineage, physical handicap, or any other reason. To uphold this
principle, we undertake to raise employee awareness of human rights through various forms of training. In fiscal 2015, more than 1,000 entries were submitted in an annual slogan contest held in accordance with Human Rights Week in December.

Social Activities
Kansai Paint Co., Ltd. Corporate Report 2016 29
Safety Information
The incorrect use of even a safe product can lead to an accident. Kansai Paint strives to ensure the safe use of products by providing precautions and other necessary
information in safety data sheets (SDS), product catalogs, technical materials, and container labels.
Main applicable laws and regulations
• Industrial Safety and Health Act
• Poisonous and Deleterious Substances Control Act
• Law concerning Pollutant Release and Transfer Register
• Chemical Substances Control Law
• Fire Service Act
Advance understanding of hazard information (SDS)
Risk assessment, safe handling and use (customers, users, etc.)
Prevention of accidents and disasters
Implementation of Safety Data Sheets
To ensure product safety for consumers, when developing markets for new products and using new materials, the Kansai Paint Group conducts investigations based on internal regulations relating to safety confirmation and supplies safe products to customers. The provision of safer products has the added benefit of contributing to improvement in working environments at paint manufacturers.
To ensure the safe use of paints and prevent accidents, Kansai Paint provides information on the hazardous properties of products and handling precautions by preparing safety data sheets (SDS) and labels that comply with Japan Paint Manufacturers Association guidelines and applicable laws and regulations. We will promptly revise the content of SDS and labels in
response to amendments to applicable laws and regulations and guidelines and will review the content as necessary to assure appropriate information for safe use. The number of countries introducing the Globally Harmonized System of Classification and Labelling of Chemicals (GHS) in SDS and labels is increasing, and we are responding in collaboration with local affiliates.
Implementation of GHS, Labelling and Safety Data Sheets
Consumer Protection
Policy
Consumer Protection
• Ship Safety Act
• Marine Pollution Prevention Act
• Air Pollution Control Act
• Offensive Odor Control Law
• Ozone Layer Protection Law

Social Activities
30 Kansai Paint Co., Ltd. Corporate Report 2016
Amagasaki Plant—Operation Ama Chari 3K
Beginning September 1, 2015, Amagasaki Higashi Police Station conducted Operation Ama Chari 3K*, a campaign to eliminate bicycle-related injuries and damage within its jurisdiction, including at Kansai Paint facilities. In fiscal 2015, the Amagasaki Plant became the first company to be designated and appointed by Amagasaki Higashi Police Station as a model of best practices for this activity. During the campaign period, the plant used the intranet, posters, and other media to urge employees to prevent bicycle-related injuries, damage, and accidents. In recognition of these activities, the Amagasaki Plant received a certificate of appreciation from Amagasaki Higashi Police Station at an award ceremony held at the police station on February 5, 2016.* Kagi (lock): use two or more, Kago (basket): cover the basket, and Koutsuu jiko boushi (traffic accident prevention): obey traffic rules.
The Kansai Paint Group actively engages in promotional activities in Japan and overseas to introduce and deepen understanding of the Group’s products and technologies. We reach people of all ages around the world through activities centered on the official global partnership with the English football team Manchester United, and in Japan through events and promotions featuring our mascot Shiquy-maru. In 2015, focusing on the recent surge in popularity of DIY among women, we formed the KP Women’s Paint Team, made up of female employees, for the purpose of publicizing the appeal of paint and painting to large numbers of women. The team helps women discover how fun it is to paint by painting facilities at Kansai Paint and at other companies and organizations.
At the 63rd Hyogo Prefecture Rehabilitation Congress, held at Sanda Culture Center in Sanda City, Hyogo Prefecture, organizations and individuals recognized for their offender rehabilitation efforts received awards in various categories. The Amagasaki Plant received a certificate of appreciation from the governor of Hyogo Prefecture in recognition of its ambitious activities in the Ministry of Justice’s “Toward a Bright Society” movement.
Engagement with Customers
Amagasaki Plant Awarded a Certificate of Appreciation by the Governor of Hyogo Prefecture
Social Action Programs
A KP Women’s Paint Team event held in collaboration with Osaka Prefecture
The certificate of appreciation award ceremony at Amagasaki Higashi Police Station (February 9 morning edition of the Yomiuri Shimbun)
FinancialSection32 Consolidated Balance Sheets
34 Consolidated Statements of Income
34 Consolidated Statements of Comprehensive Income
35 Consolidated Statements of Changes in Net Assets
36 Consolidated Statements of Cash Flows
37 Notes to Consolidated Financial Statements
60 Independent Auditor’s Report
31Kansai Paint Co., Ltd. Corporate Report 2016

See accompanying notes.
Kansai Paint Co., Ltd. and Consolidated SubsidiariesMarch 31, 2016 and 2015
Millions of yenThousands of
U.S. dollars (Note 1)
Assets 2016 2015 2016Current assets:
Cash and deposits (Notes 2, 3, 6 and 11) ¥ 72,309 ¥ 68,869 $ 641,720 Receivables (Note 3):
Trade notes and accounts:Unconsolidated subsidiaries and affiliates 11,801 12,665 104,730 Other 79,743 79,511 707,694
Securities (Notes 3 and 4) 8,536 — 75,754 Loans (Note 3) 1,174 634 10,419 Other 2,774 2,846 24,619 Allowance for doubtful receivables (1,222) (807) (10,845)
Total 102,806 94,849 912,371
Inventories:Finished goods 25,768 26,767 228,683 Work-in-process 3,729 4,434 33,094 Raw materials and supplies 13,677 14,246 121,379
Total 43,174 45,447 383,156
Deferred tax assets (Note 13) 2,820 2,553 25,027 Other current assets (Note 3) 4,123 3,150 36,590
Total current assets 225,232 214,868 1,998,864
Property, plant and equipment (Note 6):Land 17,638 17,872 156,532 Buildings, machinery and equipment 216,078 223,603 1,917,625 Construction in progress 3,295 2,893 29,242
Total 237,011 244,368 2,103,399 Accumulated depreciation (146,987) (147,432) (1,304,464)
Net property, plant and equipment 90,024 96,936 798,935
Investments and other assets:Investments in and loans to unconsolidated subsidiaries and affiliates 33,571 29,970 297,932 Investment securities (Notes 3, 4 and 6) 50,630 67,040 449,326 Loans receivable (Note 3) 65 102 577 Net defined benefit asset (Note 12) 6,782 10,565 60,188 Deferred tax assets (Note 13) 2,074 2,186 18,406 Other 4,487 4,544 39,821 Allowance for doubtful receivables (2,121) (2,313) (18,823)
Total investments and other assets 95,488 112,094 847,427
Intangible assets:Goodwill 7,657 11,265 67,953 Other intangible assets 11,797 12,922 104,695
Total intangible assets 19,454 24,187 172,648
Total assets ¥430,198 ¥448,085 $3,817,874
Consolidated Balance Sheets
32 Kansai Paint Co., Ltd. Corporate Report 2016

See accompanying notes.
Millions of yenThousands of
U.S. dollars (Note 1)
Liabilities and Net Assets 2016 2015 2016Current liabilities:
Short-term borrowings (Notes 3 and 5) ¥ 3,987 ¥ 3,550 $ 35,383 Current portion of long-term debt (Notes 3 and 5) 16,616 28 147,462 Payables (Note 3):
Trade notes and accounts:Unconsolidated subsidiaries and affiliates 1,784 1,396 15,832 Other 53,226 54,882 472,364
Other 5,533 6,719 49,104 Total 60,543 62,997 537,300
Income and enterprise taxes payable 3,631 3,557 32,224 Accrued expenses 12,401 11,866 110,055 Deferred tax liabilities (Note 13) 39 81 346 Other current liabilities 4,794 4,643 42,546
Total current liabilities 102,011 86,722 905,316
Non-current liabilities:Long-term debt (Notes 3 and 5) 2,211 19,451 19,622 Retirement benefits for directors and corporate auditors 156 157 1,385 Net defined benefit liability (Note 12) 8,503 7,497 75,461 Deferred tax liabilities (Note 13) 21,833 28,563 193,761 Other long-term liabilities 1,581 2,068 14,031
Total non-current liabilities 34,284 57,736 304,260
Net assets (Note 9):Shareholders’ equity:
Common stock: Authorized—793,496,000 shares in 2016 and 2015 Issued—272,623,270 shares in 2016 and 2015 25,659 25,659 227,716 Capital surplus 18,896 27,154 167,696 Retained earnings 200,096 176,296 1,775,790 Treasury stock, at cost: 6,268,153 shares in 2016 6,249,758 shares in 2015 (5,077) (5,035) (45,057)
Total shareholders’ equity 239,574 224,074 2,126,145
Accumulated other comprehensive income:Net unrealized holding gains on securities 25,424 33,986 225,630 Foreign currency translation adjustments (10,545) 2,328 (93,584)Remeasurements of defined benefit plans 785 4,859 6,967
Total accumulated other comprehensive income 15,664 41,173 139,013
Non-controlling interests 38,665 38,380 343,140 Total net assets 293,903 303,627 2,608,298
Total liabilities and net assets ¥430,198 ¥448,085 $3,817,874
Kansai Paint Co., Ltd. Corporate Report 2016 33

Kansai Paint Co., Ltd. and Consolidated SubsidiariesYears ended March 31, 2016 and 2015
Millions of yenThousands of
U.S. dollars (Note 1)
2016 2015 2016Net sales ¥328,119 ¥349,334 $2,911,954 Cost of sales 219,978 242,080 1,952,236 Selling, general and administrative expenses 73,369 75,674 651,127 Operating income 34,772 31,580 308,591
Other income (expenses):Interest and dividend income 2,482 2,459 22,027 Interest expense (1,049) (1,341) (9,310)Gain (loss) on sale of securities and investment securities, net (74) 92 (657)Write-down of securities and investment securities — (563) —Loss on disposal of inventories (284) (232) (2,520)Gain (loss) on sale or disposal of property, plant and equipment, net 7,908 (373) 70,181 Foreign currency exchange gain (loss) (545) 772 (4,837)Equity in earnings of unconsolidated subsidiaries and affiliates 4,084 4,184 36,244 Other, net 137 289 1,216
Other income (expenses), net 12,659 5,287 112,344 Income before income taxes and non-controlling interests 47,431 36,867 420,935
Income taxes (Note 13):Current 11,662 11,567 103,497 Deferred 255 155 2,263
Total income taxes 11,917 11,722 105,760
Net income attributable to non-controlling interests (7,170) (4,736) (63,631)Net income attributable to owners of the parent ¥ 28,344 ¥ 20,409 $ 251,544
Yen U.S. dollars (Note 1)
2016 2015 2016Net income per share ¥ 106.41 ¥ 76.61 $ 0.94 Cash dividends per share 19.00 15.00 0.17
Consolidated Statements of Income
Kansai Paint Co., Ltd. and Consolidated SubsidiariesYears ended March 31, 2016 and 2015
Millions of yenThousands of
U.S. dollars (Note 1)
2016 2015 2016Net Income ¥ 35,513 ¥25,145 $ 315,167
Other comprehensive income (Note 10):Net unrealized holding gains (losses) on securities (8,016) 11,505 (71,139)Foreign currency translation adjustments (15,880) 10,637 (140,930)Remeasurements of defined benefit plans (4,037) 3,409 (35,827)Shares in other comprehensive income of equity method affiliates (1,536) 1,540 (13,632)
Total other comprehensive income (29,469) 27,091 (261,528)Comprehensive income 6,044 52,236 53,639
Comprehensive income attributed to:Owners of the parent ¥ 2,834 ¥44,467 $ 25,151 Non-controlling interests 3,210 7,769 28,488
Consolidated Statements of Comprehensive Income
See accompanying notes.
See accompanying notes.
34 Kansai Paint Co., Ltd. Corporate Report 2016

Kansai Paint Co., Ltd. and Consolidated SubsidiariesYears ended March 31, 2016 and 2015
Millions of yen
Shareholders’ equity Accumulated other comprehensive income
Commonstock
Capitalsurplus
Retainedearnings
Treasurystock
Total shareholders’
equity
Net unrealized
holding gainson securities
Foreign currency
translationadjustments
Remeasure-ments
of definedbenefit plans
Totalaccumulated
other comprehensive
income
Non-controlling interests
Total net assets
Balance at April 1, 2014 ¥25,659 ¥27,154 ¥160,892 ¥(4,945) ¥208,760 ¥22,250 ¥ (6,566) ¥ 1,431 ¥ 17,115 ¥32,141 ¥258,016 Cumulative effects of changes in accounting policies (1,006) (1,006) (1,006)
Balance at April 1, 2014 (restated) 25,659 27,154 159,886 (4,945) 207,754 22,250 (6,566) 1,431 17,115 32,141 257,010
Cash dividends paid (4,143) (4,143) (4,143)Net income attributable to owners of the parent 20,409 20,409 20,409 Purchase of treasury stock (90) (90) (90)Equity transaction with non-controlling interests and other 144 144 144 Net changes in items other than shareholders’ equity 11,736 8,894 3,428 24,058 6,239 30,297
Balance at April 1, 2015 ¥25,659 ¥27,154 ¥176,296 ¥(5,035) ¥224,074 ¥33,986 ¥ 2,328 ¥ 4,859 ¥ 41,173 ¥38,380 ¥303,627 Cash dividends paid (4,544) (4,544) (4,544)Net income attributable to owners of the parent 28,344 28,344 28,344 Purchase of treasury stock (44) (44) (44)Disposal of treasury stock 0 1 1 1 Purchase of shares of consolidated subsidiaries (8,258) (8,258) (8,258)Change in treasury stock arising from change in equity in entities accounted for using equity method 1 1 1 Net changes in items other than shareholders’ equity (8,562) (12,873) (4,074) (25,509) 285 (25,224)
Balance at March 31, 2016 ¥25,659 ¥18,896 ¥200,096 ¥(5,077) ¥239,574 ¥25,424 ¥(10,545) ¥ 785 ¥ 15,664 ¥38,665 ¥293,903
Thousands of U.S. dollars (Note 1)
Shareholders’ equity Accumulated other comprehensive income
Commonstock
Capitalsurplus
Retainedearnings
Treasurystock
Total shareholders’
equity
Net unrealized
holding gainson securities
Foreign currency
translationadjustments
Remeasure-ments
of definedbenefit plans
Totalaccumulated
other comprehensive
income
Non-controlling interests
Total net assets
Balance at April 1, 2015 $227,716 $240,983 $1,564,572 $(44,684) $1,988,587 $301,615 $ 20,660 $ 43,122 $ 365,397 $340,611 $2,694,595 Cash dividends paid (40,326) (40,326) (40,326)Net income attributable to owners of the parent 251,544 251,544 251,544 Purchase of treasury stock (391) (391) (391)Disposal of treasury stock 0 9 9 9 Purchase of shares of consolidated subsidiaries (73,287) (73,287) (73,287)Change in treasury stock arising from change in equity in entities accounted for using equity method 9 9 9 Net changes in items other than shareholders’ equity (75,985) (114,244) (36,155) (226,384) 2,529 (223,855)
Balance at March 31, 2016 $227,716 $167,696 $1,775,790 $(45,057) $2,126,145 $225,630 $ (93,584) $ 6,967 $ 139,013 $343,140 $2,608,298
Consolidated Statements of Changes in Net Assets
See accompanying notes.
Kansai Paint Co., Ltd. Corporate Report 2016 35
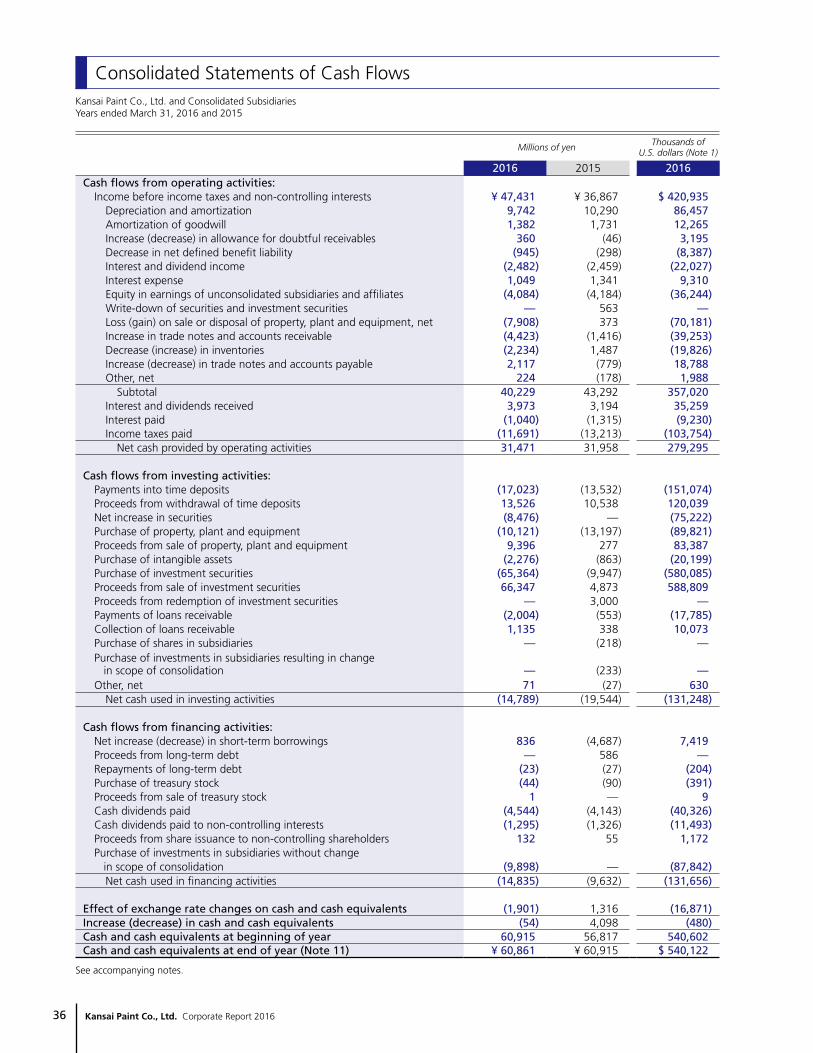
Kansai Paint Co., Ltd. and Consolidated SubsidiariesYears ended March 31, 2016 and 2015
Millions of yenThousands of
U.S. dollars (Note 1)
2016 2015 2016Cash flows from operating activities:
Income before income taxes and non-controlling interests ¥ 47,431 ¥ 36,867 $ 420,935 Depreciation and amortization 9,742 10,290 86,457 Amortization of goodwill 1,382 1,731 12,265 Increase (decrease) in allowance for doubtful receivables 360 (46) 3,195 Decrease in net defined benefit liability (945) (298) (8,387)Interest and dividend income (2,482) (2,459) (22,027)Interest expense 1,049 1,341 9,310 Equity in earnings of unconsolidated subsidiaries and affiliates (4,084) (4,184) (36,244)Write-down of securities and investment securities — 563 —Loss (gain) on sale or disposal of property, plant and equipment, net (7,908) 373 (70,181)Increase in trade notes and accounts receivable (4,423) (1,416) (39,253)Decrease (increase) in inventories (2,234) 1,487 (19,826)Increase (decrease) in trade notes and accounts payable 2,117 (779) 18,788 Other, net 224 (178) 1,988
Subtotal 40,229 43,292 357,020 Interest and dividends received 3,973 3,194 35,259 Interest paid (1,040) (1,315) (9,230)Income taxes paid (11,691) (13,213) (103,754)
Net cash provided by operating activities 31,471 31,958 279,295
Cash flows from investing activities:Payments into time deposits (17,023) (13,532) (151,074)Proceeds from withdrawal of time deposits 13,526 10,538 120,039 Net increase in securities (8,476) — (75,222)Purchase of property, plant and equipment (10,121) (13,197) (89,821)Proceeds from sale of property, plant and equipment 9,396 277 83,387 Purchase of intangible assets (2,276) (863) (20,199)Purchase of investment securities (65,364) (9,947) (580,085)Proceeds from sale of investment securities 66,347 4,873 588,809 Proceeds from redemption of investment securities — 3,000 —Payments of loans receivable (2,004) (553) (17,785)Collection of loans receivable 1,135 338 10,073 Purchase of shares in subsidiaries — (218) —Purchase of investments in subsidiaries resulting in change in scope of consolidation — (233) —Other, net 71 (27) 630
Net cash used in investing activities (14,789) (19,544) (131,248)
Cash flows from financing activities:Net increase (decrease) in short-term borrowings 836 (4,687) 7,419 Proceeds from long-term debt — 586 —Repayments of long-term debt (23) (27) (204)Purchase of treasury stock (44) (90) (391)Proceeds from sale of treasury stock 1 — 9 Cash dividends paid (4,544) (4,143) (40,326)Cash dividends paid to non-controlling interests (1,295) (1,326) (11,493)Proceeds from share issuance to non-controlling shareholders 132 55 1,172 Purchase of investments in subsidiaries without change in scope of consolidation (9,898) — (87,842)
Net cash used in financing activities (14,835) (9,632) (131,656)
Effect of exchange rate changes on cash and cash equivalents (1,901) 1,316 (16,871)Increase (decrease) in cash and cash equivalents (54) 4,098 (480)Cash and cash equivalents at beginning of year 60,915 56,817 540,602 Cash and cash equivalents at end of year (Note 11) ¥ 60,861 ¥ 60,915 $ 540,122
Consolidated Statements of Cash Flows
See accompanying notes.
36 Kansai Paint Co., Ltd. Corporate Report 2016

Kansai Paint Co., Ltd. and Consolidated Subsidiaries
Notes to Consolidated Financial Statements
1. Basis of Presenting Consolidated Financial StatementsThe accompanying consolidated financial statements of Kansai Paint Co., Ltd. (the “Company”) and its consolidated subsidiaries (together the “Companies”) have been prepared in accordance with the provisions set forth in the Financial Instruments and Exchange Act and their related accounting regulations and in conformity with accounting principles generally accepted in Japan (“Japanese GAAP”), which are different in certain respects as to application and disclosure requirements from International Financial Reporting Standards. The accompanying consolidated financial statements have been restructured and translated into English, with some expanded descriptions, from the consolidated financial statements of the Company prepared in accordance with Japanese GAAP and filed with the appropriate Local Finance
Bureau of the Ministry of Finance as required by the Financial Instruments and Exchange Act. Certain supplementary information included in the statutory consolidated financial statements in Japanese, but not required for fair presentation, is not presented in the accompanying consolidated financial statements. The translations of the Japanese yen amounts into U.S. dollar amounts are included solely for the convenience of readers outside Japan, using the prevailing exchange rate at March 31, 2016, which was ¥112.68 to U.S. $1.00. The translations should not be construed as representations that the Japanese yen amounts have been, could have been or could in the future be converted into U.S. dollars at this or any other rate of exchange.
2. Summary of Significant Accounting PoliciesPrinciples of consolidationThe consolidated financial statements in the fiscal year ended March 31, 2016 include the accounts of the Company and its 62 (69 at March 31, 2015) significant subsidiaries. Intercompany transactions and accounts have been eliminated. Investment in 14 unconsolidated subsidiaries and 29 affiliates in the fiscal year ended March 31, 2016 (13 and 29, respectively, at March 31, 2015) are stated at cost, adjusted for equity in undistributed earnings and losses since acquisition. The accounts of 46 consolidated subsidiaries in the fiscal year ended March 31, 2016 (54 at March 31, 2015) are included on the basis of their respective fiscal year ends, one of which ends on February 29 and the others on December 31. These subsidiaries do not prepare for consolidation purposes statements for the period which corresponds with the fiscal year of the Company, which ends March 31. For these consolidated subsidiaries, when there are significant transactions between their respective fiscal year end and that of the Company, necessary adjustments are made to reflect the transactions in the consolidated financial statements. In the elimination of investments in subsidiaries, the assets and liabilities of the subsidiaries, including the portion attributable to non-controlling interests, are evaluated using the fair value at the time the Company acquired control of the respective subsidiary.
Unification of accounting policies applied to foreign subsidiaries for the consolidated financial statementsAccounting Standards Board of Japan (“ASBJ”) issued ASBJ Practical Issues Task Force (PITF) No. 18, Practical Solution on Unification of Accounting Policies Applied to Foreign Subsidiaries for the Consolidated Financial Statements. PITF No. 18 prescribes that the accounting policies and procedures applied to a parent company and its subsidiaries for similar transactions and events under similar circumstances should in
principle be unified for the presentation of the consolidated financial statements. Moreover, if the financial statements of foreign subsidiaries are prepared in accordance with IFRS or U.S. GAAP, they may tentatively be used for the consolidation process. However, if the four specified items are material to the group’s consolidated financial statements, then they should be adjusted for in the consolidation process.
Allowance for doubtful receivablesThe allowance for doubtful receivables is determined by adding the estimated uncollectible amounts of individual receivables to an amount calculated using a rate based on past experience.
SecuritiesHeld-to-maturity debt securities are stated at amortized cost. Equity securities issued by subsidiaries and affiliated companies which are not consolidated or accounted for using the equity method are stated at moving average cost. Available-for-sale securities with available quoted market prices are stated at the quoted market prices. Unrealized gains and losses on these securities are reported, net of applicable income taxes, as a separate component of accumulated other comprehensive income. Realized gains and losses on the sale of such securities are computed using moving average cost. Securities with no available quoted market prices are stated mainly at moving average cost. If the quoted market price of equity securities issued by unconsolidated subsidiaries or affiliated companies not accounted for by the equity method or the quoted market price of available-for-sale securities declines significantly, the securities are stated at the quoted market price, and the difference between the quoted market price and the carrying amount is recognized as loss in the period of the decline. If the quoted market price of equity securities issued by unconsolidated subsidiaries or affiliated companies not
Kansai Paint Co., Ltd. Corporate Report 2016 37
accounted for by the equity method is not readily available, the securities are written down to net asset value with a corresponding charge in the consolidated statements of income in the event the net asset value declines significantly. In these cases, the quoted market price or the net asset value will be the carrying amount of the securities at the beginning of the next year.
InventoriesInventories held for the purpose of ordinary sale are stated principally at the lower of moving average cost or net realizable value.
Property, plant and equipment and depreciationProperty, plant and equipment are stated at cost. Depreciation is computed primarily using the declining balance method for the Company and the domestic consolidated subsidiaries and the straight-line method for overseas consolidated subsidiaries. For the Company and the domestic consolidated subsidiaries, buildings acquired after March 31, 1998 are depreciated using the straight-line method.
Software costsSoftware held for own use, recorded in intangible assets, is amortized using the straight-line method over the estimated useful life (mainly five years).
Amortization of goodwillGoodwill is amortized using the straight-line method over an appropriate period not to exceed 20 years.
Research and development expensesResearch and development expenses are charged to income as incurred. Research and development expenses for the years ended March 31, 2016 and 2015 were ¥5,046 million ($44,782 thousand) and ¥5,323 million, respectively.
Income taxesIncome taxes comprise corporation tax, prefectural and municipal inhabitants’ taxes and enterprise tax. Enterprise tax is deducted from taxable income when paid. The asset-liability approach is used to recognize deferred tax assets and liabilities for the expected future tax consequences of temporary differences between the carrying amounts of assets and liabilities for financial reporting purposes and the amounts used for income tax purposes.
Finance leasesFinance leases which do not transfer ownership of the lease assets are capitalized and depreciated by the straight-line method over the term of the lease with the assumption of no residual value.
Retirement benefits(1) Method used to attribute expected benefit payments to
periods of service In determining retirement benefit obligations, the benefit
formula basis is used for attributing expected benefit payments to periods of service.
(2) Actuarial gains and losses and past service cost Actuarial gains and losses and past service cost are
recognized in expenses using the straight-line method mainly over 13 years, which is within the average of the estimated remaining service years of the employees.
Retirement benefits for directors and corporate auditorsRetirement benefits for directors and corporate auditors of certain domestic consolidated subsidiaries are provided on an accrual basis in accordance with the Companies’ established rules.
Cash and cash equivalentsIn preparing the consolidated statement of cash flows, cash on hand, readily available deposits and short-term highly liquid investments with maturities not exceeding three months at the time of purchase are considered to be cash and cash equivalents.
DerivativesThe Companies state derivative financial instruments at fair value and recognize any change in the fair value as gain or loss, unless the derivative financial instruments are used for hedging purposes.
Significant hedge accounting methods(1) Hedge accounting method If derivative financial instruments are used as hedges and
meet certain hedging criteria, the Companies defer recognition of gain or loss resulting from changes in the fair value until the related loss or gain on the hedged item is recognized. However, in cases in which forward foreign exchange contracts are used as hedges and meet certain hedging criteria, the foreign currency receivables or payables are translated at the contracted rate.
(2) Hedging instruments and hedged items Hedging instruments consist of forward foreign exchange
contracts. Hedged items comprise receivables and payables denominated in foreign currencies and forecasted transactions denominated in foreign currencies.
(3) Hedging policy The Companies utilize forward exchange contracts to reduce
the risk of exchange rate fluctuations associated with receivables, payables and forecasted transactions denominated in foreign currencies within actual demand.
38 Kansai Paint Co., Ltd. Corporate Report 2016
(4) Assessment method for hedge effectiveness Hedge effectiveness is not assessed for forward exchange
contracts as the substantial terms and conditions of the hedging instruments and hedged items are the same and considered highly counterbalanced.
(5) Transaction risk management structure The finance department of the Company administers
hedging transactions based on the Company’s rules and with the approval of management.
Net income and cash dividends per shareThe calculation of net income per share is based on the weighted average number of shares of common stock in issue during the year. Diluted net income per share of common stock for the years ended March 31, 2016 and 2015 is not shown since there were no outstanding convertible bonds or other common stock equivalents. Cash dividends per share presented in the accompanying consolidated statements of income are based on the dividends attributable to the profit for the year, including dividends to be paid after the end of the year.
Changes in accounting policies and disclosures for the year ended March 31, 2016
ReclassificationCertain reclassifications have been made to the consolidated financial statements for the year ended March 31, 2015 to conform to the presentation for the year ended March 31, 2016.
Application of the Business Combinations Accounting StandardsEffective from the beginning of the fiscal year ended March 31, 2016, the Company and its domestic subsidiaries have adopted the ’Revised Accounting Standard for Business Combinations’ (ASBJ Statement No. 21, issued on September 13, 2013, hereafter referred to as the Business Combinations Accounting Standard), the ’Revised Accounting Standard for Consolidated Financial Statements’ (ASBJ Statement No. 22 issued on September 13, 2013, hereafter referred to as the Consolidation Accounting Standard), the ’Revised Accounting Standard for Business Divestitures’ (ASBJ Statement No. 7 issued on September 13, 2013, hereafter referred to as the Business Divestitures Accounting Standard) (together, the ’Business Combinations Accounting Standards’) and related matters. Accordingly, the Company has changed its accounting policies to record the difference arising from changes in the equity in subsidiaries over which the Company retains control as capital surplus, and acquisition related costs as expenses for the fiscal year in which they are incurred. For business combinations occurring on or after the beginning of the fiscal year ended March 31, 2016, the Company has changed accounting policies to record the adjustment to the provisional
acquisition cost allocation arising from the finalization of the provisional accounting treatment in the consolidated financial statements in which the relevant business combination occurs. Additionally, the Company has changed the presentation of net income and other items and has changed the presentation of minority interests to non-controlling interests. In order to reflect these changes, the Company has reclassified the consolidated financial statements for the previous fiscal year. The adoption of the Business Combinations Accounting Standards and related matters is in line with the transitional treatment specified in Article 58-2 (4) of the Business Combinations Accounting Standard, Article 44-5 (4) of the Consolidation Accounting Standard and Article 57-4 (4) of the Business Divestitures Accounting Standard. The Company has applied these accounting standards from the beginning of the fiscal year ended March 31, 2016 prospectively. As a result, income before income taxes and non-controlling interests for the fiscal year ended March 31, 2016 decreased by ¥42 million ($373 thousand) and capital surplus as of March 31, 2016 decreased by ¥8,258 million ($73,287 thousand). In the consolidated cash flow statement for the fiscal year ended March 31, 2016, the following changes have been made in the method of reclassification: Cash flows related to purchases and sales of investments in subsidiaries without a change in the scope of consolidation have been included in cash flows from financing activities. Cash flows related to expenses arising from purchases of investments in subsidiaries resulting in a change in the scope of consolidation or cash flows related to expenses from purchases and sales of investments in subsidiaries without a change in the scope of consolidation have been included in cash flows from operating activities. Additionally, net assets per share as of March 31, 2016 and net income per share for the fiscal year ended March 31, 2016 decreased by ¥31.01 ($0.28) and ¥0.16 ($0.00), respectively.
Accounting standards issued but not yet effectiveRevised Implementation Guidance on Recoverability of Deferred Tax Assets (ASBJ Guidance No. 26, March 28, 2016)
(1) Summary The Accounting Standards Board of Japan (ASBJ) has issued
the guidance in applying the “Accounting Standards for Tax Effect Accounting” (Business Accounting Council). While ASBJ basically continues to apply the framework used in the Japanese Institute of Certified Public Accountants (JICPA) Auditing Committee Report No. 66 ”Auditing Treatment for Judgment of Recoverability of Deferred Tax Assets,” in which companies are classified into five categories and deferred tax assets are estimated in accordance with the classification, the following revisions were made as necessary.
Kansai Paint Co., Ltd. Corporate Report 2016 39

( Revisions of requirements for classification and treatment of the estimation of deferred tax assets)
1) Treatment of companies that do not fulfill any of the requirements for classification from Category 1 to Category 5
2) Requirements for classification pertaining to Category 2 and Category 3
3) Treatment of deductible temporary differences that cannot be scheduled for companies that fall under Category 2
4) Treatment of the reasonable estimable period for the taxable income before adjusting temporary differences in future for companies that fall under Category 3
5) Treatment in cases where companies that fulfill the requirements for Category 4 also fall under Category 2 or Category 3
(2) Effective date Effective from the beginning of the fiscal year ending March
31, 2017
(3) Effects of application of the Guidance Effects of the application of “Revised Implementation
Guidance on Recoverability of Deferred Tax Assets” are currently under review.
Changes in presentation(Consolidated statements of cash flows)In the fiscal year ended March 31, 2016, under cash flows from investing activities, purchase of securities and proceeds from sale of securities, which had previously been reported separately, are reported as a single amount as net decrease (increase) in securities, while under cash flows from financing activities, proceeds from short-term borrowings and repayments of short-term borrowings, which had previously been reported separately, are reported as a single amount as net increase (decrease) in short-term borrowings, in consideration of the short-term nature and rapid turnover of these accounts. The consolidated statement of cash flows for the fiscal year ended March 31, 2015, has been adjusted accordingly, resulting in the previously reported ¥(69,399) million as purchase of marketable securities and ¥69,399 million as proceeds from sale of marketable securities being combined to no net increase in securities, and the previously reported ¥4,770 million as proceeds from short-term borrowings and ¥(9,457) million as repayments of short-term borrowings being combined to ¥(4,687) million as net increase (decrease) in short-term borrowings.
3. Financial Instruments1. Status of financial instruments(1) Policies on financial instruments The Companies procure funds necessary for capital investment and raise short-term working capital mainly through bank loans
and the issuance of bonds. The Companies manage temporary surplus funds through financial assets that have a high level of safety. The Companies use derivative financial instruments to hedge foreign currency exchange rate fluctuation risk and do not enter into derivative transactions for trading or speculative purposes.
(2) Details of financial instruments and associated risks Trade notes and accounts receivable are exposed to customer credit risk. In addition, receivables denominated in foreign currencies
from overseas operations are exposed to the risk of exchange rate fluctuations. Investment securities are primarily the stocks of business partners and customers and are exposed to market price fluctuation risk.
Most trade notes and accounts payable are due for payment within one year. Those denominated in foreign currencies are exposed to the risk of exchange rate fluctuations. The Companies use forward foreign exchange contracts to reduce the risk of exchange rate fluctuations associated with receivables, payables and forecasted transactions denominated in foreign currencies within the actual demand. Refer to “Significant hedge accounting methods” in Note 2, “Summary of Significant Accounting Policies,” for a description of the Company’s accounting policies related to hedging activities.
(3) Risk management framework for financial instruments 1) Credit risk management (counterparty risk) The Company has established internal rules and procedures for receivables under which the Business Planning & Administration
Division and Finance and Accounting Department are primarily responsible for monitoring counterparty status. The departments manage amounts and settlement dates by counterparty and work to quickly identify and mitigate payment risk that may result from situations such as the deterioration of the financial condition of a counterparty. Consolidated subsidiaries of the Company are subject to the same risk management rules. In using derivative transactions, the Company mitigates counterparty risk by conducting transactions with financial institutions with high credit ratings.
40 Kansai Paint Co., Ltd. Corporate Report 2016

2) Market risk management (risk of exchange rate and interest rate fluctuations) For some receivables and payables denominated in foreign currencies, the Companies use forward foreign exchange contracts
to hedge the risk of exchange rate fluctuations on a monthly and currency-by-currency basis. For securities and investment securities, the Companies periodically examine the fair value of the instruments and the
financial condition of the issuing entities. In addition, the Companies regularly evaluate whether securities other than those classified as held-to-maturity should be maintained taking into account their fair values and relationship with the issuing entities.
For derivative transactions, the Finance & Accounting Department handles the transactions after receiving approval from those with final approval authority in accordance with the Company’s internal rules. Administrative reports on the results are periodically provided to the Management Committee.
3) Management of liquidity risk associated with capital procurement (payment default risk) In the Companies, the Financial & Accounting Department is responsible for maintaining adequate liquidity and manages
liquidity risk by creating and updating a capital deployment plan based on reports from each division.
(4) Supplementary explanations about matters concerning fair value of financial instruments The fair value of financial instruments is based on their market price and, in cases in which market price is not available, a
reasonably calculated price. Such prices are calculated using certain assumptions and may differ if the assumptions change.
2. Fair value of financial instrumentsBook values of the financial instruments included in the consolidated balance sheets and their fair values at March 31, 2016 and 2015 were as follows (financial instruments for which the fair values were extremely difficult to determine were not included):
Millions of yen
2016Book value Fair value Difference
(1) Cash and deposits ¥72,309 ¥72,309 ¥—(2) Trade receivables - notes and accounts 91,544 91,544 —(3) Securities and investment securities Available-for-sale securities 58,415 58,415 —(4) Trade payables - notes and accounts 55,010 55,010 —(5) Derivative transactions 49 49 —
Millions of yen
2015Book value Fair value Difference
(1) Cash and deposits ¥68,869 ¥68,869 ¥—(2) Trade receivables - notes and accounts 92,176 92,176 —(3) Investment securities Available-for-sale securities 66,083 66,083 —(4) Trade payables - notes and accounts 56,278 56,278 —(5) Derivative transactions (40) (40) —
Thousands of U.S. dollars (Note 1)
2016Book value Fair value Difference
(1) Cash and deposits $641,720 $641,720 $—(2) Trade receivables - notes and accounts 812,424 812,424 —(3) Securities and investment securities Available-for-sale securities 518,415 518,415 —(4) Trade payables - notes and accounts 488,196 488,196 —(5) Derivative transactions 435 435 —
Derivative assets and liabilities were on a net basis.
Kansai Paint Co., Ltd. Corporate Report 2016 41

Fair value measurement of financial instruments(1) Cash and deposits (2) Trade receivables - notes and accounts Book value approximates the fair value due to the short maturity.(3) Securities and investment securities The fair value of equity securities is determined by the quoted market price. The fair value of debt securities is determined by the
quoted market price or the price provided by financial institutions.(4) Trade payables - notes and accounts Book value approximates the fair value due to the short maturity.(5) Derivative transactions The fair value of derivative transactions is determined by the quoted price obtained from the relevant financial institutions.
Book values of financial instruments for which the fair value was extremely difficult to measure
Millions of yenThousands of
U.S. dollars (Note 1)
2016 2015 2016Non-listed equity securities ¥ 750 ¥ 957 $ 6,656 Non-listed investment securities of unconsolidated subsidiaries and affiliates 18,729 18,007 166,214
The redemption schedule for money claims subsequent to the consolidated balance sheet date
Millions of yen
2016
Within 1 yearFrom 1 year to
5 yearsFrom 5 years to
10 yearsOver 10 years
Cash and deposits ¥72,309 ¥ — ¥ — ¥ —Receivables - trade notes and accounts 91,544 — — —Securities and investment securities
Other securities with maturityCorporate bonds 171 170 188 39 Other 8,536 — — —
Millions of yen
2015
Within 1 yearFrom 1 year to
5 yearsFrom 5 years to
10 yearsOver 10 years
Cash and deposits ¥68,869 ¥ — ¥ — ¥—Receivables - trade notes and accounts 92,176 — — —Investment securities
Other securities with maturityCorporate bonds 589 388 104 —
Thousands of U.S. dollars (Note 1)
2016
Within 1 yearFrom 1 year to
5 yearsFrom 5 years to
10 yearsOver 10 years
Cash and deposits $641,720 $ — $ — $ —Receivables - trade notes and accounts 812,424 — — —Securities and investment securities
Other securities with maturityCorporate bonds 1,518 1,509 1,668 346 Other 75,754 — — —
42 Kansai Paint Co., Ltd. Corporate Report 2016

4. Securities(1) The following table summarizes acquisition costs and book values of available-for-sale securities with available fair values at March
31, 2016 and 2015.
Millions of yen
2016Acquisition cost Book value Difference
Securities with book value exceeding acquisition cost:Equity securities ¥12,032 ¥46,778 ¥34,746 Corporate bonds 255 264 9 Investment trust funds 8,476 8,536 60
Total ¥20,763 ¥55,578 ¥34,815 Securities with book value not exceeding acquisition cost:
Equity securities ¥ 3,369 ¥ 2,533 ¥ (836)Corporate bonds 307 305 (2)Investment trust funds 0 0 —
Total ¥ 3,676 ¥ 2,838 ¥ (838)
Millions of yen
2015Acquisition cost Book value Difference
Securities with book value exceeding acquisition cost:Equity securities ¥13,187 ¥60,278 ¥47,091 Corporate bonds 485 492 7 Investment trust funds 3,540 3,556 16
Total ¥17,212 ¥64,326 ¥47,114 Securities with book value not exceeding acquisition cost:
Equity securities ¥ 2,202 ¥ 1,757 ¥ (445)Corporate bonds — — —Investment trust funds — — —
Total ¥ 2,202 ¥ 1,757 ¥ (445)
Thousands of U.S. dollars (Note 1)
2016Acquisition cost Book value Difference
Securities with book value exceeding acquisition cost:Equity securities $106,780 $415,140 $308,360 Corporate bonds 2,263 2,343 80 Investment trust funds 75,222 75,754 532
Total $184,265 $493,237 $308,972 Securities with book value not exceeding acquisition cost:
Equity securities $ 29,899 $ 22,480 $ (7,419)Corporate bonds 2,724 2,706 (18)Investment trust funds 0 0 —
Total $ 32,623 $ 25,186 $ (7,437)
(2) The following table summarizes book values of available-for-sale securities with no available fair value at March 31, 2016 and 2015.
Millions of yenThousands of
U.S. dollars (Note 1)
2016 2015 2016Non-listed equity securities ¥750 ¥957 $6,656
Kansai Paint Co., Ltd. Corporate Report 2016 43
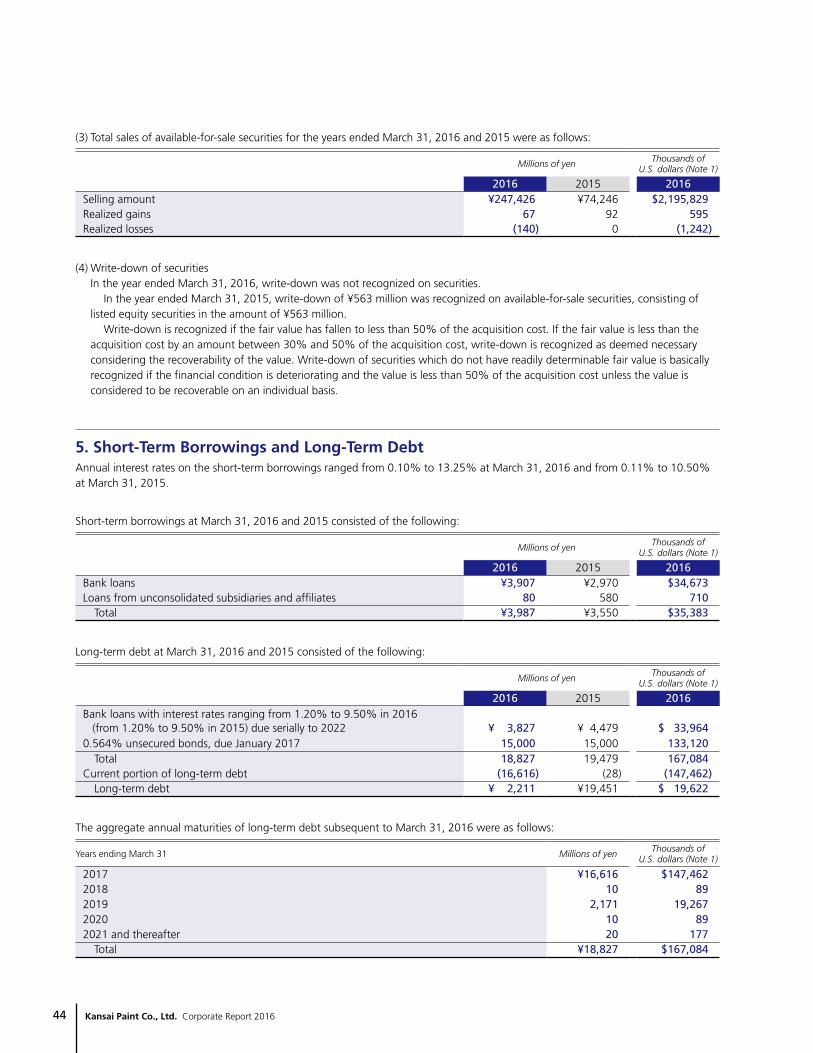
5. Short-Term Borrowings and Long-Term DebtAnnual interest rates on the short-term borrowings ranged from 0.10% to 13.25% at March 31, 2016 and from 0.11% to 10.50% at March 31, 2015.
Short-term borrowings at March 31, 2016 and 2015 consisted of the following:
Millions of yenThousands of
U.S. dollars (Note 1)
2016 2015 2016Bank loans ¥3,907 ¥2,970 $34,673 Loans from unconsolidated subsidiaries and affiliates 80 580 710
Total ¥3,987 ¥3,550 $35,383
Long-term debt at March 31, 2016 and 2015 consisted of the following:
Millions of yenThousands of
U.S. dollars (Note 1)
2016 2015 2016Bank loans with interest rates ranging from 1.20% to 9.50% in 2016 (from 1.20% to 9.50% in 2015) due serially to 2022 ¥ 3,827 ¥ 4,479 $ 33,964 0.564% unsecured bonds, due January 2017 15,000 15,000 133,120
Total 18,827 19,479 167,084 Current portion of long-term debt (16,616) (28) (147,462)
Long-term debt ¥ 2,211 ¥19,451 $ 19,622
The aggregate annual maturities of long-term debt subsequent to March 31, 2016 were as follows:
Years ending March 31 Millions of yenThousands of
U.S. dollars (Note 1)
2017 ¥16,616 $147,462 2018 10 89 2019 2,171 19,267 2020 10 89 2021 and thereafter 20 177
Total ¥18,827 $167,084
(3) Total sales of available-for-sale securities for the years ended March 31, 2016 and 2015 were as follows:
Millions of yenThousands of
U.S. dollars (Note 1)
2016 2015 2016Selling amount ¥247,426 ¥74,246 $2,195,829 Realized gains 67 92 595 Realized losses (140) 0 (1,242)
(4) Write-down of securities In the year ended March 31, 2016, write-down was not recognized on securities. In the year ended March 31, 2015, write-down of ¥563 million was recognized on available-for-sale securities, consisting of
listed equity securities in the amount of ¥563 million. Write-down is recognized if the fair value has fallen to less than 50% of the acquisition cost. If the fair value is less than the
acquisition cost by an amount between 30% and 50% of the acquisition cost, write-down is recognized as deemed necessary considering the recoverability of the value. Write-down of securities which do not have readily determinable fair value is basically recognized if the financial condition is deteriorating and the value is less than 50% of the acquisition cost unless the value is considered to be recoverable on an individual basis.
44 Kansai Paint Co., Ltd. Corporate Report 2016

6. Pledged AssetsAt March 31, 2016, the following assets were pledged as collateral for certain trade notes and accounts payable, short-term borrowings of ¥13 million ($115 thousand), other current liabilities of ¥15 million ($133 thousand) and long-term debt of ¥27 million ($240 thousand).
Millions of yenThousands of
U.S. dollars (Note 1)
2016 2016Cash and deposits ¥ 5 $ 44 Inventories 190 1,686 Property, plant and equipment 798 7,082 Investment securities — —
Total ¥993 $8,812
At March 31, 2015, the following assets were pledged as collateral for certain trade notes and accounts payable, short-term borrowings of ¥88 million, long-term debt of ¥47 million and other long-term liabilities of ¥17 million.
Millions of yen
2015Cash and deposits ¥ 20 Inventories 265 Property, plant and equipment 915 Investment securities 14
Total ¥1,214
7. Derivative Transactions(1) Derivative transactions to which the Companies didn’t apply hedge accounting as of March 31, 2016 and 2015 were as follows:
Millions of yen Thousands of U.S. dollars (Note 1)
2016 2016Contractamount
Fair value*1 Unrealized gain(loss)
Contractamount
Fair value*1 Unrealized gain(loss)
Foreign currency forward contractsBuy
U.S. dollar ¥ 2 ¥ 0 ¥ 0 $ 18 $ 0 $ 0 Euro 2 0 0 18 0 0 Japanese yen 277 4 4 2,458 36 36
SellU.S. dollar 223 (1) (1) 1,979 (9) (9)
Currency option contracts*2
BuyEuro 378 46 46 3,354 408 408
Total ¥882 ¥49 ¥49 $7,827 $435 $435
Kansai Paint Co., Ltd. Corporate Report 2016 45

8. Related Party TransactionsDuring the years ended March 31, 2016 and 2015, a consolidated subsidiary of the Company had operational transactions with OHGI SHOKAI CO., LTD., an affiliate of the Company. The significant transactions with OHGI SHOKAI CO., LTD. for the years ended March 31, 2016 and 2015 were as follows:
Millions of yenThousands of
U.S. dollars (Note 1)
2016 2015 2016For the year:
Sales of automotive and industrial coatings ¥14,017 ¥16,270 $124,397
At year-end:Trade notes and accounts receivable ¥ 6,045 ¥ 7,151 $ 53,647
Millions of yen
2015Contractamount
Fair value*1 Unrealized gain(loss)
Foreign currency forward contractsBuy
U.S. dollar ¥ 261 ¥ (2) ¥ (2)Euro 196 (2) (2)Japanese yen 1,167 (29) (29)
SellU.S. dollar 386 (2) (2)
Currency option contracts*2
BuyEuro 413 (5) (5)
Total ¥2,423 ¥(40) ¥(40)
*1 The fair values of derivative transactions are determined at the quoted prices obtained from the relevant financial institutions.*2 The currency option contracts are zero-cost options and no premium is received or paid.
(2) Derivative transactions to which the Companies applied hedge accounting as of March 31, 2016 and 2015 Not applicable.
46 Kansai Paint Co., Ltd. Corporate Report 2016

9. Net Assets Under Japanese laws and regulations, the entire amount paid for new shares is required to be designated as common stock. However, a company may, by a resolution of the Board of Directors, designate an amount not exceeding one half of the price of the new shares as additional paid-in capital, which is included in capital surplus. Under the Japanese Corporate Law, in cases in which a dividend distribution of surplus is made, the smaller of an amount equal to 10% of the dividend or the excess, if any, of 25% of common stock over the total of additional paid-in capital and legal earnings reserve must be set aside as additional paid-in capital or legal earnings reserve. Legal earnings reserve is included in retained earnings in the accompanying consolidated balance sheets. Legal earnings reserve and additional paid-in capital may be used to eliminate or reduce a deficit by a resolution of the shareholders’ meeting. All additional paid-in capital and all legal earnings reserve may be transferred to other capital surplus and retained earnings, respectively, which are potentially available for dividends. The maximum amount that the Company can distribute as dividends is calculated based on the non-consolidated financial statements of the Company in accordance with Japanese laws and regulations. At the annual shareholders’ meeting held on June 29, 2016, the shareholders approved cash dividends of ¥9.5 ($0.08) per share amounting to ¥2,539 million ($22,533 thousand). This appropriation was not accounted for in the consolidated financial statements at March 31, 2016. Such appropriations are recognized in the period in which they are approved by the shareholders.
10. Comprehensive IncomeReclassification adjustments and tax effects for each component of other comprehensive income for the years ended March 31, 2016 and 2015 were as follows:
Millions of yenThousands of
U.S. dollars (Note 1)
2016 2015 2016Net unrealized holding gains (losses) on securities:
Gains (losses) arising during the year ¥(12,602) ¥14,954 $(111,839)Reclassification adjustments (67) 548 (594)Amount before income tax effect (12,669) 15,502 (112,433)Income tax effect 4,653 (3,997) 41,294
Net unrealized holding gains (losses) on securities (8,016) 11,505 (71,139)
Foreign currency translation adjustments:Gains (losses) arising during the year (15,749) 10,637 (139,767)Reclassification adjustments (131) — (1,163)Amount before income tax effect (15,880) 10,637 (140,930)Income tax effect — — —
Foreign currency translation adjustments (15,880) 10,637 (140,930)
Remeasurements of defined benefit plansGains (losses) arising during the year (5,888) 4,231 (52,254)Reclassification adjustments (118) 705 (1,047)Amount before income tax effect (6,006) 4,936 (53,301)Income tax effect 1,969 (1,527) 17,474
Remeasurements of defined benefit plans (4,037) 3,409 (35,827)
Shares in other comprehensive income of equity method affiliates:Gains (losses) arising during the year (1,536) 1,545 (13,632)Reclassification adjustments — (5) —
Shares in other comprehensive income of equity method affiliates (1,536) 1,540 (13,632)
Total other comprehensive income ¥(29,469) ¥27,091 $(261,528)
Kansai Paint Co., Ltd. Corporate Report 2016 47

12. Employees’ Severance and Retirement BenefitsThe Company and some of the consolidated subsidiaries have defined benefit plans, i.e., corporate pension fund plans and lump-sum payment plans. Certain consolidated subsidiaries have defined contribution pension plans. Some of the consolidated subsidiaries use the simplified method for the calculation of net defined benefit liability and retirement benefit costs. In certain cases, the Company and some of the consolidated subsidiaries pay additional retirement benefits upon the retirement of employees.
(1) Defined benefit plans 1) Reconciliation of beginning and ending balances of the retirement benefit obligations (except plans applying the simplified
method) at March 31, 2016 and 2015 was as follows:
Millions of yenThousands of
U.S. dollars (Note 1)
2016 2015 2016Retirement benefit obligations at beginning of year ¥42,357 ¥40,966 $375,905
Cumulative effects of changes in accounting policies — 1,560 —Restated balance 42,357 42,526 375,905
Service cost 1,484 1,518 13,170 Interest cost 635 644 5,635 Actuarial losses 3,825 1 33,946 Benefits paid (2,317) (2,576) (20,563)Past service cost — 16 —Foreign currency exchange difference (316) 228 (2,804)
Retirement benefit obligations at end of year ¥45,668 ¥42,357 $405,289
2) Reconciliation of beginning and ending balances of plan assets (except plans applying the simplified method) at March 31, 2016 and 2015 was as follows:
Millions of yenThousands of
U.S. dollars (Note 1)
2016 2015 2016Plan assets at beginning of year ¥46,146 ¥41,338 $409,531
Expected return on plan assets 1,049 955 9,310 Actuarial gains (losses) (2,185) 4,211 (19,391)Contributions from the employer 1,403 1,451 12,451 Benefits paid (1,698) (1,850) (15,069)Foreign currency exchange difference (40) 41 (355)
Plan assets at end of year ¥44,675 ¥46,146 $396,477
11. Supplementary Cash Flow InformationReconciliation of cash and cash equivalents in the consolidated statements of cash flows and cash and deposits in the consolidated balance sheets as of March 31, 2016 and 2015 was as follows:
Millions of yenThousands of
U.S. dollars (Note 1)
2016 2015 2016Cash and deposits ¥ 72,309 ¥68,869 $ 641,720 Time deposits with original maturity of more than three months (11,448) (7,954) (101,598)
Cash and cash equivalents ¥ 60,861 ¥60,915 $ 540,122
48 Kansai Paint Co., Ltd. Corporate Report 2016

3) Reconciliation of beginning and ending balances of net defined benefit liability applying the simplified method at March 31, 2016 and 2015 was as follows:
Millions of yenThousands of
U.S. dollars (Note 1)
2016 2015 2016Net defined benefit liability at beginning of year ¥721 ¥ 791 $6,399
Net periodic benefit costs 157 93 1,393 Contributions from the employer (80) (105) (710)Benefits paid (70) (58) (621)
Net defined benefit liability at end of year ¥728 ¥ 721 $6,461
4) Reconciliation of ending balances of retirement benefit obligations and plan assets with net defined benefit liability and net defined benefit asset recognized in the consolidated balance sheets at March 31, 2016 and 2015 was as follows:
Millions of yenThousands of
U.S. dollars (Note 1)
2016 2015 2016Funded retirement benefit obligations ¥ 43,503 ¥ 40,061 $ 386,076 Plan assets (45,538) (46,973) (404,136)
(2,035) (6,912) (18,060)Unfunded retirement benefit obligations 3,756 3,844 33,333 Net amount of asset and liability recognized in the consolidated balance sheets 1,721 (3,068) 15,273
Net defined benefit liability 8,503 7,497 75,461 Net defined benefit asset (6,782) (10,565) (60,188)Net amount of asset and liability recognized in the consolidated balance sheets ¥ 1,721 ¥ (3,068) $ 15,273
Note: Including plans applying the simplified method.
5) The components of net periodic benefit costs for the years ended March 31, 2016 and 2015 were as follows:
Millions of yenThousands of
U.S. dollars (Note 1)
2016 2015 2016Service cost ¥ 1,484 ¥1,518 $13,170 Interest cost 635 644 5,635 Expected return on plan assets (1,049) (955) (9,310)Recognized actuarial losses 185 911 1,643 Amortization of past service cost (184) (168) (1,633)Net periodic benefit costs calculated by the simplified method 157 93 1,393
Net periodic benefit costs 1,228 2,043 10,898 Additional retirement benefits 36 35 320
Total ¥ 1,264 ¥2,078 $11,218
6) The amounts recognized in remeasurements of defined benefit plans (before the tax effect) in other comprehensive income for the years ended March 31, 2016 and 2015 were as follows:
Millions of yenThousands of
U.S. dollars (Note 1)
2016 2015 2016Past service cost ¥ (184) ¥ (184) $ (1,633)Actuarial gains (losses) (5,822) 5,120 (51,668)
Total ¥(6,006) ¥4,936 $(53,301)
Kansai Paint Co., Ltd. Corporate Report 2016 49
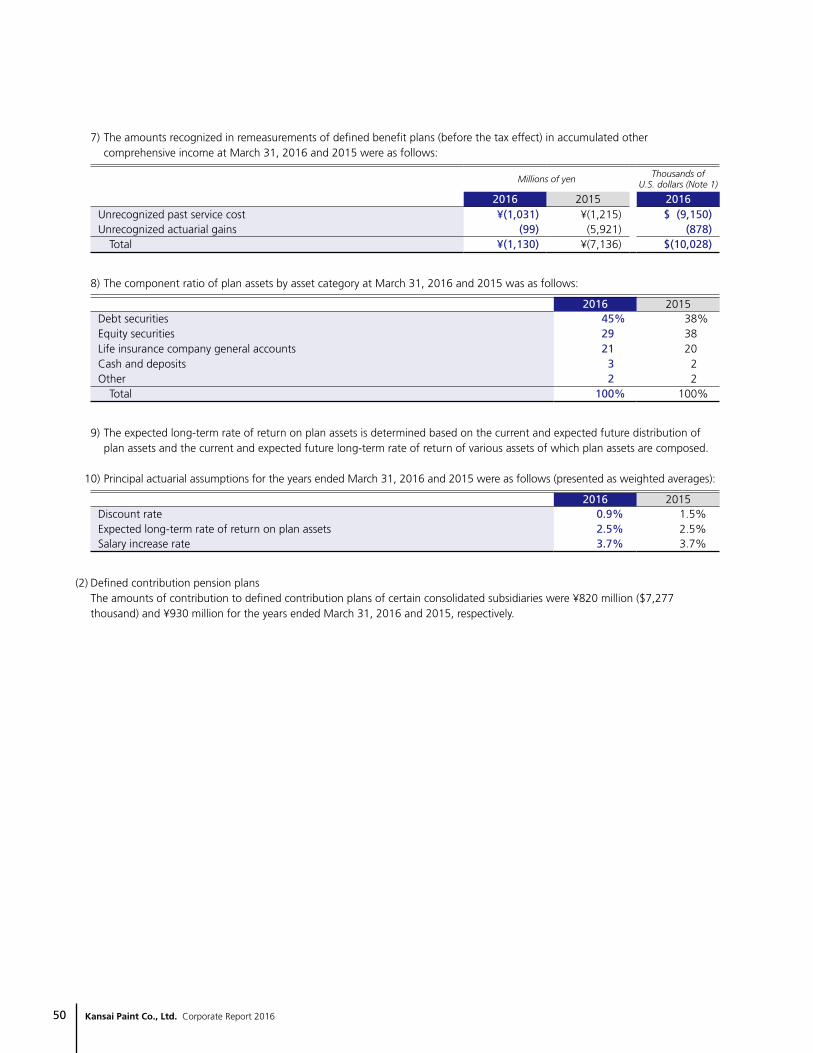
7) The amounts recognized in remeasurements of defined benefit plans (before the tax effect) in accumulated other comprehensive income at March 31, 2016 and 2015 were as follows:
Millions of yenThousands of
U.S. dollars (Note 1)
2016 2015 2016Unrecognized past service cost ¥(1,031) ¥(1,215) $ (9,150)Unrecognized actuarial gains (99) (5,921) (878)
Total ¥(1,130) ¥(7,136) $(10,028)
8) The component ratio of plan assets by asset category at March 31, 2016 and 2015 was as follows:
2016 2015Debt securities 45% 38%Equity securities 29 38 Life insurance company general accounts 21 20 Cash and deposits 3 2 Other 2 2
Total 100% 100%
9) The expected long-term rate of return on plan assets is determined based on the current and expected future distribution of plan assets and the current and expected future long-term rate of return of various assets of which plan assets are composed.
10) Principal actuarial assumptions for the years ended March 31, 2016 and 2015 were as follows (presented as weighted averages):
2016 2015Discount rate 0.9% 1.5%Expected long-term rate of return on plan assets 2.5% 2.5%Salary increase rate 3.7% 3.7%
(2) Defined contribution pension plans The amounts of contribution to defined contribution plans of certain consolidated subsidiaries were ¥820 million ($7,277
thousand) and ¥930 million for the years ended March 31, 2016 and 2015, respectively.
50 Kansai Paint Co., Ltd. Corporate Report 2016
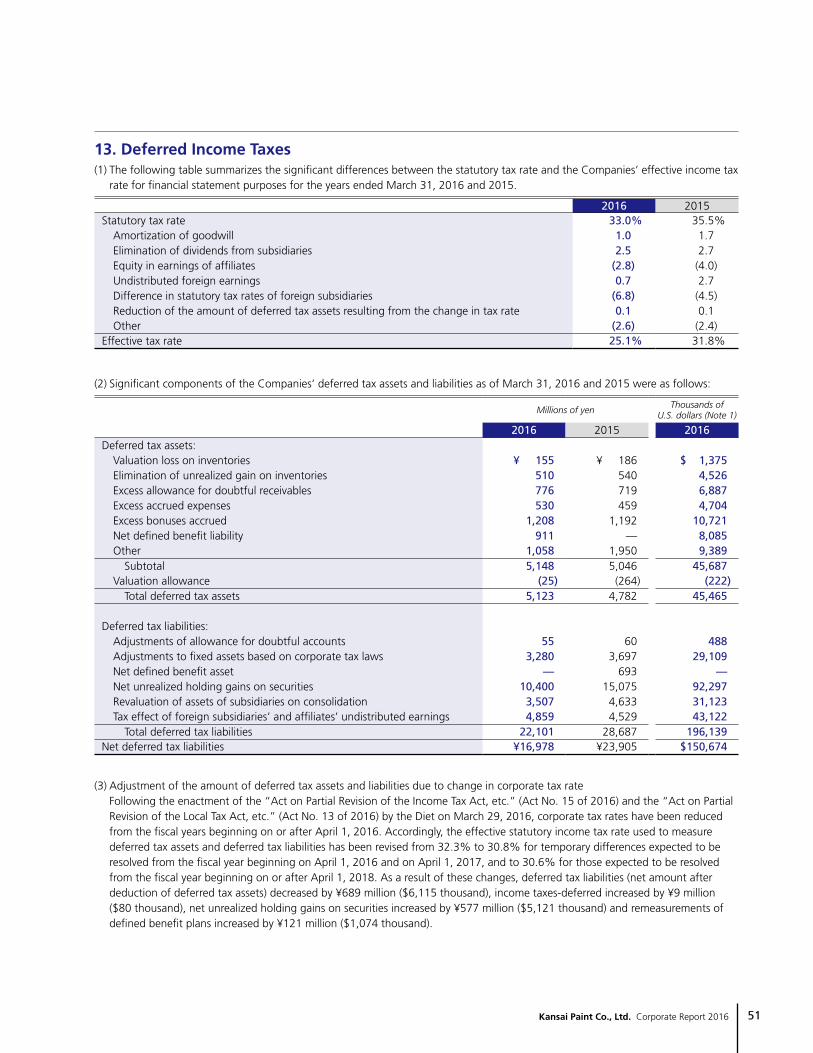
13. Deferred Income Taxes(1) The following table summarizes the significant differences between the statutory tax rate and the Companies’ effective income tax
rate for financial statement purposes for the years ended March 31, 2016 and 2015.
2016 2015Statutory tax rate 33.0% 35.5%
Amortization of goodwill 1.0 1.7 Elimination of dividends from subsidiaries 2.5 2.7 Equity in earnings of affiliates (2.8) (4.0)Undistributed foreign earnings 0.7 2.7 Difference in statutory tax rates of foreign subsidiaries (6.8) (4.5)Reduction of the amount of deferred tax assets resulting from the change in tax rate 0.1 0.1 Other (2.6) (2.4)
Effective tax rate 25.1% 31.8%
(2) Significant components of the Companies’ deferred tax assets and liabilities as of March 31, 2016 and 2015 were as follows:
Millions of yenThousands of
U.S. dollars (Note 1)
2016 2015 2016Deferred tax assets:
Valuation loss on inventories ¥ 155 ¥ 186 $ 1,375 Elimination of unrealized gain on inventories 510 540 4,526 Excess allowance for doubtful receivables 776 719 6,887 Excess accrued expenses 530 459 4,704 Excess bonuses accrued 1,208 1,192 10,721 Net defined benefit liability 911 — 8,085 Other 1,058 1,950 9,389
Subtotal 5,148 5,046 45,687 Valuation allowance (25) (264) (222)
Total deferred tax assets 5,123 4,782 45,465
Deferred tax liabilities:Adjustments of allowance for doubtful accounts 55 60 488 Adjustments to fixed assets based on corporate tax laws 3,280 3,697 29,109 Net defined benefit asset — 693 —Net unrealized holding gains on securities 10,400 15,075 92,297 Revaluation of assets of subsidiaries on consolidation 3,507 4,633 31,123 Tax effect of foreign subsidiaries’ and affiliates’ undistributed earnings 4,859 4,529 43,122
Total deferred tax liabilities 22,101 28,687 196,139 Net deferred tax liabilities ¥16,978 ¥23,905 $150,674
(3) Adjustment of the amount of deferred tax assets and liabilities due to change in corporate tax rate Following the enactment of the “Act on Partial Revision of the Income Tax Act, etc.” (Act No. 15 of 2016) and the “Act on Partial
Revision of the Local Tax Act, etc.” (Act No. 13 of 2016) by the Diet on March 29, 2016, corporate tax rates have been reduced from the fiscal years beginning on or after April 1, 2016. Accordingly, the effective statutory income tax rate used to measure deferred tax assets and deferred tax liabilities has been revised from 32.3% to 30.8% for temporary differences expected to be resolved from the fiscal year beginning on April 1, 2016 and on April 1, 2017, and to 30.6% for those expected to be resolved from the fiscal year beginning on or after April 1, 2018. As a result of these changes, deferred tax liabilities (net amount after deduction of deferred tax assets) decreased by ¥689 million ($6,115 thousand), income taxes-deferred increased by ¥9 million ($80 thousand), net unrealized holding gains on securities increased by ¥577 million ($5,121 thousand) and remeasurements of defined benefit plans increased by ¥121 million ($1,074 thousand).
Kansai Paint Co., Ltd. Corporate Report 2016 51

14. Segment Information1. Segment information(1) General information for reportable segments The reportable segments of the Kansai Paint Group are defined as components of the Group for which separate financial
information is available and reviewed regularly by the Board of Directors in determining how to allocate management resources and evaluate operating performance. The Company and its consolidated subsidiaries and affiliates are primarily engaged in the manufacturing and sale of paints and coatings. The Company is mainly in charge of business activities in Japan while locally incorporated overseas subsidiaries are in charge in each region. Locally incorporated overseas subsidiaries are independent business units that develop their own business activities and establish their own comprehensive strategies in each region. Accordingly, the Kansai Paint Group, being composed of regional segments based on manufacturing and selling systems, has the following four reportable segments: Japan, India, Asia and Africa.
(2) Methods of measurement for sales, profit and loss, assets and essentially all other items for each reportable segment The accounting methods applied to reportable segments are the same as those described in Note 2, “Summary of Significant
Accounting Policies.” Intersegment sales and transfers are based on prevailing market prices.
(3) Information about sales, profit and loss, assets and other material items by reportable segment Segment information for the fiscal years ended March 31, 2016 and 2015 was as follows:
Millions of yen
2016
Reportable segmentsOther*1 Total Adjustment*2
Consolidated financial
statements*3Japan India Asia Africa Total
Net sales
Sales to customers ¥155,367 ¥65,800 ¥58,898 ¥29,252 ¥309,317 ¥18,802 ¥328,119 ¥ — ¥328,119
Intersegment sales and transfers 15,923 18 3,317 101 19,359 34 19,393 (19,393) —
Total sales 171,290 ¥65,818 62,215 29,353 328,676 18,836 347,512 (19,393) 328,119
Segment income (loss) ¥ 21,470 ¥ 9,196 ¥ 7,651 ¥ (595) ¥ 37,722 ¥ 1,993 ¥ 39,715 ¥ — ¥ 39,715
Segment assets ¥241,561 ¥54,618 ¥91,754 ¥34,893 ¥422,826 ¥16,772 ¥439,598 ¥ (9,400) ¥430,198
Other items
Depreciation and amortization ¥ 3,749 ¥ 1,032 ¥ 3,210 ¥ 1,281 ¥ 9,272 ¥ 470 ¥ 9,742 ¥ — ¥ 9,742
Amortization of goodwill — 5 417 960 1,382 — 1,382 — 1,382
Interest income 53 40 214 506 813 0 813 (24) 789
Interest expense 12 9 47 641 709 274 983 (19) 964
Equity in earnings of unconsolidated subsidiaries and affiliates 569 — 1,917 197 2,683 1,401 4,084 — 4,084
Investments in unconsolidated subsidiaries and affiliates 11,080 — 16,511 2,094 29,685 3,886 33,571 — 33,571
Increase in property, plant and equipment and intangible assets 3,266 1,513 3,692 2,252 10,723 721 11,444 — 11,444
52 Kansai Paint Co., Ltd. Corporate Report 2016
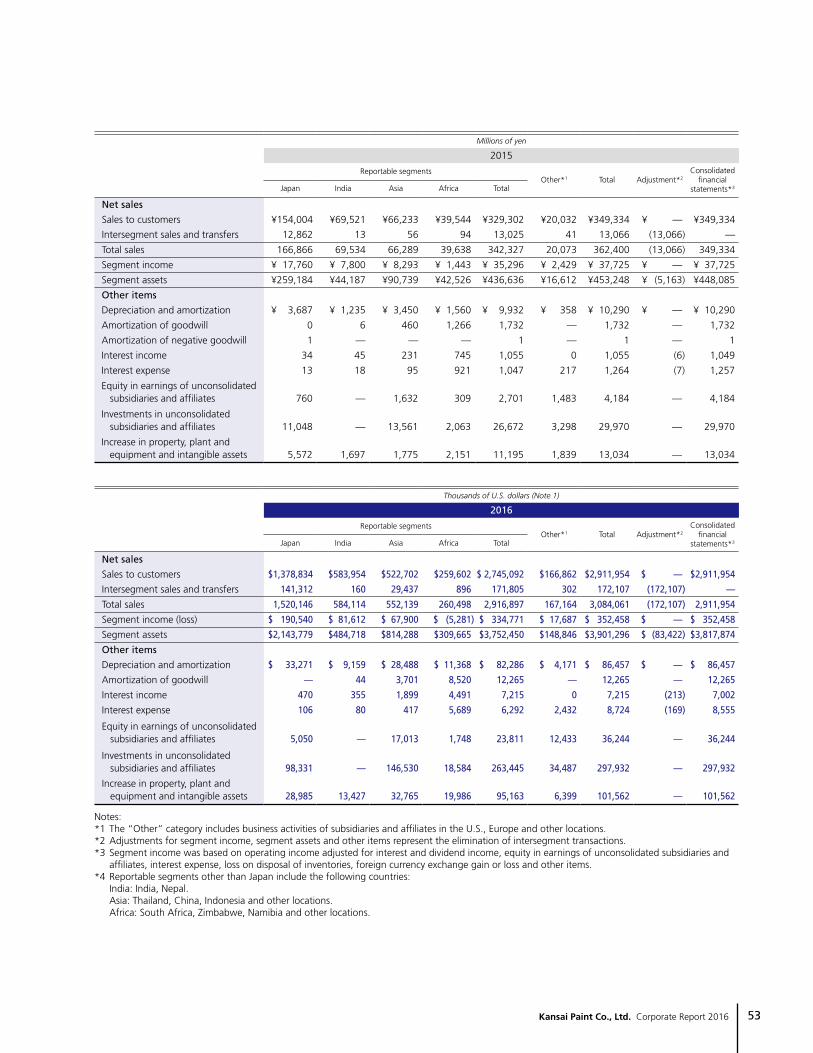
Millions of yen
2015
Reportable segmentsOther*1 Total Adjustment*2
Consolidated financial
statements*3Japan India Asia Africa Total
Net sales
Sales to customers ¥154,004 ¥69,521 ¥66,233 ¥39,544 ¥329,302 ¥20,032 ¥349,334 ¥ — ¥349,334
Intersegment sales and transfers 12,862 13 56 94 13,025 41 13,066 (13,066) —
Total sales 166,866 69,534 66,289 39,638 342,327 20,073 362,400 (13,066) 349,334
Segment income ¥ 17,760 ¥ 7,800 ¥ 8,293 ¥ 1,443 ¥ 35,296 ¥ 2,429 ¥ 37,725 ¥ — ¥ 37,725
Segment assets ¥259,184 ¥44,187 ¥90,739 ¥42,526 ¥436,636 ¥16,612 ¥453,248 ¥ (5,163) ¥448,085
Other items
Depreciation and amortization ¥ 3,687 ¥ 1,235 ¥ 3,450 ¥ 1,560 ¥ 9,932 ¥ 358 ¥ 10,290 ¥ — ¥ 10,290
Amortization of goodwill 0 6 460 1,266 1,732 — 1,732 — 1,732
Amortization of negative goodwill 1 — — — 1 — 1 — 1
Interest income 34 45 231 745 1,055 0 1,055 (6) 1,049
Interest expense 13 18 95 921 1,047 217 1,264 (7) 1,257
Equity in earnings of unconsolidated subsidiaries and affiliates 760 — 1,632 309 2,701 1,483 4,184 — 4,184
Investments in unconsolidated subsidiaries and affiliates 11,048 — 13,561 2,063 26,672 3,298 29,970 — 29,970
Increase in property, plant and equipment and intangible assets 5,572 1,697 1,775 2,151 11,195 1,839 13,034 — 13,034
Thousands of U.S. dollars (Note 1)
2016
Reportable segmentsOther*1 Total Adjustment*2
Consolidated financial
statements*3Japan India Asia Africa Total
Net sales
Sales to customers $1,378,834 $583,954 $522,702 $259,602 $ 2,745,092 $166,862 $2,911,954 $ — $2,911,954
Intersegment sales and transfers 141,312 160 29,437 896 171,805 302 172,107 (172,107) —
Total sales 1,520,146 584,114 552,139 260,498 2,916,897 167,164 3,084,061 (172,107) 2,911,954
Segment income (loss) $ 190,540 $ 81,612 $ 67,900 $ (5,281) $ 334,771 $ 17,687 $ 352,458 $ — $ 352,458
Segment assets $2,143,779 $484,718 $814,288 $309,665 $3,752,450 $148,846 $3,901,296 $ (83,422) $3,817,874
Other items
Depreciation and amortization $ 33,271 $ 9,159 $ 28,488 $ 11,368 $ 82,286 $ 4,171 $ 86,457 $ — $ 86,457
Amortization of goodwill — 44 3,701 8,520 12,265 — 12,265 — 12,265
Interest income 470 355 1,899 4,491 7,215 0 7,215 (213) 7,002
Interest expense 106 80 417 5,689 6,292 2,432 8,724 (169) 8,555
Equity in earnings of unconsolidated subsidiaries and affiliates 5,050 — 17,013 1,748 23,811 12,433 36,244 — 36,244
Investments in unconsolidated subsidiaries and affiliates 98,331 — 146,530 18,584 263,445 34,487 297,932 — 297,932
Increase in property, plant and equipment and intangible assets 28,985 13,427 32,765 19,986 95,163 6,399 101,562 — 101,562
Notes:*1 The “Other” category includes business activities of subsidiaries and affiliates in the U.S., Europe and other locations.*2 Adjustments for segment income, segment assets and other items represent the elimination of intersegment transactions.*3 Segment income was based on operating income adjusted for interest and dividend income, equity in earnings of unconsolidated subsidiaries and
affiliates, interest expense, loss on disposal of inventories, foreign currency exchange gain or loss and other items.*4 Reportable segments other than Japan include the following countries: India: India, Nepal. Asia: Thailand, China, Indonesia and other locations. Africa: South Africa, Zimbabwe, Namibia and other locations.
Kansai Paint Co., Ltd. Corporate Report 2016 53

2. Related information(1) Information by products and services
Millions of yen
2016
Automotive Industrial DecorativeMarine and protective
Other Total
Sales to customers ¥122,897 ¥81,889 ¥83,221 ¥22,441 ¥17,671 ¥328,119
Millions of yen
2015
Automotive Industrial DecorativeMarine and protective
Other Total
Sales to customers ¥132,070 ¥87,310 ¥93,533 ¥19,893 ¥16,528 ¥349,334
Thousands of U.S. dollars (Note 1)
2016
Automotive Industrial DecorativeMarine and protective
Other Total
Sales to customers $1,090,673 $726,739 $738,560 $199,157 $156,825 $2,911,954
(2) Information by geographical segment
Millions of yen
2016
Japan India Asia Africa Other Total
Total sales ¥139,240 ¥65,800 ¥69,993 ¥30,103 ¥22,983 ¥328,119
Property, plant and equipment 41,034 14,858 22,587 6,780 4,765 90,024
Millions of yen
2015
Japan India Asia Africa Other Total
Total sales ¥141,249 ¥69,525 ¥74,454 ¥40,001 ¥24,105 ¥349,334
Property, plant and equipment 42,020 16,893 24,108 8,357 5,558 96,936
Thousands of U.S. dollars (Note 1)
2016
Japan India Asia Africa Other Total
Total sales $1,235,712 $583,954 $621,166 $267,155 $203,967 $2,911,954
Property, plant and equipment 364,164 131,860 200,453 60,170 42,288 798,935
(3) Information by major customers No information is disclosed as there were no customers accounting for 10% or more of the Companies’ total net sales for the
fiscal years ended March 31, 2016 or 2015.
3. Impairment loss on property, plant and equipment and intangible assets by reportable segment There were no applicable related items for the fiscal years ended March 31, 2016 and 2015.
54 Kansai Paint Co., Ltd. Corporate Report 2016

4. Unamortized balance of goodwill by reportable segmentUnamortized balance of goodwill by reportable segment for the fiscal years ended March 31, 2016 and 2015 was as follows:
Millions of yen
2016
Reportable segmentsOther Total Adjustment
Consolidated financial
statementsJapan India Asia Africa Total
Unamortized balance of goodwill ¥— ¥8 ¥2,610 ¥5,039 ¥7,657 ¥— ¥7,657 ¥— ¥7,657
Millions of yen
2015
Reportable segmentsOther Total Adjustment
Consolidated financial
statementsJapan India Asia Africa Total
Unamortized balance of goodwill ¥— ¥15 ¥3,337 ¥7,913 ¥11,265 ¥— ¥11,265 ¥— ¥11,265
Thousands of U.S. dollars (Note 1)
2016
Reportable segmentsOther Total Adjustment
Consolidated financial
statementsJapan India Asia Africa Total
Unamortized balance of goodwill $— $71 $23,163 $44,719 $67,953 $— $67,953 $— $67,953
5. Gain on negative goodwill by reportable segmentThere were no applicable related items for the fiscal year ended March 31, 2016. For the fiscal year ended March 31, 2015, the Japan segment recognized gain on negative goodwill in the amount of ¥20 million resulting from the acquisition of additional shares of subsidiaries.
Kansai Paint Co., Ltd. Corporate Report 2016 55

15. Business CombinationsAdditional acquisition of subsidiary’s shares(1) Overview of business combination 1) Name and business description of the acquired company Name of the acquired company: KANSAI NEROLAC PAINTS LTD. Description of business: Manufacturing and sale of paints 2) Date of the business combination March 31, 2016 3) Legal form of the business combination Acquisition of shares from non-controlling interests 4) Company name after the business combination No change in name 5) Other matters regarding overview Through the business combination, the Company expects to improve cooperative relationships and further develop corporate
value and the business efficiency of the Group.
(2) Overview of accounting treatment applied Pursuant to the “Revised Accounting Standard for Business Combinations” (ASBJ Statement No. 21, issued on September 13,
2013) and the “Revised Guidance on Accounting Standard for Business Combinations and Accounting Standard for Business Divestitures” (ASBJ Guidance No.10, issued on September 13, 2013), the business combination under common control was treated as a transaction with non-controlling interests.
(3) Purchase price of additional shares and breakdown of acquisition cost Cash and deposits: ¥9,897 million ($87,833 thousand) (4) Details about changes in shareholders’ equity by transaction with non-controlling interests 1) Main reason for the change in capital surplus Additional acquisition of subsidiary’s shares 2) The amount of capital surplus decrease due to the transaction with non-controlling interests ¥8,300 million ($73,660 thousand)
56 Kansai Paint Co., Ltd. Corporate Report 2016

16. Subsequent EventsYear ended March 31, 2016
Issuance of zero coupon convertible bondsThe Board of Directors of the Company resolved the issuance of zero coupon convertible bonds due 2019 and zero coupon convertible bonds due 2022 (hereinafter, the “Bonds”) on June 1, 2016. The payments for the Bonds were completed on June 17, 2016 (London time; unless otherwise indicated, hereinafter the same shall apply).The outline of the issuance is as follows:
1. Outline of zero coupon convertible bonds due 2019 (1) Description of the Bonds KANSAI PAINT CO., LTD. zero coupon convertible bonds due 2019 (2) Issue price (amount to be paid) 104.5% of the principal amount of the Bonds (The Bonds are issued in the denomination of ¥10 million ($89 thousand) each.) (3) Offer price 107.0% of the principal amount of the Bonds (4) Aggregate principal amount of the Bonds ¥41.8 billion ($371 million) plus an aggregate principal amount of the Bonds in respect of replacement certificates (for lost,
stolen, destroyed, mutilated or defaced certificates if issued in accordance with the terms and conditions of the Bonds) (5) Coupon Zero (6) Closing date and issuing date of the Bonds June 17, 2016 (7) Redemption The Bonds shall be redeemed at 100% of their principal amount on June 17, 2019 (maturity date). In addition, the Bonds
may be redeemed if certain events occur as set forth in the terms and conditions of the Bonds. (8) Class and number of shares issued upon exercise of stock acquisition rights [1] Class of shares Common stock of the Company [2] Number of shares issued The number of shares shall be determined by dividing the aggregate principal amount of the Bonds with respect to the
exercised stock acquisition rights by the conversion price as set forth in (10). Fractions of a share shall not be issued upon the exercise and no adjustment or cash payment shall be made.
(9) Number of stock acquisition rights 4,000 units plus the number of stock acquisition rights determined by dividing an aggregate principal amount of the Bonds
in respect of replacement certificates by ¥10 million ($89 thousand) (10) Amounts to be paid upon exercise of stock acquisition rights [1] Upon exercise of each stock acquisition right, the relevant bond shall be deemed to be acquired by the Company as a
capital contribution in kind by the relevant bondholder at the price equal to the principal amount of the Bond. [2] Conversion price ¥2,663 ($24) per share (initial conversion price) (11) Exercise period of stock acquisition rights At any time during the period from and including July 1, 2016 to and including June 3, 2019 (at the local time of the place
where the stock acquisition right is to be exercised) but subject to certain provisions in the terms and conditions of the Bonds. (12) Other conditions for the exercise of stock acquisition rights No stock acquisition right may be exercised in part. (13) Capital stock and capital surplus increased by the exercise of stock acquisition rights The amount of capital stock increased by the exercise of stock acquisition rights shall be 50% of the maximum capital
increase amount calculated in accordance with Article 17 of the Ordinance on Company Accounting, rounding up the fraction. The amount of capital surplus increased shall be the difference between the maximum capital increase amount and the amount of capital stock increased.
Kansai Paint Co., Ltd. Corporate Report 2016 57

(14) Use of proceeds The net proceeds of the issue of zero coupon convertible bonds due 2019 and 2022 are estimated at ¥101.99 billion ($905
million) in the aggregate and are expected to be used as follows: [1] approximately ¥36 billion ($319 million) for upgrading the Group’s manufacturing facilities and building its sales network
overseas, and approximately ¥14 billion ($124 million) for investing in the improvement and maintenance of its domestic facilities to enhance the efficiency and safety of its manufacturing, sales and logistics operations;
[2] approximately ¥15 billion ($133 million) for funding research and development; [3] ¥15 billion ($133 million) for repaying existing bonds; [4] up to ¥20 billion ($177 million) for repurchasing its own shares by the Company; [5] any remainder will be applied towards working capital. (15) Other Approval in-principle has been received for the listing of the Bonds on the SGX-ST.
2. Outline of zero coupon convertible bonds due 2022 (1) Description of the Bonds KANSAI PAINT CO., LTD. zero coupon convertible bonds due 2022 (2) Issue price (amount to be paid) 100.5% of the principal amount of the Bonds (The Bonds are issued in the denomination of ¥10 million ($89 thousand) each.) (3) Offer price 103.0% of the principal amount of the Bonds (4) Aggregate principal amount of the Bonds ¥60.3 billion ($535 million) plus an aggregate principal amount of the Bonds in respect of replacement certificates (for lost,
stolen, destroyed, mutilated or defaced certificates if issued in accordance with the terms and conditions of the Bonds) (5) Coupon Zero (6) Closing date and issuing date of the Bonds June 17, 2016 (7) Redemption The Bonds shall be redeemed at 100% of their principal amount on June 17, 2022 (maturity date). In addition, the Bonds
may be redeemed if certain events occur as set forth in the terms and conditions of the Bonds. (8) Class and number of shares issued upon exercise of stock acquisition rights [1] Class of shares Common stock of the Company [2] Number of shares issued The number of shares shall be determined by dividing the aggregate principal amount of the Bonds with respect to the
exercised stock acquisition rights by the conversion price as set forth in (10). Fractions of a share shall not be issued upon the exercise and no adjustment or cash payment shall be made.
(9) Number of stock acquisition rights 6,000 units plus the number of stock acquisition rights determined by dividing an aggregate principal amount of the Bonds
in respect of replacement certificates by ¥10 million ($89 thousand) (10) Amounts to be paid upon exercise of stock acquisition rights [1] Upon exercise of each stock acquisition right, the relevant bond shall be deemed to be acquired by the Company as a
capital contribution in kind by the relevant bondholder at the price equal to the principal amount of the Bond. [2] Conversion price ¥3,217 ($29) per share (initial conversion price) (11) Exercise period of stock acquisition rights At any time during the period from and including July 1, 2016 to and including June 3, 2022 (at the local time of the place
where the stock acquisition right is to be exercised) but subject to certain provisions in the terms and conditions of the Bonds. (12) Other conditions for the exercise of stock acquisition rights No stock acquisition right may be exercised in part.
58 Kansai Paint Co., Ltd. Corporate Report 2016

(13) Capital stock and capital surplus increased by the exercise of stock acquisition rights The amount of capital stock increased by the exercise of stock acquisition rights shall be 50% of the maximum capital
increase amount calculated in accordance with Article 17 of the Ordinance on Company Accounting, rounding up the fraction. The amount of capital surplus increased shall be the difference between the maximum capital increase amount and the amount of capital stock increased.
(14) Use of proceeds Please refer to 1.(14) above. (15) Other Approval in-principle has been received for the listing of the Bonds on the SGX-ST.
Purchase of treasury stockThe Board of Directors of the Company resolved at the meeting held on June 1, 2016 to repurchase the Company's shares pursuant to Article 156 of the Companies Act, as applied according to Article 165, Paragraph 3 thereof. The repurchase was completed as follows:
1. Reason for repurchase The Company intends to repurchase its own shares in order to implement flexible capital policies that respond to changes in the
business environment.
2. Matters regarding repurchase (1) Class of shares to be repurchased Common stock (2) Total number of shares to be repurchased Up to 10,500,000 shares (3) Repurchase period From June 2, 2016 to March 31, 2017 (4) Total amount of shares to be repurchased Up to ¥20 billion ($177 million) (5) Repurchase method Market purchase
3. Date of repurchase June 2, 2016
4. Other The Company accordingly repurchased 9,013,000 shares (amounting to ¥19,999 million ($177,485 thousand)).
Kansai Paint Co., Ltd. Corporate Report 2016 59
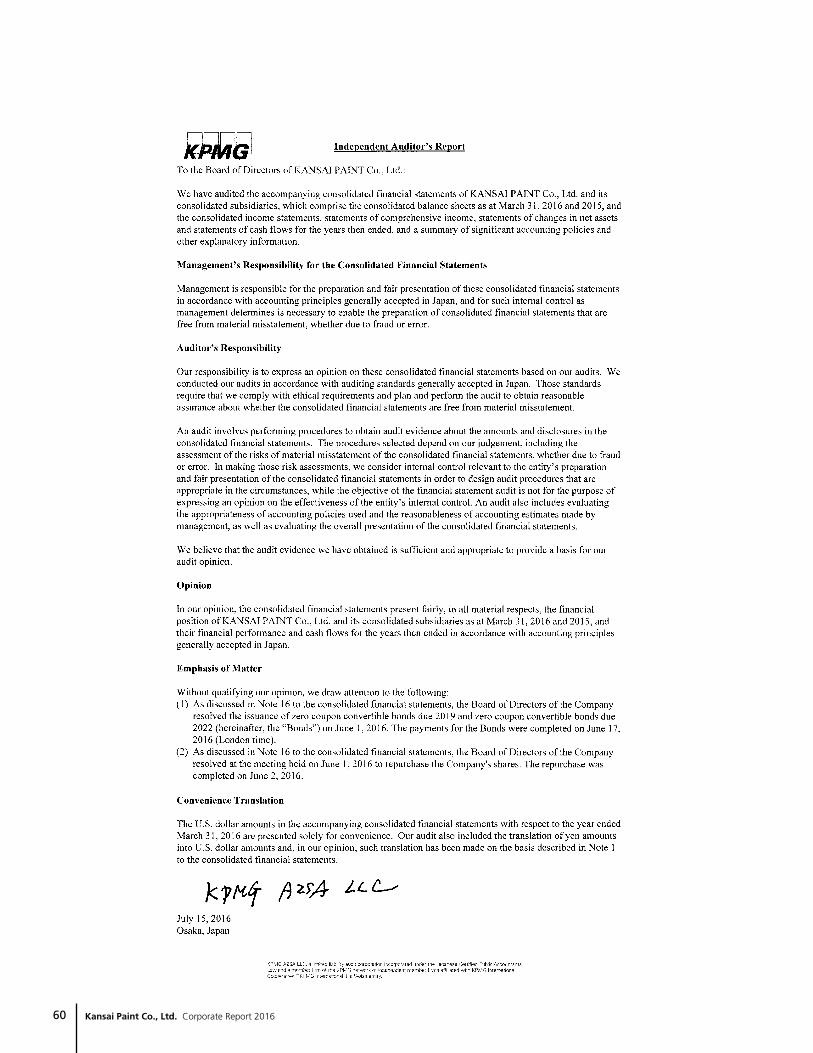
60 Kansai Paint Co., Ltd. Corporate Report 2016

Directory
HEAD OFFICE6-14, Imabashi 2-chome, Chuo-ku Osaka541-8523, JapanTel: 81-6-6203-5531 / Fax: 81-6-6203-5018
R&D CENTER17-1, Higashi-Yawata 4-chome,Hiratsuka-shi, Kanagawa 254-8562, JapanTel: 81-463-23-2100 / Fax: 81-463-24-0637
KANSAI PAINT (AMERICA), INC.5455 Corporate Drive, Suite 205 Troy, MI 48098, U.S.A.Tel: 1-248-952-0533 / Fax: 1-248-952-0538
PPG KANSAI AUTOMOTIVE FINISHES U.S., LLCTroy-Automotive Technical Center, 5875 NewKing Court, Troy, MI 48098, U.S.A.Tel: 1-248-641-2010 / Fax: 1-248-641-2266
KANSAI PAINT EUROPE LTD.Level 7 Westgate House, Westgate Road, Ealing London W5 1YY, United KingdomTel: 44-20-8799-0377 / Fax: 44-20-8799-0303
PPG KANSAI AUTOMOTIVE FINISHES UK, LLP4th Floor, Trigate 210-222 Hagley Road WestBirmingham, B68 ONP, UKTel: 44-12-1423-7300 / Fax: 44-12-1434-5346
DNT KANSAI MEXICANA S.A. DE C.V.Prolongacion Avenida Juarez Sur # 801-3 Localidad La Trinidad, San Francisco de los Romo, Ags. MexicoTel: 465-967-2014
KANSAI ALTAN BOYA SANAYI VE TICARET A.S.Ankara Asfalti 25.km 35730 Kemalpasa, IzmirTurkeyTel: 90-232-870-1470 / Fax: 90-232-877-0070
KANSAI PAINT RUS LLCBuilding 9, Office 314 (3rd Floor), 10, Nizhnyaya Syromyatnicheskaya Street, Moscow, 105120, RussiaTel. 7-495-245-0086 / e-mail: [email protected]
KNK COATINGS CO., LTD.152, Poseunggongdan-ro, Poseung-eup Pyeongtaek-si, Gyeonggi-do, Korea,17959Tel: 82-31-684-6186 / Fax: 82-31-684-6190
COSCO KANSAI PAINT & CHEMICALS (SHANGHAI) CO., LTD.Room 1706, Baohua Center, No.355, West Guangzhong Road, Shanghai, 200072,ChinaTel: 86-21-3183-3988 / Fax: 86-21-3183-3900
COSCO KANSAI PAINT (SHANGHAI) CO., LTD.No.621 Huachuang Road, Jinshan District, Shanghai, ChinaTEL: 86-21-3158-8528
Overseas
Kansai Paint Co., Ltd. Corporate Report 2016 61
COSCO KANSAI PAINT & CHEMICALS (TIANJIN) CO., LTD.42, 5th Avenue, TEDATianjin, 300457, ChinaTel: 86-22-2529-2009 / Fax: 86-22-2532-0902
COSCO KANSAI PAINT & CHEMICALS (ZHUHAI) CO., LTD.Zhuhai Gaolan Port Economic Zone FineChemical Area, Zhuhai City, 519050, ChinaTel: 86-756-3986-152
CHONGQING KANSAI PAINT CO., LTD.9, Danlong Road, Nanping, Nan‘an DistrictChongqing, 400060, ChinaTel: 86-23-6283-4824 / Fax: 86-23-6283-7094
KANSAI PAINT (SHENYANG) CO., LTD.No.18, Shenxi Four East RoadEconomic & Technology, Development Zone 110143, Shenyang, ChinaTel: 86-24-2532-6390 / Fax: 86-24-2532-6395
TIANJIN WINFIELD KANSAI PAINT & CHEMICALS CO., LTD.No.95, Taihua Road, TEDA, Tianjin, 300457, ChinaTel: 86-22-6623-0159 / Fax: 86-22-6623-0152
HUNAN XIANGJIANG KANSAI PAINT CO., LTD.#16 Lixiang Road (W), Changsha Economy & Technology, Hunan, 410100, ChinaTel: 86-731-8403-7050 / Fax: 86-731-8487-8159
GUANGZHOU KANSAI PAINT CO., LTD.26, Huangge East 2nd Road, Huangge Nansha, Guangzhou, Guangdong, 511455, ChinaTel: 86-20-3468-4900 / Fax: 86-20-3468-4930
SUZHOU KANSAI PAINT CO., LTD.No.12 Fengxia-lu, Lujia Town, Kunshan CityJiangsu Province, 215331, ChinaTel: 86-512-5756-3372 / Fax: 86-512-5756-3374
CHONGQING ALESCO KANSAI PAINT CO., LTD.(Guan Xi Tu Liao), No.2, Huabei 2nd Road, Changushou Economic-Technological Development Area, Chongqing, 401221, ChinaTel: 86-23-8533-6559 / Fax: 86-23-8684-5046
ZHAOQING KANSAI SHENGLIAN POWDER COATING & TECHNOLOGY CO., LTD.Baoying Road, Linjiang Industrial Development High-tech Zone, Zhaoqing, Guangdong526238, ChinaTel: 86-758-3103-038 / Fax: 86-758-3893-789
KANSAI PAINT (CHINA) INVESTMENT CO., LTD.Room 901/912, Sunny Days City, No.425Yishan Road, Xuhui District, Shanghai, 200235, ChinaTel: 86-21-5093-9636 / Fax: 86-21-5093-9616
KANSAI PAINT TRADING (SHANGHAI) CO., LTD.Room 901/912, Sunny Days City, No.425Yishan Road, Xuhui District, Shanghai, 200235, ChinaTel: 86-21-5093-9636 / Fax: 86-21-5093-9616
TAIWAN KANSAI PAINT CO., LTD.No.6, Yungkong 2nd Road, Yung-anIndustrial District, Kaohsiung City, Taiwan R.O.C.Tel: 886-7-622-3171 / Fax: 886-7-623-0155
KANSAI PAINT (SINGAPORE) PTE. LTD.74 Joo Koon Circle, Singapore 629093Tel: 65-6261-8621 / Fax: 65-6265-0301
KANSAI PAINT PHILIPPINES, INC.Unit 8-A South Luzon International Business Park,Brgy. Batino, Calamba City, Laguna 4027PhilippinesTel: 63-2-519-4276 / Fax: 63-2-519-4276
KANSAI-ALPHANAM PAINT CO., LTD.3rd floor, Alphanam building, 47 Vu Trong Phung, Thanh Xuan, Ha Noi, Viet NamTel: 84-4-3939-7979 / Fax: 84-4-3557-8420
THAI KANSAI PAINT CO., LTD.180 Moo 3 Thaeparak Rd., Thaeparak, Amphur Muang Samutprakarn 10270, ThailandTel: 66-2-753-2377 / Fax: 66-2-753-2774
KANSAI RESIN (THAILAND) CO., LTD.34 Moo 4, Eastern Seaboard Industrial Estate(Rayong), Yuddhasart Road, TambolPluakdaeng, Amphur Pluakdaeng, Rayong21140, ThailandTel: 66-3-895-4743-49 / Fax: 66-3-895-4751-2
SIME KANSAI PAINTS SDN. BHD.2, Solok Waja, 2 Kawasan Perindustrian Bukit Raja, 41710 Klang, Selangor D.E. MalaysiaTel: 60-3-3343-4833 / Fax: 60-3-3348-7806
KANSAI PAINT ASIA PACIFIC SDN. BHD.4, Solok Waja, 2 Kawasan Perindustrian Bukit Raja, P.O. Box 159, 41710 Klang, Selangor D.E. MalaysiaTel: 60-3-3362-2388 / Fax: 60-3-3342-7223
PT KANSAI PAINT INDONESIABlok DD-7 & DD-6, Kawasan IndustriMM2100, Cikarang Barat, Bekasi, Jawa Barat17520, IndonesiaTel: 62-21-8998-2370 / Fax: 62-21-8998-3868
PT KANSAI PRAKARSA COATINGSJI. Hayam Wuruk 28 Lt. 4, Jakarta 10120,IndonesiaTel: 62-21-385-4121 / Fax: 62-21-385-4119
KANSAI NEROLAC PAINTS LTD.Ganpatrao Kadam Marg, Lower Parel Mumbai 400013, IndiaTel: 91-22-2493-4001 / Fax: 91-22-2491-9439
KANSAI PAINT MIDDLE EAST FZCOSuite # 2201, Boulevard Plaza Tower One Downtown Dubai, PO Box 262460, Dubai, UAETel: 971-4-388-2221 / Fax: 971-4-388-2222
KANSAI PLASCON AFRICA LTD.10 Frederick Cooper Drive, Factoria, Krugersdorp, 1739, South AfricaTel: 27-11-951-4500 / Fax: 27-11-955-2841
6-14, Imabashi 2-chome, Chuo-ku,Osaka 541-8523, JapanTel : 81-6-6203-5531Fax: 81-6-6203-5018
http://www.kansai.co.jp
Printed in Japan
The Corporate Report 2016 of Kansai Paint Co., Ltd. has been certified with the following marks as a printed document showing consideration for the environment.
KA
NSA
I PAIN
T CO
., LTD. C
orporate Report 2016