corporate presentation - trinity exploration & production€¦ · · 2017-06-27corporate...
TRANSCRIPT
Corporate Presentation
London Oil Capital Conference, June 2017 – Bruce Dingwall, CBE
Disclaimer
This presentation and its contents are confidential and are being supplied to you solely for your
information and may not be reproduced, re-distributed or passed to any other person or published in
whole or in part for any purpose. Failure to comply with these restrictions may constitute a violation of
applicable securities laws. Certain information contained in this document is non-public, proprietary and
highly confidential. Accordingly, by accepting and using this document, you will be deemed to agree not
to disclose any information contained herein except as may be required by law. Some of the information
contained in this document has not yet been announced pursuant to the AIM Rules of the London Stock
Exchange plc or otherwise and as such constitutes relevant information for the purposes of (amongst
other things) section 118 of the Financial Services and Markets Act 2000 (as amended), inside
information for the purposes of the EU Market Abuse Regulation (596/2014) and non-public price
sensitive information for the purposes of the Criminal Justice Act 1993. Recipients of this document
should not therefore deal in any way in any shares of the Company until the formal announcement by
the Company of such information. Dealing in shares of the Company in advance of this date may result
in civil and/or criminal liability. By accepting and using this document, you will be deemed to consent to
the receipt of inside information contained herein.
This presentation is not and is not intended to be a prospectus and does not or is not intended to
constitute or form part of any offer for sale or solicitation of any offer to buy or subscribe for any
securities in Trinity Exploration & Production plc (the "Company") in any jurisdiction. It shall not form the
basis of, or be relied on in connection with, or act as invitation or inducement to enter into, any contract
or commitment whatsoever. No offer of securities is being or will be made in circumstances which would
require a prospectus or similar document to be approved.
While the information contained in this presentation, which does not purport to be comprehensive, is
believed to be accurate, neither the Company nor any other person has conducted any investigation
into or verified such information. No representation or warranty, express or implied, is or will be given by
the Company or its directors, officers, employees or advisers or any other person as to the accuracy,
completeness or fairness of this presentation and, so far as permitted by law and except in the case of
fraud, no responsibility or liability whatsoever is accepted for the accuracy or sufficiency of any of the
information contained in this presentation or for any errors, opinions, omissions or misstatements,
negligent or otherwise relating to this presentation. Each recipient must conduct its own independent
investigation and analysis of the Company and of the information contained in this presentation and
bear all the costs of doing so.
This presentation may include certain "forward looking" statements which are based on expectations,
projections and forecasts relating to the future performance of the Company. Such statements,
projections and forecasts, which are intended as a guide only, represent the Company's own
assessment and interpretation of information available to it at the date of this presentation and reflect
significant assumptions and subjective judgements by the Company. A number of factors could cause
actual results to differ materially from the potential results discussed in such forward looking
statements, estimates and forecasts, including (but not limited to) changes in general economic and
market conditions and all other risk factors (whether political, regulatory or otherwise) associated with
offshore exploration, development and production. In all cases, recipients should conduct their own
investigation and analysis of the information contained in this presentation. No representation or
warranty is made or assurance given that the statements, projections and forecasts contained in this
presentation will be borne out in practice or that the Company will perform as projected and the
Company does not assume responsibility for verifying any of such statements, projections or forecasts.
Neither the Company nor any persons shall be liable for any direct, indirect or consequential loss or
damage suffered by any person as a result of relying on any statement in or omission from this
presentation.
This presentation has been made available to recipients for information only. The Company gives no
undertaking to provide the recipient with access to any additional information or to update this
presentation or any additional information or to correct any inaccuracies in it which may become
apparent.
No person has approved (for the purposes of section 21 of the Financial Services and Markets Act
2000 (the “FSMA”)) the contents of, or any part of, this presentation. This presentation is only directed
at persons who have professional experience in matters relating to investments and who: a) in relation
to persons resident in the UK, fall within the exemptions contained in Articles 19 or 49 of the Financial
Services and Markets Act 2000 (Financial Promotion) Order 2005, as amended (including certain
investment professionals, high net worth companies, unincorporated associations or partnerships and
the trustees of high value trusts); or b) in relation to U.S. Persons (as defined in Rule 902 of Regulation
S under the U.S. Securities Act of 1933, as amended (the “Securities Act”)), are an “accredited investor”
within the meaning of Rule 501 of Regulation D under the Securities Act; or c) in relation to persons
resident in Trinidad or Tobago, are accredited investors as defined in and in accordance with the
Securities Act 2012 of the laws of Trinidad and Tobago and are permitted to receive them or d) are
otherwise permitted by the laws of the jurisdiction in which they are resident to receive them; and e) in
relation to persons in member states of the European Economic Area (“EEA”), are a “professional
client” or an "eligible counterparty" within the meaning of Article 4 (1)(II) and 24(2), (3) and (4),
respectively, of Markets in Financial Instruments Directive (Directive 2004/39/EC) (“MiFID”) as MiFID is
implemented into national law of the relevant EEA state.
Persons falling within one of the categories of persons described above must comply with the terms of
this disclaimer and they will conduct their own analyses or other verification of the data set out in this
presentation and bear the responsibility for all or any costs incurred in doing so. Persons who do not fall
within one of the categories of persons described above should not rely on this presentation nor take
any action upon it
Neither this presentation nor any copy of it may be taken or transmitted into the United States of
America or its territories or possessions (the "United States"), or distributed, directly or indirectly, in the
United States, or to any U.S. Person as defined in Regulation S under the Securities Act, including U.S.
resident corporations, or other entities organized under the laws of the United States or any state
thereof or non-U.S. branches or agencies of such corporations or entities or into Canada, Australia,
Japan the Republic of Ireland, or the Republic of South Africa, except in compliance with applicable
securities laws. Any failure to comply with this restriction may constitute a violation of United States or
other national securities laws.
This presentation is confidential and should not be distributed, published or reproduced (in
whole or in part) or disclosed by its recipients to any other person for any purpose, other than
with the consent of the Company.
By accepting receipt of, attending any delivery of, or electronically accessing, this presentation, you
agree to be bound by the above limitations and conditions and, in particular, you represent, warrant and
undertake to the Company that you will not forward the presentation to any other person, or reproduce
or publish this document, in whole or in part, for any purpose and you have read and agree to comply
with the contents of this notice.
© Trinity Exploration 2017
2

3

4
• Prolific hydrocarbon basin that forms
part of Eastern Venezuelan basin
• 11 km from the Venezuelan coast
(Venezuela has world’s largest
proven oil reserves)
• Commercial production since 1910
and 3.5 billion bbl of oil (1.6 billion
bbl onshore)
• Significant exporter of ammonia,
methanol and LNG
• 168,000 bbls/d refinery (throughput
c. 113,000 bbls/d)
• Sophisticated oilfield services
industry
An world class established basin

What we areProfitable Production & Growth
• 100% Trinidad focused
• 100% Trinidad managed
• A local oil producer of scale (3.4% of total country oil production)
• A large well inventory (1,165 wells across 9 licenses)
• Multiple reservoirs to target (lower risk)
• Parallel activity sets (reduce risk) to increase production
• Large reserve base (2P reserves of 21.3 MMbbls)
• A low cost operator
• Cash flow positive & profitable
• Interests aligned – Board share ownership c. 24%
• Listed on AIM (TRIN.L)
5

Who we areThe Board
6
Bruce Dingwall CBE
Executive Chairman
(Exxon/Lasmo /Venture)
Jeremy Bridglalsingh
Chief Financial Officer
(PwC)
David Segel
Non-executive Director
(Mako Securities)
Angus Winther
Non-executive Director
(Lexicon/Evercore)
James Menzies
Non-executive Director
(Salamander/Lasmo)

Who we are
7
Nirmala Maharaj
Country Manager
(GOTT)
Raj Rajpaulsingh
Chief Operations Officer
(BP)
Tracy Mackenzie
Corporate Development
(Brewin Dolphin/Panmure)
Graham Stuart
Production
(Schlumberger/BP/Venture)
Tim Daley
Subsurface
(Exxon/Lasmo/BG)
Denesh Ramnarace
Commercial Manager
(Primera/Parex)
LOCALLY MANAGED
UK SUPPORTED

History: Venture > TDN > Trinity
TDN 2006 - 2012
• Spun out of Venture 2006
• Drilled 17 onshore wells
• Shot offshore OBC 3D
• Completed two asset deals
• Production from 1,000 bopd to ~
2,000 bopd
• US$35 million in cash end 2012
• Negligible debt
• Continuously profitable
8
TRINITY 2013 - 2017
• RTO of Bayfield Energy 2013
• c.3,700 bopd combined production
• Offshore production challenges at
IPO
• Onshore production steady at
c.2,000 bopd pre-financial
challenges (10 new wells)
• Production shortfall coupled with fall
in oil price resulted in indebtedness
• Change out of management team
2015
• Creditors settlement agreed Jan
2017 with the raising of US$15 in
new equity

Corporate SnapshotAs at 23 June 2017
Market Statistics
AIM Market Symbol TRIN
Share Price 10.75p
Current Shares in issue (mm) 282,399,986
Market Capitalisation £30.4m : $37.9mm
Net cash (inc. 12M working capital: current assets – current liabs – debt) £3.6m : $4.5mm
Enterprise Value £26.8mm : $33.4mm
Enterprise value per barrel of 2P reserves 1.6
Enterprise Value per barrel of 2P reserves + 2C (US$/2P+2C) 0.8
Enterprise Value per flowing barrel (US$/bopd) 13,158
9
Production, Reserves & Resources
2016 average production (bopd) 2,542
2016 2P Reserves (MMbbls) 21.3
2016 Contingent Resources, 2C, (MMbbls) 21.0
Additional significant STOIIP (MMstbbls) in the
Galeota anticline to be further appraised and developed
266

Financial Transformation
Details 2013 2014 2015 2016 H1 2016
Realised Price (USD/bbl) 91.6 85.8 45.5 32.8 39.4
Production (bopd)
Onshore 2,088 2,005 1,601 1,430 1,343
West Coast 493 491 312 211 190
East Coast 1,110 1,105 983 1,018 1,009
Consolidated 3,691 3,601 2,896 2,659 2,542
Operating Break Even (USD/bbl)1
Onshore1 19 21.3 23.3 18.4 17.4
West Coast1 21.2 24.5 40.7 34.9 37.7
East Coast1 69.8 55.9 41.3 30.1 26.3
Consolidated362.9 64.6 47.4 30.0 29.1
Metrics (USD/bbl)
Opex/bbl - Onshore 12.8 14.4 15.7 12.4 11.8
Opex/bbl – West Coast 17.4 20.2 33.8 29.1 31.6
Opex/bbl – East Coast 52 41.6 31.6 23 20.1
G&A/bbl - Consolidated 13.8 11.4 9.9 3.8 4.5
10
Notes:
1. Operating Break-even: Revenue - Over-riding Royalty – Production Royalty – Opex
2. Operating Break-even: Revenue - Over-riding Royalty – Production Royalty – Opex – G&A
CONSOLIDATEDOPEX =
$16.8/bbl{

Indicative Production Economics@ US$45/bbl WTI
11
ECONOMICS @ US$45/bbl WTI
Production Scenario 2,500 bopd 3,000 bopd
Operating netback $9.0/bbl $12.2/bbl
Royalties* $12.2/bbl $12.2/bbl
Operating costs* $19.4/bbl $16.2/bbl
Assumed disc. to WTI $4.5/bbl $4.5/bbl
Indicative Annualised 2,500 bopd 3,000 bopd
Produced Volumes (bbls) 912,500 1,095,000
Implied Gross Revenues $37.0mm $44.3mm
Implied Operating Netback $8.2mm $13.3mm
* Per bbl royalties and operating costs (opex) proxies based on expected amounts.

Significant Reserves & Resources
• 2P Reserves plus 2C Contingent
Resources of c. 42.3 MMboe
• 2P Reserves: East Coast: 14.7
MMbbls, Onshore 4.0 MMbbls &
West Coast 2.6 MMbbls
• Additional net high prospective
resources of c.20 MMbbls in the NE
of Galeota (offshore East Coast)
• Based on assumption of a
conservative 11% recovery factor,
RF, (266 MMstb STOIIP)
• Offshore the East Coast further
development potential exists along
the Galeota anticline to the North
East
12
* All reserves and resources estimates are management estimates for the y/e 2016
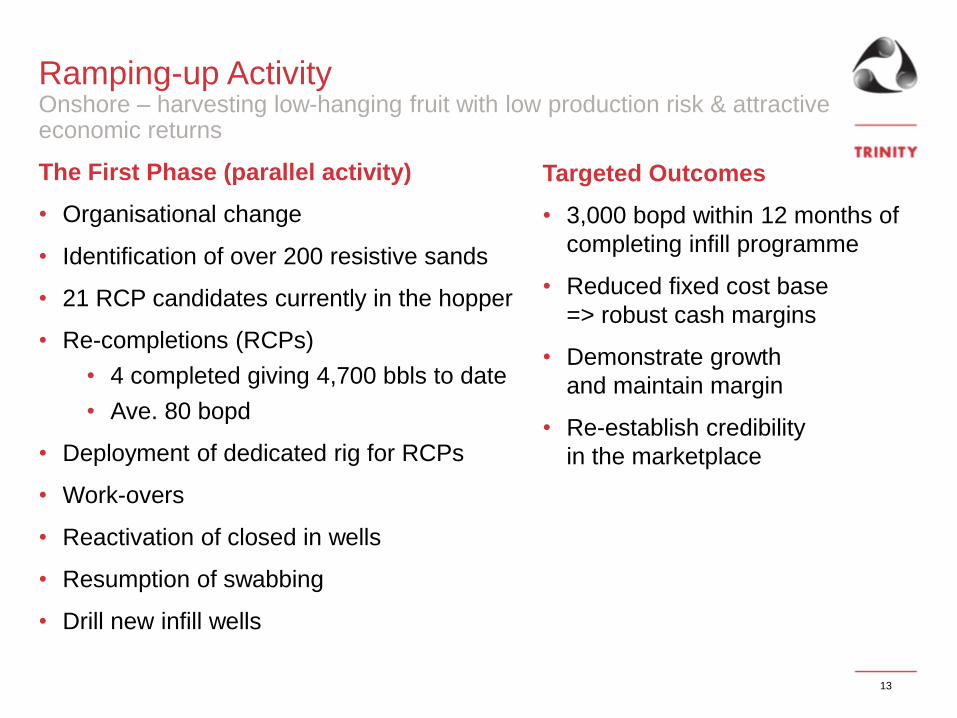
Ramping-up ActivityOnshore – harvesting low-hanging fruit with low production risk & attractive economic returns
The First Phase (parallel activity)
• Organisational change
• Identification of over 200 resistive sands
• 21 RCP candidates currently in the hopper
• Re-completions (RCPs)
• 4 completed giving 4,700 bbls to date
• Ave. 80 bopd
• Deployment of dedicated rig for RCPs
• Work-overs
• Reactivation of closed in wells
• Resumption of swabbing
• Drill new infill wells
Targeted Outcomes
• 3,000 bopd within 12 months of
completing infill programme
• Reduced fixed cost base
=> robust cash margins
• Demonstrate growth
and maintain margin
• Re-establish credibility
in the marketplace
13

Offshore Context: Galeota BlockComplete re-interpretation & re-evaluation
Inherited Poor Sub-surface model -> suspended drilling (2014)
• Re processed OBC 3D dataset and cable streamer dataset (merged)
• Following seismic re-interpretation developed new Petrel 3D model
• Calculated new STOOIP and reserves (6 producing horizons)
• Derived RF from summation old production across the field (68 wells)
• Sub surface model now made sense (RF, water cut, reservoir)
• Looked for areas with low RF for infill drilling
• High graded best 4 in fill locations (to utilise available riser slots)
• Carried interpretation to the NE towards TGAL and Block boundary
Work largely completed Q2 2015, including draft FDP for TGAL
14

Ramping-up Activity - OffshoreOffshore – offers potential for transformational step-change
Parallel Activity Sets
• Daily well monitoring
• SLB – ‘Lift Watcher’
• Power generation (smooth)
• ESP life (150 days now
>1,300 days)
• Work-overs
• Using in situ cranes
• Re-completions (RCPs)
• Drill Trintes infill locations 2018/9
• Well planning, rig upgrades,
costing
Targeted Outcomes
• Increased uptime and life of ESP’s
• Maintaining base production
• Higher IP rates =.> new wells
(~300 bopd/well) offers step-
change potential (4 in planning,
inventory of >20)
• 3,400 bopd run-rate (group)
potential in medium term
• Leverage effect => higher cash
margins
• Greater PROFIT
15

Galeota, Infrastructure & Field Analogies
16
Samaan
Teak
Poui
Trintes
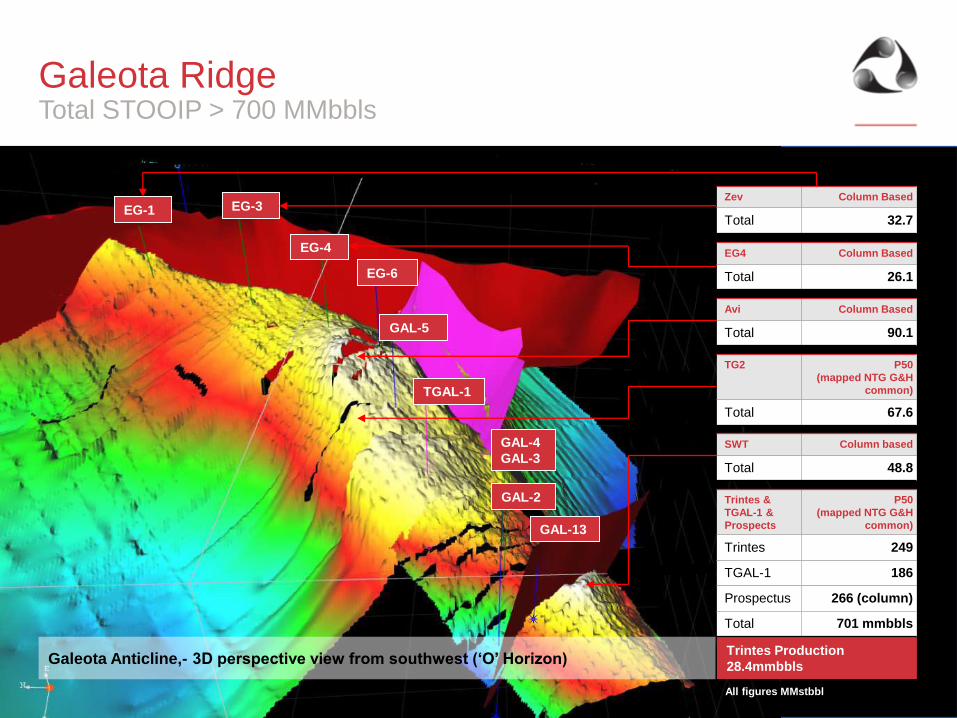
Galeota RidgeTotal STOOIP > 700 MMbbls
17
EG-3
EG-4
EG-6
GAL-5
TGAL-1
GAL-4
GAL-3
GAL-2
GAL-13
EG-1Zev Column Based
Total 32.7
EG4 Column Based
Total 26.1
Avi Column Based
Total 90.1
TG2 P50
(mapped NTG G&H
common)
Total 67.6
SWT Column based
Total 48.8
Trintes &
TGAL-1 &
Prospects
P50
(mapped NTG G&H
common)
Trintes 249
TGAL-1 186
Prospectus 266 (column)
Total 701 mmbbls
Trintes Production
28.4mmbblsGaleota Anticline,- 3D perspective view from southwest (‘O’ Horizon)
All figures MMstbbl


Trintes Infill drillingTGAL updip extension of Trintes
19
FAULT PANEL 1
FAULT PANEL 5
1,200m

Trintes & The Galetoa RidgeExisting Production & Phased Development
• Trintes – profitable today ->20 infill locations – 2018/19 drilling
• Infill locations reached from Delta and Bravo platform
• 700 MMbbls STOOIP – analagous to Teak/Poui/Samaan Fields
• A phased risk mitigated development scenario
• Access east Galeota anticline (TGAL area east of Trintes)
undeveloped reserves via ‘barebones’ jack up using Trintes
modular drilling rig with umbilical power and walk way from
Alpha
• High angle to near horizontal wells to give potential IP’s of 500-
800 bopd. Multi stage completion with ESP support
• Potential for early water injection to maintain higher production
rates and raise recovery factors from 15% to ~30%
20
GROW PROFITABLE PRODUCTION -> GALEOTA RIDGE IS
TRANSFORMATIONAL

Summary
Re-capitalized with a solid foundation for growth: significant & well defined
upside
• 2,500 bopd today– critical operating mass and reserves
• Re-structured & re-capitalized successfully
• Large inventory both onshore and offshore
• Low cost production access via reactivations, work-overs, RCPs and new wells
• Locally managed, low cost operation
• Reduced risk to low oil prices due to low OPEX, hedging (35% of current production
@ $40/bbl) and significant carried tax losses
• Growth driven from within current portfolio (plus Galeota Ridge upside)
• Focused
TRINITY IS NOT AN IDEA – IT IS A WELL ESTABLISHED PROFITABLE BUSINESS
21

Glossary of abbreviations
2P/2C Proved plus probable reserves, Best Case Contingent resources
AIM London Stock Exchange’s international market for smaller growing companies
bbl barrel
bopd barrels of oil per day
boepd barrels of oil equivalent per day
EBITDA Earnings before interest and tax, depreciation and amortization.
FSP Formal Sales Process
G&A General and Administrative
OPEX Operating Expenditure
mm / MM million
mmbbls million barrels
mmstb million stock tank barrels
RCP Recompletions
SPA Share Purchase Agreement
SPT Supplemental Petroleum Tax
STOIIP Stock Tank Oil Initially in Place
USD/$ United States Dollars
WO Workover
WTI West Texas Intermediate
22