corporate presentation - natco · pdf filedisclaimer / important disclosure this presentation...
TRANSCRIPT
CORPORATE PRESENTATION
August 2017
Disclaimer / Important Disclosure
This presentation has been prepared by Natco Pharma Limited (the “Company”) solely for information purposes without regard to any specific objectives, financial
situations or informational needs of any particular person. This presentation should not be construed as legal, tax, investment or other advice. This presentation is
confidential, being given solely for your information and for your use, and may not be copied, distributed or disseminated, directly or indirectly, in any manner.
Furthermore, no person is authorized to give any information or make any representation which is not contained in, or is inconsistent with, this presentation. Any
such extraneous or inconsistent information or representation, if given or made, should not be relied upon as having been authorized by or on behalf of the
Company. The distribution of this presentation in certain jurisdictions may be restricted by law. Accordingly, any persons in possession of this presentation should
inform themselves about and observe any such restrictions. Furthermore, by reviewing this presentation, you agree to be bound by the trailing restrictions
regarding the information disclosed in these materials. This presentation contains statements that constitute forward-looking statements. These statements include
descriptions regarding the intent, belief or current expectations of the Company or its directors and officers with respect to the results of operations and financial
condition of the Company. These statements can be recognized by the use of words such as “expects,” “plans,” “will,” “estimates,” “projects,” or other words of
similar meaning. Such forward-looking statements are not guarantees of future performance and involve risks and uncertainties, and actual results may differ from
those specified in such forward-looking statements as a result of various factors and assumptions. The risks and uncertainties relating to these statements include,
but are not limited to, (i) fluctuations in earnings, (ii) the Company’s ability to manage growth, (iii) competition, (iv) government policies and regulations, and (v)
political, economic, legal and social conditions in India/ elsewhere. The Company does not undertake any obligation to revise or update any forward-looking
statement that may be made from time to time by or on behalf of the Company. Given these risks, uncertainties and other factors, viewers of this presentation are
cautioned not to place undue reliance on these forward-looking statements.
The information contained in this presentation is only current as of its date and has not been independently verified/ authenticated and are based upon to the best
of the knowledge, belief and information. The Company may alter, modify or otherwise change in any manner the contents of this presentation, without obligation
to notify any person of such revision or changes. No representation, warranty, guarantee or undertaking, express or implied, is or will be made as to, and no
reliance should be placed on, the accuracy, completeness, correctness or fairness of the information, estimates, projections and opinions contained in this
presentation. None of the Company or any of its affiliates, advisers or representatives accept any liability of whatsoever nature for any loss howsoever arising from
any information presented or contained in this presentation. Please note that the past performance of the Company is not, and should not be construed as,
indicative of future results. A number of adjusted measures are used to report the financial performance of our company. Potential investors must make their own
assessment of the relevance, accuracy and adequacy of the information contained in this presentation and must make such independent investigation as they may
consider necessary or appropriate for such purpose. Such information and opinions are in all events not current after the date of this presentation.
None of the Company, any placement agent or any other persons that may participate in the offering of any securities of the Company shall have any responsibility
or liability whatsoever for any loss howsoever arising from this presentation or its contents or otherwise arising in connection therewith. This presentation does not
constitute or form part of and should not be construed as, directly or indirectly, any offer or invitation or inducement to sell or issue, or any solicitation of any offer
to purchase or subscribe for, any securities of the Company by any person in any jurisdiction, including in India or elsewhere, nor shall it or any part of it or the fact
of its distribution form the basis of, or be relied on in connection with, any investment decision or any contract or commitment therefore.. This presentation is not a
prospectus, a statement in lieu of a prospectus, an offering circular, an advertisement or an offer document under the Companies Act, 2013, as amended, the
Securities and Exchange Board of India (Issue of Capital and Disclosure Requirements) Regulations, 2009, as amended, or any other applicable law in India. We
undertake no obligation arising out of this information or any consequence arising therefrom.
2
Natco Pharma at a Glance
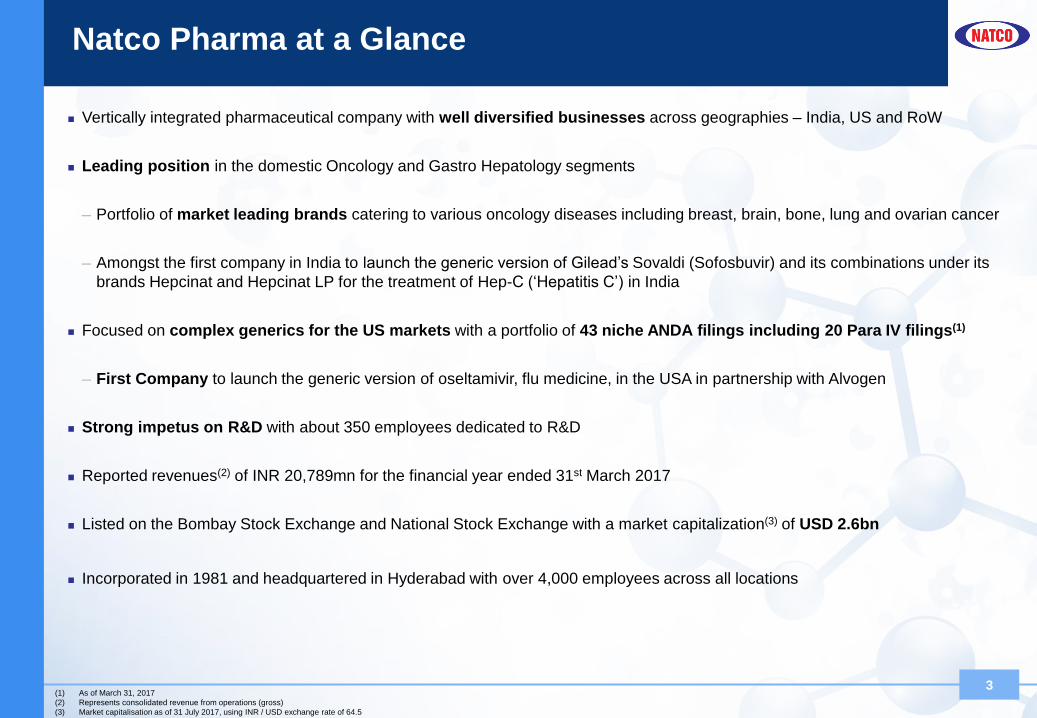
Vertically integrated pharmaceutical company with well diversified businesses across geographies – India, US and RoW
Leading position in the domestic Oncology and Gastro Hepatology segments
─ Portfolio of market leading brands catering to various oncology diseases including breast, brain, bone, lung and ovarian cancer
─ Amongst the first company in India to launch the generic version of Gilead’s Sovaldi (Sofosbuvir) and its combinations under its
brands Hepcinat and Hepcinat LP for the treatment of Hep-C (‘Hepatitis C’) in India
Focused on complex generics for the US markets with a portfolio of 43 niche ANDA filings including 20 Para IV filings(1)
─ First Company to launch the generic version of oseltamivir, flu medicine, in the USA in partnership with Alvogen
Strong impetus on R&D with about 350 employees dedicated to R&D
Reported revenues(2) of INR 20,789mn for the financial year ended 31st March 2017
Listed on the Bombay Stock Exchange and National Stock Exchange with a market capitalization(3) of USD 2.6bn
Incorporated in 1981 and headquartered in Hyderabad with over 4,000 employees across all locations
3(1) As of March 31, 2017
(2) Represents consolidated revenue from operations (gross)
(3) Market capitalisation as of 31 July 2017, using INR / USD exchange rate of 64.5
Consolidated results for year ended 31 March 2017 are in compliance with Indian Accounting Standards (Ind AS) notified by the Ministry of Corporate Affairs and results for the year ended 31 March 2016 have been restated to comply with Ind AS. Results for the financial years ended 31 March 2015 and 31
March 2014 are as per Indian GAAP
(1) Represents consolidated gross revenue and includes other income
(2) Represents PAT after minority interest
0
100
200
300
400
500
600
700
May-14 Sep-14 Jan-15 May-15 Sep-15 Jan-16 May-16 Sep-16 Jan-17 May-17
Natco Pharma S&P BSE Healthcare
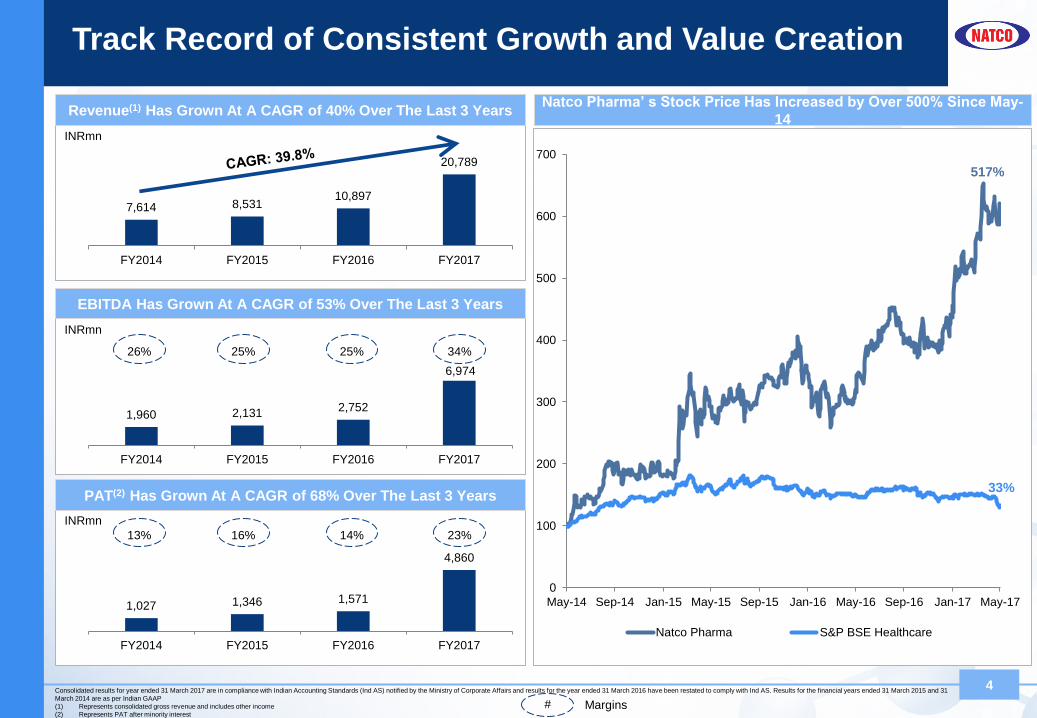
Track Record of Consistent Growth and Value Creation
7,614 8,531 10,897
20,789
FY2014 FY2015 FY2016 FY2017
Revenue(1) Has Grown At A CAGR of 40% Over The Last 3 Years
4
1,960 2,131 2,752
6,974
FY2014 FY2015 FY2016 FY2017
EBITDA Has Grown At A CAGR of 53% Over The Last 3 Years
1,027 1,346 1,571
4,860
FY2014 FY2015 FY2016 FY2017
PAT(2) Has Grown At A CAGR of 68% Over The Last 3 Years
26% 25% 25% 34%
13% 16% 14% 23%
# Margins
517%
33%
Natco Pharma’ s Stock Price Has Increased by Over 500% Since May-
14INRmn
INRmn
INRmn
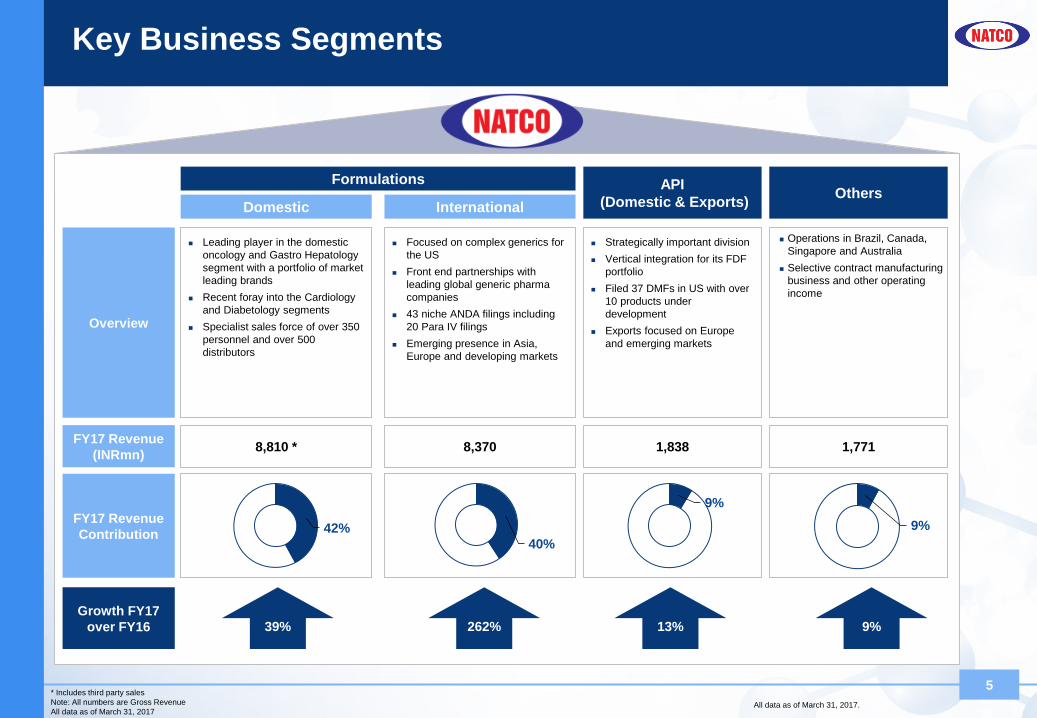
Key Business Segments
5
Strategically important division
Vertical integration for its FDF
portfolio
Filed 37 DMFs in US with over
10 products under
development
Exports focused on Europe
and emerging markets
Formulations
Operations in Brazil, Canada,
Singapore and Australia
Selective contract manufacturing
business and other operating
income
OthersAPI
(Domestic & Exports)
Overview
FY17 Revenue
(INRmn)1,838 1,771
FY17 Revenue
Contribution
Growth FY17
over FY16
International
Focused on complex generics for
the US
Front end partnerships with
leading global generic pharma
companies
43 niche ANDA filings including
20 Para IV filings
Emerging presence in Asia,
Europe and developing markets
8,370
40%
262% 13% 9%
* Includes third party sales
Note: All numbers are Gross Revenue
All data as of March 31, 2017All data as of March 31, 2017.
Leading player in the domestic
oncology and Gastro Hepatology
segment with a portfolio of market
leading brands
Recent foray into the Cardiology
and Diabetology segments
Specialist sales force of over 350
personnel and over 500
distributors
Domestic
8,810 *
39%
42%
9%
9%
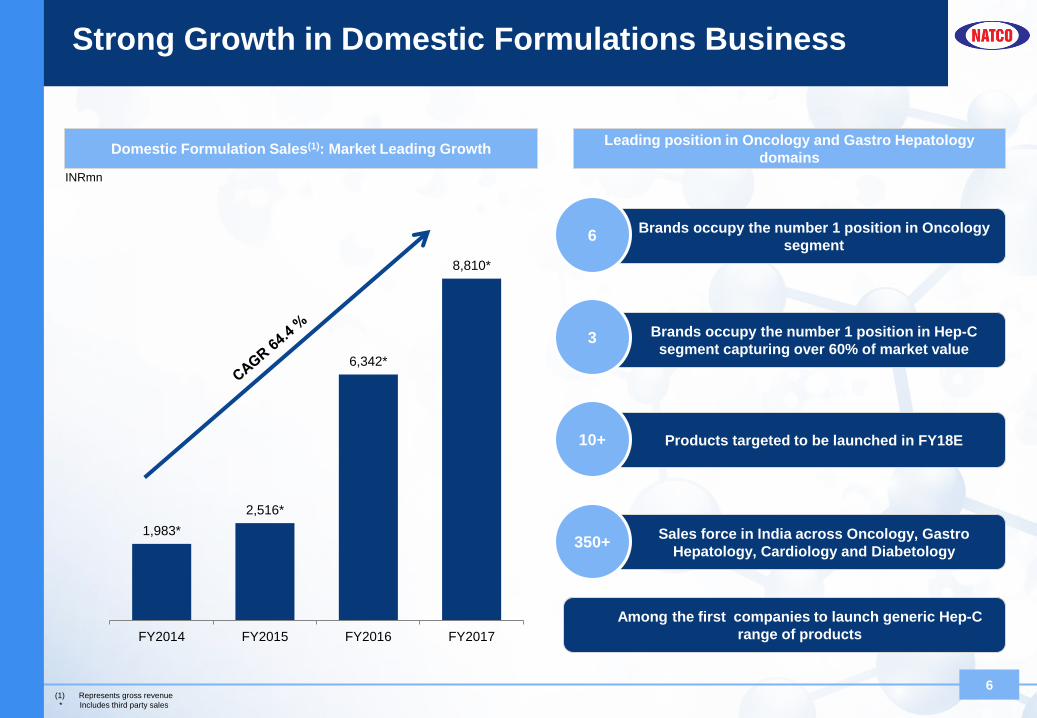
Strong Growth in Domestic Formulations Business
6
Domestic Formulation Sales(1): Market Leading Growth
1,983*
2,516*
6,342*
8,810*
FY2014 FY2015 FY2016 FY2017
Leading position in Oncology and Gastro Hepatology
domains
Brands occupy the number 1 position in Oncology
segment6
Brands occupy the number 1 position in Hep-C
segment capturing over 60% of market value3
Sales force in India across Oncology, Gastro
Hepatology, Cardiology and Diabetology 350+
INRmn
(1) Represents gross revenue
* Includes third party sales
Among the first companies to launch generic Hep-C
range of products
Products targeted to be launched in FY18E10+
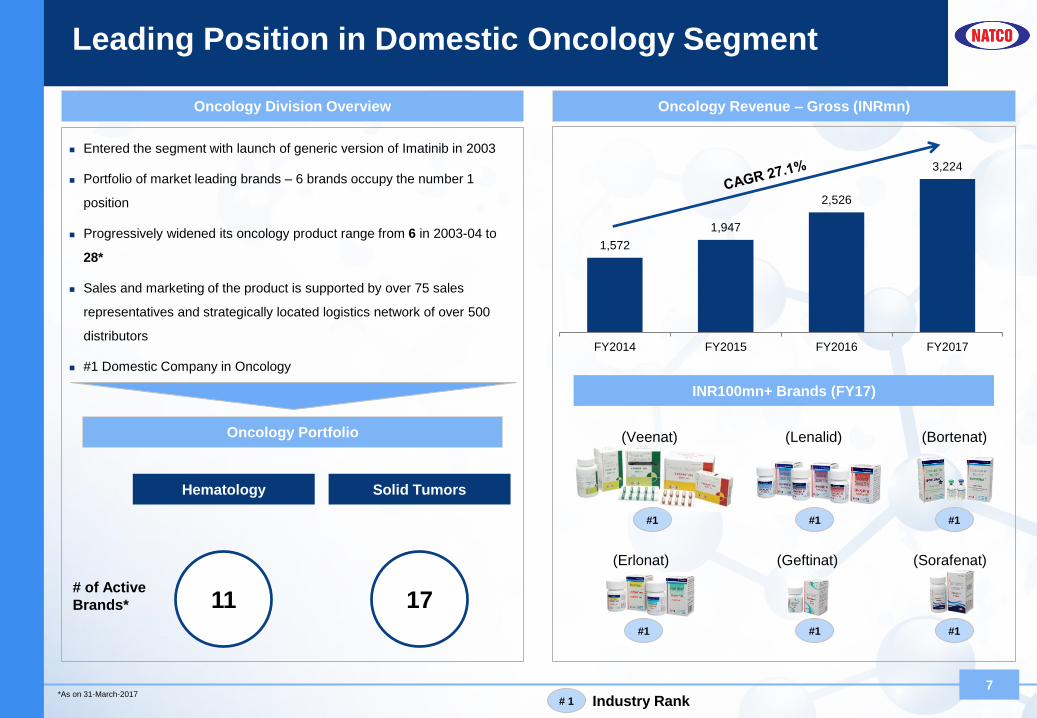
Leading Position in Domestic Oncology Segment
7
Entered the segment with launch of generic version of Imatinib in 2003
Portfolio of market leading brands – 6 brands occupy the number 1
position
Progressively widened its oncology product range from 6 in 2003-04 to
28*
Sales and marketing of the product is supported by over 75 sales
representatives and strategically located logistics network of over 500
distributors
#1 Domestic Company in Oncology
Oncology Portfolio
*As on 31-March-2017
Oncology Revenue – Gross (INRmn)Oncology Division Overview
Hematology Solid Tumors
11# of Active
Brands* 17
INR100mn+ Brands (FY17)
(Veenat)
#1
(Lenalid)
#1
(Erlonat) (Geftinat) (Sorafenat)
(Bortenat)
#1
#1 #1 #1
# 1 Industry Rank
1,572
1,947
2,526
3,224
FY2014 FY2015 FY2016 FY2017
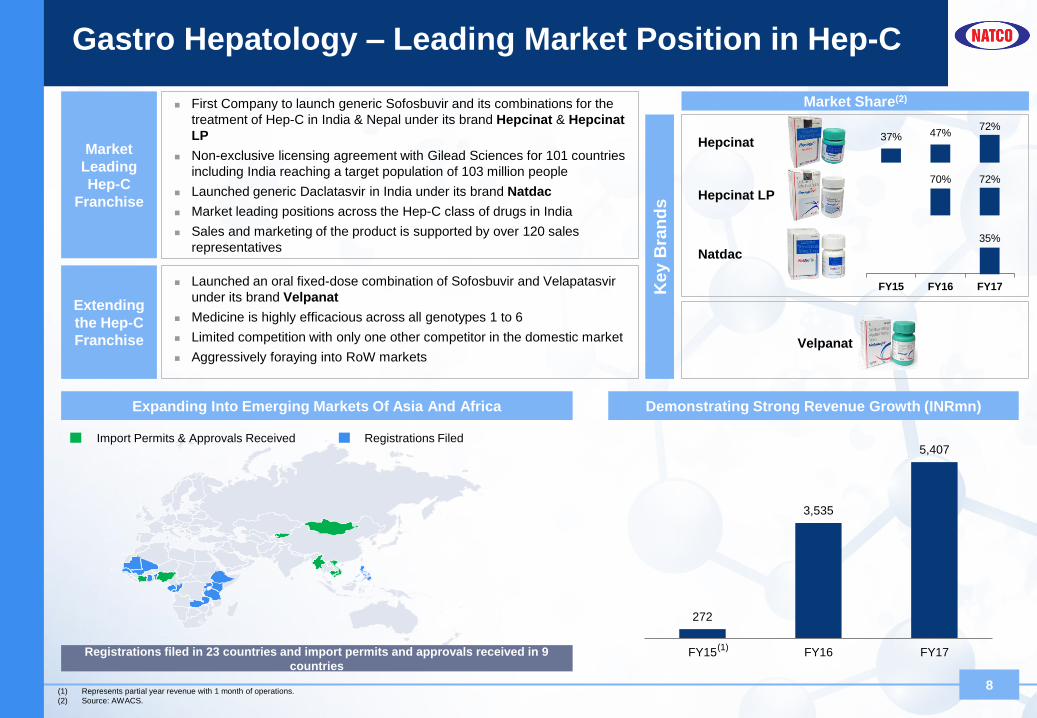
Gastro Hepatology – Leading Market Position in Hep-C
8
272
3,535
5,407
FY15 FY16 FY17
Demonstrating Strong Revenue Growth (INRmn)Expanding Into Emerging Markets Of Asia And Africa
Import Permits & Approvals Received Registrations Filed
(1)
(1) Represents partial year revenue with 1 month of operations.
(2) Source: AWACS.
Market
Leading
Hep-C
Franchise
Extending
the Hep-C
Franchise
First Company to launch generic Sofosbuvir and its combinations for the
treatment of Hep-C in India & Nepal under its brand Hepcinat & Hepcinat
LP
Non-exclusive licensing agreement with Gilead Sciences for 101 countries
including India reaching a target population of 103 million people
Launched generic Daclatasvir in India under its brand Natdac
Market leading positions across the Hep-C class of drugs in India
Sales and marketing of the product is supported by over 120 sales
representatives
Launched an oral fixed-dose combination of Sofosbuvir and Velapatasvir
under its brand Velpanat
Medicine is highly efficacious across all genotypes 1 to 6
Limited competition with only one other competitor in the domestic market
Aggressively foraying into RoW markets
Key B
ran
ds
Market Share(2)
Hepcinat
Hepcinat LP
Natdac
Velpanat
37% 47%72%
FY15 FY16 FY17
70% 72%
35%
Registrations filed in 23 countries and import permits and approvals received in 9
countries
Expanding Domestic Presence with Launch of New CnD
Division
9
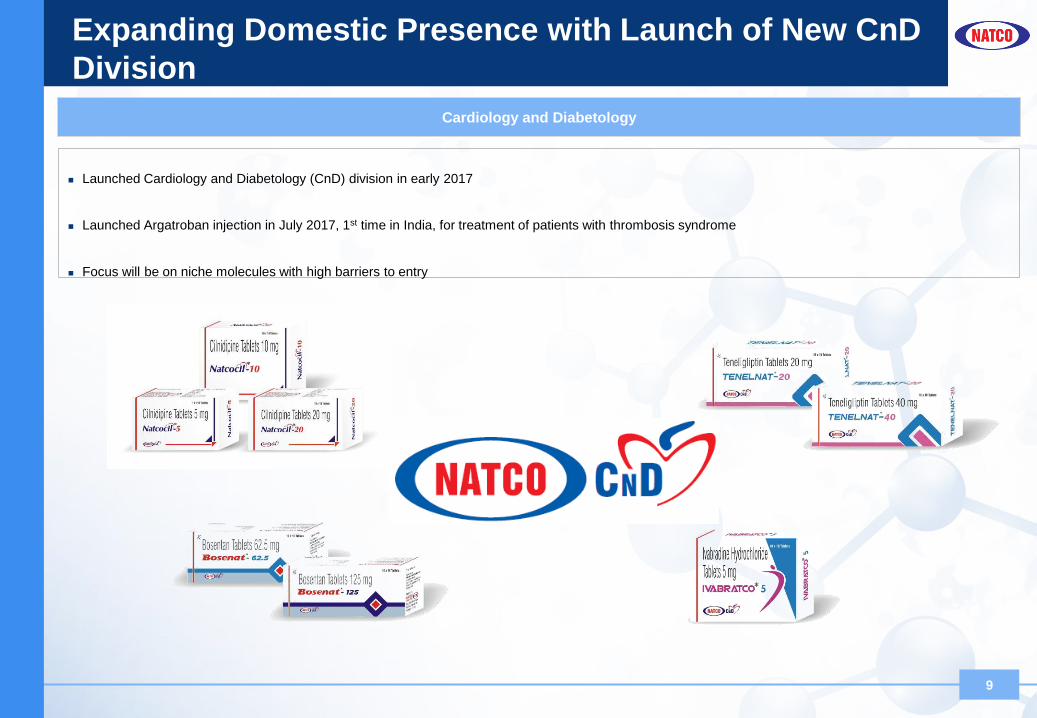
Cardiology and Diabetology
Launched Cardiology and Diabetology (CnD) division in early 2017
Launched Argatroban injection in July 2017, 1st time in India, for treatment of patients with thrombosis syndrome
Focus will be on niche molecules with high barriers to entry
US Market - Focus on Complex Generics
10
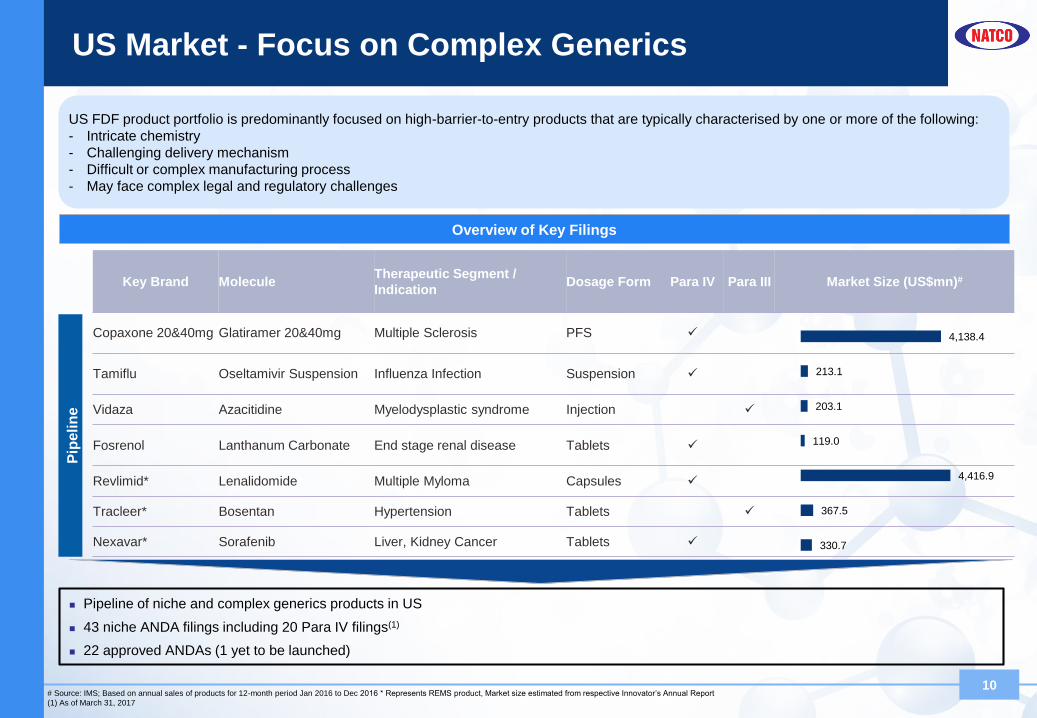
Overview of Key Filings
Pipeline of niche and complex generics products in US
43 niche ANDA filings including 20 Para IV filings(1)
22 approved ANDAs (1 yet to be launched)
# Source: IMS; Based on annual sales of products for 12-month period Jan 2016 to Dec 2016 * Represents REMS product, Market size estimated from respective Innovator’s Annual Report
(1) As of March 31, 2017
Key Brand MoleculeTherapeutic Segment /
IndicationDosage Form Para IV Para III Market Size (US$mn)#
Copaxone 20&40mg Glatiramer 20&40mg Multiple Sclerosis PFS
Tamiflu Oseltamivir Suspension Influenza Infection Suspension
Vidaza Azacitidine Myelodysplastic syndrome Injection
Fosrenol Lanthanum Carbonate End stage renal disease Tablets
Revlimid* Lenalidomide Multiple Myloma Capsules
Tracleer* Bosentan Hypertension Tablets
Nexavar* Sorafenib Liver, Kidney Cancer Tablets
4,138.4
213.1
203.1
119.0
4,416.9
367.5
330.7
Pip
eli
ne
US FDF product portfolio is predominantly focused on high-barrier-to-entry products that are typically characterised by one or more of the following:
- Intricate chemistry
- Challenging delivery mechanism
- Difficult or complex manufacturing process
- May face complex legal and regulatory challenges
De-risked Business Model through Partnerships with
Global Pharmaceutical Players
11
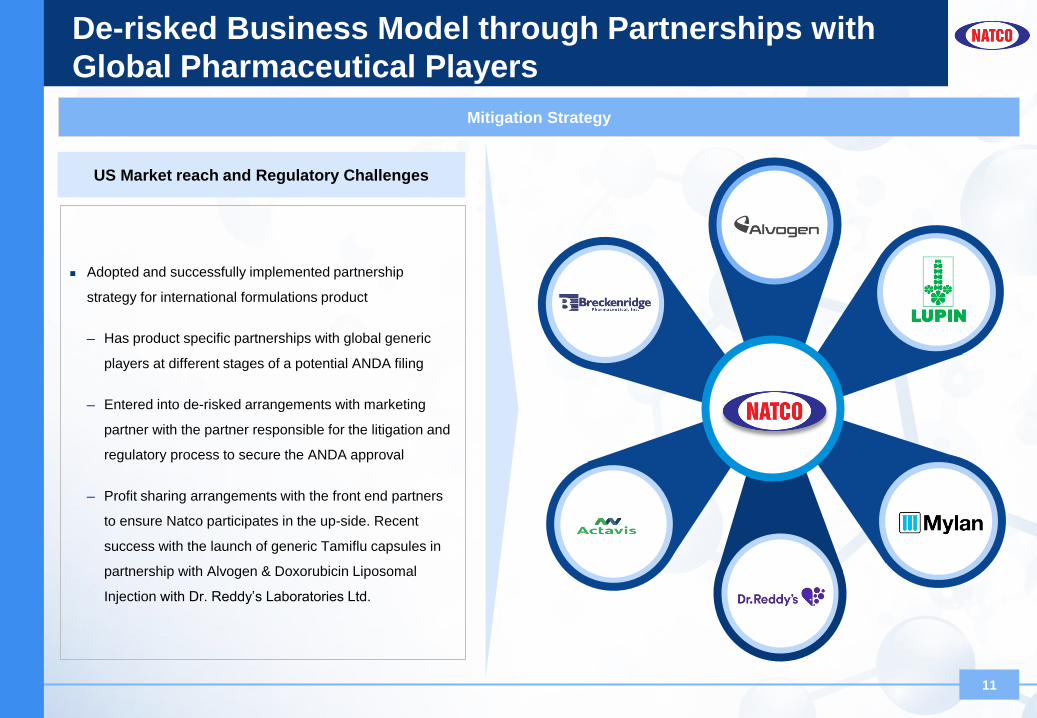
Mitigation Strategy
Adopted and successfully implemented partnership
strategy for international formulations product
─ Has product specific partnerships with global generic
players at different stages of a potential ANDA filing
─ Entered into de-risked arrangements with marketing
partner with the partner responsible for the litigation and
regulatory process to secure the ANDA approval
─ Profit sharing arrangements with the front end partners
to ensure Natco participates in the up-side. Recent
success with the launch of generic Tamiflu capsules in
partnership with Alvogen & Doxorubicin Liposomal
Injection with Dr. Reddy’s Laboratories Ltd.
US Market reach and Regulatory Challenges
Expanding RoW Presence
12
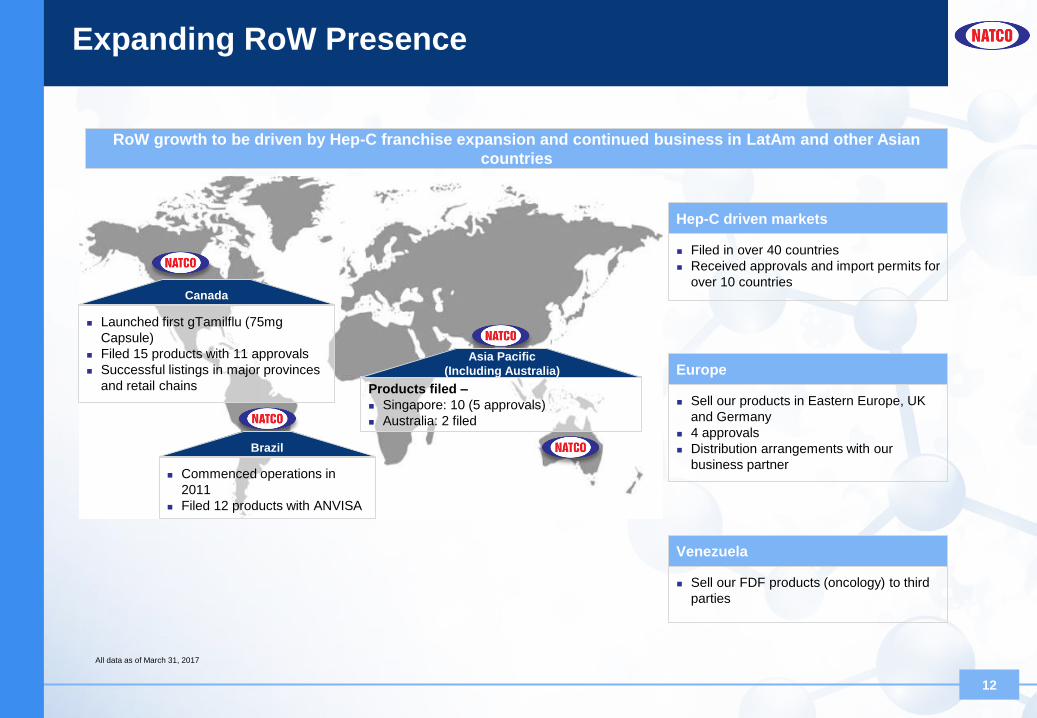
RoW growth to be driven by Hep-C franchise expansion and continued business in LatAm and other Asian
countries
Europe
Sell our products in Eastern Europe, UK
and Germany
4 approvals
Distribution arrangements with our
business partner
Venezuela
Sell our FDF products (oncology) to third
parties
Hep-C driven markets
Filed in over 40 countries
Received approvals and import permits for
over 10 countries
All data as of March 31, 2017
Launched first gTamilflu (75mg
Capsule)
Filed 15 products with 11 approvals
Successful listings in major provinces
and retail chains
Canada
Commenced operations in
2011
Filed 12 products with ANVISA
Brazil
Products filed –
Singapore: 10 (5 approvals)
Australia: 2 filed
Asia Pacific
(Including Australia)

1,984
2,571
1,627 1,838
FY2014 FY2015 FY2016 FY2017
Strong In-House API Development with Vertical
Integration for Key Formulation Products
Strategically important business – develops APIs primarily for captive
consumption of its FDF portfolio as well as third party sales
Portfolio of 37 US DMFs with over 10 products under development (as of
31-March-2017)
Focuses on complex molecules in oncology and CNS segments
− Other therapeutic areas of focus includes Anti-asthmatic, Anti-
depressant, Anti-migraine, Anti-osteoporosis and G I Disorders
Exports are focused on the US, EU, Canada, Latin America and South-
East Asia
Vertical integration for several APIs a key competitive advantage
API Strengths
Complex multi-step synthesis & scale-up
Semi-synthetic fusion technologies
− Fermentation / Biotech / Synthetic / Separation technologies
Containment / High potency APIs
Peptide (Solid phase) pharmaceuticals
Gross API Revenue (INRmn)
13
Vertically Integrated ANDAs
Vertically Integrated
60%
Non Vertically Integrated
40%
(1) Source: IMS; ; Based on annual sales of products for 12-month period Jan 2016 to Dec 2016 & REMS product’s market size estimated from respective Innovator’s Annual Report. Denotes size of FDF markets of vertically integrated ANDAs.
Expansion plans to significantly augment API manufacturing capacity
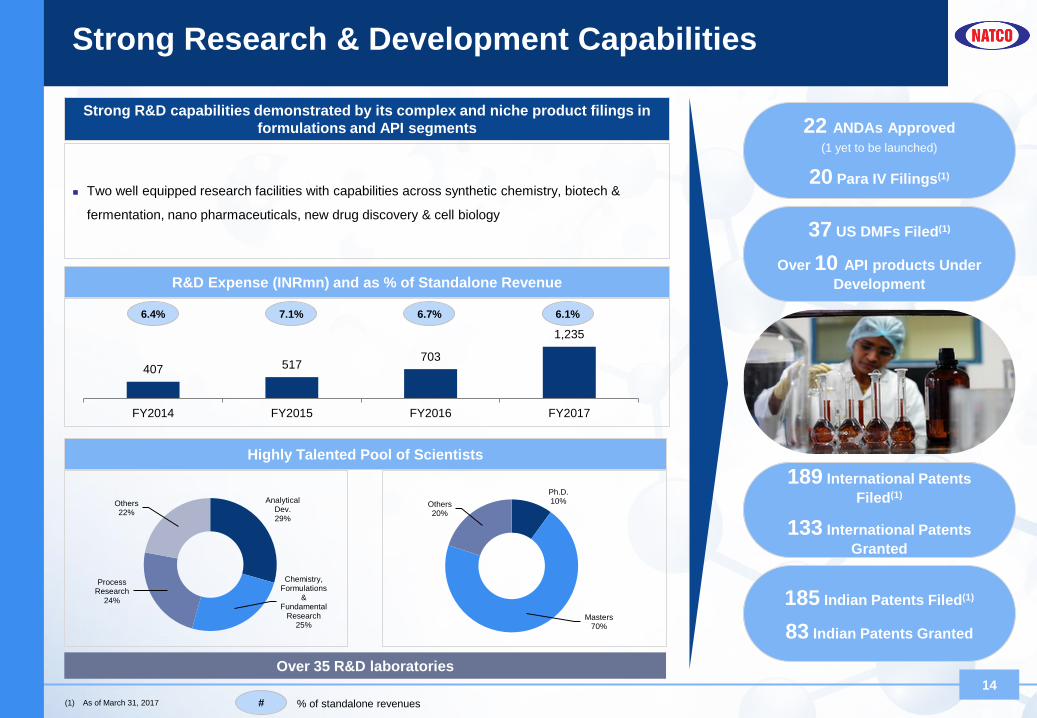
Strong Research & Development Capabilities
14
R&D Expense (INRmn) and as % of Standalone Revenue
407 517703
1,235
FY2014 FY2015 FY2016 FY2017
22 ANDAs Approved
(1 yet to be launched)
20 Para IV Filings(1)
37 US DMFs Filed(1)
Over 10 API products Under
Development
189 International Patents
Filed(1)
133 International Patents
Granted
185 Indian Patents Filed(1)
83 Indian Patents Granted
Two well equipped research facilities with capabilities across synthetic chemistry, biotech &
fermentation, nano pharmaceuticals, new drug discovery & cell biology
Strong R&D capabilities demonstrated by its complex and niche product filings in
formulations and API segments
(1) As of March 31, 2017
Highly Talented Pool of Scientists
Analytical Dev.29%
Chemistry, Formulations
& Fundamental
Research25%
Process Research
24%
Others22%
Ph.D.10%
Masters70%
Others20%
6.4% 7.1% 6.7% 6.1%
# % of standalone revenues
Over 35 R&D laboratories
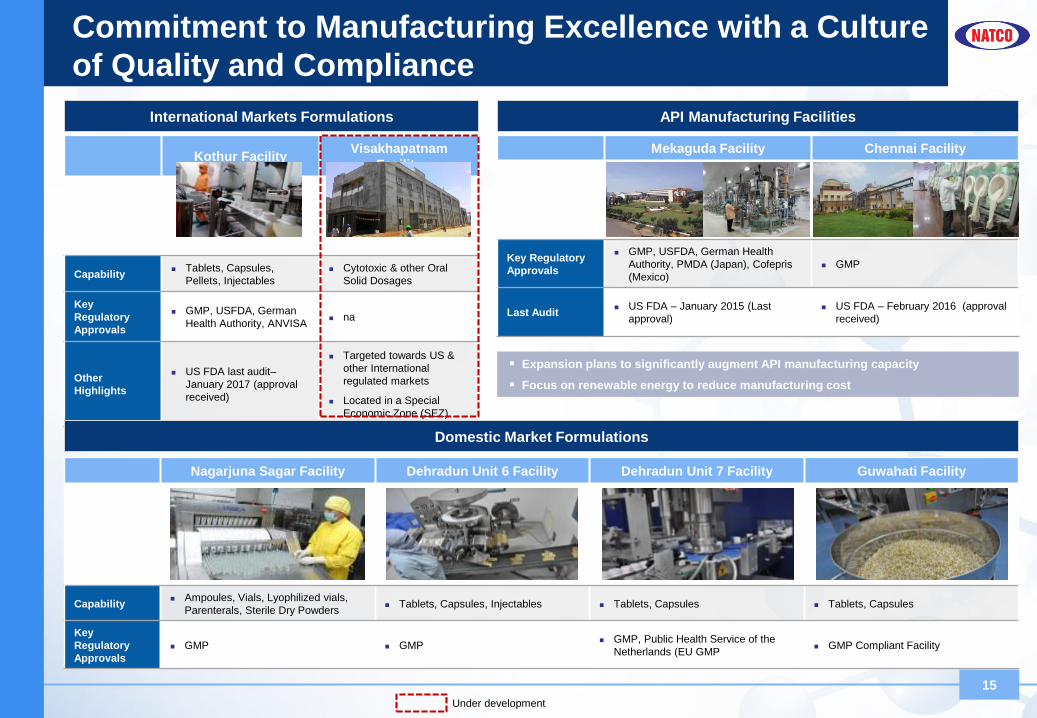
Commitment to Manufacturing Excellence with a Culture
of Quality and Compliance
15
International Markets Formulations API Manufacturing Facilities
Kothur FacilityVisakhapatnam
Facility
Capability Tablets, Capsules,
Pellets, Injectables
Cytotoxic & other Oral
Solid Dosages
Key
Regulatory
Approvals
GMP, USFDA, German
Health Authority, ANVISA na
Other
Highlights
US FDA last audit–
January 2017 (approval
received)
Targeted towards US &
other International
regulated markets
Located in a Special
Economic Zone (SEZ)
Mekaguda Facility Chennai Facility
Key Regulatory
Approvals
GMP, USFDA, German Health
Authority, PMDA (Japan), Cofepris
(Mexico)
GMP
Last Audit US FDA – January 2015 (Last
approval)
US FDA – February 2016 (approval
received)
Expansion plans to significantly augment API manufacturing capacity
Focus on renewable energy to reduce manufacturing cost
Domestic Market Formulations
Nagarjuna Sagar Facility Dehradun Unit 6 Facility Dehradun Unit 7 Facility Guwahati Facility
Capability Ampoules, Vials, Lyophilized vials,
Parenterals, Sterile Dry Powders Tablets, Capsules, Injectables Tablets, Capsules Tablets, Capsules
Key
Regulatory
Approvals
GMP GMP GMP, Public Health Service of the
Netherlands (EU GMP GMP Compliant Facility
Under development
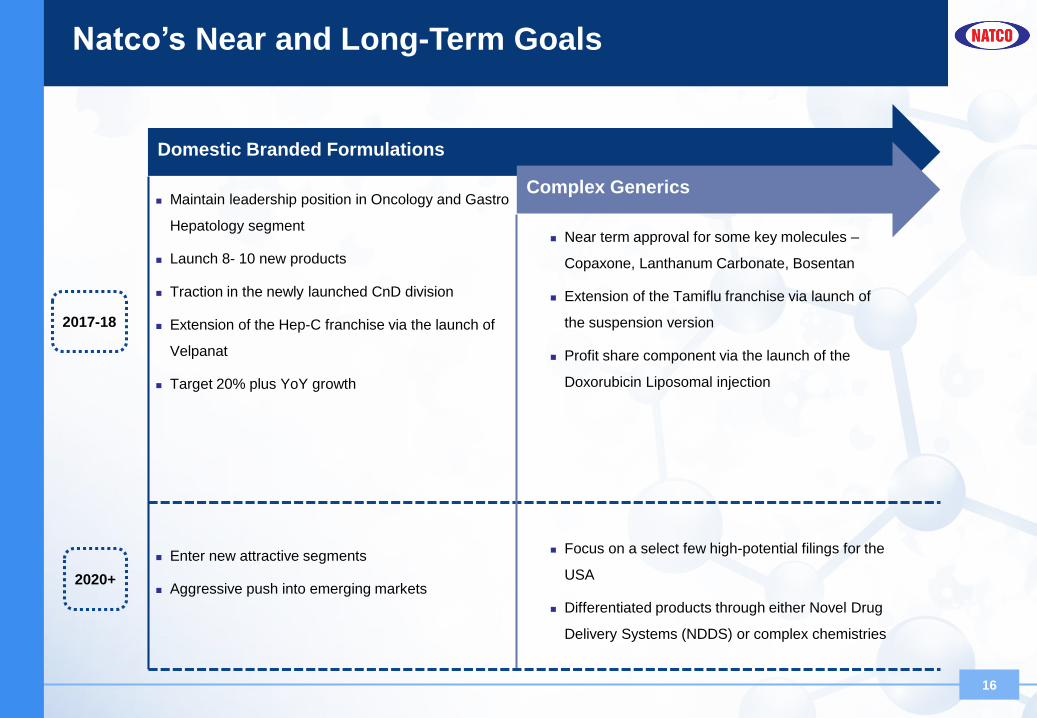
Natco’s Near and Long-Term Goals
16
Maintain leadership position in Oncology and Gastro
Hepatology segment
Launch 8- 10 new products
Traction in the newly launched CnD division
Extension of the Hep-C franchise via the launch of
Velpanat
Target 20% plus YoY growth
Domestic Branded Formulations
Complex Generics
2017-18
2020+
Enter new attractive segments
Aggressive push into emerging markets
Near term approval for some key molecules –
Copaxone, Lanthanum Carbonate, Bosentan
Extension of the Tamiflu franchise via launch of
the suspension version
Profit share component via the launch of the
Doxorubicin Liposomal injection
Focus on a select few high-potential filings for the
USA
Differentiated products through either Novel Drug
Delivery Systems (NDDS) or complex chemistries
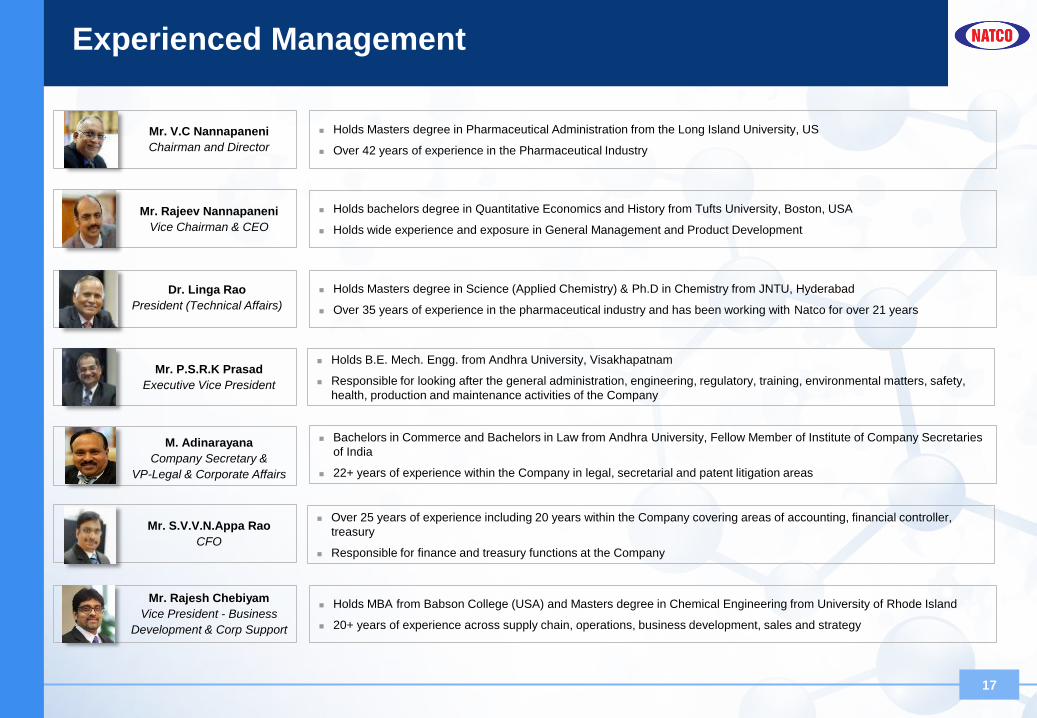
Experienced Management
17
Holds Masters degree in Pharmaceutical Administration from the Long Island University, US
Over 42 years of experience in the Pharmaceutical Industry
Holds bachelors degree in Quantitative Economics and History from Tufts University, Boston, USA
Holds wide experience and exposure in General Management and Product Development
Holds Masters degree in Science (Applied Chemistry) & Ph.D in Chemistry from JNTU, Hyderabad
Over 35 years of experience in the pharmaceutical industry and has been working with Natco for over 21 years
Holds B.E. Mech. Engg. from Andhra University, Visakhapatnam
Responsible for looking after the general administration, engineering, regulatory, training, environmental matters, safety,
health, production and maintenance activities of the Company
Over 25 years of experience including 20 years within the Company covering areas of accounting, financial controller,
treasury
Responsible for finance and treasury functions at the Company
Holds MBA from Babson College (USA) and Masters degree in Chemical Engineering from University of Rhode Island
20+ years of experience across supply chain, operations, business development, sales and strategy
Mr. V.C Nannapaneni
Chairman and Director
Mr. Rajeev Nannapaneni
Vice Chairman & CEO
Dr. Linga Rao
President (Technical Affairs)
Mr. P.S.R.K Prasad
Executive Vice President
Mr. Rajesh Chebiyam
Vice President - Business
Development & Corp Support
Mr. S.V.V.N.Appa Rao
CFO
Bachelors in Commerce and Bachelors in Law from Andhra University, Fellow Member of Institute of Company Secretaries
of India
22+ years of experience within the Company in legal, secretarial and patent litigation areas
M. Adinarayana
Company Secretary &
VP-Legal & Corporate Affairs
7,6148,531
10,897
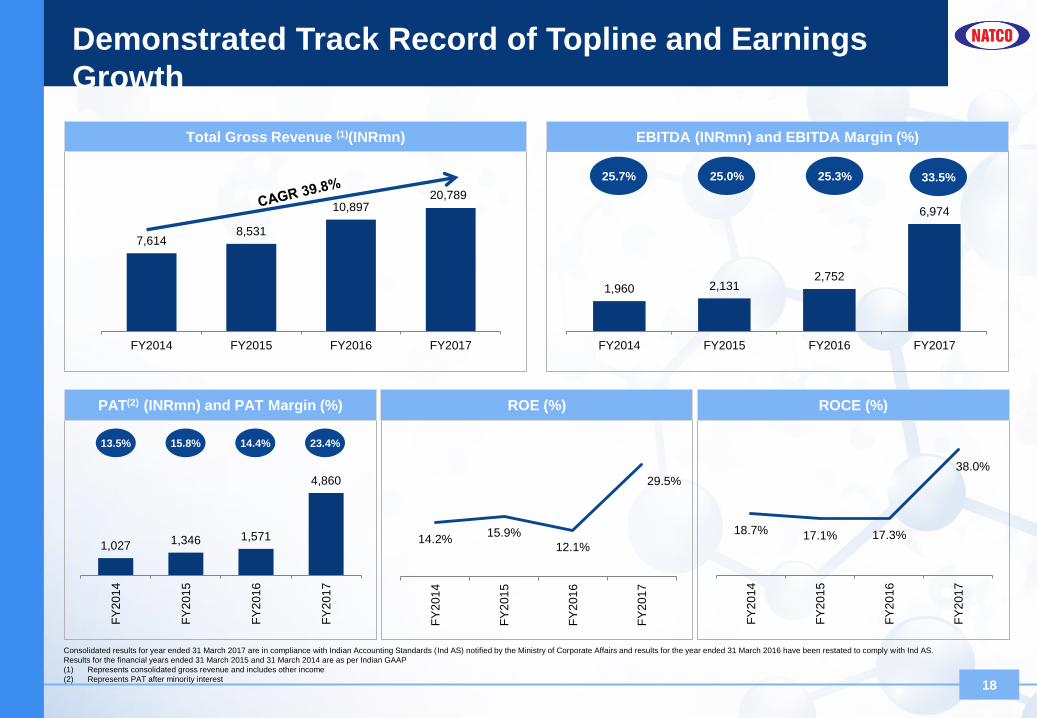
FY2014 FY2015 FY2016 FY2017
Demonstrated Track Record of Topline and Earnings
Growth
Total Gross Revenue (1)(INRmn) EBITDA (INRmn) and EBITDA Margin (%)
PAT(2) (INRmn) and PAT Margin (%)
18
1,960 2,1312,752
6,974
FY2014 FY2015 FY2016 FY2017
25.7% 25.0% 25.3%
ROE (%) ROCE (%)
1,027 1,346 1,571
4,860
FY
201
4
FY
201
5
FY
201
6
FY
201
7
13.5% 15.8% 14.4%
14.2%15.9%
12.1%
29.5%
FY
201
4
FY
201
5
FY
201
6
FY
201
7
18.7% 17.1% 17.3%
38.0%
FY
201
4
FY
201
5
FY
201
6
FY
201
7
Consolidated results for year ended 31 March 2017 are in compliance with Indian Accounting Standards (Ind AS) notified by the Ministry of Corporate Affairs and results for the year ended 31 March 2016 have been restated to comply with Ind AS.
Results for the financial years ended 31 March 2015 and 31 March 2014 are as per Indian GAAP
(1) Represents consolidated gross revenue and includes other income
(2) Represents PAT after minority interest
23.4%
33.5%
20,789
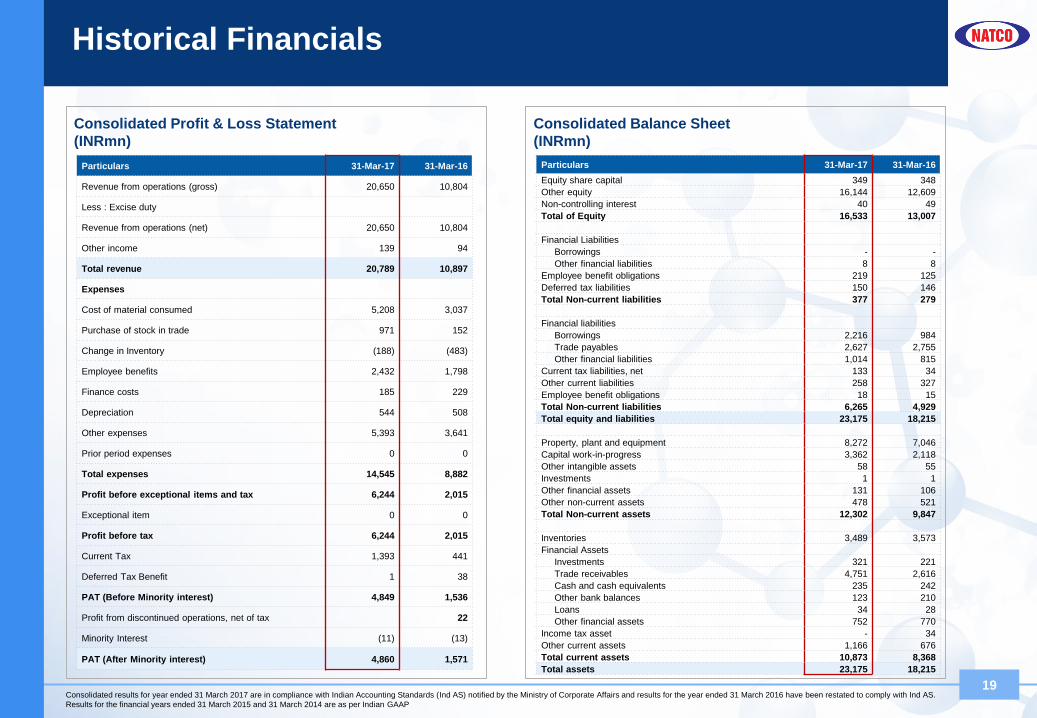
Historical Financials
Consolidated Profit & Loss Statement
(INRmn)
19
Consolidated Balance Sheet
(INRmn)
Consolidated results for year ended 31 March 2017 are in compliance with Indian Accounting Standards (Ind AS) notified by the Ministry of Corporate Affairs and results for the year ended 31 March 2016 have been restated to comply with Ind AS.
Results for the financial years ended 31 March 2015 and 31 March 2014 are as per Indian GAAP
Particulars 31-Mar-17 31-Mar-16
Equity share capital 349 348
Other equity 16,144 12,609
Non-controlling interest 40 49
Total of Equity 16,533 13,007
Financial Liabilities
Borrowings - -
Other financial liabilities 8 8
Employee benefit obligations 219 125
Deferred tax liabilities 150 146
Total Non-current liabilities 377 279
Financial liabilities
Borrowings 2,216 984
Trade payables 2,627 2,755
Other financial liabilities 1,014 815
Current tax liabilities, net 133 34
Other current liabilities 258 327
Employee benefit obligations 18 15
Total Non-current liabilities 6,265 4,929
Total equity and liabilities 23,175 18,215
Property, plant and equipment 8,272 7,046
Capital work-in-progress 3,362 2,118
Other intangible assets 58 55
Investments 1 1
Other financial assets 131 106
Other non-current assets 478 521
Total Non-current assets 12,302 9,847
Inventories 3,489 3,573
Financial Assets
Investments 321 221
Trade receivables 4,751 2,616
Cash and cash equivalents 235 242
Other bank balances 123 210
Loans 34 28
Other financial assets 752 770
Income tax asset - 34
Other current assets 1,166 676
Total current assets 10,873 8,368
Total assets 23,175 18,215
Particulars 31-Mar-17 31-Mar-16
Revenue from operations (gross) 20,650 10,804
Less : Excise duty
Revenue from operations (net) 20,650 10,804
Other income 139 94
Total revenue 20,789 10,897
Expenses
Cost of material consumed 5,208 3,037
Purchase of stock in trade 971 152
Change in Inventory (188) (483)
Employee benefits 2,432 1,798
Finance costs 185 229
Depreciation 544 508
Other expenses 5,393 3,641
Prior period expenses 0 0
Total expenses 14,545 8,882
Profit before exceptional items and tax 6,244 2,015
Exceptional item 0 0
Profit before tax 6,244 2,015
Current Tax 1,393 441
Deferred Tax Benefit 1 38
PAT (Before Minority interest) 4,849 1,536
Profit from discontinued operations, net of tax 22
Minority Interest (11) (13)
PAT (After Minority interest) 4,860 1,571
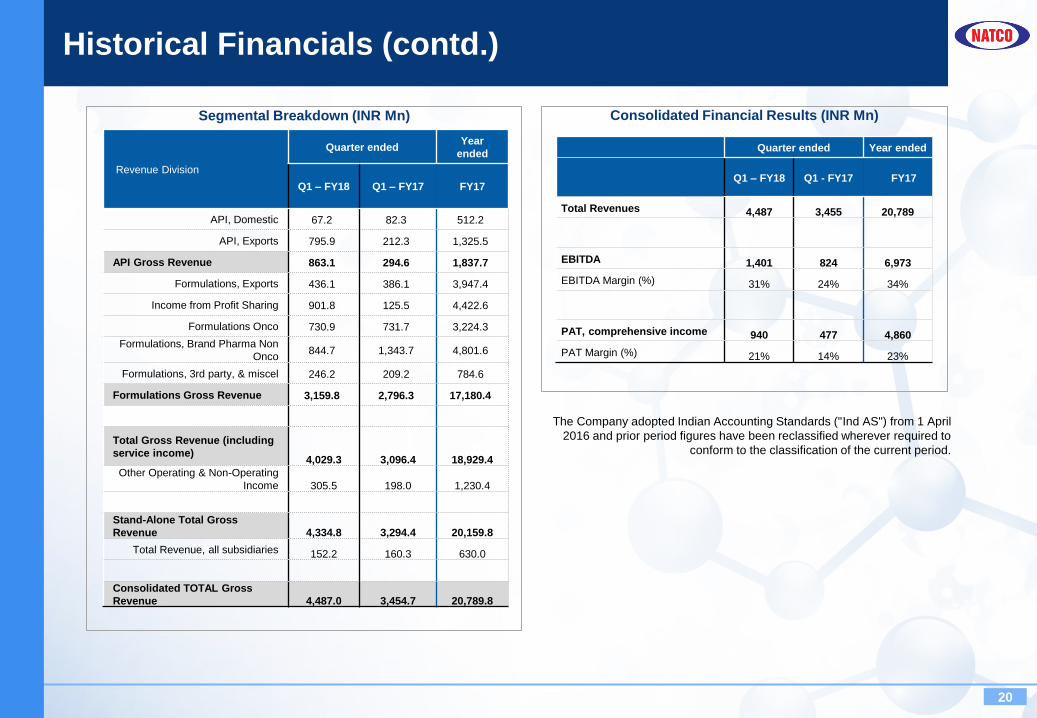
20
Segmental Breakdown (INR Mn)
Historical Financials (contd.)
Revenue Division
Quarter endedYear
ended
Q1 – FY18 Q1 – FY17 FY17
API, Domestic 67.2 82.3 512.2
API, Exports 795.9 212.3 1,325.5
API Gross Revenue 863.1 294.6 1,837.7
Formulations, Exports 436.1 386.1 3,947.4
Income from Profit Sharing 901.8 125.5 4,422.6
Formulations Onco 730.9 731.7 3,224.3
Formulations, Brand Pharma Non
Onco844.7 1,343.7 4,801.6
Formulations, 3rd party, & miscel 246.2 209.2 784.6
Formulations Gross Revenue 3,159.8 2,796.3 17,180.4
Total Gross Revenue (including
service income)4,029.3 3,096.4 18,929.4
Other Operating & Non-Operating
Income 305.5 198.0 1,230.4
Stand-Alone Total Gross
Revenue 4,334.8 3,294.4 20,159.8
Total Revenue, all subsidiaries 152.2 160.3 630.0
Consolidated TOTAL Gross
Revenue 4,487.0 3,454.7 20,789.8
Consolidated Financial Results (INR Mn)
Quarter ended Year ended
Q1 – FY18 Q1 - FY17 FY17
Total Revenues 4,487 3,455 20,789
EBITDA 1,401 824 6,973
EBITDA Margin (%) 31% 24% 34%
PAT, comprehensive income 940 477 4,860
PAT Margin (%) 21% 14% 23%
The Company adopted Indian Accounting Standards ("Ind AS") from 1 April
2016 and prior period figures have been reclassified wherever required to
conform to the classification of the current period.