corporate presentation - atlantica yield · pdf filecorporate presentation 5 at a glance a...
TRANSCRIPT
1
Corporate PresentationJune 2017

DISCL AIMER
• This presentation contains forward-looking statements. These forward-looking statements include, but are not limited to, all statements other than statements of historical facts contained in this
presentation, including, without limitation, those regarding our future financial position and results of operations, our strategy, plans, objectives, goals and targets, future developments in the markets in
which we operate or are seeking to operate or anticipated regulatory changes in the markets in which we operate or intend to operate. In some cases, you can identify forward-looking statements by
terminology such as “aim,” “anticipate,” “believe,” “continue,” “could,” “estimate,” “expect,” “forecast,” “guidance,” “intend,” “is likely to,” “may,” “plan,” “potential,” “predict,” “projected,” “should” or “will” or
the negative of such terms or other similar expressions or terminology. By their nature, forward-looking statements involve risks and uncertainties because they relate to events and depend on
circumstances that may or may not occur in the future. Forward-looking statements speak only as of the date of this press release and are not guarantees of future performance and are based on
numerous assumptions. Our actual results of operations, financial condition and the development of events may differ materially from (and be more negative than) those made in, or suggested by, the
forward-looking statements.
• Many factors could cause the actual results, performance or achievements of the Company to be materially different from any future results, performance or achievements that may be expressed or implied
by such forward-looking statements, including, among others: Difficult conditions in the global economy and in the global market and uncertainties in emerging markets where we have international
operations; Changes in government regulations providing incentives and subsidies for renewable energy; Political, social and macroeconomic risks relating to the United Kingdom’s potential exit from the
European Union; Changes in general economic, political, governmental and business conditions globally and in the countries in which we do business; Decreases in government expenditure budgets,
reductions in government subsidies or adverse changes in laws and regulations affecting our businesses and growth plan; Challenges in achieving growth and making acquisitions due to our dividend
policy; Inability to identify and/or consummate future acquisitions, whether the Abengoa ROFO Assets or otherwise, on favorable terms or at all; Our ability to identify and reach an agreement with new
sponsors or partners similar to the ROFO Agreement with Abengoa; Legal challenges to regulations, subsidies and incentives that support renewable energy sources; extensive governmental regulation in a
number of different jurisdictions, including stringent environmental regulation; Increases in the cost of energy and gas, which could increase our operating costs; Counterparty credit risk and failure of
counterparties to our offtake agreements to fulfill their obligations; Inability to replace expiring or terminated offtake agreements with similar agreements; New technology or changes in industry
standards; Inability to manage exposure to credit, interest rates, foreign currency exchange rates, supply and commodity price risks; Reliance on third-party contractors and suppliers; Risks associated with
acquisitions and investments; Deviations from our investment criteria for future acquisitions and investments; Failure to maintain safe work environments; Effects of catastrophes, natural disasters, adverse
weather conditions, climate change, unexpected geological or other physical conditions, criminal or terrorist acts or cyber-attacks at one or more of our plants; Insufficient insurance coverage and increases
in insurance cost; Litigation and other legal proceedings including claims due to Abengoa’s restructuring process; Reputational risk, including damage to the reputation of Abengoa; The loss of one or more
of our executive officers; Failure of information technology on which we rely to run our business; Revocation or termination of our concession agreements or power purchase agreements; Lowering of
revenues in Spain that are mainly defined by regulation; Inability to adjust regulated tariffs or fixed-rate arrangements as a result of fluctuations in prices of raw materials, exchange rates, labor and
subcontractor costs; Changes to national and international law and policies that support renewable energy resources; Our receipt of dividends from our exchangeable preferred equity investment in ACBH
in the context of the ongoing proceedings in ACBH in Brazil; Lack of electric transmission capacity and potential upgrade costs to the electric transmission grid; Disruptions in our operations as a result of
our not owning the land on which our assets are located; Risks associated with maintenance, expansion and refurbishment of electric generation facilities; Failure of our assets to perform as expected;
Failure to receive dividends from all project and investments; Variations in meteorological conditions; Disruption of the fuel supplies necessary to generate power at our conventional generation facilities;
Deterioration in Abengoa’s financial condition and the outcome of Abengoa’s ongoing proceedings under the ongoing restructuring process and the outcome of the ongoing proceedings in ACBH in
Brazil; Abengoa’s ability to meet its obligations under our agreements with Abengoa, to comply with past representations, commitments and potential liabilities linked to the time when Abengoa owned
the assets, potential clawback of transactions with Abengoa, and other risks related to Abengoa; Failure to meet certain covenants under our financing arrangements; Failure to obtain pending waivers in
relation to the minimum ownership by Abengoa and the cross-default provisions contained in some of our project financing agreements; Failure of Abengoa to maintain existing guarantees and letters of
credit under the Financial Support Agreement; Failure of Abengoa to complete the restructuring process and comply with its obligations under the agreement reached between Abengoa and us in relation
to our preferred equity investment in ACBH; Uncertainty regarding the fair value of the non-contingent credit recognized by Abengoa in the agreement reached between Abengoa and us in relation to our
preferred equity investment in ACBH and uncertainty regarding the ability to recover this amount at maturity; Our ability to consummate future acquisitions from Abengoa; Changes in our tax position and
greater than expected tax liability; Impact on the stock price of the Company of the sale by Abengoa of its stake in the Company; and Technical failure, design errors or faulty operation of our assets not
covered by guarantees or insurance. Furthermore, any dividends are subject to available capital, market conditions, and compliance with associated laws and regulations. These factors should be
considered in connection with information regarding risks and uncertainties that may affect Atlantica Yield’s future results included in Atlantica Yield’s filings with the U.S. Securities and Exchange
Commission at www.sec.gov.
• Should one or more of these risks or uncertainties materialize, or should underlying assumptions prove incorrect, actual results may vary materially from those described herein as anticipated, believed,
estimated, expected or targeted.
• This presentation includes certain non-GAAP (Generally Accepted Accounting Principles) financial measures which have not been subject to a financial audit for any period. We present non-GAAP financial
measures because we believe that they and other similar measures are widely used by certain investors, securities analysts and other interested parties as supplemental measures of performance and
liquidity. The non-GAAP financial measures may not be comparable to other similarly titled measures of other companies and have limitations as analytical tools and should not be considered in isolation
or as a substitute for analysis of our operating results as reported under IFRS as issued by the IASB. Non-GAAP financial measures and ratios are not measurements of our performance or liquidity under
IFRS as issued by the IASB and should not be considered as alternatives to operating profit or profit for the year or any other performance measures derived in accordance with IFRS as issued by the IASB
or any other generally accepted accounting principles or as alternatives to cash flow from operating, investing or financing activities.
• The CAFD and other guidance included in this presentation are estimates as of May 15, 2017. These estimates are based on assumptions believed to be reasonable as of that date. Atlantica Yield plc.
disclaims any current intention to update such guidance, except as required by law.
3
1. Company Overview
2. Key Investment Highlights
3. Strategic Overview and Value PropositionReview
AGENDA
4. Financial Review
4
1. Company Overview
Corporate Presentation
5
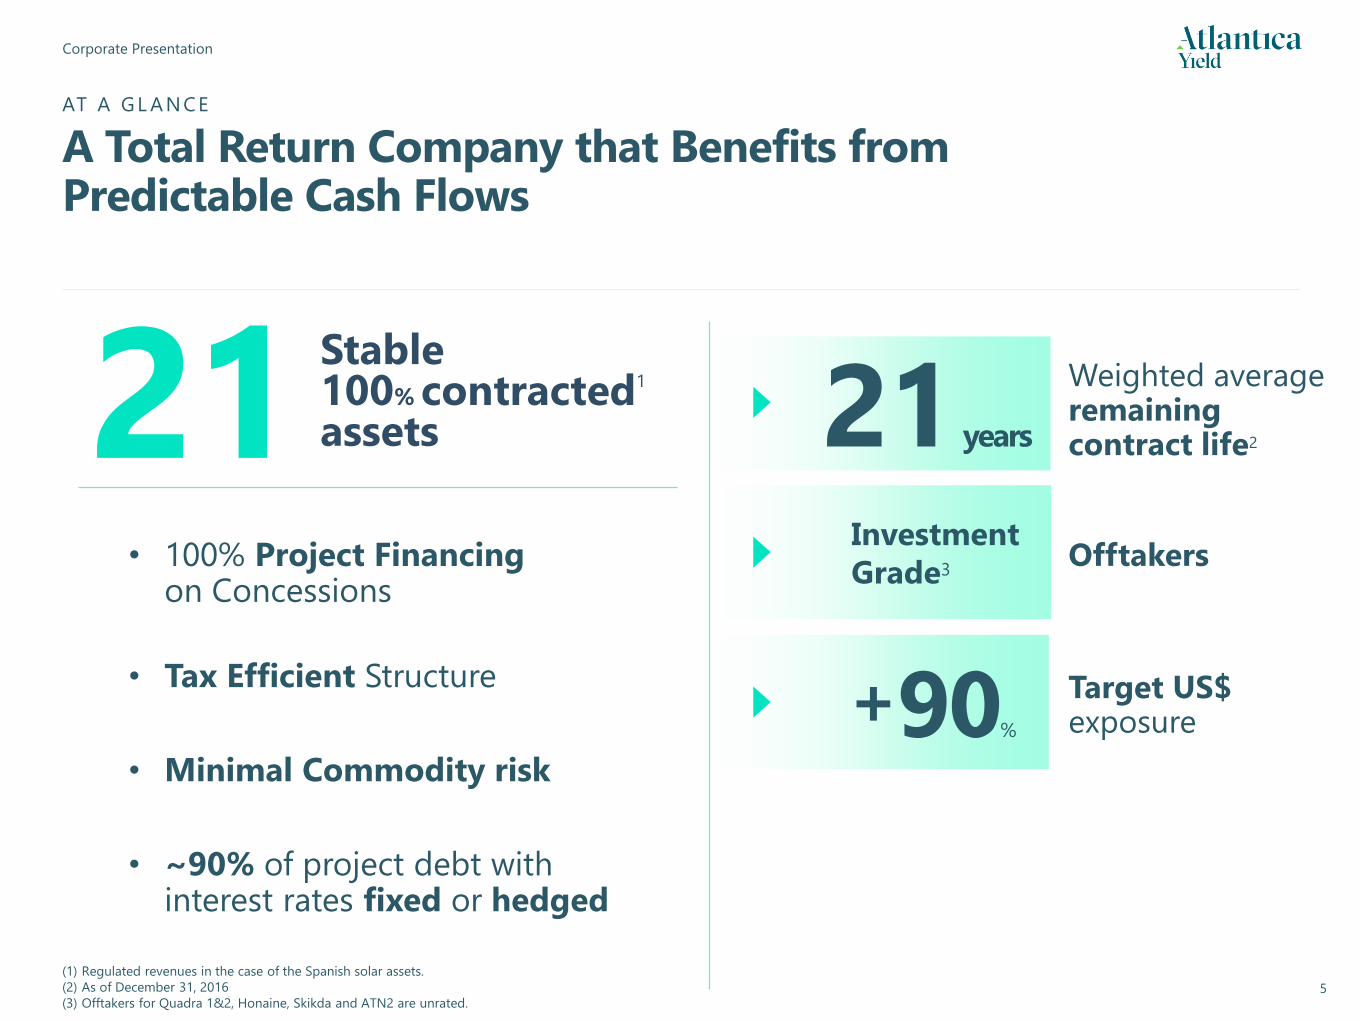
AT A GL A NCE
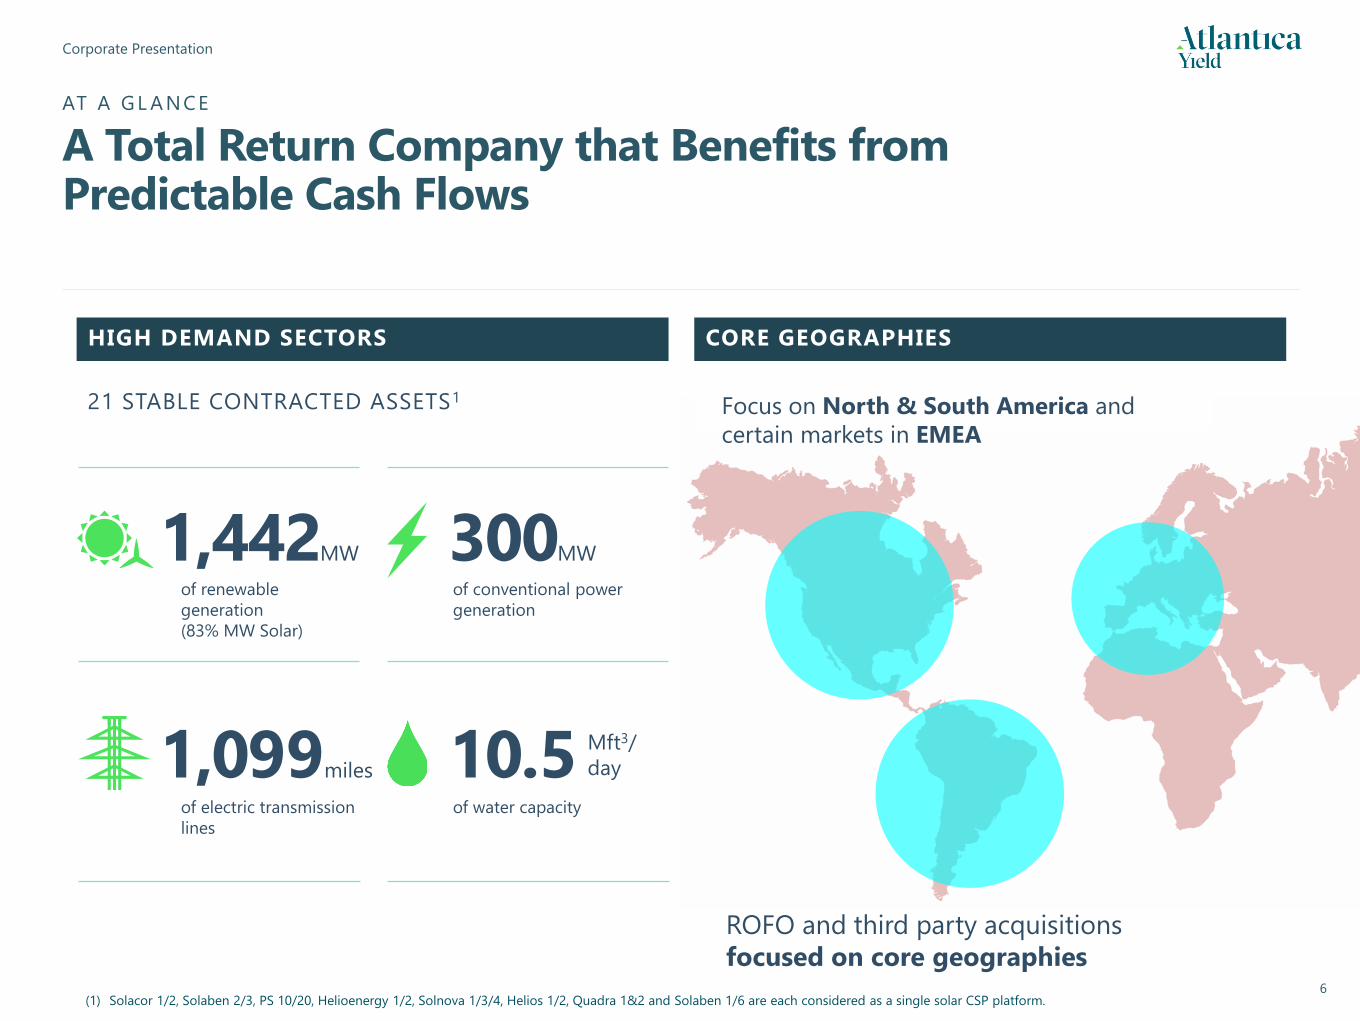
A Total Return Company that Benefits from Predictable Cash Flows
Offtakers
Target US$exposure
(1) Regulated revenues in the case of the Spanish solar assets.
(2) As of December 31, 2016
(3) Offtakers for Quadra 1&2, Honaine, Skikda and ATN2 are unrated.
21Stable 100% contractedassets
Investment
Grade3
+90%
Weighted average remaining contract life221 years
• Tax Efficient Structure
• Minimal Commodity risk
• ~90% of project debt with interest rates fixed or hedged
• 100% Project Financingon Concessions
1
Corporate Presentation
6(1) Solacor 1/2, Solaben 2/3, PS 10/20, Helioenergy 1/2, Solnova 1/3/4, Helios 1/2, Quadra 1&2 and Solaben 1/6 are each considered as a single solar CSP platform.
HIGH DEMAND SECTORS
1,442MW
21 STABLE CONTRACTED ASSETS1
of conventional power
generation
300MW
1,099miles 10.5 Mft3/
day
ROFO and third party acquisitions
focused on core geographies
CORE GEOGRAPHIES
of renewable
generation
(83% MW Solar)
of water capacityof electric transmission
lines
Focus on North & South America and
certain markets in EMEA
AT A GL A NCE
A Total Return Company that Benefits from Predictable Cash Flows

7
2. Key InvestmentHighlights
Corporate Presentation
8
STABLE CASH FLOWS
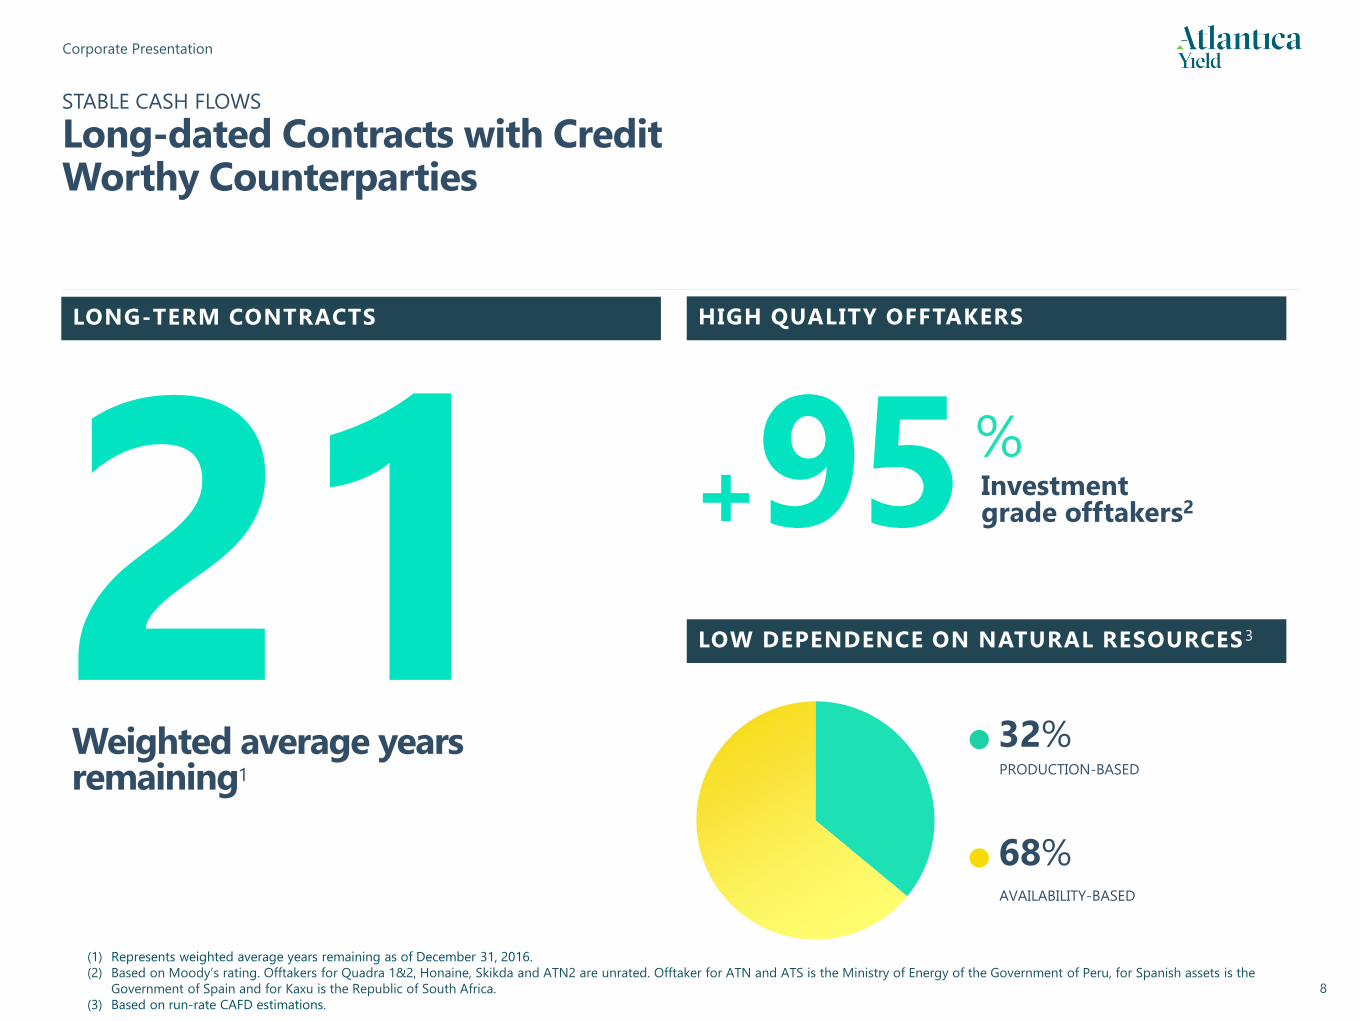
Long-dated Contracts with Credit Worthy Counterparties
LONG-TERM CONTRACTS HIGH QUALITY OFFTAKERS
Weighted average years remaining1
+95 Investment grade offtakers2
LOW DEPENDENCE ON NATURAL RESOURCES 3
PRODUCTION-BASED
32%
AVAILABILITY-BASED
68%
%
(1) Represents weighted average years remaining as of December 31, 2016.
(2) Based on Moody’s rating. Offtakers for Quadra 1&2, Honaine, Skikda and ATN2 are unrated. Offtaker for ATN and ATS is the Ministry of Energy of the Government of Peru, for Spanish assets is the
Government of Spain and for Kaxu is the Republic of South Africa.
(3) Based on run-rate CAFD estimations.
Corporate Presentation
9
+%
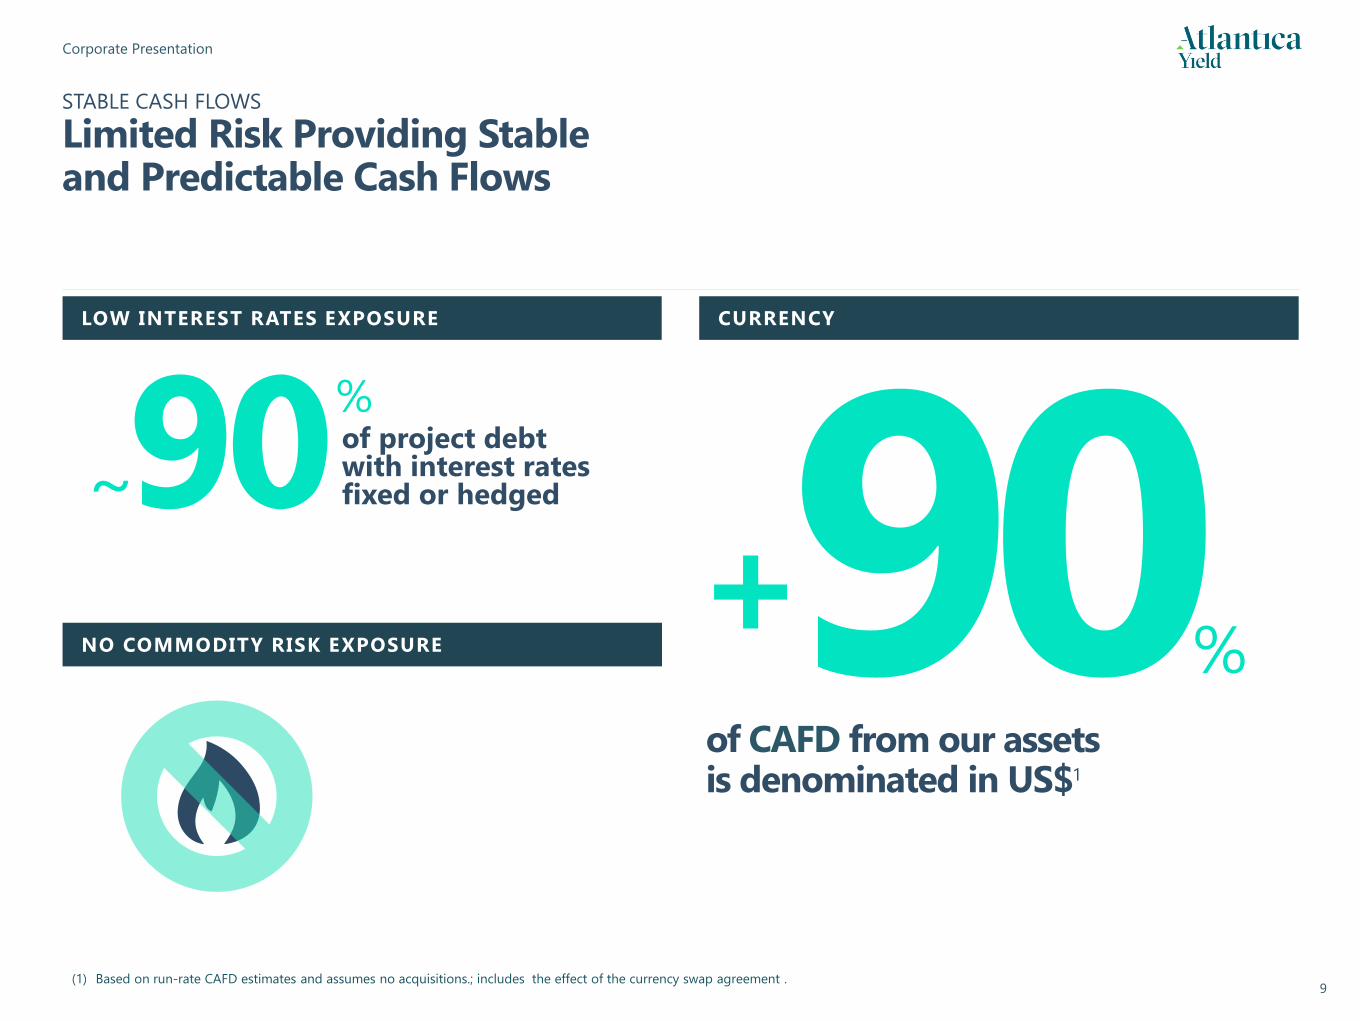
of CAFD from our assets is denominated in US$1
LOW INTEREST RATES EXPOSURE CURRENCY
NO COMMODITY RISK EXPOSURE
~90 of project debt with interest rates fixed or hedged
%
(1) Based on run-rate CAFD estimates and assumes no acquisitions.; includes the effect of the currency swap agreement .
STABLE CASH FLOWS
Limited Risk Providing Stable and Predictable Cash Flows
Corporate Presentation
10
SIZEABLE AND DIVERSIFIED ASSET PORTFOLIO
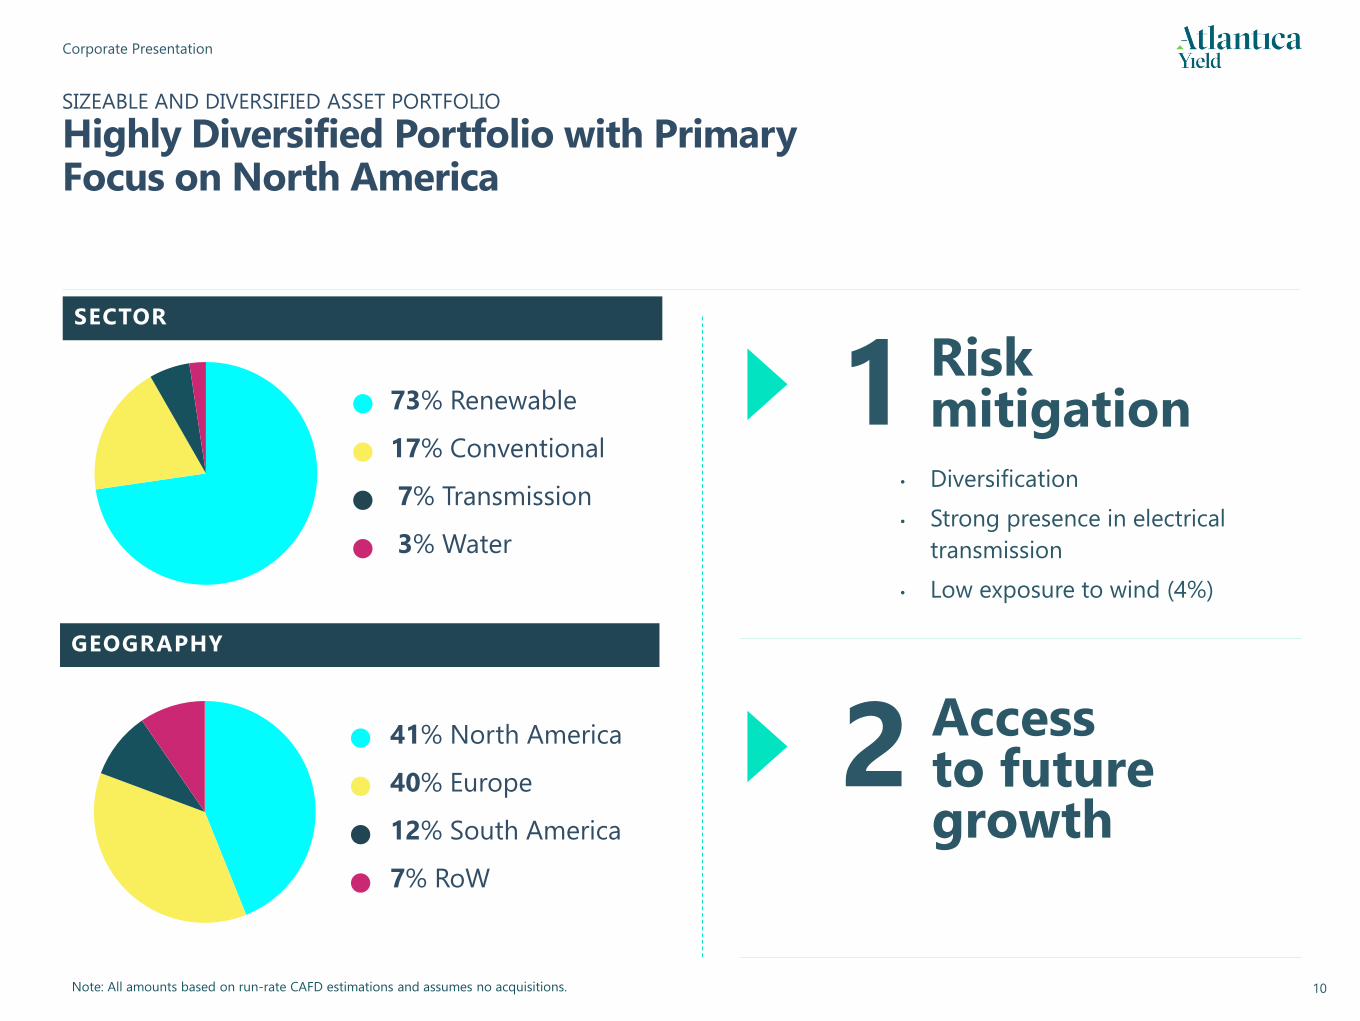
Highly Diversified Portfolio with Primary Focus on North America
SECTOR
GEOGRAPHY
Note: All amounts based on run-rate CAFD estimations and assumes no acquisitions.
• 41% North America
• 40% Europe
• 12% South America
• 7% RoW
• 73% Renewable
• 17% Conventional
• 7% Transmission
• 3% Water
• Diversification
• Strong presence in electrical
transmission
• Low exposure to wind (4%)
Riskmitigation1
2 Accessto future growth
Corporate Presentation
11
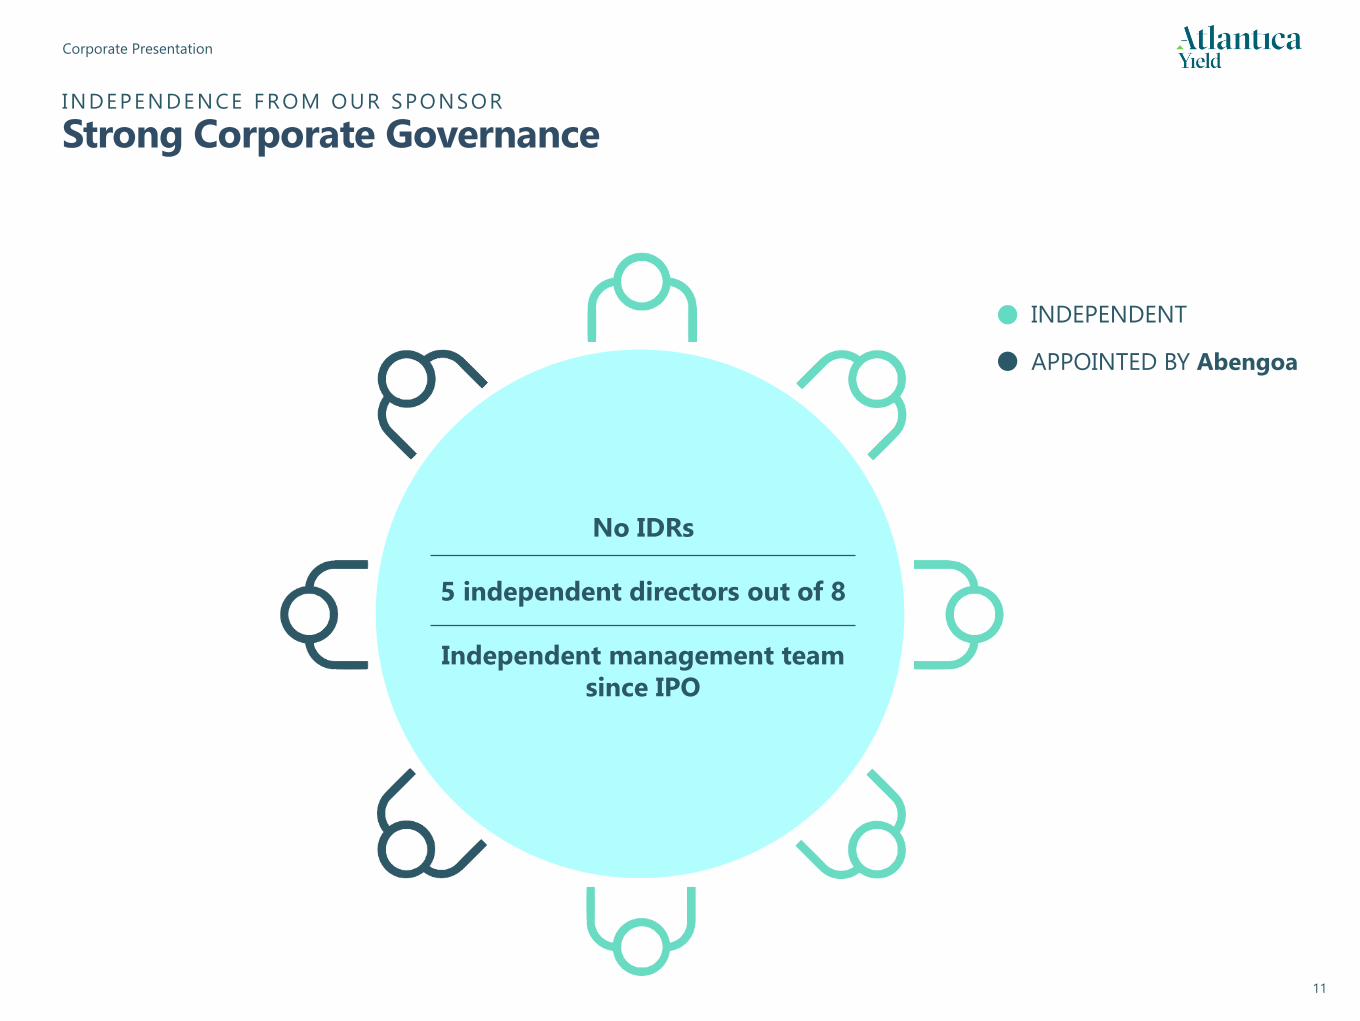
No IDRs
5 independent directors out of 8
Independent management team
since IPO
INDEPENDENT
APPOINTED BY Abengoa
INDEPENDENCE FROM OUR SPONSOR
Strong Corporate Governance
12
3. Strategic Overview and Value Proposition Review
Corporate Presentation
13
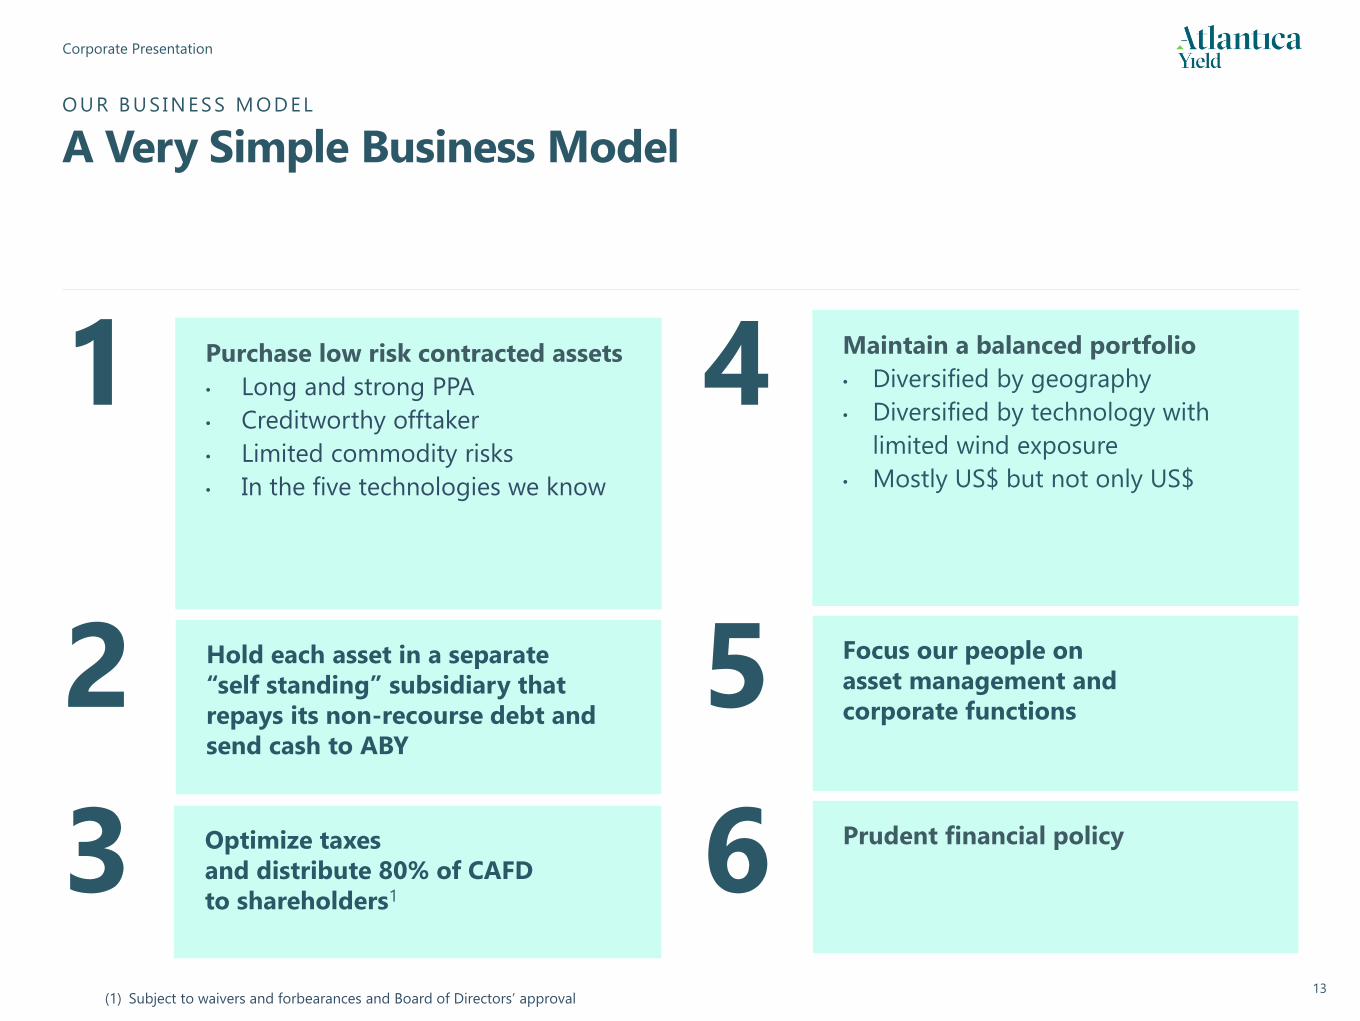
Prudent financial policy
Focus our people on
asset management and
corporate functions5
Maintain a balanced portfolio
• Diversified by geography
• Diversified by technology with
limited wind exposure
• Mostly US$ but not only US$
4
Hold each asset in a separate
“self standing” subsidiary that
repays its non-recourse debt and
send cash to ABY
Purchase low risk contracted assets
• Long and strong PPA
• Creditworthy offtaker
• Limited commodity risks
• In the five technologies we know
1
2
Optimize taxes
and distribute 80% of CAFD
to shareholders13 6
OUR B US IN ESS MOD EL
A Very Simple Business Model
(1) Subject to waivers and forbearances and Board of Directors’ approval
Corporate Presentation
14
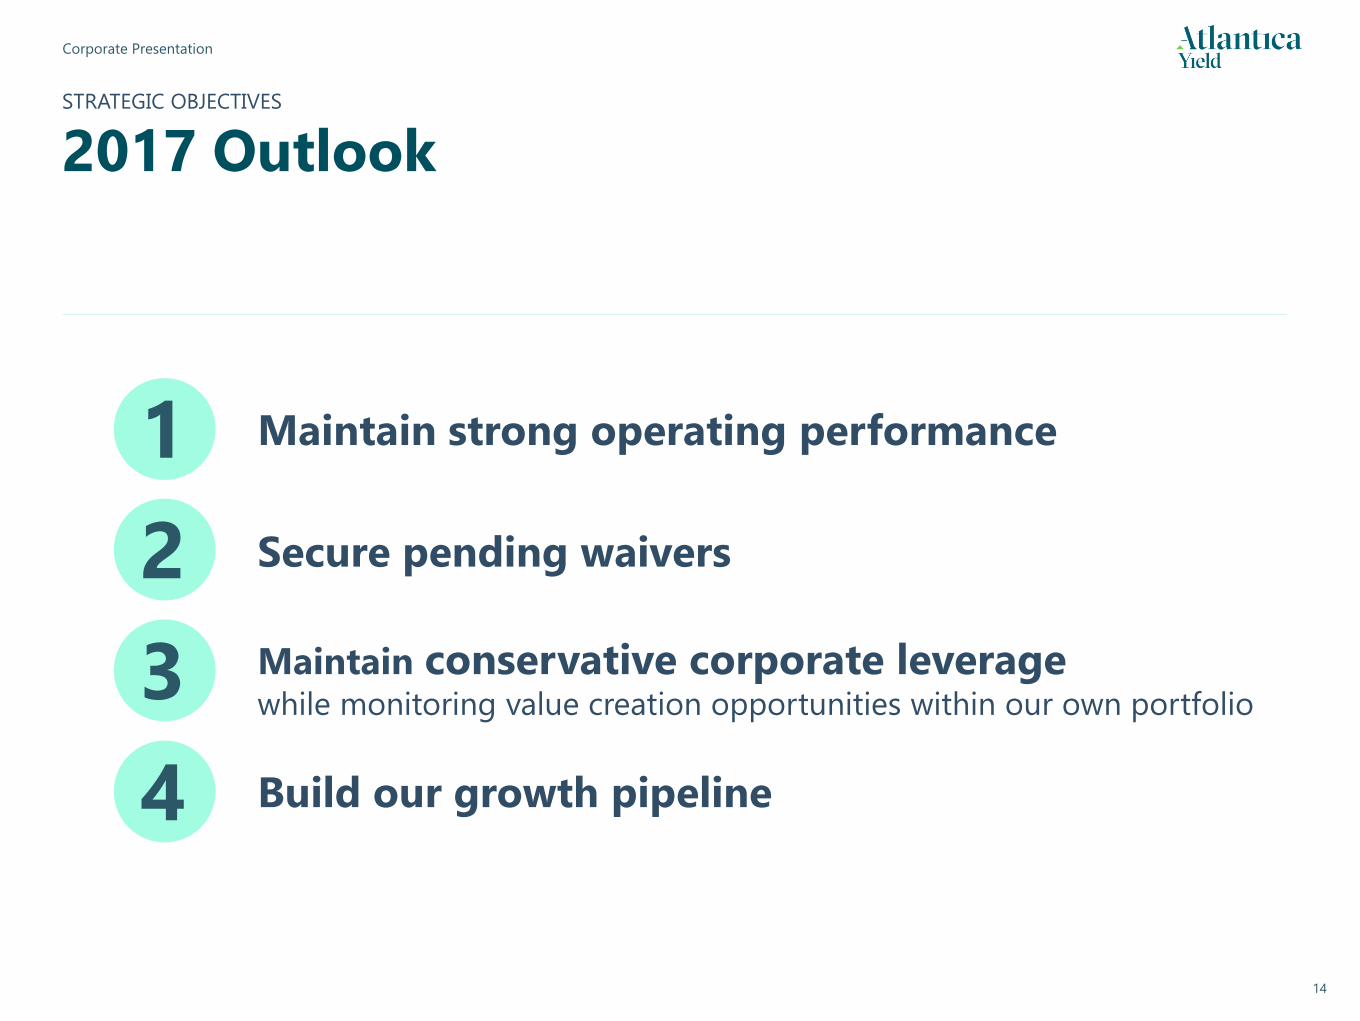
STRATEGIC OBJECTIVES
2017 Outlook
Maintain strong operating performance
Secure pending waivers
Maintain conservative corporate leveragewhile monitoring value creation opportunities within our own portfolio
Build our growth pipeline
1
2
3
4
Corporate Presentation
15
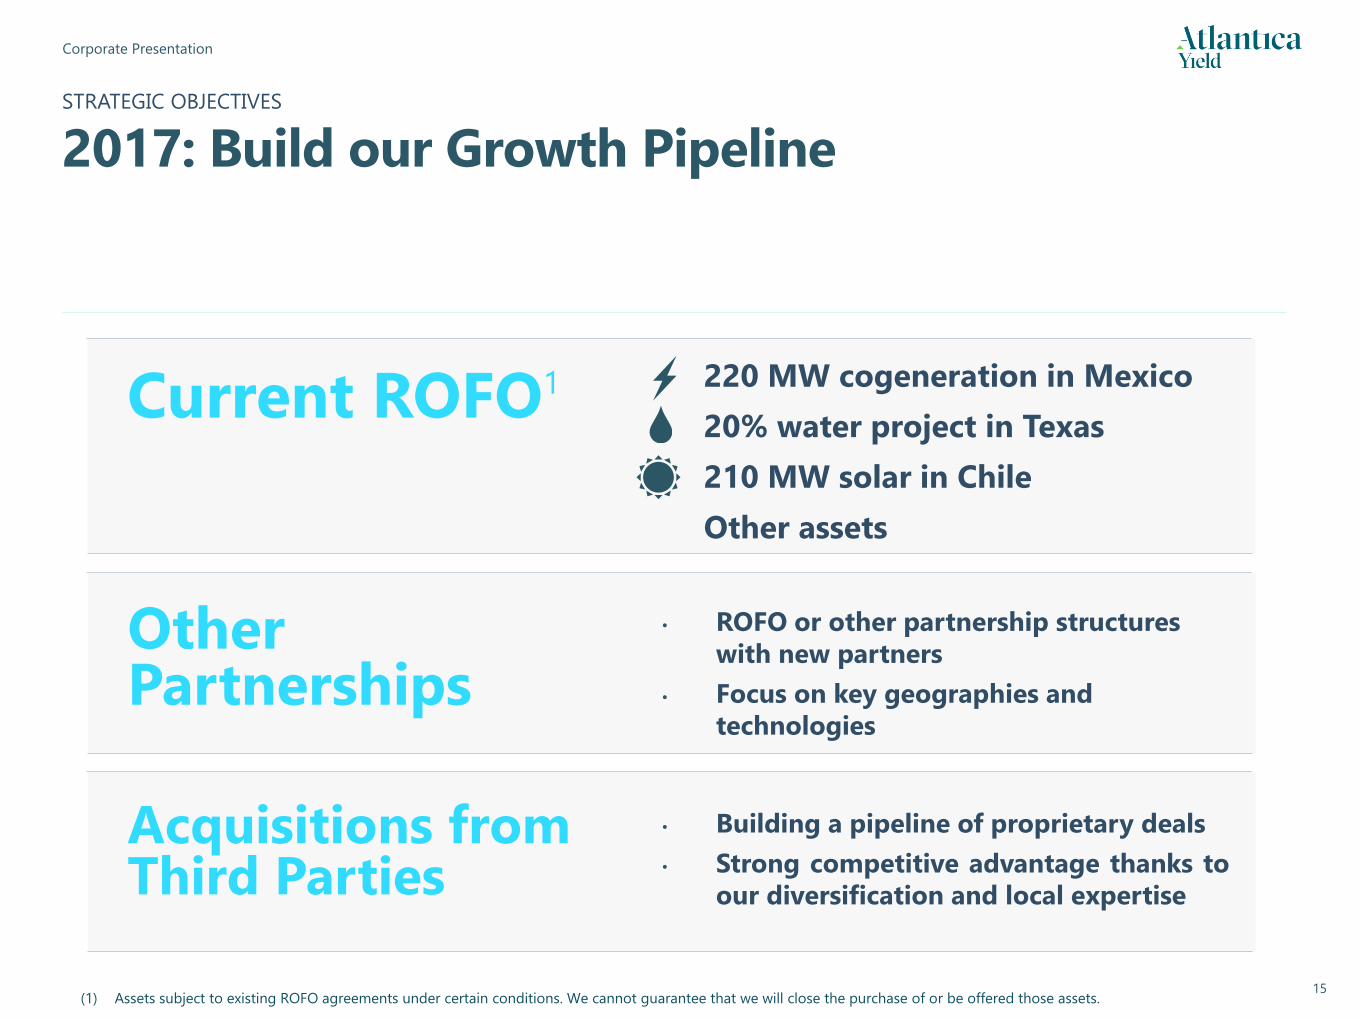
STRATEGIC OBJECTIVES
2017: Build our Growth Pipeline
220 MW cogeneration in Mexico
20% water project in Texas
210 MW solar in Chile
Other assets
Current ROFO1
Other Partnerships
• ROFO or other partnership structures
with new partners
• Focus on key geographies and
technologies
Acquisitions from Third Parties
• Building a pipeline of proprietary deals
• Strong competitive advantage thanks to
our diversification and local expertise
(1) Assets subject to existing ROFO agreements under certain conditions. We cannot guarantee that we will close the purchase of or be offered those assets.
Corporate Presentation
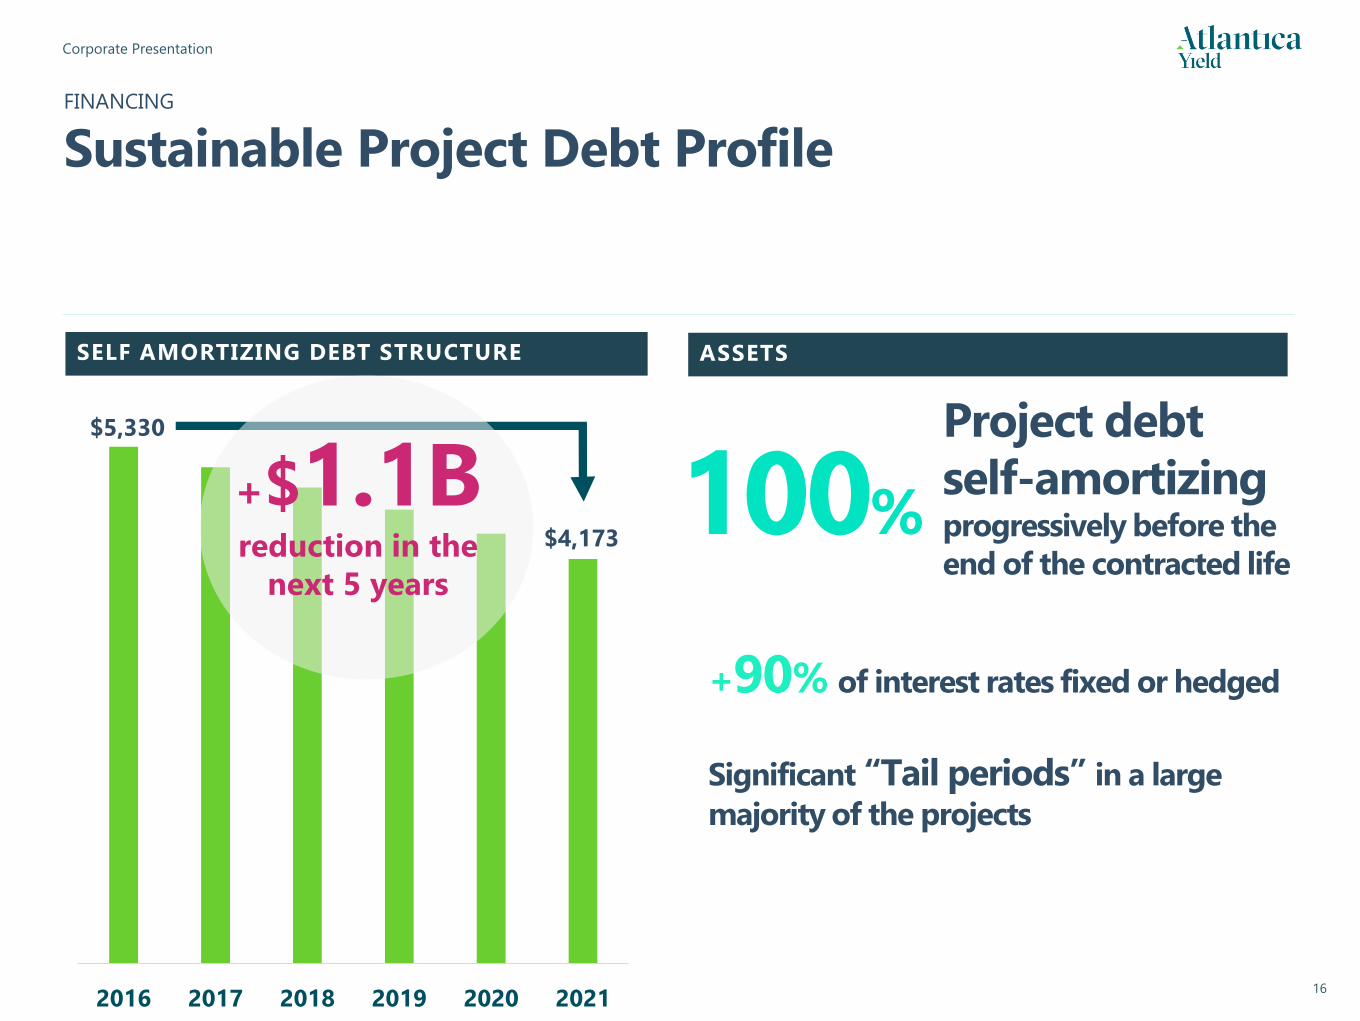
162016 2017 2018 2019 2020 2021
FINANCING
Sustainable Project Debt Profile
SELF AMORTIZING DEBT STRUCTURE ASSETS
Project debt
self-amortizing progressively before the
end of the contracted life
100%
+90% of interest rates fixed or hedged
Significant “Tail periods” in a large
majority of the projects
$5,330
$4,173
+$1.1Breduction in the
next 5 years
Corporate Presentation
17
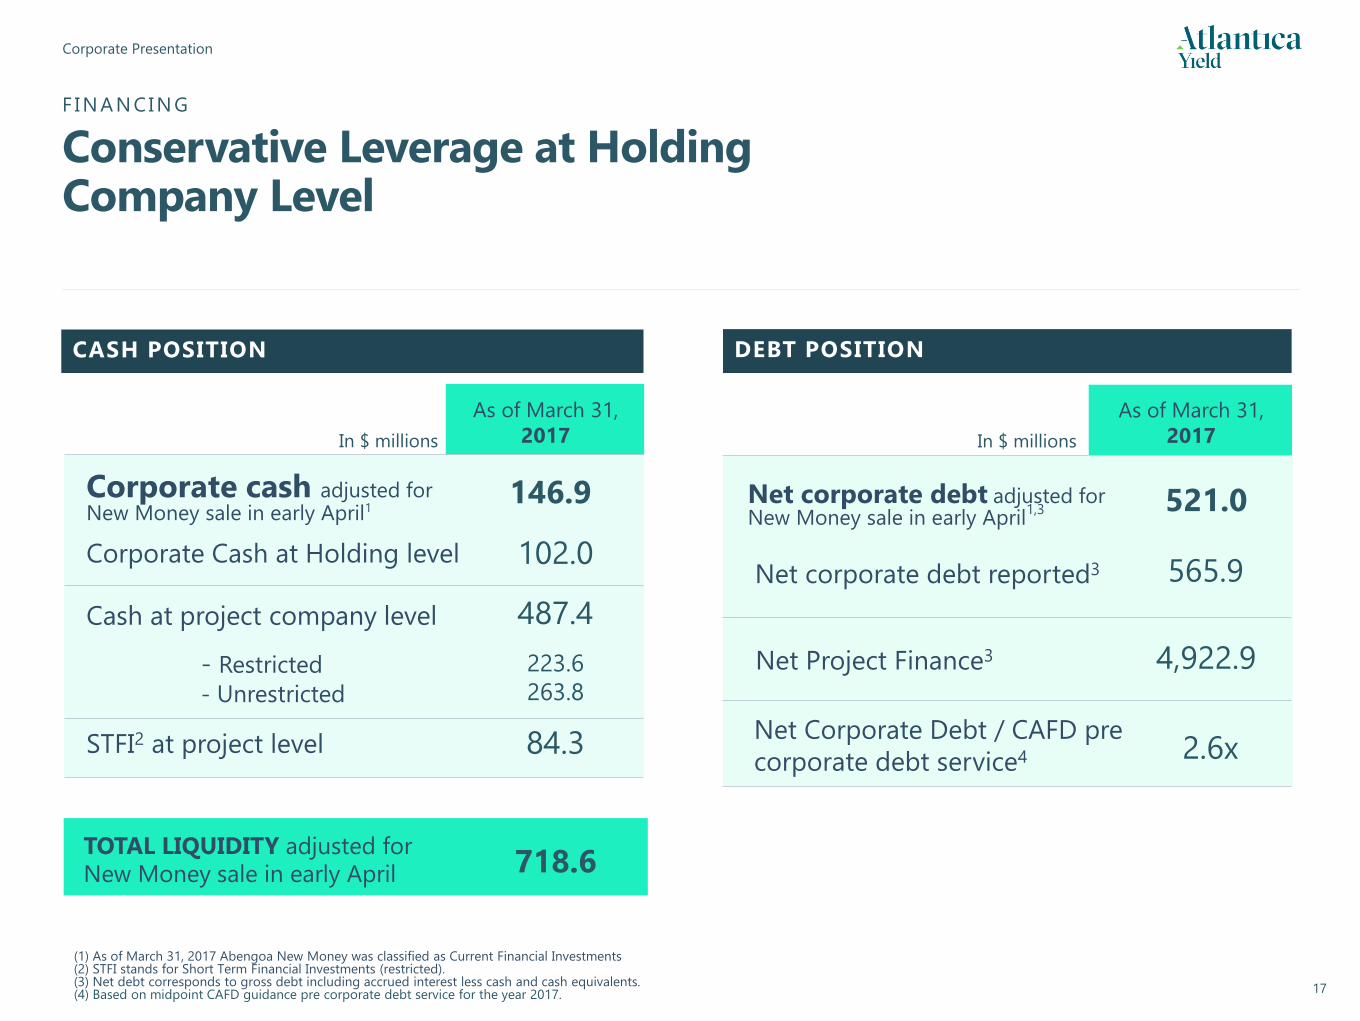
As of March 31,
2017In $ millions
Corporate Cash at Holding level 102.0
Cash at project company level
- Restricted
- Unrestricted
STFI2 at project level
487.4
223.6
263.8
As of March 31,
2017
84.3
In $ millions
521.0
Net Project Finance3 4,922.9
718.6
Net Corporate Debt / CAFD pre
corporate debt service4 2.6x
(1) As of March 31, 2017 Abengoa New Money was classified as Current Financial Investments (2) STFI stands for Short Term Financial Investments (restricted).(3) Net debt corresponds to gross debt including accrued interest less cash and cash equivalents.(4) Based on midpoint CAFD guidance pre corporate debt service for the year 2017.
CASH POSITION DEBT POSITION
F IN A N CIN G
Conservative Leverage at Holding Company Level
Corporate cash adjusted for New Money sale in early April1
146.9
TOTAL LIQUIDITY adjusted for New Money sale in early April
Net corporate debt adjusted for New Money sale in early April
1,3
Net corporate debt reported3 565.9

18
4. Financial Review
Corporate Presentation
19
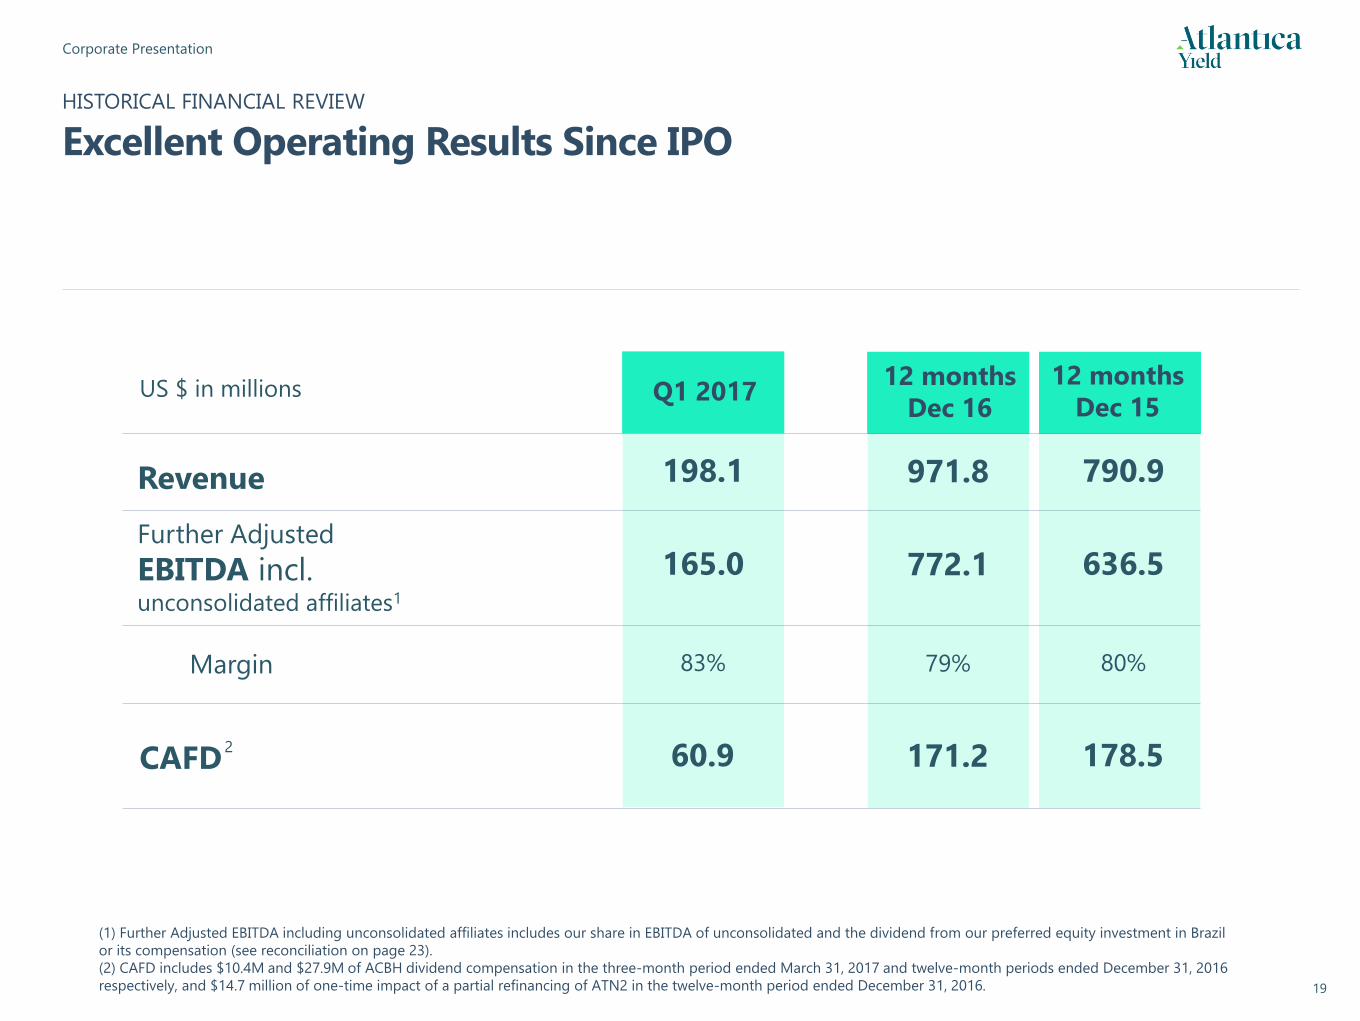
Q1 2017
198.1
165.0
83%
60.9
HISTORICAL FINANCIAL REVIEW
Excellent Operating Results Since IPO
12 months
Dec 15
790.9
636.5
80%
178.5
Revenue
Further Adjusted
EBITDA incl.unconsolidated affiliates1
Margin
12 months
Dec 16
971.8
772.1
79%
CAFD 171.2
US $ in millions
(1) Further Adjusted EBITDA including unconsolidated affiliates includes our share in EBITDA of unconsolidated and the dividend from our preferred equity investment in Brazil
or its compensation (see reconciliation on page 23).
(2) CAFD includes $10.4M and $27.9M of ACBH dividend compensation in the three-month period ended March 31, 2017 and twelve-month periods ended December 31, 2016
respectively, and $14.7 million of one-time impact of a partial refinancing of ATN2 in the twelve-month period ended December 31, 2016.
2
Corporate Presentation
20
Q1 2017Adjusted for New
Money sale in early April
(1.1)
165.0
(26.6)
(22.3)
(13.9)
(36.2)
36.2
(28.7)
334.5
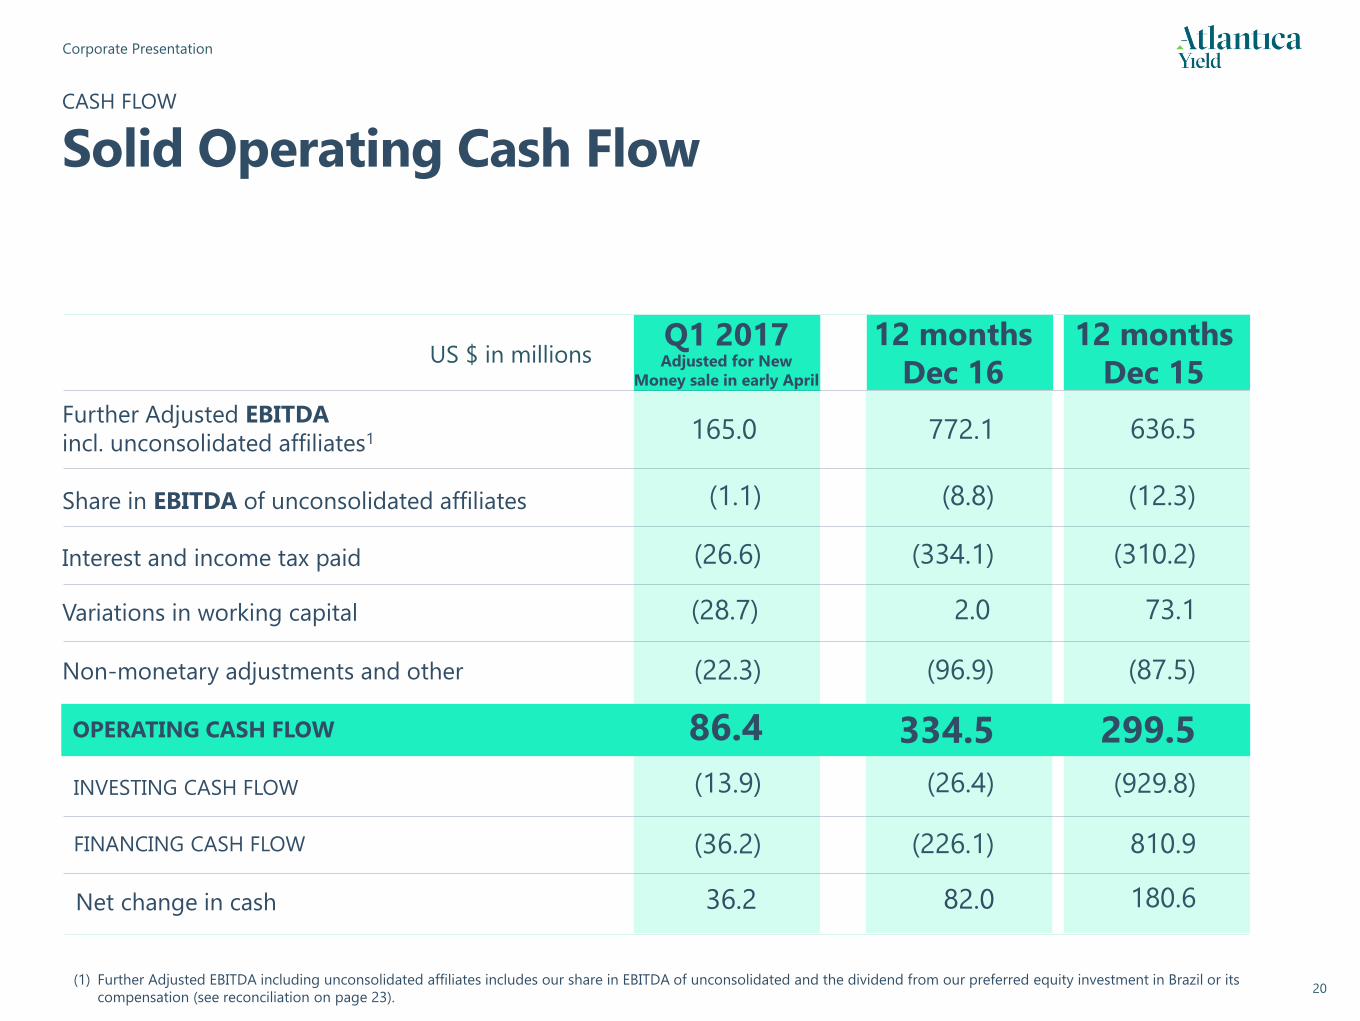
CASH FLOW
Solid Operating Cash Flow
Net change in cash
OPERATING CASH FLOW
US $ in millions 12 months
Dec 16
12 months
Dec 15
Further Adjusted EBITDA
incl. unconsolidated affiliates1
(12.3)(8.8)Share in EBITDA of unconsolidated affiliates
Interest and income tax paid
Variations in working capital
Non-monetary adjustments and other
INVESTING CASH FLOW
FINANCING CASH FLOW
636.5772.1
(310.2)(334.1)
73.1
(87.5)(96.9)
299.5
(929.8)(26.4)
810.9(226.1)
180.682.0
2.0
334.5
(1) Further Adjusted EBITDA including unconsolidated affiliates includes our share in EBITDA of unconsolidated and the dividend from our preferred equity investment in Brazil or its
compensation (see reconciliation on page 23).
86.4
Corporate Presentation
21
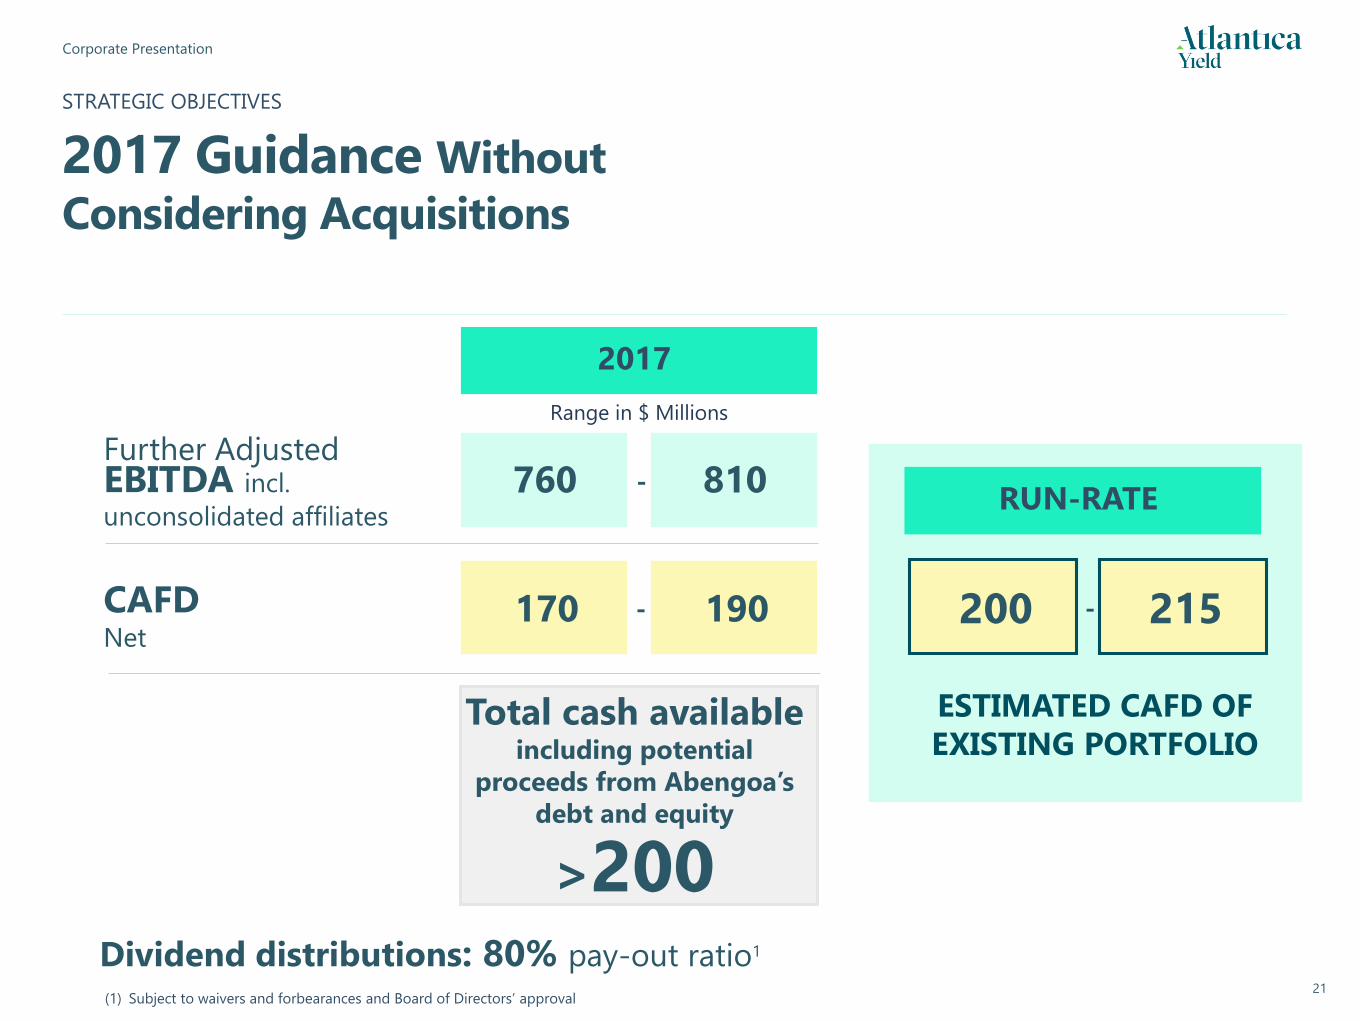
STRATEGIC OBJECTIVES
2017 Guidance Without
Considering Acquisitions
2017
760
Range in $ Millions
CAFD Net
170
810
190
Further Adjusted EBITDA incl.
unconsolidated affiliates
Dividend distributions: 80% pay-out ratio1
-
-
(1) Subject to waivers and forbearances and Board of Directors’ approval
ESTIMATED CAFD OF
EXISTING PORTFOLIO
200 215-
Total cash available including potential
proceeds from Abengoa’s
debt and equity
RUN-RATE
>200
22
Appendix
Corporate Presentation
23
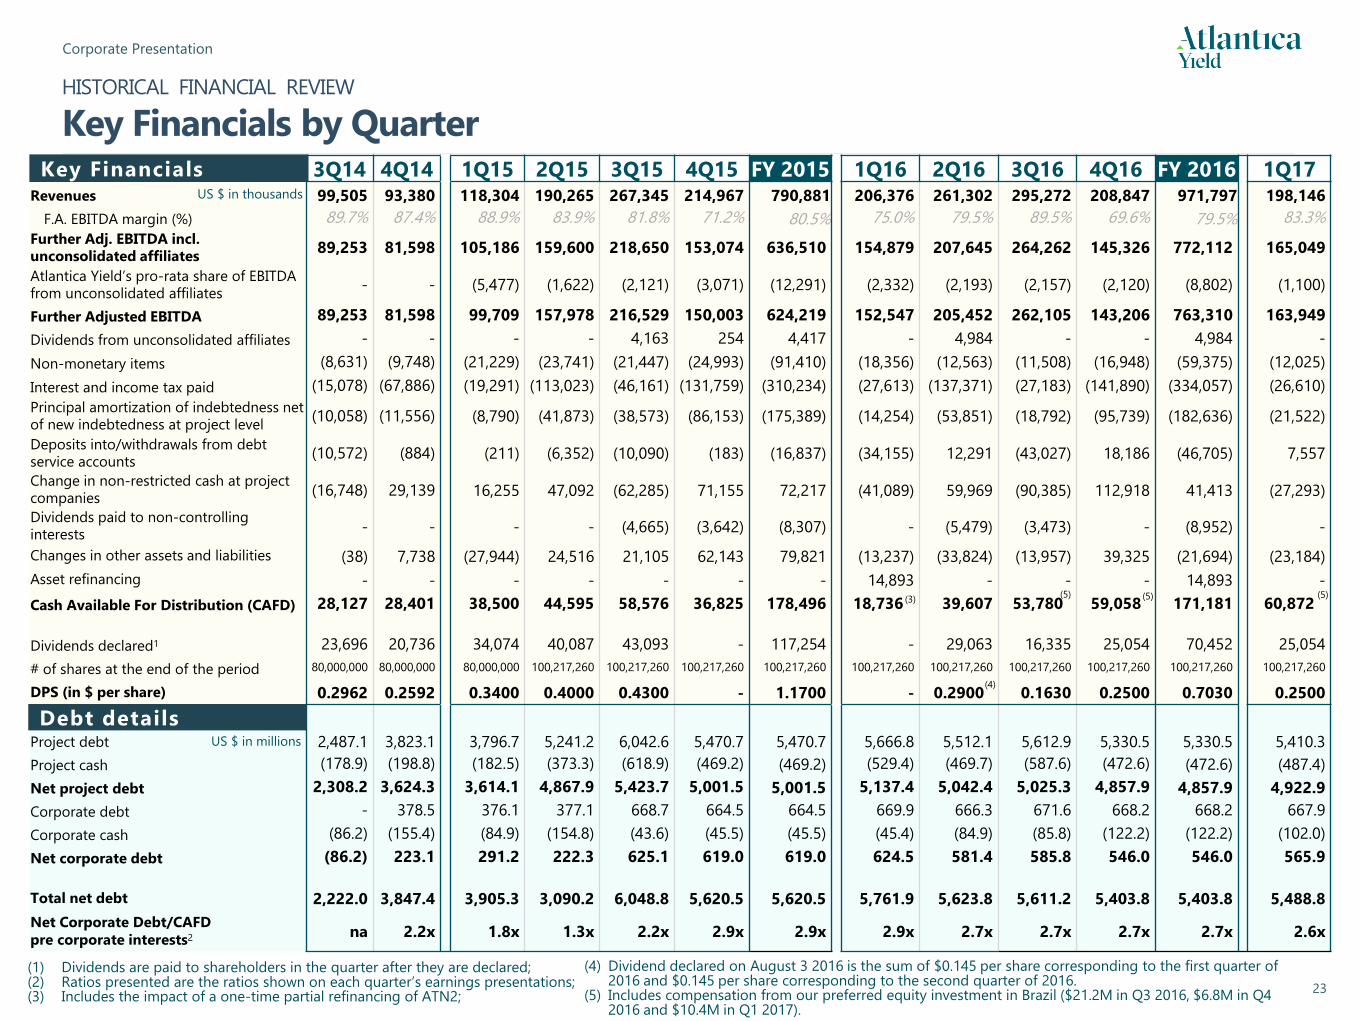
HISTORICAL FINANCIAL REVIEW
Key Financials by Quarter3Q14 4Q14 1Q15 2Q15 3Q15 4Q15 FY 2015 1Q16 2Q16 3Q16 4Q16 FY 2016 1Q17
Revenues 99,505 93,380 118,304 190,265 267,345 214,967 790,881 206,376 261,302 295,272 208,847 971,797 198,146
F.A. EBITDA margin (%) 89.7% 87.4% 88.9% 83.9% 81.8% 71.2% 80.5% 75.0% 79.5% 89.5% 69.6% 79.5% 83.3%
Further Adj. EBITDA incl.
unconsolidated affiliates89,253 81,598 105,186 159,600 218,650 153,074 636,510 154,879 207,645 264,262 145,326 772,112 165,049
Atlantica Yield’s pro-rata share of EBITDA
from unconsolidated affiliates- - (5,477) (1,622) (2,121) (3,071) (12,291) (2,332) (2,193) (2,157) (2,120) (8,802) (1,100)
Further Adjusted EBITDA 89,253 81,598 99,709 157,978 216,529 150,003 624,219 152,547 205,452 262,105 143,206 763,310 163,949
Dividends from unconsolidated affiliates - - - - 4,163 254 4,417 - 4,984 - - 4,984 -
Non-monetary items (8,631) (9,748) (21,229) (23,741) (21,447) (24,993) (91,410) (18,356) (12,563) (11,508) (16,948) (59,375) (12,025)
Interest and income tax paid (15,078) (67,886) (19,291) (113,023) (46,161) (131,759) (310,234) (27,613) (137,371) (27,183) (141,890) (334,057) (26,610)
Principal amortization of indebtedness net
of new indebtedness at project level(10,058) (11,556) (8,790) (41,873) (38,573) (86,153) (175,389) (14,254) (53,851) (18,792) (95,739) (182,636) (21,522)
Deposits into/withdrawals from debt
service accounts(10,572) (884) (211) (6,352) (10,090) (183) (16,837) (34,155) 12,291 (43,027) 18,186 (46,705) 7,557
Change in non-restricted cash at project
companies(16,748) 29,139 16,255 47,092 (62,285) 71,155 72,217 (41,089) 59,969 (90,385) 112,918 41,413 (27,293)
Dividends paid to non-controlling
interests- - - - (4,665) (3,642) (8,307) - (5,479) (3,473) - (8,952) -
Changes in other assets and liabilities (38) 7,738 (27,944) 24,516 21,105 62,143 79,821 (13,237) (33,824) (13,957) 39,325 (21,694) (23,184)
Asset refinancing - - - - - - - 14,893 - - - 14,893 -
Cash Available For Distribution (CAFD) 28,127 28,401 38,500 44,595 58,576 36,825 178,496 18,736.. 39,607 53,780 . 59,058 171,181 60,872
Dividends declared1 23,696 20,736 34,074 40,087 43,093 - 117,254 - 29,063 16,335 25,054 70,452 25,054
# of shares at the end of the period 80,000,000 80,000,000 80,000,000 100,217,260 100,217,260 100,217,260 100,217,260 100,217,260 100,217,260 100,217,260 100,217,260 100,217,260 100,217,260
DPS (in $ per share) 0.2962 0.2592 0.3400 0.4000 0.4300 - 1.1700 - 0.2900.. 0.1630 0.2500 0.7030 0.2500
Project debt 2,487.1 3,823.1 3,796.7 5,241.2 6,042.6 5,470.7 5,470.7 5,666.8 5,512.1 5,612.9 5,330.5 5,330.5 5,410.3
Project cash (178.9) (198.8) (182.5) (373.3) (618.9) (469.2) (469.2) (529.4) (469.7) (587.6) (472.6) (472.6) (487.4)
Net project debt 2,308.2 3,624.3 3,614.1 4,867.9 5,423.7 5,001.5 5,001.5 5,137.4 5,042.4 5,025.3 4,857.9 4,857.9 4,922.9
Corporate debt - 378.5 376.1 377.1 668.7 664.5 664.5 669.9 666.3 671.6 668.2 668.2 667.9
Corporate cash (86.2) (155.4) (84.9) (154.8) (43.6) (45.5) (45.5) (45.4) (84.9) (85.8) (122.2) (122.2) (102.0)
Net corporate debt (86.2) 223.1 291.2 222.3 625.1 619.0 619.0 624.5 581.4 585.8 546.0 546.0 565.9
Total net debt 2,222.0 3,847.4 3,905.3 3,090.2 6,048.8 5,620.5 5,620.5 5,761.9 5,623.8 5,611.2 5,403.8 5,403.8 5,488.8
Net Corporate Debt/CAFD
pre corporate interests2 na 2.2x 1.8x 1.3x 2.2x 2.9x 2.9x 2.9x 2.7x 2.7x 2.7x 2.7x 2.6x
(1) Dividends are paid to shareholders in the quarter after they are declared;(2) Ratios presented are the ratios shown on each quarter’s earnings presentations;(3) Includes the impact of a one-time partial refinancing of ATN2;
Debt details
Key FinancialsUS $ in thousands
US $ in millions
(3)
(4) Dividend declared on August 3 2016 is the sum of $0.145 per share corresponding to the first quarter of 2016 and $0.145 per share corresponding to the second quarter of 2016.
(5) Includes compensation from our preferred equity investment in Brazil ($21.2M in Q3 2016, $6.8M in Q4 2016 and $10.4M in Q1 2017).
(4)
(5) (5) (5)
Corporate Presentation
24
HISTORICAL FINANCIAL REVIEW
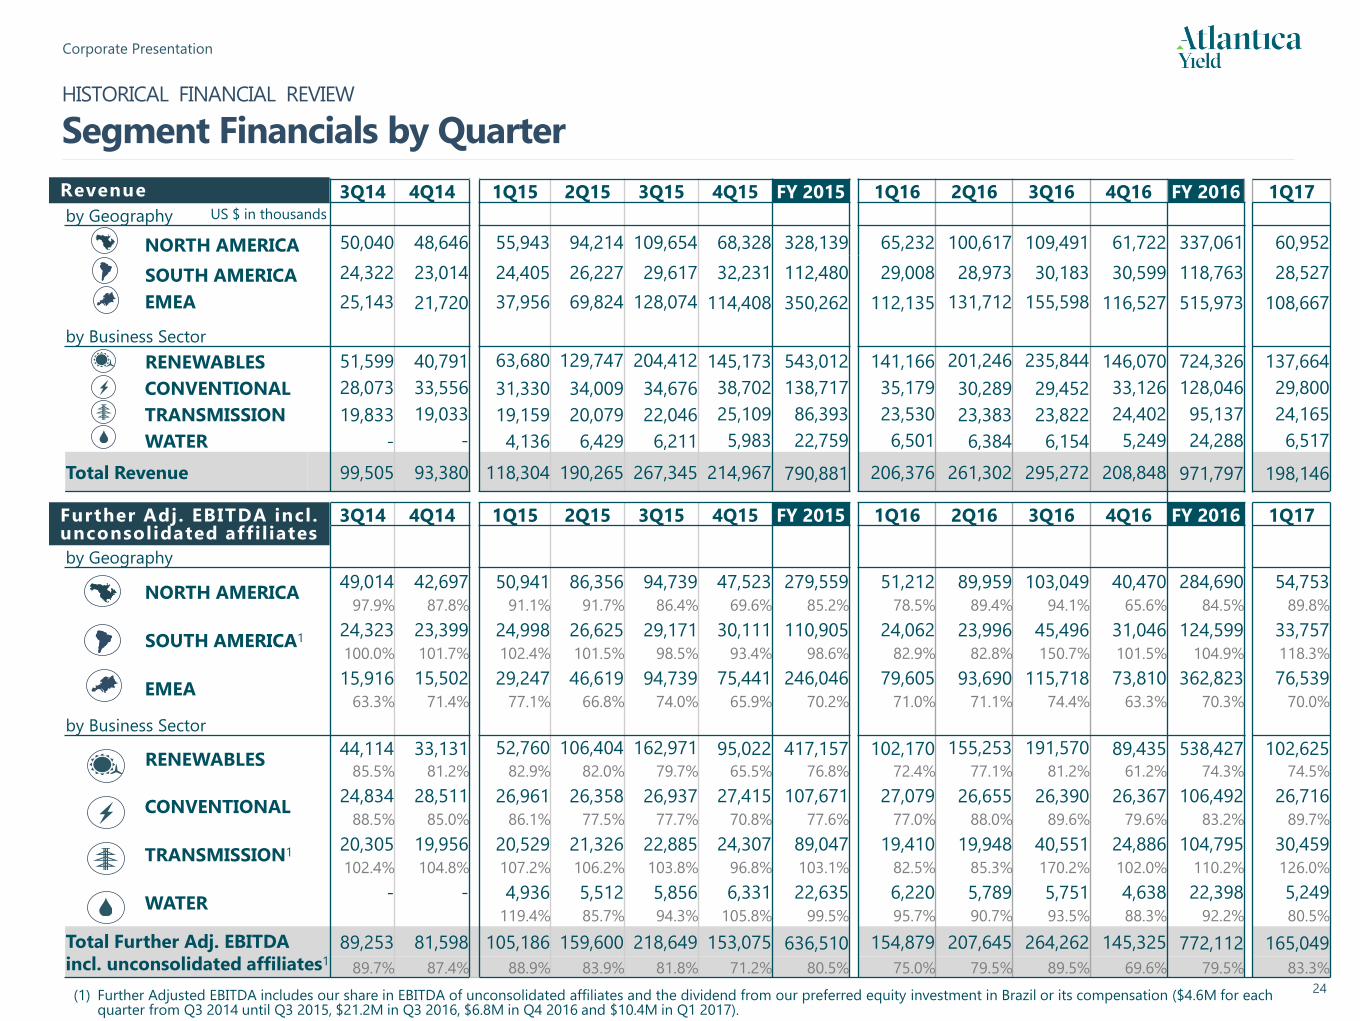
Segment Financials by Quarter
3Q14 4Q14 1Q15 2Q15 3Q15 4Q15 FY 2015 1Q16 2Q16 3Q16 4Q16 FY 2016 1Q17
by Geography
NORTH AMERICA 50,040 48,646 55,943 94,214 109,654 68,328 328,139 65,232 100,617 109,491 61,722 337,061 60,952
SOUTH AMERICA 24,322 23,014 24,405 26,227 29,617 32,231 112,480 29,008 28,973 30,183 30,599 118,763 28,527
EMEA 25,143 21,720 37,956 69,824 128,074 114,408 350,262 112,135 131,712 155,598 116,527 515,973 108,667
by Business Sector
RENEWABLES 51,599 40,791 63,680 129,747 204,412 145,173 543,012 141,166 201,246 235,844 146,070 724,326 137,664
CONVENTIONAL 28,073 33,556 31,330 34,009 34,676 38,702 138,717 35,179 30,289 29,452 33,126 128,046 29,800
TRANSMISSION 19,833 19,033 19,159 20,079 22,046 25,109 86,393 23,530 23,383 23,822 24,402 95,137 24,165
WATER - - 4,136 6,429 6,211 5,983 22,759 6,501 6,384 6,154 5,249 24,288 6,517
Total Revenue 99,505 93,380 118,304 190,265 267,345 214,967 790,881 206,376 261,302 295,272 208,848 971,797 198,146
3Q14 4Q14 1Q15 2Q15 3Q15 4Q15 FY 2015 1Q16 2Q16 3Q16 4Q16 FY 2016 1Q17
by Geography
NORTH AMERICA49,014 42,697 50,941 86,356 94,739 47,523 279,559 51,212 89,959 103,049 40,470 284,690 54,753
97.9% 87.8% 91.1% 91.7% 86.4% 69.6% 85.2% 78.5% 89.4% 94.1% 65.6% 84.5% 89.8%
SOUTH AMERICA124,323 23,399 24,998 26,625 29,171 30,111 110,905 24,062 23,996 45,496 31,046 124,599 33,757
100.0% 101.7% 102.4% 101.5% 98.5% 93.4% 98.6% 82.9% 82.8% 150.7% 101.5% 104.9% 118.3%
EMEA15,916 15,502 29,247 46,619 94,739 75,441 246,046 79,605 93,690 115,718 73,810 362,823 76,539
63.3% 71.4% 77.1% 66.8% 74.0% 65.9% 70.2% 71.0% 71.1% 74.4% 63.3% 70.3% 70.0%
by Business Sector
RENEWABLES44,114 33,131 52,760 106,404 162,971 95,022 417,157 102,170 155,253 191,570 89,435 538,427 102,625
85.5% 81.2% 82.9% 82.0% 79.7% 65.5% 76.8% 72.4% 77.1% 81.2% 61.2% 74.3% 74.5%
CONVENTIONAL24,834 28,511 26,961 26,358 26,937 27,415 107,671 27,079 26,655 26,390 26,367 106,492 26,716
88.5% 85.0% 86.1% 77.5% 77.7% 70.8% 77.6% 77.0% 88.0% 89.6% 79.6% 83.2% 89.7%
TRANSMISSION1 20,305 19,956 20,529 21,326 22,885 24,307 89,047 19,410 19,948 40,551 24,886 104,795 30,459
102.4% 104.8% 107.2% 106.2% 103.8% 96.8% 103.1% 82.5% 85.3% 170.2% 102.0% 110.2% 126.0%
WATER- - 4,936 5,512 5,856 6,331 22,635 6,220 5,789 5,751 4,638 22,398 5,249
119.4% 85.7% 94.3% 105.8% 99.5% 95.7% 90.7% 93.5% 88.3% 92.2% 80.5%
Total Further Adj. EBITDA
incl. unconsolidated affiliates1
89,253 81,598 105,186 159,600 218,649 153,075 636,510 154,879 207,645 264,262 145,325 772,112 165,049
89.7% 87.4% 88.9% 83.9% 81.8% 71.2% 80.5% 75.0% 79.5% 89.5% 69.6% 79.5% 83.3%
US $ in thousands
Revenue
Further Adj. EBITDA incl. unconsolidated affil iates
(1) Further Adjusted EBITDA includes our share in EBITDA of unconsolidated affiliates and the dividend from our preferred equity investment in Brazil or its compensation ($4.6M for each quarter from Q3 2014 until Q3 2015, $21.2M in Q3 2016, $6.8M in Q4 2016 and $10.4M in Q1 2017).
Corporate Presentation
25
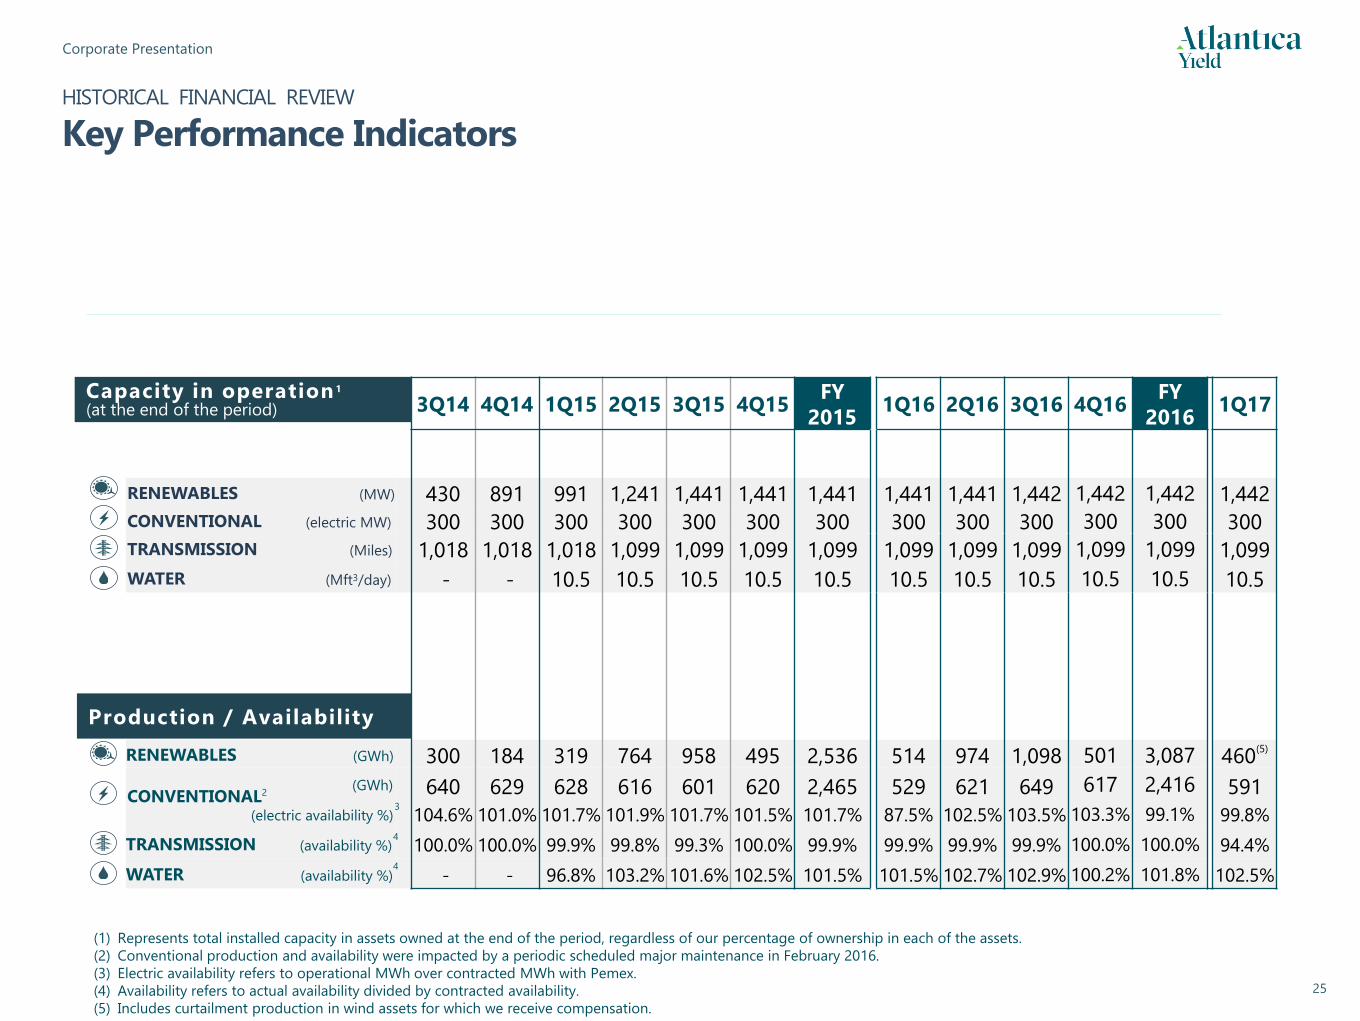
HISTORICAL FINANCIAL REVIEW
Key Performance Indicators
3Q14 4Q14 1Q15 2Q15 3Q15 4Q15FY
20151Q16 2Q16 3Q16 4Q16
FY
20161Q17
RENEWABLES (MW) 430 891 991 1,241 1,441 1,441 1,441 1,441 1,441 1,442 1,442 1,442 1,442
CONVENTIONAL (electric MW) 300 300 300 300 300 300 300 300 300 300 300 300 300
TRANSMISSION (Miles) 1,018 1,018 1,018 1,099 1,099 1,099 1,099 1,099 1,099 1,099 1,099 1,099 1,099
WATER (Mft3/day) - - 10.5 10.5 10.5 10.5 10.5 10.5 10.5 10.5 10.5 10.5 10.5
RENEWABLES (GWh) 300 184 319 764 958 495 2,536 514 974 1,098 501 3,087 460(5)
(GWh) 640 629 628 616 601 620 2,465 529 621 649 617 2,416 591
(electric availability %) 104.6% 101.0% 101.7% 101.9% 101.7% 101.5% 101.7% 87.5% 102.5% 103.5% 103.3% 99.1% 99.8%
TRANSMISSION (availability %) 100.0% 100.0% 99.9% 99.8% 99.3% 100.0% 99.9% 99.9% 99.9% 99.9% 100.0% 100.0% 94.4%
WATER (availability %) - - 96.8% 103.2% 101.6% 102.5% 101.5% 101.5% 102.7% 102.9% 100.2% 101.8% 102.5%
CONVENTIONAL2
Capacity in operation 1
(at the end of the period)
Production / Availability
(1) Represents total installed capacity in assets owned at the end of the period, regardless of our percentage of ownership in each of the assets.
(2) Conventional production and availability were impacted by a periodic scheduled major maintenance in February 2016.
(3) Electric availability refers to operational MWh over contracted MWh with Pemex.
(4) Availability refers to actual availability divided by contracted availability.
(5) Includes curtailment production in wind assets for which we receive compensation.
3
4
4
Corporate Presentation
26
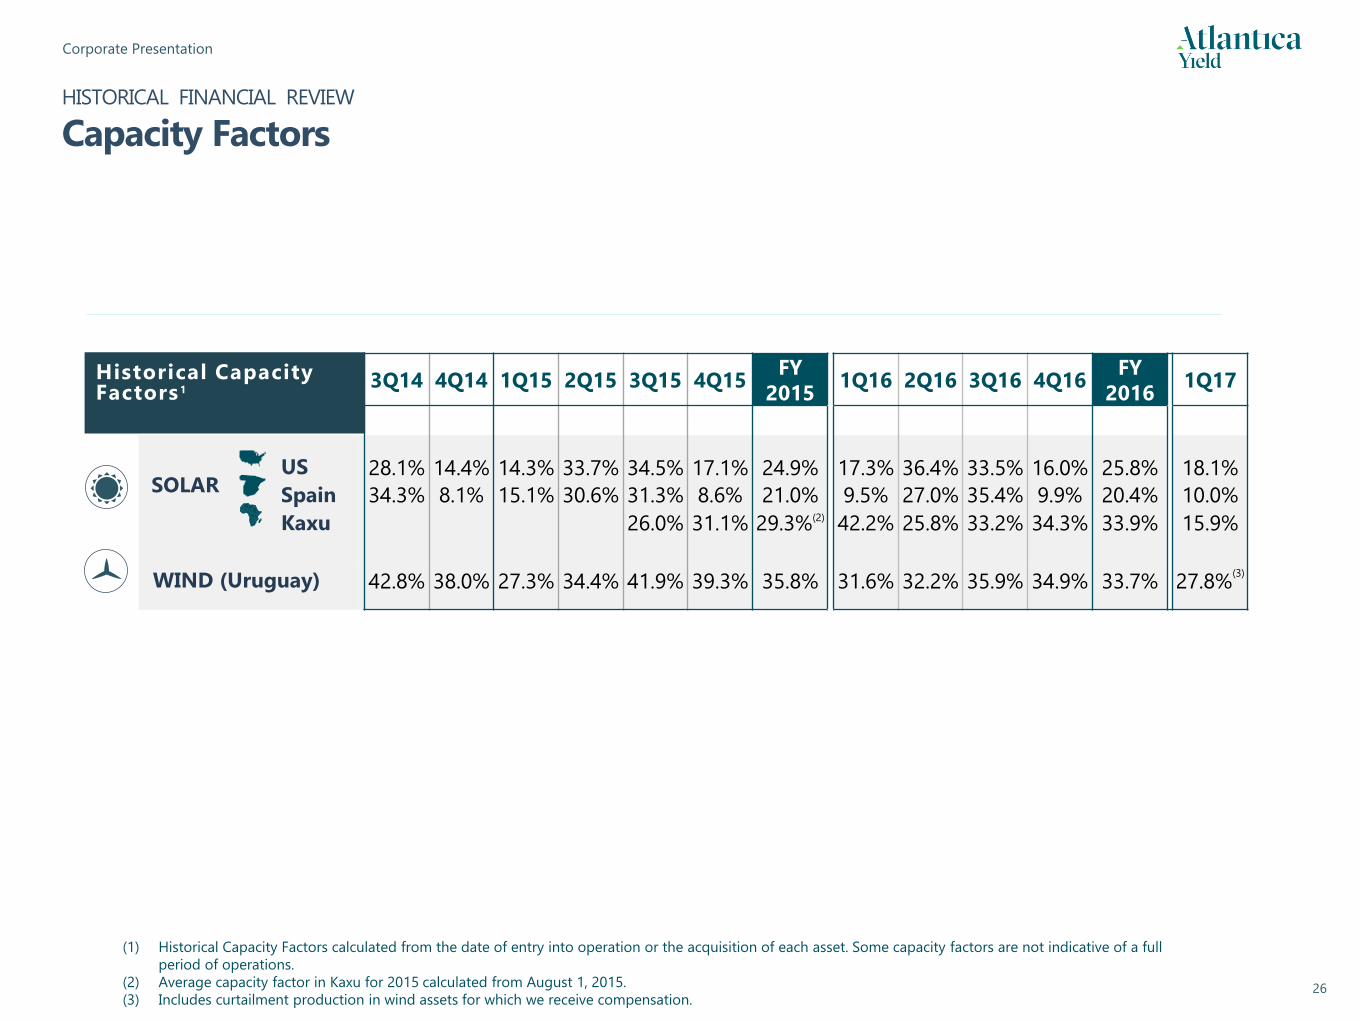
HISTORICAL FINANCIAL REVIEW
Capacity Factors
(1) Historical Capacity Factors calculated from the date of entry into operation or the acquisition of each asset. Some capacity factors are not indicative of a full
period of operations.
(2) Average capacity factor in Kaxu for 2015 calculated from August 1, 2015.
(3) Includes curtailment production in wind assets for which we receive compensation.
3Q14 4Q14 1Q15 2Q15 3Q15 4Q15FY
20151Q16 2Q16 3Q16 4Q16
FY
20161Q17
US 28.1% 14.4% 14.3% 33.7% 34.5% 17.1% 24.9% 17.3% 36.4% 33.5% 16.0% 25.8% 18.1%
Spain 34.3% 8.1% 15.1% 30.6% 31.3% 8.6% 21.0% 9.5% 27.0% 35.4% 9.9% 20.4% 10.0%
Kaxu 26.0% 31.1% 29.3%(2) 42.2% 25.8% 33.2% 34.3% 33.9% 15.9%
WIND (Uruguay) 42.8% 38.0% 27.3% 34.4% 41.9% 39.3% 35.8% 31.6% 32.2% 35.9% 34.9% 33.7% 27.8%(3)
SOLAR
Historical Capacity Factors 1
Corporate Presentation
27
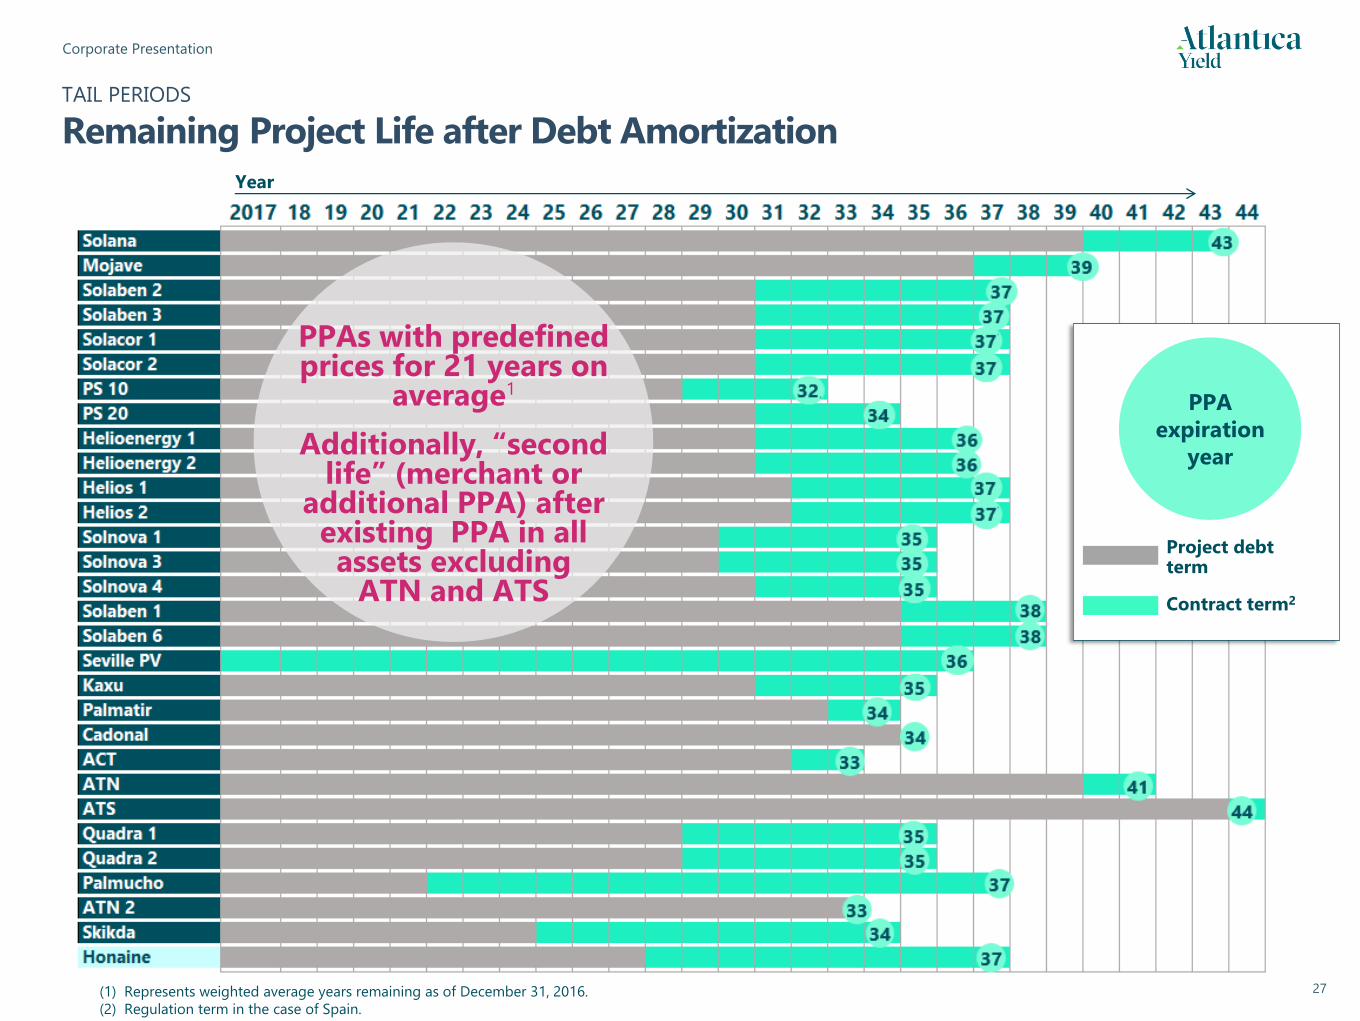
TAIL PERIODS
Remaining Project Life after Debt Amortization
PPAs with predefined prices for 21 years on
average1
Additionally, “second life” (merchant or
additional PPA) after existing PPA in all assets excluding
ATN and ATS
PPA
expiration
year
Contract term2
Project debt term
Year
(1) Represents weighted average years remaining as of December 31, 2016.
(2) Regulation term in the case of Spain.

Corporate Presentation
28
2017 2018 2019 2020 2021 Thereafter Total
NORTH AMERICA 58.3 60.3 70.1 80.2 79.0 1,523.0 1,870.9
SOUTH AMERICA 31.7 23.1 25.4 28.3 31.4 755.3 895.3
EMEA 121.2 125.6 133.6 138.6 150.6 1,894.8 2,564.3
Total 211.2 209.0 229.1 247.1 261.0 4,173.1 5,330.5
US $ in millions
PROJECT DEBT
Repayment Schedule as of December 31, 2016
2017 2018 2019 2020 2021 Thereafter Total
RENEWABLES 157.0 170.7 182.2 190.9 200.9 3,077.4 3,979.1
CONVENTIONAL 27.7 16.8 23.2 30.1 31.4 469.0 598.3
TRANSMISSION 21.5 16.4 18.5 20.6 23.0 611.6 711.5
WATER 5.0 5.1 5.2 5.5 5.7 15.1 41.6
Total 211.2 209.0 229.1 247.1 261.0 4,173.1 5,330.5
Exchange rates as of December 31, 2016: (EUR/USD = 1.0517)
Corporate Presentation
29
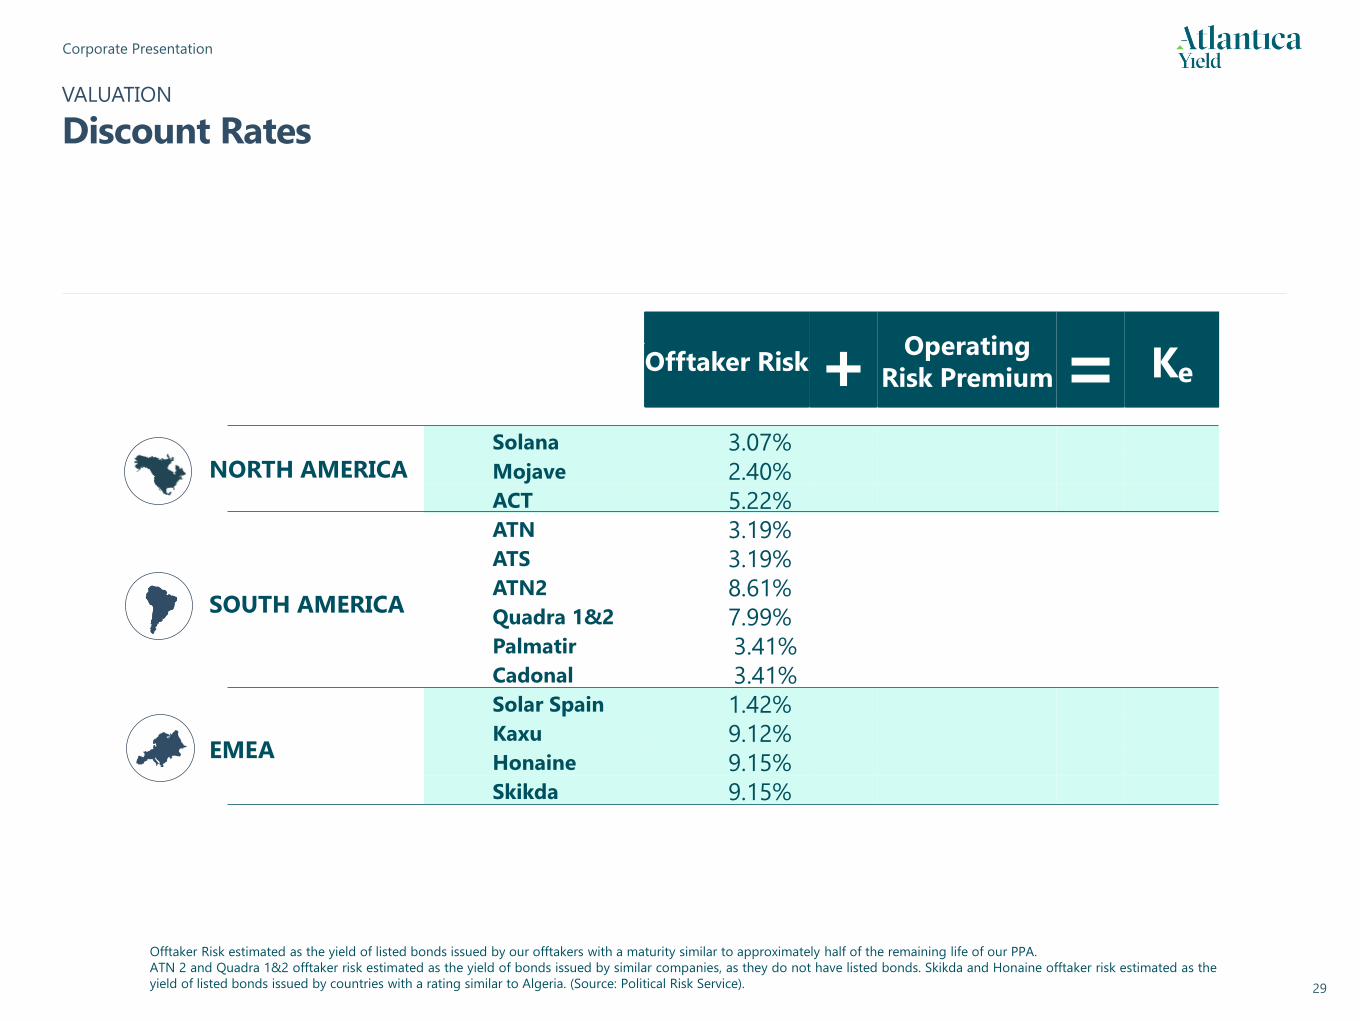
Offtaker Risk +Operating
Risk Premium = Ke
Solana 3.07%
Mojave 2.40%ACT 5.22%ATN 3.19%ATS 3.19% ATN2 8.61%Quadra 1&2 7.99%Palmatir 3.41%Cadonal 3.41%Solar Spain 1.42%Kaxu 9.12%Honaine 9.15%Skikda 9.15%
Offtaker Risk estimated as the yield of listed bonds issued by our offtakers with a maturity similar to approximately half of the remaining life of our PPA.
ATN 2 and Quadra 1&2 offtaker risk estimated as the yield of bonds issued by similar companies, as they do not have listed bonds. Skikda and Honaine offtaker risk estimated as the
yield of listed bonds issued by countries with a rating similar to Algeria. (Source: Political Risk Service).
VALUATION
Discount Rates
NORTH AMERICA
SOUTH AMERICA
EMEA
Corporate Presentation
30
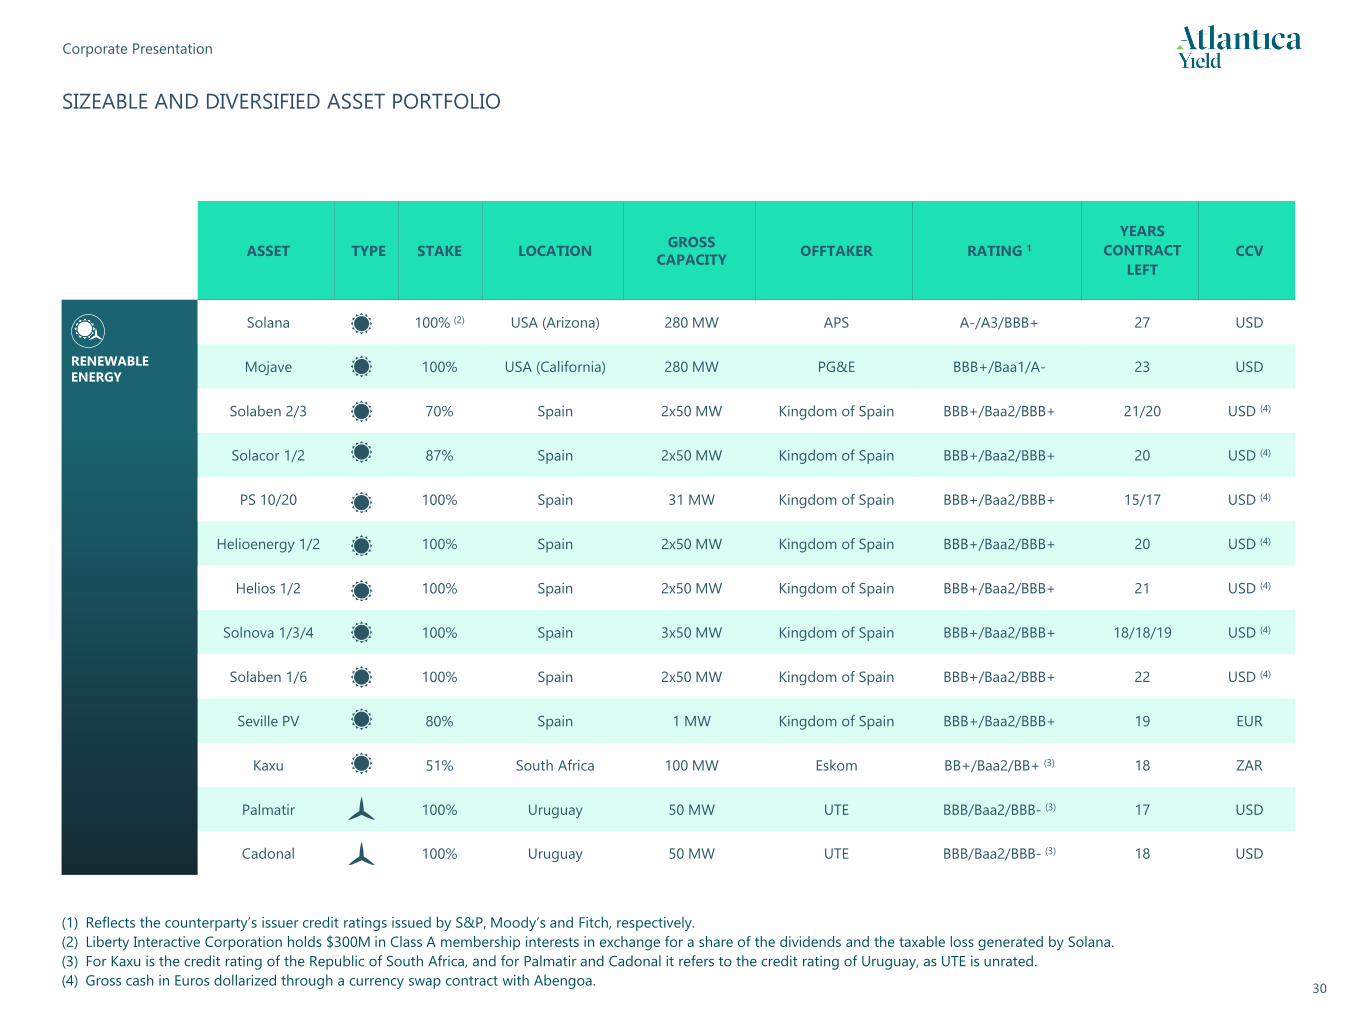
SIZEABLE AND DIVERSIFIED ASSET PORTFOLIO
ASSET TYPE STAKE LOCATIONGROSS
CAPACITYOFFTAKER RATING 1
YEARS
CONTRACT
LEFT
CCV
RENEWABLE
ENERGY
Solana 100% (2) USA (Arizona) 280 MW APS A-/A3/BBB+ 27 USD
Mojave 100% USA (California) 280 MW PG&E BBB+/Baa1/A- 23 USD
Solaben 2/3 70% Spain 2x50 MW Kingdom of Spain BBB+/Baa2/BBB+ 21/20 USD (4)
Solacor 1/2 87% Spain 2x50 MW Kingdom of Spain BBB+/Baa2/BBB+ 20 USD (4)
PS 10/20 100% Spain 31 MW Kingdom of Spain BBB+/Baa2/BBB+ 15/17 USD (4)
Helioenergy 1/2 100% Spain 2x50 MW Kingdom of Spain BBB+/Baa2/BBB+ 20 USD (4)
Helios 1/2 100% Spain 2x50 MW Kingdom of Spain BBB+/Baa2/BBB+ 21 USD (4)
Solnova 1/3/4 100% Spain 3x50 MW Kingdom of Spain BBB+/Baa2/BBB+ 18/18/19 USD (4)
Solaben 1/6 100% Spain 2x50 MW Kingdom of Spain BBB+/Baa2/BBB+ 22 USD (4)
Seville PV 80% Spain 1 MW Kingdom of Spain BBB+/Baa2/BBB+ 19 EUR
Kaxu 51% South Africa 100 MW Eskom BB+/Baa2/BB+ (3) 18 ZAR
Palmatir 100% Uruguay 50 MW UTE BBB/Baa2/BBB- (3) 17 USD
Cadonal 100% Uruguay 50 MW UTE BBB/Baa2/BBB- (3) 18 USD
(1) Reflects the counterparty’s issuer credit ratings issued by S&P, Moody’s and Fitch, respectively.
(2) Liberty Interactive Corporation holds $300M in Class A membership interests in exchange for a share of the dividends and the taxable loss generated by Solana.
(3) For Kaxu is the credit rating of the Republic of South Africa, and for Palmatir and Cadonal it refers to the credit rating of Uruguay, as UTE is unrated.
(4) Gross cash in Euros dollarized through a currency swap contract with Abengoa.
Corporate Presentation
31
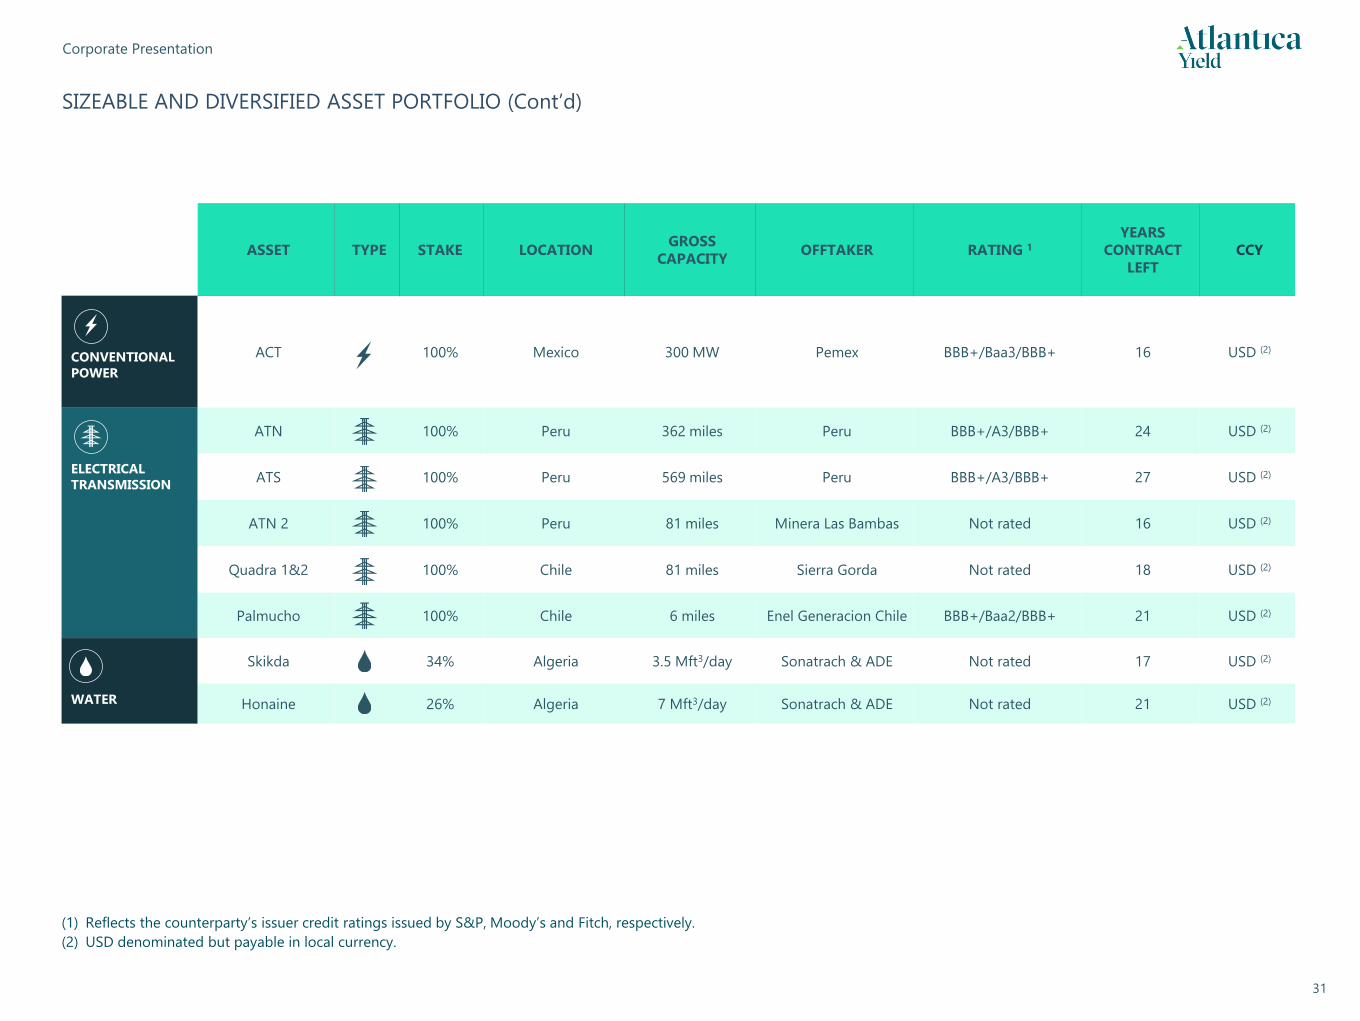
SIZEABLE AND DIVERSIFIED ASSET PORTFOLIO (Cont’d)
ASSET TYPE STAKE LOCATIONGROSS
CAPACITYOFFTAKER RATING 1
YEARS
CONTRACT
LEFT
CCY
CONVENTIONAL
POWER
ACT 100% Mexico 300 MW Pemex BBB+/Baa3/BBB+ 16 USD (2)
ELECTRICAL
TRANSMISSION
ATN 100% Peru 362 miles Peru BBB+/A3/BBB+ 24 USD (2)
ATS 100% Peru 569 miles Peru BBB+/A3/BBB+ 27 USD (2)
ATN 2 100% Peru 81 miles Minera Las Bambas Not rated 16 USD (2)
Quadra 1&2 100% Chile 81 miles Sierra Gorda Not rated 18 USD (2)
Palmucho 100% Chile 6 miles Enel Generacion Chile BBB+/Baa2/BBB+ 21 USD (2)
WATER
Skikda 34% Algeria 3.5 Mft3/day Sonatrach & ADE Not rated 17 USD (2)
Honaine 26% Algeria 7 Mft3/day Sonatrach & ADE Not rated 21 USD (2)
(1) Reflects the counterparty’s issuer credit ratings issued by S&P, Moody’s and Fitch, respectively.
(2) USD denominated but payable in local currency.

Great West House, GW1, 17th floor,
Great West Road
Brentford TW8 9DF
London (United Kingdom)