corporate presentation a bright future
TRANSCRIPT

www.trans-globe.com
AIM & TSX: TGL NASDAQ: TGA
CORPORATE PRESENTATION
A BRIGHT FUTURE
August 2021

CAUTIONARY STATEMENT
Slide 2
The information provided in this presentation is provided as of August 6, 2021 for informational purposes only, is not complete, is based (in part) on information prepared forinternal evaluation purposes and may not contain certain material information about TransGlobe Energy Corporation ("TransGlobe", "TGL", "TGA" or the "Company"),including important disclosures and risk factors associated with the information disclosed in this presentation. This presentation does not constitute an offer to sell or asolicitation of an offer to buy any security in Canada, the United States, the United Kingdom or any other jurisdiction. The content of this presentation has not been reviewedor approved by any securities commission or regulatory authority in Canada, the United States, the United Kingdom or any other jurisdiction. TransGlobe expressly disclaimsany duty to make disclosure or any filings with any securities commission or regulatory authority, except as required by applicable securities laws. See "CautionaryStatements" beginning on slide 39 for other important disclosures regarding forward looking information, financial outlook and other financial matters, oil and gasinformation and other important information.
All dollar values are expressed in US dollars unless otherwise stated.
All production and reserves are company gross working interest share of volumes before deduction of royalty unless otherwise stated.
Please see the table entitled “Production Disclosure” at the end of this presentation for the detailed constituent product types and their respective quantities measuredat the first point of sale for all production amounts disclosed in this presentation on a Bopd and Boepd basis.
TransGlobe Energy | Corporate Presentation | August 2021

TRANSGLOBE REBORN
Slide 3
Transformational Changes Announced In Late 2020 Allows Company To Significantly Benefit From Oil Price Recovery
Recently Announced PSC Consolidation Will Transform Company’s Egyptian PortfolioExtended life, improved netbacks will allow the pursuit of expanded resource potential
Shareholder Returns: Returning value to shareholders2021 will focus on recovering production to be followed by a focus on distributions
Regional Reputation: Strong platform to grow in Egypt and region Company actively seeking mergers and acquisition opportunities in Egypt and region
Significant Development Potential in CanadaWill seek to reduce uncertainty and accelerate development of South Harmattan in 2021
Will Continue to Control Spending and Manage Balance Sheet Conservatively2020 response to oil price volatility a testament to our proven approach
See Cautionary Statements – "Forward-Looking Statements and Information“ and “Oil and Gas Information”
TransGlobe Energy | Corporate Presentation | August 2021

CORPORATE SNAPSHOTPRODUCTION BASE AND NEW EGYPTIAN TERMS UNDERLINE VALUATION DISCONNECT
Slide 4
See Cautionary Statements – "Forward-Looking Statements and Information“
1 Includes: $75MM Prepayment Agreement from Mercuria Energy Trading SA ($10MM drawn as at 06/30/2021); and C$22.5MM Reserves-based lending facility (C$8.6 MM drawn as at 06/30/2021)
2 Current Assets (including cash and cash equivalents, excluding inventoried crude oil) minus Current Liabilities (excluding the current portion of long-term debt)
3 Estimated value of inventoried crude oil is based on average realized price of Gharib blend for Q2 ‘21 sales/inventoried crude oil as at 06/30/20214 Enterprise value calculated as Market Capitalization + Long term debt (including the current portion) – Working capital (Current Assets (excluding book value of crude
inventory) - Current Liabilities (excluding the current portion of long-term debt)) – Market value of inventoried crude oil5 Based on GLJ reserves evaluation effective 12/31/20. See Cautionary Statements – "Oil and Gas Information“
13.1 MboepdQ2-2021 Production
$125.5 MMMarket Capitalization
$17.2 MMSix Months Ended 06/30/21 Funds Flow
$110.6 MMEnterprise Value
38.9 MMboe2P Reserves 12/31/20
5
$43.6 MMCash On Hand 06/30/21
Enterprise Value Estimate (US$ MM)
Shares Outstanding (06/30/21) – MM shares ~72.5
Market Capitalization (07/29/21) - $1.73/share $125.5
Debt (06/30/21) (Prepay Agreement + Canadian RBL) 1 $17.0
Working Capital (06/30/21) 2 Excl. Crude Inventory & Current portion of LTD $23.4
Est. Market Value of Crude Inventory 3 (~0.1 MMbbls - 06/30/21) $8.5
Enterprise Value 4 $110.6
• Q1 funds flow impacted by low oil sales in Egypt – caught up in Q2
• 2021 Operating focus on recovering production to pre-pandemic levels in Egypt and grow production in Canada,‒ Egypt 14-well drilling program kicked off in May,
‒ Canada 3-well drilling program kicked off in late June.
TransGlobe Energy | Corporate Presentation | August 2021
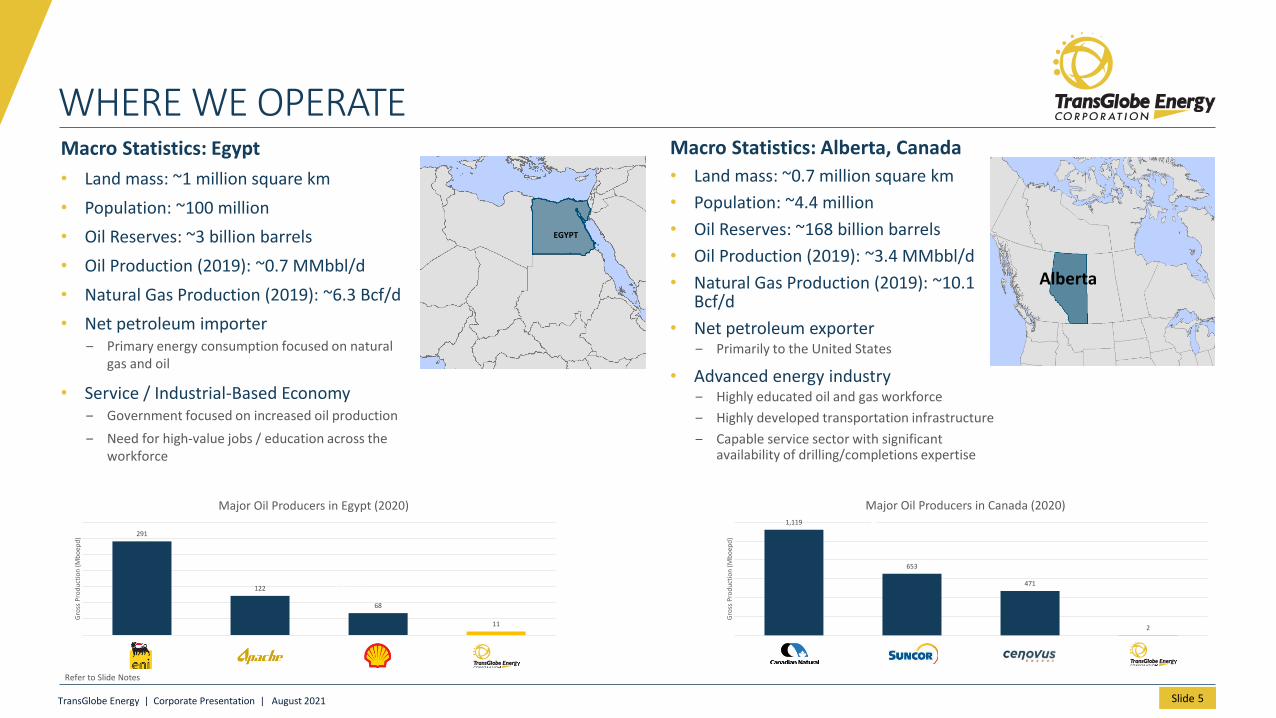
1,119
653
471
2
CNRL Suncor Cenovus TGL
Gro
ss P
rod
uct
ion
(M
bo
epd
)
Major Oil Producers in Canada (2020)
291
122
68
11
ENI APA Shell TGL
Gro
ss P
rod
uct
ion
(M
bo
epd
)
Major Oil Producers in Egypt (2020)
Refer to Slide Notes
WHERE WE OPERATE
Slide 5
Calgary
Macro Statistics: Egypt
• Land mass: ~1 million square km
• Population: ~100 million
• Oil Reserves: ~3 billion barrels
• Oil Production (2019): ~0.7 MMbbl/d
• Natural Gas Production (2019): ~6.3 Bcf/d
• Net petroleum importer‒ Primary energy consumption focused on natural
gas and oil
• Service / Industrial-Based Economy‒ Government focused on increased oil production
‒ Need for high-value jobs / education across the workforce
EGYPT
Macro Statistics: Alberta, Canada
• Land mass: ~0.7 million square km
• Population: ~4.4 million
• Oil Reserves: ~168 billion barrels
• Oil Production (2019): ~3.4 MMbbl/d
• Natural Gas Production (2019): ~10.1 Bcf/d
• Net petroleum exporter‒ Primarily to the United States
• Advanced energy industry‒ Highly educated oil and gas workforce
‒ Highly developed transportation infrastructure
‒ Capable service sector with significant availability of drilling/completions expertise
Alberta
TransGlobe Energy | Corporate Presentation | August 2021

Materially improved fiscal terms- Field netbacks will improve by >100% at Brent price of $60- Compensation payment made over 6 years
Effective Date of February 1, 2020- Approved by the Board of EGPC; anticipating customary ratification in H2 2021
CONSOLIDATED, EXTENDED, AND AMENDED EGYPTIAN EASTERN DESERT PRODUCTION SHARING CONTRACTS
Slide 6
The most important and material event in the Company’s 15-year history in Egypt
20-year (15-year primary + 5-year option) Contract Period- Average $10 MM/year financial commitment over the primary period
59.1 MMbbls Risked Contingent Resources
Three years in the making- Leveraged MoP and EGPC efforts to modernize the oil and gas industry and increase production
See Cautionary Statements – "Forward-Looking Information and Statements“ and “Advisory Regarding Oil and Gas Information”
TransGlobe Energy | Corporate Presentation | August 2021

$12.51
$21.11
$28.87
$36.20
$43.74
$51.20
$0
$10
$20
$30
$40
$50
$60
$30 $40 $50 $60 $70 $80
Net
bac
k ($
/bb
l)
WTI
Canada - Oil (US$)
$1.16
$3.20
$5.05
$6.81
$8.61
$10.40
$0
$2
$4
$6
$8
$10
$12
$30 $40 $50 $60 $70 $80
Net
bac
k ($
/bo
e)
WTI
Canada - Gas/NGLs (US$)
$1.55 $5.66
$9.78 $13.90
$18.02
$6.00
$8.00
$10.00
$12.00
$14.00
-$5
$0
$5
$10
$15
$20
$25
$30
$35
$30 $40 $50 $60 $70 $80
Net
bac
k ($
/bb
l)
Brent
Egypt (US$)
COMPANY INDICATIVE NETBACKS (AS OF 06/30/21)
Slide 7
US$ MMBtu $1.90 $1.97 $2.05 $2.13 $2.20 $2.29
Canadian Production• Economically robust at low prices, heavily torqued to higher prices• A typical Cardium well produces a combination of light oil, NGLs and
natural gas• TransGlobe’s current production mix in Canada is approximately
30%:35%:35% for light oil, NGLs and Gas• A notional prorata Boe would provide an ~$16.00 netback at WTI $60• Play newly extended into virgin South Harmattan area with expected
significant upside • Motivates Company to accelerate uncertainty reduction and exploitation of
South Harmattan
Egyptian Production• Base netbacks calculated for notional barrel under old concession terms• PG increment illustrates expected significant netback improvement from
newly-agreed merged Eastern Desert concession agreement • Revitalizes economic development and cash flow potential of entire
Egyptian portfolio
Refer to Slide Notes
($2.57)
$4.00
TransGlobe Energy | Corporate Presentation | August 2021

MERGED CONCESSION ALIGNS ASSET POTENTIAL WITH INVESTMENT INCENTIVES
Slide 8
• Increased net entitlement interests across the Merged Concession ‒ Cost oil recovery increase to 40% accelerates recovery of investment and facilitates additional development
‒ Profit oil ranging from ~20%-30% set on scale according to average Brent price and production
• Extends overall contract life to 2040‒ Especially critical for West Bakr as the major source of current production
• Re-aligns existing cost recovery pools with production to ensure complete recovery of historical costs within a new common ring-fence
West Gharib West Bakr NW Gharib . PetroGlobe
2021E Production 2.9 MBopd 6.6 MBopd 0.6 Mbopd 10.1 MBopd
Profit Oil 30% 15% 15% ~30%1
PSC Expiry 2026 + 5Yr Ext 2025 2037 + 5 Yr Ext 2035 + 5Yr Ext
Cost Recovery Oil 30% 30% 25% 40%
Excess Cost Oil 30% 0% 5% 15%
Current Eastern Desert Concessions Merged Concession
1) Based on a $60-80/bbl Brent price range and Eastern Desert only production of 10.1 MBopd
TransGlobe Energy | Corporate Presentation | August 2021

PETROGLOBE DEAL SUMMARY
Slide 9
• Deal creates value for all stakeholders‒ Margin and cash flow improvement
‒ Strong netbacks at current oil prices
‒ Increased investment will ultimately generate higher gross royalties for EGPC
• Production sharing aligned with development‒ Modernized fiscal terms allow for
increased field activity as oil prices recover
‒ Targeting 59.1 MMbbl risked Contingent Resources (1,2,3)
• Concession agreements (PSCs) consolidated and extended to 2040‒ Longer timeframe allows continued
sustainable, responsible investment
‒ Effective date of February 1, 2020
‒ Initial 15-year period, plus a 5-year extension option
Merged Agreement (Project PetroGlobe) with EGPC will increase recovery from Egyptian Assets
• Equalization adjustment to modernize fiscal framework‒ Innovative modernization of terms through Egypt’s brownfield
initiative
‒ Payments made to compensate Egypt for change in fiscal terms on legacy forecast base production
‒ Initial payment of $15 MM, then five payments of $10 MM per year from 2022
‒ Additional signing bonus of $1 MM
• Capital commitments of US$10 MM per year in five-year tranches over primary concession term
‒ Drives reserves and production growth benefiting both TransGlobe and EGPC
‒ Capital expenditures in Egypt have averaged ~$30 MM per year over the past 5 years
1) Refer to “Advisory Regarding Oil and Gas Information” below for important information regarding these contingent resources2) Not all resources targeted will translate into reserves3) Refer to “Resource Definitions” in Cautionary Statements below for detailed definitions of Contingent Resources
TransGlobe Energy | Corporate Presentation | August 2021

EGYPTIAN ASSET PORTFOLIO

MATERIAL RESOURCES
Slide 11
Impact of Merged Concession on Volumes and Production Sharing
Equalization payment compensates EGPC for reduced
government take on base
Increase in TransGlobe Share of Base
TransGlobe ShareEgypt Share
Expanding the PieBoth Egypt and TransGlobe
benefit from significant economic contingent resource potential
unlocked by new terms.
Best Estimate Risked Contingent Resources1
Project Maturity Sub-Class
Crude Oil
Gross (MMbbl) Net (MMbbl)
Development Pending/ On Hold 20.5 13.4
Development Unclarified 38.6 22.8
Total Economic Contingent Resources 59.1 36.2
Development Not Viable 2.1 1.3
1) Refer to “Advisory Regarding Oil and Gas Information” below for important information regarding these contingent resources.2) Year End 2020 Egypt Eastern Desert Total Gross Proved Plus Probable reserves = 23.5 MMbbl of oil (21.3 MMbbl heavy oil and 2.1 MMbbl light/ medium oil)Note: The areas within the pie chart are drawn to provide context and should not be used to infer the potential outcome of Project PetroGlobe
• Resource recovery opportunities may drive up to US$500 MM investment over 20-year period ‒ Secondary and tertiary recovery (e.g. polymer floods),
where investment was not previously warranted
‒ Extended field life supports long term sustainable investment, including ESG projects
TransGlobe Energy | Corporate Presentation | August 2021

EXISTING EASTERN DESERT: THREE 100% WI CONCESSIONS
Slide 12
Eastern Desert acquisitions (2007 and 2011) are a template for the Company’s corporate strategy:
• Older fields, large resource, unloved / undervalued by prior owners
• Rigorous technical work, capital discipline and transfer of proven Western oilfield technologies
• Exploit, Develop and Explore
Egypt Production (all concessions):
• 2021 Q2 average 10.7 Mbopd
• 2021 guidance of 9.7 to 10.5 Mbopd
Egypt Reserves (all concessions):
• 1P – 13.6 MMbbls at December 31, 2020
• 2P – 24.2 MMbbls at December 31, 2020
Beyond 2021: PETROGLOBE• Concession consolidation agreed
• Advance primary, secondary, and tertiary development programs to increase recoveries and production
• Assets remain investible at lower oil prices
See Cautionary Statements – "Forward-Looking Information and Statements“ and “Oil and Gas Information”Reserves disclosures are based on GLJ evaluations effective 12/31/20
NWG Exploration
NWG-3B-2 appraisal
Arta Phase 1 DevelopmentArta/East Arta Recompletes/optimization
Infill Drilling Recompletes/optimization
H-block Appraisal& Development
Deferred Activity
H-block Exploration
TransGlobe Energy | Corporate Presentation | August 2021

EGYPT 2021 FORECASTED CAPITAL
Slide 13
• 14 new wells scheduled in 2021‒ To the end of the second quarter, two locations have been drilled in West Bakr. Dependent upon anticipated rig efficiencies,
the Company expects to drill two additional wells (an exploration well, SGZ-7B, and a well in K-field) as listed above as a partof the 2021 drilling program
• Other spending relates to HSE, contractual training bonuses, select recompletions and workovers, land retention commitments, and includes:‒ 3 recompletions and 3 artificial lift system optimizations in Egypt
2021 Capital Breakdown (US$MM)
TransGlobe Net Capital (US$MM) Gross Well CountConcession Development Exploration Total
Capex
New Drills Total WellsWells Other Wells Dev Expl
West Gharib 0.8 2.1 1.7 2 2 West Bakr 8.6 5.1 9.7 10 10NW Gharib 1.5 0.1 1.5 1 1
South Ghazalat 0.6 1.3 1.7 1 1
Egypt Total 10.9 7.9 1.3 20.1 13 1 14
TransGlobe Energy | Corporate Presentation | August 2021

INCREMENTAL CONTINGENT RESOURCES(1,2,3)
UNLOCKED BY NEAR-TERM PETROGLOBE PROJECTS
Slide 14
• Projects matured in parallel with negotiations with potential for ~$125 MM of investment over 3-5 years‒ K Field/ H Field redevelopment, and Arta Nukhul horizontal wells/
waterflood targeting ~20.5 MMbbl risked Contingent Resources(4)
‒ Planned investment exceeds initial 5-year commitment by over 2x
• Portfolio of incremental projects already identified for maturation‒ K Field/ H Field enhanced recovery, Nukhul/ Thebes development and
enhanced recovery targeting ~38.6 MMbbl risked Contingent Resources(5)
‒ Arta Red Beds/Hoshia enhanced recovery targeting ~2.1 MMbbl risked Contingent Resources(6)
‒ Potential to increase STOOIP estimate as technical work progresses
• Additional early stage projects being matured for development‒ Hana/ Hana West reservoir modeling underway
Targeting potential 10% incremental oil resources from existing STOOIP
Hana/Hana WFields
K-Field
M-Field
H-Field
38A Field
E. Arta Field
Hoshia
Hana/Hana WFields
K-Field
M-Field
H-Field
38A Field
E. Arta Field
1) Refer to “Advisory Regarding Oil and Gas Information” below for important information regarding these contingent resources2) Not all resources targeted will translate into reserves3) Refer to “Resource Definitions” in Cautionary Statements below for detailed definitions of Contingent Resources
4) Development Pending/ On Hold5) Development Unclarified6) Development Not Viable
TransGlobe Energy | Corporate Presentation | August 2021
EASTERN DESERT: OPERATIONS UPDATE
Slide 15
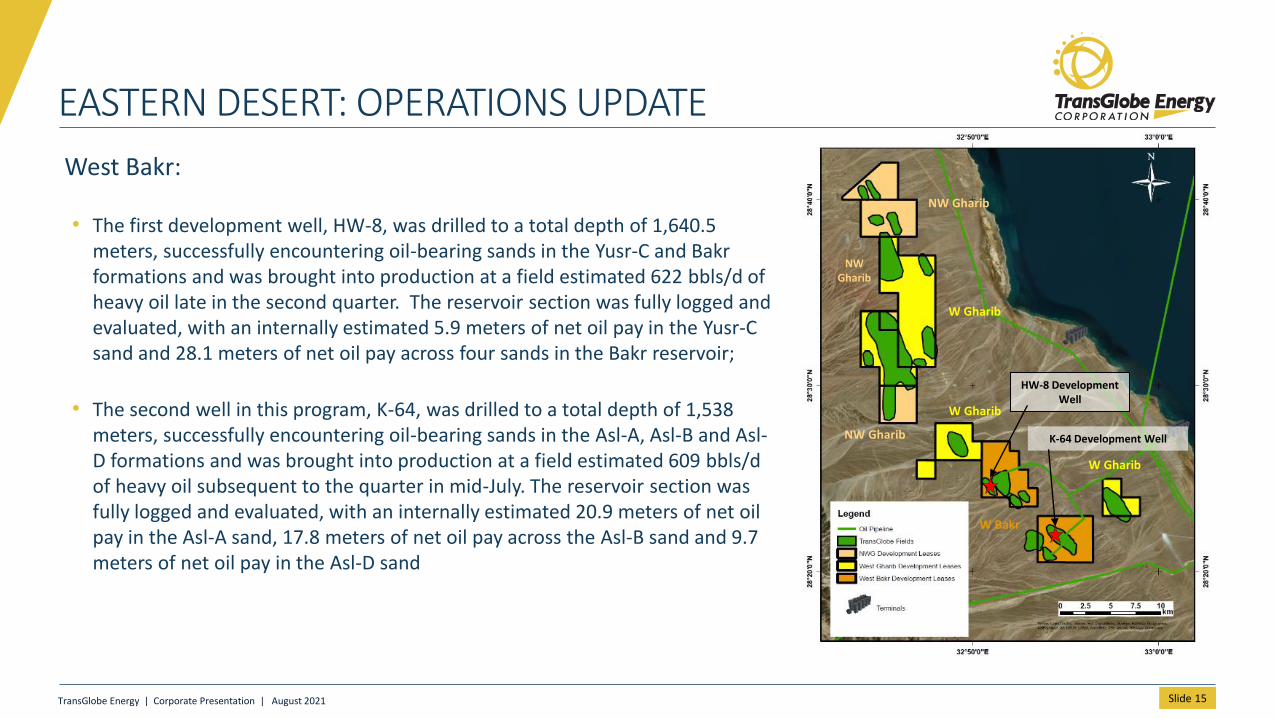
West Bakr:
• The first development well, HW-8, was drilled to a total depth of 1,640.5 meters, successfully encountering oil-bearing sands in the Yusr-C and Bakr formations and was brought into production at a field estimated 622 bbls/d of heavy oil late in the second quarter. The reservoir section was fully logged and evaluated, with an internally estimated 5.9 meters of net oil pay in the Yusr-C sand and 28.1 meters of net oil pay across four sands in the Bakr reservoir;
• The second well in this program, K-64, was drilled to a total depth of 1,538 meters, successfully encountering oil-bearing sands in the Asl-A, Asl-B and Asl-D formations and was brought into production at a field estimated 609 bbls/d of heavy oil subsequent to the quarter in mid-July. The reservoir section was fully logged and evaluated, with an internally estimated 20.9 meters of net oil pay in the Asl-A sand, 17.8 meters of net oil pay across the Asl-B sand and 9.7 meters of net oil pay in the Asl-D sand
TransGlobe Energy | Corporate Presentation | August 2021
NW Gharib
NW Gharib
W Gharib
W Gharib
W Gharib
W Bakr
NWGharib
HW-8 Development Well
K-64 Development Well

WESTERN DESERT: SOUTH GHAZALAT CONCESSION
Slide 16
South Ghazalat:
• SGZ-6X was recompleted in the deeper, more prospective lower Bahariya reservoir‒ Following evaluation of the reservoir pressure and Gas Oil
Ratio (“GOR”) data from the initial production phase of the lower Bahariya reservoir at SGZ 6X, the well has been put on GOR control management to preserve reservoir pressure and maximize recovery. The well is currently producing at a field estimated 680 - 730 bbls/d of light oil with a ~24% watercut. Further reservoir pressure data is being collected to evaluate the impact of aquifer pressure support to the reservoir as that is activated
Future Drilling Plans:
• Development/Exploration:‒ With stronger oil prices and spare capacity available in
the South Ghazalat production facility, the Company is expecting to drill the SGZ 7B prospect to the east of SGZ-6X in Q4-2021
See Cautionary Statements – "Forward-Looking Information and Statements“ and “Oil and Gas Information”Refer to Slide Notes(1) Light/ Medium crude oil
SGZ-6A
SGZ-6X
SGZ-7B
Deferred Activity
Western Desert Concession
South Ghazalat
2021 Q2 Production(1) 810 Bopd
Profit Oil 17%
PSC Expiry2039 + 5 Yr
Ext
Cost Recovery Oil 25%
Excess Cost Oil 5%
TransGlobe Energy | Corporate Presentation | August 2021

CANADIAN ASSET PORTFOLIO

CARDIUM – A CORE PLAY WITHIN THE WCSB
• The Cardium is one of the main oil producing plays within the Western Canadian Sedimentary Basin (WCSB)
• Plenty of potential remains‒ An estimated 12bn bbl OIIP has been targeted with over 19,500 wells
since the mid 1960’s with cumulative production of ~2.1 Billion Bbls and 8.8 Tcf of gas to date
‒ Horizontal drilling unlocked the next phase of recovery in the late 2000’s, with operators shifting focus to ‘halo’ areas around main pools
‒ TransGlobe has continued this philosophy of renewed exploration resulting in our new discovery within South Harmattan
Cardium Trend Historical Production
Slide 18
Source: "BMO A&D Drill Bits: The Cardium – Still Sexy at 70!"
TransGlobe Energy | Corporate Presentation | August 2021
CANADIAN ASSETS – EXTENDING THE CARDIUM
Slide 19
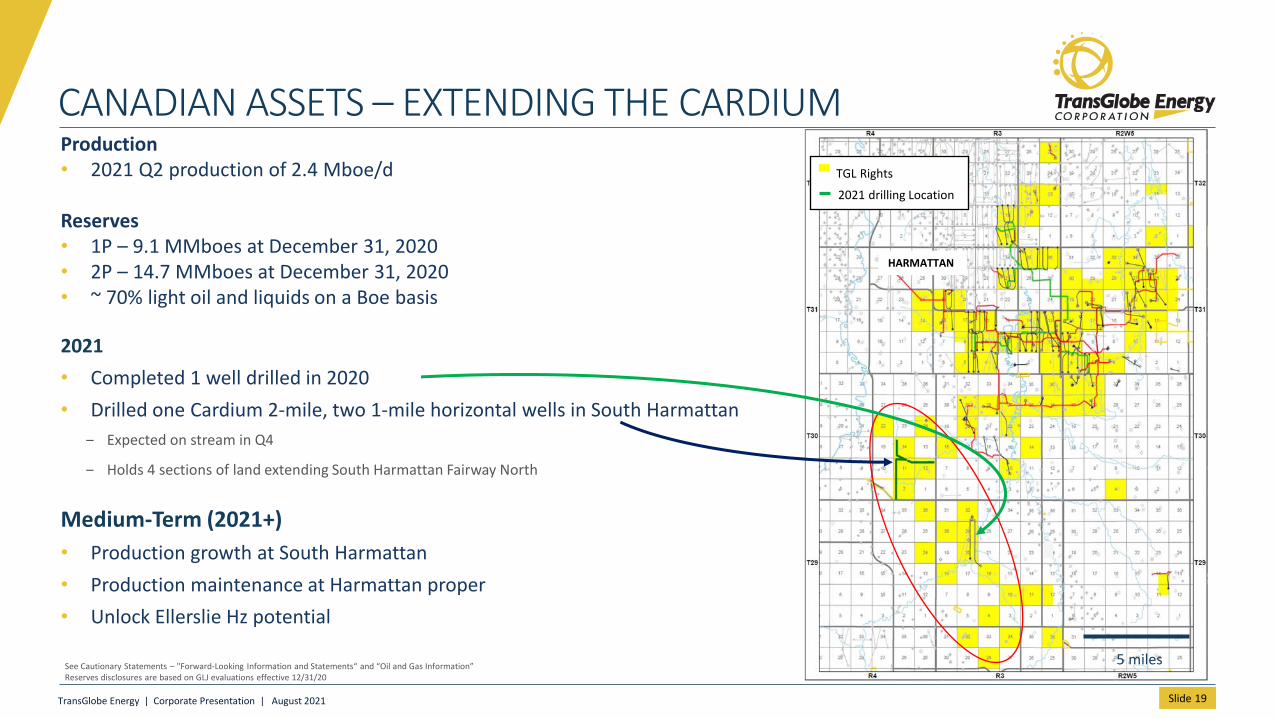
Production• 2021 Q2 production of 2.4 Mboe/d
Reserves• 1P – 9.1 MMboes at December 31, 2020• 2P – 14.7 MMboes at December 31, 2020• ~ 70% light oil and liquids on a Boe basis
2021
• Completed 1 well drilled in 2020
• Drilled one Cardium 2-mile, two 1-mile horizontal wells in South Harmattan
‒ Expected on stream in Q4
‒ Holds 4 sections of land extending South Harmattan Fairway North
Medium-Term (2021+)
• Production growth at South Harmattan
• Production maintenance at Harmattan proper
• Unlock Ellerslie Hz potential
See Cautionary Statements – "Forward-Looking Information and Statements“ and “Oil and Gas Information”Reserves disclosures are based on GLJ evaluations effective 12/31/20
5 miles
TGL Rights
2021 drilling Location
HARMATTAN
TransGlobe Energy | Corporate Presentation | August 2021

SOUTH HARMATTAN RESOURCE FAIRWAY
Slide 20
HARMATTAN
TGL Cardium Rights
• TransGlobe has accumulated 22.5 sections of Cardium mineral rights in South Harmattan fairway
― Each section is equivalent to 1 square mile (640 acres or 256 hectares) and may accommodate up to four 1-mile horizontal wells
• Lands, or mineral rights, are principally leased from the provincial government
― Horizontal drilling royalty incentives reduce royalties to 5% until well costs are recovered
• Company’s 2-20 well targeted a concept developed by TransGlobe’s technical team in area previously considered to be in a hydrocarbon transition zone
― 2-20 well estimated IP30 of 417 Boepd, IP60 of 341 Boepd
― Well de-risks South Harmattan Cardium resource fairway
• Mature area, with access roads, gas pipeline capacity and oil takeaway facilities
• TransGlobe’s 2021 capital program includes the drilling of one 2-mile horizontal well and two 1-mile horizontal wells in South Harmattan
• Up to 86 remaining, 1-mile horizontal locations at South Harmattan that may be optimized with additional 2-mile and 1½-mile horizontals
• A further 30, 1-mile horizontal locations available in the core Harmattan area
HARMATTAN
LOCHEND
LOCHEND
~30 km NW of Calgary
2-20 2-mile horizontal well
The 2019 outpost well de-risked up to 88 additional hz locations
5 miles
SOUTHHARMATTAN
FAIRWAY
TransGlobe Energy | Corporate Presentation | August 2021

SOUTH UPLIFT ON CORE HARMATTAN TYPE WELLS
Slide 21
• Planned material capital redeployment to South Harmattan in 2020 was suspended with oil price volatility
• De-risked South Harmattan resource fairway offers material returns and capital efficiencies
• South Harmattan 2-20 well production and cash flow forecast compares favourably with Company type well estimates for 1-mile and 2-mile horizontals in the core Harmattan acreage
• Scope to materially grow self-funded Canadian free cash flow
TransGlobe Energy | Corporate Presentation | August 2021
WTI $55/bbl $65/bbl $75/bbl
Capital(MMUSD)
F&D($/boe)
Payout(Years)
IRR(%)
NPV10(MMUSD)
Payout(Years)
IRR(%)
NPV10(MMUSD)
Payout(Years)
IRR(%)
NPV10(MMSUD)
1 Mile Core Type Well 2.2 10.79 3.4 25 0.8 2.4 37 1.3 1.8 53 1.9
2 Mile Core Type Well 3.2 9.72 3 28 1.4 2.1 42 2.3 1.6 60 8.9
2 Mile South Type Well 3.2 7.88 1.2 89 3.3 1.0 132 4.6 0.8 183 5.8
Refer to Slide Notes
1
1) Cumulative Free Cash Flows are generated using $65/bbl.

POTENTIAL SOUTH HARMATTAN DEVELOPMENT
LEGENDSurface PadHZ well (● is the toe)Gas PipelineOil PipelineTransGlobe Gas Gathering System (GGS)
Slide 22
LEGENDSurface PadHZ well (● is the toe)Gas PipelineOil PipelineTransGlobe Gas Gathering System (GGS)
• 2021 plan to drill 3 wells in northern area
• Ultimately the Company believes in the potential to drill in excess of 80 wells in the South Harmattan area over 4-6 years
• Potential exists for an owned battery with a connection to TGL gas infrastructure, and a sales oil pipeline to reduce trucking
TransGlobe Energy | Corporate Presentation | August 2021

SOUTH HARMATTAN POTENTIAL
Projections based on:GLJ July 1, 2021 pricing forecast, and TransGlobe internally developed type-well forecasts for South Harmattan
Slide 23TransGlobe Energy | Corporate Presentation | August 2021

Summary

TRANSGLOBE LONG TERM PRIORITIES
Slide 25
Operational Sustainability
Returning Value to
Shareholders
ESGTechnical
Rigour
TransGlobe maintains four key priorities in long-term planning
• Operational Sustainability: Prudently manage reserve and resource base to provide production and cash flow over the long-term
• Returning Value to Shareholders: Contrast internal opportunities for capital deployment with opportunities to return cash to shareholders – focus is creating shareholder value
• Technical Rigour: Application of technology and workforce knowhow for TransGlobe to effectively and efficiently convert resources to reserves and participate in any energy transition
• ESG: Cognizant of the environmental, social, and governance impact in all company activities, with overarching focus on safety of all employees
TransGlobe Energy | Corporate Presentation | August 2021

TRANSGLOBE’S VISION IN THE NEW ENERGY WORLD
Slide 26
• Strong engineering team excels at project delivery and optimization‒ Focus has been principally petroleum, but experienced team
has the ability to be the foremost energy team within Egypt
• TransGlobe will be part of the new energy world‒ Will continue to invest to meet the demand for hydrocarbons,
and explore projects that create value and contribute to TransGlobe’s ESG goals
‒ Intended connection to high-line power grid in Egypt operations will reduce on-site diesel power dependence (dependent on long-term economics)
• Focus on staying nimble in a transitioning industry‒ Will continue prudent capital management practices to
manage changes in oil prices
TransGlobe is a leading independent energy company
Oil Field Renewable Energy Pilot
TransGlobe Energy | Corporate Presentation | August 2021

RETURNING VALUE TO SHAREHOLDERSCASHFLOW PRIORITIES
Slide 27
• Balanced approach
• Weigh capital deployment opportunities against near-term monetization
• Continuously maturing the portfolio to provide attractive investment opportunities
Over the long term TransGlobe is focused on shareholder value creation, while minimizing balance sheet risk
$$
InternalOpportunities Acquisitions
TransGlobe Energy | Corporate Presentation | August 2021

ESG STRATEGY & ACHIEVEMENTS
Slide 28
Governance
• Regular and planned Board turnover / renewal
• Board committees chaired by independent directors
• Staff education, training and monitoring for compliance with Canadian CFPOA legislation, US FCPA laws, and the UK Bribery Act
• Two thirds reduction in Egyptian total recordable injury cases over last 5 years
Social
• Since inception:
–Paid over $2.1 billion in taxes and royalties in Egypt
–Spent ~$1.2 billion in Egypt
•Operations directly support over 1,000 jobs in the Ras Gharib region
• Charitable support and sponsorship of Ras Gharib hospital
Environment
• Investment in pipeline replacements / upgrades to reduce reliance on trucked oil
• Commenced carbon emissions disclosure in 2021
• Potential to access local West Bakr wind farm (250MW) due on-stream 2021 to power various field needs
• Ras Gharib shoreline remediation project
TransGlobe Energy | Corporate Presentation | August 2021

CLOSING
Slide 29
• Company has been transformed through the PetroGlobe Transaction‒ Market still does not recognize the scale of the change to our underlying business
• New Eastern Desert concession will provide a robust asset base to leverage the recovery of oil prices‒ The Company will focus its efforts on generating cash to return to shareholders, while seeking opportunities to acquire
or merge to further gain scale and relevance in our region of focus
• South Harmattan is potentially very significant to the Company‒ Provides ability to shift capital to Canada and create near-term value to shareholders that will help maintain or increase
real returns to our shareholders
• TransGlobe planned capital expenditures of $33.0 million in 2021 exclusive of capitalized G&A
• With a significant portion of investment scheduled in the second half of the year, 2021 average production guidance is set at 12.0 to 13.0 MBoepd with a midpoint of 12.5 MBoepd‒ Egypt 9.7 – 10.5 MBopd;
‒ Canada 2.3 – 2.5 MBoepd;
‒ With the drilling program back-end loaded the Company expects exit production to be in the range of 13.5 to 14.0 MBoepd
See Cautionary Statements – "Forward-Looking Information and Statements“ and “Oil and Gas Information”

CORPORATE INFORMATION
Slide 30
Management
• Randy Neely – Director, and President & CEO
• Geoff Probert – VP and COO
• Edward Ok – VP Finance and CFO
Directors
• David Cook – Chairman
• Ross Clarkson – Director
• Steve Sinclair – Director
• Edward LaFehr – Director
• Tim Marchant – Director
Banks
• Alberta Treasury Branches
• Sumitomo Mitsui Banking Corporation Europe
Prepay Provider and Oil Marketer - Egypt
• Mercuria Energy Trading
Advisory
• GLJ Petroleum Consultants – Independent Reserves Engineers
• BDO Canada LLP – Auditor
• Burnet, Duckworth, & Palmer – Legal Counsel
• Tailwind Associates – Investor Relations Advisor
• Canaccord Genuity – Nominated Advisor & Joint Broker
• Shore Capital – Joint Broker
TransGlobe Energy | Corporate Presentation | August 2021

SLIDE NOTES

SLIDE NOTES
Slide 32
• Slide 5‒ US Energy Information Administration, Egypt Country Analysis, May 2018
‒ British Petroleum Company, BP Statistical Review of World Energy 2020, June 2020, pages 15, 16, 34
‒ CIA World Factbook: Egypt
‒ Apache Corporation, News Release: Fourth-Quarter and Full-Year 2020 Financial and Operational Results, Financial and Operational Results pg 2
‒ British Petroleum Company, Annual Report and Form 20-F 2018, pg 315
‒ Shell Annual Databook published 11 March 2021
‒ Eni: Full Year 2019 and Fourth Quarter Results, Key Operating and Financial Results pg 40
‒ Canadian Association of Petroleum Producers
‒ Canadian Natural Resources, Annual Information Forum 2020, pg 46
‒ Suncor Energy, Annual Report 2020, page 21
‒ Cenovus Energy, Interim Supplemental Information (unaudited) for the period ended December 31, 2020, pg 3
TransGlobe Energy | Corporate Presentation | August 2021

SLIDE NOTES
Slide 33
• Slide 7
Egypt netback assumptions:
- Using anticipated 2021 Egypt production profile- These netbacks are a notional barrel across all of the producing concessions- Ras Gharib price differential estimate of $5.00 per bbl applied to WG/WB/NWG and $2.00 per bbl applied to SGh- Concession differentials of 4%/5%/5% applied to WG/WB/NWG respectively- Opex estimated at ~$13.90/bbl- Maximum cost recovery resulting from accumulated cost pools in WG, NWG, and SGh- (see NR 031220)
Canada netback assumptions:
- A typical Cardium well will produce a combination of light oil, NGLs and natural gas. - TransGlobe’s current production mix in Canada is approximately 30%:35%:35% for light oil, NGLs and Gas- Using anticipated 2021 Canada production profile- Edmonton Light to Harmattan discount = C$2.50/bbl- Opex estimated at ~C$9.50/boe- Aeco gas price C$2.40/mmbtu for $20 WTI and increases C$0.10/mmbtu for every $10/bbl WTI- Edmonton Light = $5.00 off of WTI- NGL mixture price = 45% of Edmonton Light- Takes into consideration Canadian tax pools
TransGlobe Energy | Corporate Presentation | August 2021

SLIDE NOTES
Slide 34
• Slide 22
Type curves. TransGlobe has presented certain type curves and well economics for the Harmattan area type wells and the Company's South Harmattan 2-20 well. The typecurves are TransGlobe's internally prepared estimates of the production decline and ultimate volumes expected to be recovered from wells over the life of the well. The typecurves presented are based on production history from analogous Cardium developments located in close proximity to the Harmattan area and the Company's South Harmattan2-20 well. Individual wells may be higher or lower but over a larger number of wells, TransGlobe expects the average to come out to the type curve. Over time type curves canand will change based on achieving more production history on older wells or more recent completion information on newer wells. The type curve disclosure contained in thispresentation was prepared in accordance with COGEH by a non-independent qualified reserves evaluator as defined in NI 51-101. The following sets out the key inputsunderlying the type curves and well economics on slide 21:
Type Curve Inputs1-Mile Core Type Well 2-Mile Core Type Well 2-Mile South Type Well
Drill, complete, equip, and tie-in capital (US$MM) 2.2 3.2 3.2EUR (Raw gas) (Bcf) 0.4 0.7 1.0EUR (MMBoe) 0.2 0.3 0.4Opex ($/boe) 6.75 6.09 5.41Hz length (m) 1,500 3,100 3,100Frac intensity (T/m) 0.4 0.4 0.4
Economic assumptions. The following sets out the key assumptions underlying the calculation of certain financial outlook and oil and gas metrics disclosed in this presentation:
‒ Oil Price - $65 USD/bbl WTI with a $5 USD/bbl differential to Edmonton Light,
‒ $55 and $ 75 USD/bbl WTI ran as a sensitivity with $5 USD/bbl differential to Edmonton Light
‒ Gas Price - $2.35 USD/MMbtu
‒ Royalties as per the Alberta Modernized Royalty Framework (5% until revenue reaches C*)
‒ Operating costs of $968 USD/well/month, $5.58 USD/bbl oil, $0.76 USD/Mcf gas
TransGlobe Energy | Corporate Presentation | August 2021

APPENDIX

2020 YEAR-END RESERVES SUMMARY
Total proved plus probable (“2P”) gross reserves of 38.9 MMboe at year-end 2020:
• 2020 production of 4.9 MMboe (4.1 MMbbls Egypt and 0.8 MMboe Canada)
• 2P Reserves are 14% lower YOY due to lower commodity pricing negatively affecting undeveloped reserves
• PDP Reserves are 18% lower YOY
• Replaced 35%, 62% and 84% of 2020 production on a PDP, 1P and 2P gross reserves basis, respectively with minimal capital spending
2020 Reserves Summary PDP 1P 2P 3P
2019 Year End Reserves (MMboe) 18.5 25.4 45.3 63.3
2020 Adds/Revisions (MMboe) 1.7 2.3 -1.5 -2.5
2020 Production (MMboe) -4.9
2020 Year End Reserves (MMboe) 15.3 22.8 38.9 55.9
Change vs Year End 2018 (%) -18 -10 -14 -12
Production Replacement Ratio (%) – (ex A&D, economic factors)
35 62 84 6
NPV 10% Before tax $MM Dec 31/20 100 134 205 265
NPV 10% After tax $MM Dec 31/20 100 134 198 254
Slide 36
Based on GLJ evaluations effective 12/31/19 and 12/31/20. See Cautionary Statements – "Oil and Gas Information“NPV’s GLJ evaluation effective 12/31/2020 forecast pricingReserves are Gross working interest reserves before royalties
TransGlobe Energy | Corporate Presentation | August 2021

RECONCILIATION OF CHANGES IN RESERVES
Slide 37
The following tables detail reconciliation of the changes in TransGlobe’s gross light and medium crude oil, heavy oil, associated and non-associated (combined) conventional natural gas and NGL reserves as at December 31, 2020 compared to such reserves as at December 31, 2019.
Total Light and Medium Crude Total Heavy Crude Total Natural Gas Total Natural Gas Liquids BOE
Proved Proved Proved Proved Proved
Proved + Probable Proved + Probable Proved + Probable Proved + Probable Proved + Probable
FACTORS (Mbbl) (Mbbl) (Mbbl) (Mbbl) (MMcf) (MMcf) (Mbbl) (Mbbl) (Mboe) (Mboe)December 31, 2019 4,881 9,264 14,222 23,602 19,180 38,084 3,127 6,092 25,427 45,306Discoveries 0 0 0 0 0 0 0 0 0 0
Extensions and Improved Recovery 0 0 1,176 1,883 0 0 0 0 1,176 1,883Technical Revisions 554 881 946 640 236 942 349 587 1,888 2,265
Acquisitions 0 0 0 0 0 0 0 0 0 0Dispositions 0 0 0 0 0 0 0 0 0 0Economic Factors -89 -925 -300 -1,018 -1,229 -11,835 -194 -1,759 -788 -5,674
Production -580 -580 -3,761 -3,761 -1,715 -1,715 -287 -287 -4,913 -4,913December 31, 2020 4,766 8,641 12,284 21,347 16,471 25,476 2,995 4,632 22,790 38,866
TransGlobe Energy | Corporate Presentation | August 2021

PRODUCTION DISCLOSURE
Slide 38TransGlobe Energy | Corporate Presentation | August 2021
Light and Medium Crude Heavy Crude Natural Gas Natural Gas Liquids Total bbl/d bbl/d Mcf/d bbl/d boe/d Q2 2021 Production
Corporate 1,678 9,736 4,834 857 13,077 Q1 2021 Production
Corporate 1,383 9,419 4,259 710 12,222 2020 Average
Egypt 875 10,303 11,178 Canada 711 4,722 785 2,283 Total 1,586 10,303 4,722 785 13,461
2021 Guidance Corporate High 1,656 9,678 5,000 833 13,000 Mid Point 1,591 9,309 4,800 800 12,500 Low 1,526 8,940 4,600 767 12,000
2021 Guidance Egypt High 822 9,678 10,500 Mid Point 791 9,309 10,100 Low 760 8,940 9,700
2021 Guidance Canada High 833 5,000 833 2,500 Mid Point 800 4,800 800 2,400 Low 767 4,600 767 2,300
2021 Exit Rate Corporate High 1,927 9,900 6,517 1,086 14,000 Low 1,859 9.547 6,284 1,047 13,500
2021 Exit Rate Egypt High 841 9,900 10,742 Low 811 9,547 10,358
2021 Exit Rate Canada High 1,086 6,517 1,086 3,258 Low 1,047 6,284 1,047 3,142
South Harmattan Well IP 30 379 197 6 417 IP 60 302 196 6 341

CAUTIONARY STATEMENTS

CAUTIONARY STATEMENTS
Slide 40
Forward-Looking Information and Statements
• Certain statements included in this presentation constitute forward-looking statements or forward-looking information under applicable securities legislation. Such forward-looking statements or information are provided for the purpose of providing information about management's current expectations and plans relating to the future. Readers are cautioned that reliance on such information may not be appropriate for other purposes. Forward-looking statements or information typically contain statements with words such as "anticipate", "believe", "expect", "plan", "intend", "estimate", "may", "will", "would" or similar words suggesting future outcomes or statements regarding an outlook. In particular, forward-looking information and statements contained in presentation include, but are not limited to, statements relating to "reserves" which are, by their nature, forward-looking statements, as they involve the implied assessment, based on certain estimates and assumptions that the reserves or resources, as applicable, described exist in the quantities predicted or estimated and that the reserves can be profitably produced in the future; expected production amounts and decline rates in the future; the expected product types and quantities of such product types; the plans for the Company's 2021 Canadian drilling program and the details thereof; the Company's expectation relating to the performance of the South Harmattan Cardium prospect; the expected benefits to the Company of consolidating, amending and extending the Company's Eastern Desert PSCs and the ratification of the consolidation of the Company’s Eastern Desert production sharing contracts and the expected timing thereof and the ability of the consolidated Eastern Desert production sharing contract to transform the economic potential of certain assets for the Company and Egypt; and other matters. The recovery and reserves estimates of TransGlobe's reserves provided in this presentation are estimates only and there is no guarantee that the estimated reserves will be recovered.
• Forward-looking statements or information are based on a number of factors and assumptions which have been used to develop such statements and information but which may prove to be incorrect. Although the Company believes that the expectations reflected in such forward-looking statements or information are reasonable, undue reliance should not be placed on forward-looking statements because the Company can give no assurance that such expectations will prove to be correct. Many factors could cause TransGlobe's actual results to differ materially from those expressed or implied in any forward-looking statements made by, or on behalf of, TransGlobe.
• In addition to other factors and assumptions which may be identified in this presentation, assumptions have been made regarding, among other things, anticipated production results, volumes and decline rates; the timing of drilling wells and mobilizing drilling rigs; the number of wells to be drilled; the Company's ability to obtain qualified staff and equipment in a timely and cost-efficient manner; the regulatory framework governing royalties, taxes and environmental matters in the jurisdictions in which the Company conducts and will conduct its business; future capital expenditures to be made by the Company; future sources of funding for the Company's capital programs; geological and engineering estimates in respect of the Company's reserves and resources; the geography of the areas in which the Company is conducting exploration and development activities; current commodity prices and royalty regimes; availability of skilled labour; future exchange rates; the price of oil; the impact of increasing competition; conditions in general economic and financial markets, including as a result of demand and supply effects resulting from the COVID-19 pandemic; availability of drilling and related equipment; effects of regulation by governmental agencies; future operating costs; uninterrupted access to areas of TransGlobe's operations and infrastructure; recoverability of reserves and future production rates; that TransGlobe will have sufficient cash flow, debt or equity sources or other financial resources required to fund its capital and operating expenditures and requirements as needed; that TransGlobe's conduct and results of operations will be consistent with its expectations; that TransGlobe will have the ability to develop its properties in the manner currently contemplated; current or, where applicable, proposed industry conditions, laws and regulations will continue in effect or as anticipated as described in this presentation; that the estimates of TransGlobe's reserves and resource volumes and the assumptions related thereto (including commodity prices and development costs) are accurate in all material respects; and other matters.
TransGlobe Energy | Corporate Presentation | August 2021

CAUTIONARY STATEMENTS
Slide 41
Forward-Looking Information and Statements
• Forward-looking statements or information are based on current expectations, estimates and projections that involve a number of risks and uncertainties which could cause actual results to differ materially from those anticipated by the Company and described in the forward-looking statements or information. These risks and uncertainties which may cause actual results to differ materially from the forward-looking statements or information include, among other things, operating and/or drilling costs are higher than anticipated; unforeseen changes in the rate of production from TransGlobe's oil and gas properties; changes in price of crude oil and natural gas; adverse technical factors associated with exploration, development, production or transportation of TransGlobe's crude oil reserves; changes or disruptions in the political or fiscal regimes in TransGlobe's areas of activity; changes in tax, energy or other laws or regulations; changes in significant capital expenditures; delays or disruptions in production due to shortages of skilled manpower, equipment or materials; economic fluctuations; competition; lack of availability of qualified personnel; the results of exploration and development drilling and related activities; obtaining required approvals of regulatory authorities; fluctuations in foreign exchange or interest rates; environmental risks; ability to access sufficient capital from internal and external sources; potential disruption of the Company’s operations as a result of the COVID-19 pandemic through potential loss of manpower and labour pools resulting from quarantines in the Company’s operating areas, risk of financial capacity of the Company’s contract counterparties and potentially their ability to perform contractual obligations failure to negotiate the terms of contracts with counterparties; failure of counterparties to perform under the terms of their contracts; and other factors beyond the Company's control. Readers are cautioned that the foregoing list of factors is not exhaustive. Please consult TransGlobe's public filings at www.sedar.com and www.sec.gov/edgar.shtml for further, more detailed information concerning these matters, including additional risks related to TransGlobe's business.
• The forward-looking statements or information contained in this presentation are made as of the date hereof and the Company undertakes no obligation to update publicly or revise any forward-looking statements or information, whether as a result of new information, future events or otherwise unless required by applicable securities laws. The forward-looking statements or information contained in this presentation are expressly qualified by this cautionary statement.
TransGlobe Energy | Corporate Presentation | August 2021

CAUTIONARY STATEMENTS
Slide 42
Financial Outlook
• This document also contains financial outlook within the meaning of applicable securities laws, including but not limited to the information regarding future capital expenditures, estimated finding and development costs, netbacks, recycle ratio, payout, internal rates of return, and net present value. The financial outlook has been prepared by TransGlobe's management to provide an outlook of the Company's activities and results. The financial outlook has been prepared based on a number of assumptions including those set forth below in this presentation, the assumptions discussed above and assumptions with respect to the costs and expenditures to be incurred by the Company, capital equipment and operating costs, foreign exchange rates, taxation rates for the Company, general and administrative expenses and the prices to be paid for the Company's production. Management does not have firm commitments for all of the costs, expenditures, prices or other financial assumptions used to prepare the financial outlook or assurance that such operating results will be achieved and, accordingly, the complete financial effects of all of those costs, expenditures, prices and operating results are not objectively determinable. The actual results of operations of the Company and the resulting financial results will likely vary from the amounts set forth in the analysis presented in this presentation, and such variation may be material. The Company and its management believe that the financial outlook has been prepared on a reasonable basis, reflecting the best estimates and judgments, and represent, to the best of management's knowledge and opinion, TransGlobe's expected expenditures and results of operations. However, because this information is highly subjective and subject to numerous risks including the risks discussed above, it should not be relied on as necessarily indicative of future results. Except as required by applicable securities laws, TransGlobe undertakes no obligation to update such financial outlook and forward-looking statements and information. See "Economic Assumptions" below for a description of the key assumptions underlying the calculation of certain financial outlook disclosed in this presentation.
TransGlobe Energy | Corporate Presentation | August 2021

CAUTIONARY STATEMENTS
Slide 43
Oil and Gas Information
• Mr. Ron Hornseth, B.Sc., General Manager – Canada for TransGlobe Energy Corporation, and a qualified person as defined in the Guidance Note for Mining, Oil and Gas Companies, June 2009, of the London Stock Exchange, has reviewed the technical information contained in this report. Mr. Hornseth is a professional engineer who obtained a Bachelor of Science in Mechanical Engineering from the University of Alberta. He is a member of the Association of Professional Engineers and Geoscientists of Alberta (“APEGA”) and the Society of Petroleum Engineers (“SPE”) and has over 20 years’ experience in oil and gas.
• Reserves. The estimates of TransGlobe's December 31, 2020 reserves set forth in this presentation have been prepared by GLJ Ltd. ("GLJ"), an independent qualified reserves evaluator, as of December 31, 2020 in accordance with National Instrument 51-101 – Standards of Disclosure for Oil and Gas Activities ("NI 51-101") and the Canadian Oil and Gas Evaluations Handbook (the "COGE Handbook" or "COGEH") and using GLJ's forecast prices and costs as at December 31, 2020. See TransGlobe's news release dated January 28, 2021 entitled "TransGlobe Energy Corporation Announces its 2021 Capital Budget" available at www.trans-globe.com/news for more details concerning the reserves set forth in this presentation.
• Estimates of the net present value of the future net revenue from TransGlobe's reserves do not represent the fair market value of such reserves. The estimates of reserves and future net revenue from individual properties or wells may not reflect the same confidence level as estimates of reserves and future net revenue for all properties and wells, due to the effects of aggregation. In this presentation, NPV10 represents the net present value of net income discounted at 10%. The NPV estimates are net estimates and are prepared prior to any provision for interest costs or general and administrative costs and after the deduction of royalties, development costs, production costs, well abandonment costs and estimated future capital expenditures for wells to which reserves have been assigned.
• The recovery and reserve estimates of reserves provided in presentation are estimates only, and there is no guarantee that the estimated reserves will be recovered. Actual reserves may eventually prove to be greater than, or less than, the estimates provided in this presentation.
• The Reserves analysis as reported in this presentation was conducted within the context of an evaluation of a distinct group of properties in aggregate. Extraction and use of this analysis outside this context may not be appropriate without supplementary due diligence.
• Oil and gas metrics. This presentation contains certain oil and gas metrics, including F&D, netback, recycle ratio, payout, and internal rates of return ("IRR"), which do not have standardized meanings or standard methods of calculation. Therefore such measures may not be comparable to similar measures used by other companies and should not be used to make comparisons. Such metrics have been calculated by the Company and included in this presentation to provide readers with additional measures to evaluate the Company's performance; however, such measures are not reliable indicators of the future performance and future performance may not compare to the performance in previous periods and therefore such metrics should not be unduly relied upon. The following describes the method used to determine the metric and explains the meaning of the metric:
• "Finding and development costs" or "F&D costs" are calculated by dividing the sum of the capital expenditures for the year (in dollars) by the additions to reserves within the applicable reserves category.
• Netback is a measure of operating results and is calculated as sales net of royalties, operating expenses, current taxes and selling costs. Management believes that netback is a useful supplemental measure to analyze operating performance and provide an indication of the results generated by the Company’s principal business activities prior to the consideration of other income and expenses.
• Recycle ratio is calculated by dividing the netback by the proved and proved plus probable finding and development costs on a per bbl basis.
• Payout is calculated as the period of time by which all costs of drilling, completions, and tie-in for a well or wells have been recovered from the sale of production (net of operating costs and royalties) from a well or wells.
TransGlobe Energy | Corporate Presentation | August 2021

CAUTIONARY STATEMENTS
Slide 44
• IRR is calculated as the discount factor applied to future cash flows at which the NPV is calculated to be zero.
• See "Economic Assumptions" below for a description of the key assumptions underlying the calculation of certain oil and gas metrics disclosed in this presentation.
• Analogous information. Certain information in presentation may constitute "analogous information" as defined in NI 51-101. Such information includes production estimates, drilling results, test rates, reserves estimates and other information retrieved from publically available information relating to certain industry participants, including AccuMap and other publically available sources. Management of TransGlobe believes the information is relevant as it may help to define the reservoir characteristics and production profile of lands in which TransGlobe may hold an interest. TransGlobe is unable to confirm that the analogous information was prepared by a qualified reserves evaluator or auditor and is unable to confirm that the analogous information was prepared in accordance with NI 51-101. Such information is not an estimate of the production, reserves or resources attributable to lands held or to be held by TransGlobe and there is no certainty that the production, reserves or resources data and economic information for the lands held or to be held by TransGlobe will be similar to the information presented in this presentation. The reader is cautioned that the data relied upon by TransGlobe may be in error and/or may not be analogous to such lands held or to be held by TransGlobe.
• Production results. References in this presentation to production results over a 30 and 60 day period are useful in confirming the presence of hydrocarbons, however such rates are not determinative of the rates at which such wells will commence production and decline thereafter and are not indicative of long term performance or of ultimate recovery. Readers are cautioned not to place reliance on such rates in calculating the aggregate production for TransGlobe or any of its wells. A pressure transient analysis or well-test interpretation has not been carried out in respect of the highlighted well. Accordingly, TransGlobe cautions that the production results for the highlighted well should be considered to be preliminary.
• Third party sources. Certain other information contained in this presentation has been prepared by third-party sources. Such information has not been independently audited or verified by TransGlobe. No representation or warranty, express or implied, is made by TransGlobe as to the accuracy or completeness of the information contained in that publication, and nothing contained in this presentation is, or shall be relied upon as, a promise or representation by TransGlobe as to the accuracy or completeness of that information.
• Drilling locations at South Harmattan. This presentation discloses drilling locations that have associated proved and/or probable reserves based on GLJ's 12/31/2020 evaluation prepared in accordance with NI 51-101 and the COGE Handbook and using GLJ pricing forecasts as at 12/31/2020. Two two-mile (four one-mile equivalents) of the drilling locations have been assigned proved reserves and 4 ( five one-mile equivalents) of the drilling locations have been assigned probable reserves by GLJ in the evaluation. The remainder of the drilling locations disclosed in this presentation are unbooked locations located on the Company's leases which are internal estimates based on an assumption as to the number of wells that potentially could be drilled per section based on industry practice and internal review. Unbooked locations do not have attributed reserves or resources. Unbooked locations have been identified by management as an estimation of the Company's potential future drilling activities based on an evaluation of applicable geologic, seismic, engineering, production and reserves information. There is no certainty that the Company will drill all unbooked drilling locations and if drilled there is no certainty that such locations will result in additional oil and gas reserves, resources or production. The drilling locations on which the Company will actually drill wells is ultimately dependent upon the availability of capital, regulatory approvals, seasonal restrictions, oil and natural gas prices, costs, actual drilling results, additional reservoir information that is obtained and other factors. While certain of the unbooked drilling locations have been derisked by drilling existing wells in relative close proximity to such unbooked drilling locations, the majority of other unbooked drilling locations are farther away from existing wells where management has less information about the characteristics of the reservoir and therefore there is more uncertainty whether wells will be drilled in such locations and if drilled there is more uncertainty that such wells will result in additional oil and gas reserves, resources or production. The unbooked drilling location disclosure contained in this presentation was prepared in accordance with COGEH by a non-independent qualified reserves evaluator as defined in NI 51-101.
TransGlobe Energy | Corporate Presentation | August 2021

CAUTIONARY STATEMENTS
Slide 45
Advisory Regarding Oil and Gas Information
TransGlobe completed an internal evaluation of the Contingent Resources (the "Contingent Resource Evaluation") attributed to the pools included in the Company's existing 10 development leases based on the new terms and conditions of the Merged Concession (the "Evaluated Areas") which remains subject to ratification and satisfaction of certain other closing conditions. TransGlobe's wholly-owned subsidiaries have a 100% working interest in the existing development leases and related concession agreements covering the Evaluated Areas and would maintain that level interest upon ratification of the Merged Concession. The Evaluated Areas are located onshore in Egypt's Eastern Desert. The Contingent Resources Evaluation is effective September 30, 2020 and has been prepared by a member of TransGlobe's management who is a qualified reserves evaluator in accordance with procedures and standards contained in the Canadian Oil and Gas Evaluation ("COGE") Handbook. This internal evaluation is expected to be updated in the third quarter of 2021.
Contingent Resources should not be confused with reserves. Readers should review the definitions and notes set forth below. Actual resources may be greater than or less than the estimates provided herein. There is uncertainty that it will be commercially viable to produce any portion of the resources.
Gross Contingent Resources are the Company’s working interest share before the deduction of royalties. Net Contingent Resources are the Company’s working interest share after the deduction of royalties. Net Contingent Resources in Egypt include the Company’s share of future cost recovery and production sharing oil, and Contingent Resources relating to income taxes payable to EGOC on the Company’s behalf. Under this method, a portion of the reported Contingent Resources will increase as oil prices decrease and vice versa as the barrels necessary to achieve cost recovery change with prevailing oil prices.
The estimated cost to bring on commercial production from the Development Pending/ On Hold Contingent Resources is approximately $125 million (discounted at 10 percent is approximately $81.2 million), and the expected timeline to bring these resources onto production ranges from 1 to 3 years depending on the Evaluated Area. TransGlobe's Development Pending/ On Hold Contingent Resources represent development projects within the Evaluated Areas for which specific development plans have been made. These resources are expected to be recovered using the same conventional development technology that TransGlobe has already proven to be effective in the Evaluated Areas, supplemented by some horizontal well drilling and multi-stage stimulation that the Company has successfully deployed in Canada
Contingent Resources Chance of Commerciality
The Evaluated Areas with Contingent Resources were risked for the chance of commerciality (“CoC”), which is defined as follows:
CoC = chance of development (“CoDev”) × chance of discovery (“CoD”)wherein CoD for Contingent Resources is equal to one for all Contingent Resources.
The chance of development is the estimated probability that, once discovered, a known accumulation will be commercially developed. Five factors have been considered in determining the CoDev as follows:
CoDev = Ps (Economic Factor) × Ps (Technology Factor) × Ps (Development Plan Factor) × Ps (Development Timeframe Factor) × Ps (Other Contingency Factor)wherein Ps is the probability of success
TransGlobe Energy | Corporate Presentation | August 2021

CAUTIONARY STATEMENTS
Slide 46
The five factors were assessed for each of the Evaluated Areas. The following factors were assessed for TransGlobe's Contingent Resources to be sub-classified and considered as Development Pending/ On Hold Contingent Resources, Development Unclarified Contingent Resources or Development Not Viable Contingent Resources:
• Economic Factor: For Development Pending/ On Hold the associated development projects had robust economics (i.e., strong rate of returns), and as such were assigned a factor of 0.9 to 1.0. The remaining Contingent Resources sub-classes have factors ranging from 0.6 to 1.00. The Contingent Resource Evaluation is based on the October 1, 2020 forecast pricing and inflation published by GLJ Petroleum Consultants Ltd., independent petroleum consultants, shown below:
• Technology Factor: Much of TransGlobe’s Contingent Resources will be developed utilizing established technology, therefore, a technology factor of 0.8 to 1.0 is utilized for all resource Contingent Resources sub-classes. A lower factor here took into account potential operational risks associated with horizontal, multi-stage stimulated wells.
• Development Plan Factor: Development plans and costs were prepared and are in place. This factor ranges from 0.85 to 0.9 for Development Pending/ On Hold Contingent Resources. For the remaining Contingent Resources sub-classes, the Development Plan Factors range from 0.70 to 0.75 based on the level of detail.
• Development Timeframe Factor: Several core areas within the Evaluated Areas have portions of the Petroleum Initially-in-Place (“PIIP”) volume developed and producing, with proved and probable reserves assigned. Timing for the Contingent Resources portions of these projects will depend on the pace of continued development (including allocation of funds), available throughput capacity in existing facilities, or construction of additional facilities. Development Pending/ On Hold projects have been assigned Development Timeframe Factors of 1.0 reflecting a high level of certainty in timing estimates and intent by TransGlobe to invest in these projects in the near term. For the remaining Contingent Resources sub-classes, the Timeframe Factors assigned range from 0.70 to 0.90.
• Other Contingency Factor: For reserves to be assessed, all contingencies must be eliminated. With respect to Contingent Resources, this factor captures major contingencies, usually beyond the control of TransGlobe, other than those captured by economic status, technology status, project evaluation scenario status and the development timeframe. The Other Contingency Factor has been assessed as 1.0 for all Contingent Resources sub-classes.
These factors may be inter-related, and care has been taken to ensure that risks are appropriately accounted for. The following table summarizes the Chance of Commerciality applied to Contingent Resources based on the factors assessed.
YearBrent Reference Price
($US/bbl) (1)
Inflation Rate(%/yr) (2)
2020 Q4 44.00 0.002021 46.75 1.002022 51.00 2.002023 56.50 2.002024 60.00 2.002025 62.95 2.002026 64.13 2.002027 65.33 2.002028 66.56 2.002029 67.81 2.002030+ +2.0%/yr thereafter 2.00%/yr thereafter
(1) Price forecast is GLJ forecast from October 1, 2020
(2) Inflation rates for forecasting expenditure prices and costs
TransGlobe Energy | Corporate Presentation | August 2021

CAUTIONARY STATEMENTS
Slide 47
Summary of Chance of Commerciality of Best Estimate Contingent Resources for the Evaluated Areas as of September 30, 2020
1) All volumes listed in the table are Company Gross.2) Refer to “Resource Definitions” below for detailed definitions of Contingent Resources
Risks and Significant Positive and Negative Factors
Continuous development through multi-year development programs and significant levels of future capital expenditures are required in order for Contingent Resources to be recovered in the future. The principal risks that would inhibit the recovery of additional resources relate to the potential for variations in the quality of the Evaluated Areas formation where minimal well data currently exists, access to the capital which would be required to develop the resources, low crude oil prices that would curtail the economics of development, the future performance of wells, regulatory approvals, access to the required services at the appropriate cost, access to market and the effectiveness of stimulation technology and applications.
The Contingent Resources estimates reflect data as of the date of the Contingent Resources Evaluation. Although only best estimates are reported, it should be understood that there is a significant degree of uncertainty in these estimates. Additional data may justify upward or downward revisions to the estimates, which in turn would impact the Contingent Resources estimates.
Contingencies
In the Evaluated Areas, the primary contingencies that prevent the Contingent Resources from being classified as reserves are the development of firm plans, including timing, infrastructure, and the commitment of capital, and, in some cases, the verification of commercial production rates. As continued delineation occurs, and plans are firmed up, some Contingent Resources are expected to be re-classified to reserves.
Projects have been defined to develop the resources in the Evaluated Areas for the Development Pending/ On Hold Contingent Resources at the evaluation date. Such projects, in the case of the Evaluated Areas, have historically been developed sequentially over a number of drilling seasons and are subject to annual budget constraints, TransGlobe's policy of orderly development on a staged basis, TransGlobe's short-term and long-term view of crude oil prices, and the results of development activities in the area.
Chance of Commerciality and Best Estimate Contingent Resources [(1)(2)]
Chance of Commerciality
Best estimate unrisked
Best estimate risked
Heavy Crude Oil (million bbl)Development Pending/ On Hold Contingent Resources 85% 24.0 20.5Development Unclarified Contingent Resources 60% 65.1 38.6
Total Economic Contingent Resources - 89.1 59.1Development Not Viable Contingent Resources 26% 8.0 2.1
TransGlobe Energy | Corporate Presentation | August 2021

CAUTIONARY STATEMENTS
Slide 48
Resource Definitions
The following are excerpts from the definitions of resources and reserves, contained in Section 5 of the COGE Handbook, which is referenced by the Canadian Securities Administrators in “National Instrument 51-101 Standards of Disclosure for Oil and Gas Activities”.
a) Fundamental Resource Definitions
Contingent Resources are those quantities of petroleum estimated, as of a given date, to be potentially recoverable from known accumulations using established technology or technology under development, but which are not currently considered to be commercially recoverable due to one or more contingencies. Contingencies may include factors such as economic, legal, environmental, political, and regulatory matters, or a lack of markets. It is also appropriate to classify as Contingent Resources the estimated discovered recoverable quantities associated with a project in the early evaluation stage. Contingent Resources are further classified in accordance with the level of certainty associated with the estimates and may be subclassified based on project maturity and/or characterized by their economic status.
b) Uncertainty Categories for Resource Estimates
The range of uncertainty of estimated recoverable volumes may be represented by either deterministic scenarios or by a probability distribution. Resources should be provided as low, best, and high estimates as follows:
Low Estimate: This is considered to be a conservative estimate of the quantity that will actually be recovered. It is likely that the actual remaining quantities recovered will exceed the low estimate. If probabilistic methods are used, there should be at least a 90 per cent probability (P90) that the quantities actually recovered will equal or exceed the low estimate.Best Estimate: This is considered to be the best estimate of the quantity that will actually be recovered. It is equally likely that the actual remaining quantities recovered will be greater or less than the best estimate. If probabilistic methods are used, there should be at least a 50 per cent probability (P50) that the quantities actually recovered will equal or exceed the best estimate.High Estimate: This is considered to be an optimistic estimate of the quantity that will actually be recovered. It is unlikely that the actual remaining quantities recovered will exceed the high estimate. If probabilistic methods are used, there should be at least a 10 per cent probability (P10) that the quantities actually recovered will equal or exceed the high estimate.
This approach to describing uncertainty may be applied to reserves, Contingent Resources and prospective resources. There may be significant risk that sub-commercial and undiscovered accumulations will not achieve commercial production. However, it is useful to consider and identify the range of potentially recoverable quantities independently of such risk.
c) Discovered and Commercial Status and Risks Associated with Resource Estimates Discovery Status
Total petroleum initially-in-place is first subdivided based on the discovery status of a petroleum accumulation. Discovered PIIP, production, reserves, and Contingent Resources are associated with known accumulations. Recognition as a known accumulation requires that the accumulation be penetrated by a well and have evidence of the existence of petroleum. The COGE Handbook Consolidated 3rd Edition, Section 1.4.7.2.1.2, provides additional clarification regarding drilling and testing requirements relating to recognition of known accumulations. On the other hand, Prospective resources is undiscovered PIIP which is associated with accumulations yet to be discovered.
TransGlobe Energy | Corporate Presentation | August 2021

CAUTIONARY STATEMENTS
Slide 49
Commercial Status
Commercial status differentiates reserves from Contingent Resources. The following outlines the criteria that should be considered in determining commerciality:
• economic viability of the related development project;• a reasonable expectation that there will be a market for the expected sales quantities of production required to justify development;• evidence that the necessary production and transportation facilities are available or can be made available;• evidence that legal, contractual, environmental, governmental, and other social and economic concerns will allow for the actual implementation of the recovery
project being evaluated;• a reasonable expectation that all required internal and external approvals will be forthcoming. Evidence of this may include items such as signed contracts, budget
approvals, and approvals for expenditures, etc.;• evidence to support a reasonable timetable for development. A reasonable time frame for the initiation of development depends on the specific circumstances and
varies according to the scope of the project. While five years is recommended as a maximum time frame for classification of a project as commercial, a longer time frame could be applied where, for example, development of economic projects are deferred at the option of the producer for, among other things, market-related reasons or to meet contractual or strategic objectives.
Commercial Risk Applicable to Resource Estimates
Estimates of recoverable quantities are stated in terms of the sales products derived from a development program, assuming commercial development. It must be recognized that reserves and Contingent Resources involve different risks associated with achieving commerciality. The likelihood that a project will achieve commerciality is referred to as the “chance of commerciality.” The chance of commerciality varies in different categories of recoverable resources as follows:
Reserves: To be classified as reserves, estimated recoverable quantities must be associated with a project(s) that has demonstrated commercial viability. Under the fiscal conditions applied in the estimation of reserves, the chance of commerciality is effectively 100 percent.
Contingent Resources: Not all technically feasible development plans will be commercial. The commercial viability of a development project is dependent on the forecast of fiscal conditions over the life of the project. For Contingent Resources the risk component relating to the likelihood that an accumulation will be commercially developed is referred to as the “chance of development.” For Contingent Resources the chance of commerciality is equal to the chance of development.
TransGlobe Energy | Corporate Presentation | August 2021

CAUTIONARY STATEMENTS
Slide 50
d) Recovery Technology Status
Established Technology: A recovery method that has been proven to be successful in commercial applications in the subject reservoir and is a prerequisite for assigning reserves.
Technology under Development: A recovery process that has been determined to be technically viable via field test and is being field tested further to determine its economic viability in the subject reservoir. Contingent Resources may be assigned if the project provides information that is sufficient and of a quality to meet the requirements for this resource class.
Experimental Technology: A technology that is being field tested to determine the technical viability of applying a recovery process to unrecoverable discovered PIIP in a subject reservoir. It cannot be used to assign any class of recoverable resources (i.e., reserves and Contingent Resources).
e) Economic Status of Resource Estimates
By definition, reserves are commercially (and hence economically) recoverable. A portion of Contingent Resources may also be associated with projects that are economically viable but have not yet satisfied all requirements of commerciality. Accordingly, it may be a desirable option to subclassify Contingent Resources by economic status:
Economic Contingent Resources are those Contingent Resources that are currently economically recoverable. The Contingent Resources sub-classes included are Development Pending Contingent Resources, Development on Hold Contingent Resources, and Development Unclarified Contingent Resources.
Sub-Economic Contingent Resources are those Contingent Resources that are not currently economically recoverable. The Contingent Resources sub-class included is Development Not Viable.
Where evaluations are incomplete such that it is premature to identify the economic viability of a project, it is acceptable to note that project economic status is “undetermined” (i.e., “Contingent Resources -economic status undetermined”).
In examining economic viability, the same fiscal conditions should be applied as in the estimation of reserves, i.e., specified economic conditions, which are generally accepted as being reasonable (refer to the COGE Handbook Consolidated 3rd Edition, Section 1.4.7.2.1.3).
TransGlobe Energy | Corporate Presentation | August 2021

CAUTIONARY STATEMENTS
Slide 51
f) Project Maturity Sub-Classes for Contingent Resources
Development Pending: Where resolution of the final conditions for development is being actively pursued (high chance of development).
Development on Hold: Where there is a reasonable chance of development but there are major non-technical contingencies to be resolved that are usually beyond the control of the operator.
Development Unclarified: When the evaluation is incomplete and there is ongoing activity to resolve any risks or uncertainties.
Development Not Viable: Contingent Resource that is not viable in the conditions prevailing at the effective date of the evaluation, and where no further data acquisition or evaluation is currently planned and hence there is a low chance of development.
Historic Financial Information regarding the Assets
The three concessions associated with the Merged Concession generated $1.6 million of income in 2019.
TransGlobe Energy | Corporate Presentation | August 2021

CAUTIONARY STATEMENTS
Slide 52
bbls barrelsMMbbl million barrelsMMbbl/d million barrels per dayMbbl/d thousand barrels per dayBoe barrels of oil equivalent of natural gas, on the basis of one barrel of oil or NGLs for six thousand cubic feet of natural gasBoepd barrels of oil equivalent per dayMboepd thousand barrels of oil equivalent per dayMMboe million barrels of oil equivalentBopd barrels of oil per dayMbopd thousand barrels of oil per dayMcf thousand cubic feetMcf/d thousand cubic feet per dayMMcf/d million cubic feet per dayBcf billion cubic feetBcf/d billion cubic feet per dayTcf trillion cubic feetNGL Natural Gas LiquidsMM million
Certain Defined Terms• Product types. All of TransGlobe's reserves disclosed in this presentation are heavy crude oil, medium crude oil, light crude oil, conventional natural gas or natural gas liquids. Light crude oil is crude oil with a relative density greater
than 31.1 degrees API gravity, medium crude oil is crude oil with a relative density greater than 22.3 degrees API gravity and less than or equal to 31.1 degrees API gravity, and heavy crude oil is crude oil with a relative density greater than 10 degrees API gravity and less than or equal to 22.3 degrees API gravity. Conventional natural gas means natural gas that has been generated elsewhere and has migrated as a result of hydrodynamic forces and is trapped in discrete accumulations by seals that may be formed by localized structural, depositional or erosional geological features. Natural gas liquids means those hydrocarbon components that can be recovered from natural gas as a liquid, including ethane, propane, butanes, pentanes plus, and condensates.
• "Proved" reserves are those reserves that can be estimated with a high degree of certainty to be recoverable. It is likely that the actual remaining quantities recovered will exceed the estimated proved reserves. • "Probable" reserves are those additional reserves that are less certain to be recovered than proved reserves. It is equally likely that the actual remaining quantities recovered will be greater or less than the sum of the estimated
proved plus probable reserves. • "Possible" reserves are those additional reserves that are less certain to be recovered than probable reserves. There is a 10% probability that the actual remaining quantities recovered will equal or exceed the sum of the estimated
proved + probable + possible reserves. • "Gross Reserves" are the Company's working interest (operating and non-operating) share before deduction of royalties and without including any royalty interests of the Company. • "Developed" reserves are those reserves that are expected to be recovered from existing wells and installed facilities or, if facilities have not been installed, that would involve a low expenditure (e.g. when compared to the cost of
drilling a well) to put the reserves on production. • "Developed Producing" reserves are those reserves that are expected to be recovered from completion intervals open at the time of the estimate. These reserves may be currently producing or, if shut-in, they must have previously
been on production, and the date of resumption or production must be known with reasonable certainty. • "Developed Non-Producing" reserves are those reserves that either have not been on production, or have previously been on production, but are shut-in, and the date of resumption is unknown. • "Undeveloped" reserves are those reserves expected to be recovered from known accumulations where a significant expenditure (for example, when compared to the cost of drilling a well) is required to render them capable of
production. They must fully meet the requirements of the reserves classifications (proved, probable, possible) to which they are assigned. • The following abbreviations used in this presentation have the meanings set forth below:
"BOEs" may be misleading, particularly if used in isolation. A BOE conversion ratio of six thousand cubic feet of natural gas to one barrel of oil equivalent (6 mcf: 1 bbl) is based on an energy equivalency conversion method primarily applicable at the burner tip and does not represent a value equivalency at the wellhead. Given that the value ratio based on the current price of crude oil as compared to natural gas is significantly different from the energy equivalency of 6:1, utilizing a conversion on a 6:1 basis may be misleading as an indication of value.
TransGlobe Energy | Corporate Presentation | August 2021

For additional information contact us at:Phone: +1 (403) 264 9888
Email: [email protected]
www.trans-globe.com