corporate parenting panel report
TRANSCRIPT
1
ITEM 7
CORPORATE PARENTING PANEL
19 MARCH 2019
Corporate Parenting Panel Report
Children and Families
Quarter 3: 1 October 2018 – 31 December 2018
Joanne Rabbitte Head of Delivery, Corporate Parenting Service

2
Contents:
1. Introduction
3
2. Snapshot of the Children’s Services
4
3. Looked After Children Figures
5
4. Placement Stability
7
5. Placement Location
9
6. Missing from Care
10
7. Care Leavers
11
3
1. Introduction
Purpose: The purpose of this quarterly report is to provide members of the Corporate Parenting Panel with statistical data regarding Children in Care and Care Leavers so that they can have an understanding of key trends and challenges within the service. The report is based on the SSDA903 DFE statutory return information and the Children’s Services Analysis Tool (ChAT). Headlines
LAC numbers have remained stable and are significantly below the national average and statistical neighbours; during the quarter 38 children became looked after and 41 left care with the number at the end of the quarter being 381. This indicates that there is an appropriate level of throughput and case progression
The number of UASC entering care and overall has decreased in line with the nation picture which is largely related to changes in migration patterns. MK has accepted 2 children under the National Transfer Scheme and 2 children under Dubs Agreement
75% of children are in foster care which is in line with statistical neighbours and above the national average of 73%. 59% of LAC are in the in-house provision which is a strong position for the service to be in
15 children returned to live with their parents; 12 turned 18; 2 were adopted; 5 SGO’s were granted and 2 were age assessed as being over 18
With regard to achieving permanence, 106 children are in permanently matched foster placements; 12 Adoption Orders and 29 Special Guardianship Orders have been granted
24 children are placed with their own parents, the majority of whom are subject to rehabilitation plan
With regard to placement stability, the number of children with 3+ placements is in line our statistical neighbours and higher than the national average; the long-term stability of placements is lower than statistical neighbours and the national average
The majority of our children are placed within MK. 89 are placed in a neighbouring authority and 58 are placed at a distance. This pattern is below statistical neighbours and the national average and is an identified strength in the service
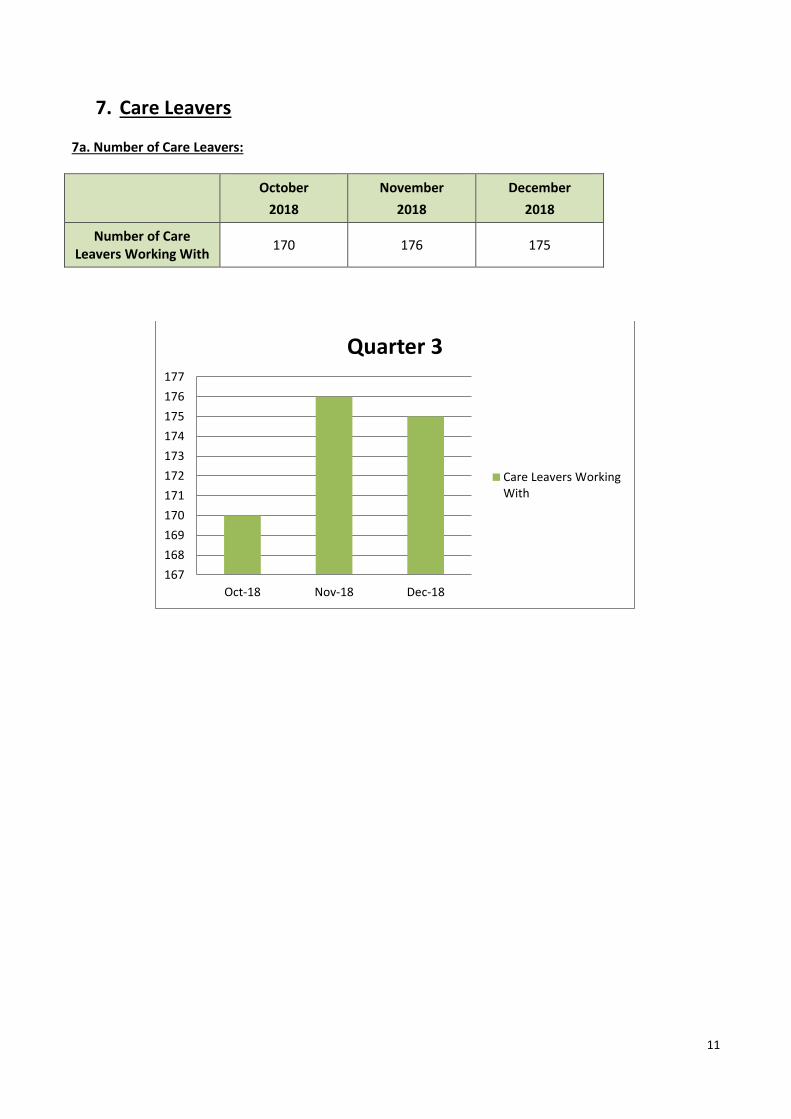
The number of care leavers increased over the quarter and was 175 at the end of December
52% of Care Levers are in education training and employment which is blow the national average which is a concern that members are asked to be aware of
95% of our Care Leavers are in suitable accommodation with the majority living independently

4
2.
Snap
sho
t o
f C
hild
ren
Se
rvic
e’s
– Q
ua
rte
r 3
Ch
ildre
n in
C
are
&
C
are
Le
ave
rs
Loo
ked
A
fte
r C
hild
ren
Oct
20
18
:
38
8
No
v 2
01
8:
38
1
De
c 2
01
8:
38
1
Car
e
Leav
ers
Oct
20
18
:
17
0
No
v 2
01
8:
17
6
De
c 2
01
8:
17
5

5
3. Looked After Children Figures
3a. Number of Looked After Children:
October 2018 November 2018 December 2018
388 381 381
3b. Number of CLA Starts and Ends:
October 2018 November 2018 December 2018
CLA Starts 16 8 14
CLA Ends 16 15 10
Total 0 -7 +4
376
378
380
382
384
386
388
390
Oct-18 Nov-18 Dec-18
Quarter 3
Number of LookedAfter Children
0
2
4
6
8
10
12
14
16
18
Oct-18 Nov-18 Dec-18
Quarter 3
CLA Starts
CLA Ends
6
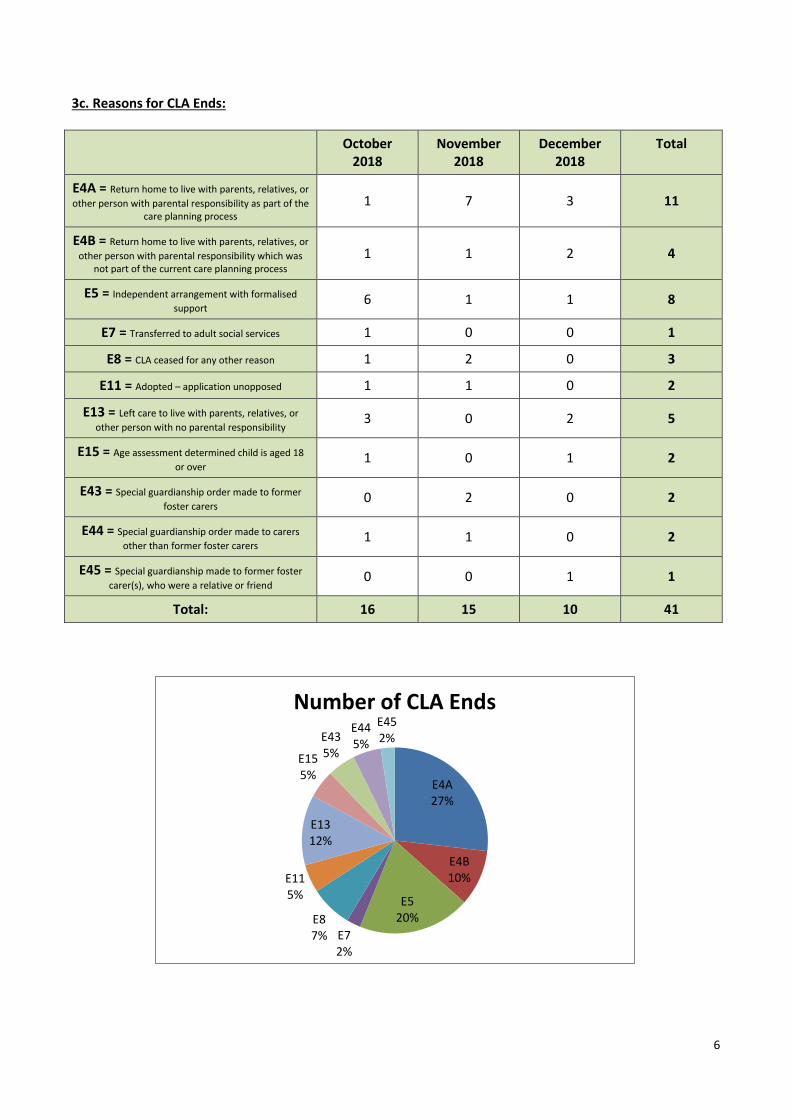
3c. Reasons for CLA Ends:
October 2018
November 2018
December 2018
Total
E4A = Return home to live with parents, relatives, or
other person with parental responsibility as part of the care planning process
1 7 3 11
E4B = Return home to live with parents, relatives, or
other person with parental responsibility which was not part of the current care planning process
1 1 2 4
E5 = Independent arrangement with formalised
support 6 1 1 8
E7 = Transferred to adult social services 1 0 0 1
E8 = CLA ceased for any other reason 1 2 0 3
E11 = Adopted – application unopposed 1 1 0 2
E13 = Left care to live with parents, relatives, or
other person with no parental responsibility 3 0 2 5
E15 = Age assessment determined child is aged 18
or over 1 0 1 2
E43 = Special guardianship order made to former
foster carers 0 2 0 2
E44 = Special guardianship order made to carers
other than former foster carers 1 1 0 2
E45 = Special guardianship made to former foster
carer(s), who were a relative or friend 0 0 1 1
Total: 16 15 10 41
E4A 27%
E4B 10%
E5 20%
E7 2%
E8 7%
E11 5%
E13 12%
E15 5%
E43 5%
E44 5%
E45 2%
Number of CLA Ends
7
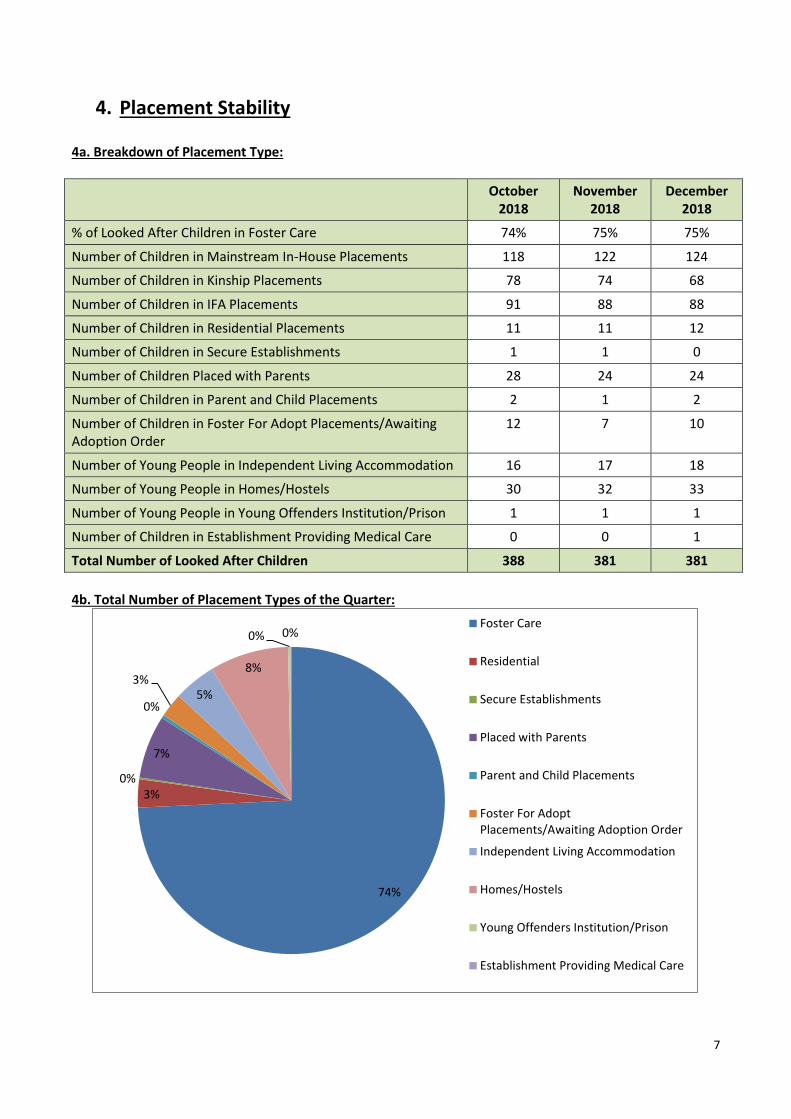
4. Placement Stability 4a. Breakdown of Placement Type:
October 2018
November 2018
December 2018
% of Looked After Children in Foster Care 74% 75% 75%
Number of Children in Mainstream In-House Placements 118 122 124
Number of Children in Kinship Placements 78 74 68
Number of Children in IFA Placements 91 88 88
Number of Children in Residential Placements 11 11 12
Number of Children in Secure Establishments 1 1 0
Number of Children Placed with Parents 28 24 24
Number of Children in Parent and Child Placements 2 1 2
Number of Children in Foster For Adopt Placements/Awaiting Adoption Order
12 7 10
Number of Young People in Independent Living Accommodation 16 17 18
Number of Young People in Homes/Hostels 30 32 33
Number of Young People in Young Offenders Institution/Prison 1 1 1
Number of Children in Establishment Providing Medical Care 0 0 1
Total Number of Looked After Children 388 381 381
4b. Total Number of Placement Types of the Quarter:
74%
3% 0%
7%
0%
3% 5%
8%
0% 0% Foster Care
Residential
Secure Establishments
Placed with Parents
Parent and Child Placements
Foster For AdoptPlacements/Awaiting Adoption Order
Independent Living Accommodation
Homes/Hostels
Young Offenders Institution/Prison
Establishment Providing Medical Care

8
4c. Achieving Permanence:
October 2018
November 2018
December 2018
Number of Children in Permanently Matched Placements 106 107 106
Number of Children in Permanently Matched In-House Placements
73 73 72
Number of Children Permanently Matched IFA Placements 33 34 34
% of Children in Permanently Matched In-House Placements 69% 68% 68%
Number of SGOs Granted (cumulative) 20 25 29
Number of Adoption Orders Granted (cumulative) 11 12 12
4d. Multiple Placement Moves:
October
2018
November
2018
December
2018
Number of Children with 2+ Placement Moves**
TBA
Number of Children with 3+ Placement Moves**
Number of Children with a Placement Length of 18+
Months**
** Data to be provided by Performance.
0
10
20
30
40
50
60
70
80
Oct-18 Nov-18 Dec-18
Matched Fostering Placements
Matched In-HousePlacements
Matched IFA Placements

9
5. Placement Location 5a. Out of County and At a Distance:
October
2018
November
2018
December
2018
Number of Children Placed within the Local Authority Boundary
235 233 234
Number of Children Placed within the area of an adjoining Local Authority or 20 miles or less from the
Local Authority Boundary (Out of County) 90 90 89
Number of Children Placed more than 20 miles from the Local Authority Boundary (At a Distance)
63 58 58
0
50
100
150
200
250
Oct-18 Nov-18 Dec-18
Placement Location
Within Local AuthorityBoundary
Out of County
At a Distance
61%
23%
16%
Within the Local AuthorityBoundary
Out of County
At a Distance

10
6. Missing from Care
6a. Total Number of Missing Episodes:
Missing Less Than 24 Hours:
Missing 1 – 6 Days: Missing 6+ Days: Total:
Male Female Male Female Male Female
October 2018 0 1 1 0 0 0 2
November 2018 1 0 0 0 0 0 1
December 2018 0 0 1 0 0 0 1
These episodes relate to all Looked After Children, not just the children placed within the in-house Fostering Service. The above information relates to 2 children in total, with 1 young person having 3 missing episodes.
0
0.5
1
1.5
2
2.5
Oct-18 Nov-18 Dec-18
Quarter 3
Number of MissingEpisodes
11
7. Care Leavers 7a. Number of Care Leavers:
October
2018
November
2018
December
2018
Number of Care Leavers Working With
170 176 175
167
168
169
170
171
172
173
174
175
176
177
Oct-18 Nov-18 Dec-18
Quarter 3
Care Leavers WorkingWith

12
7b. Number of Care Leavers in Suitable Accommodation:
October
2018
November
2018
December
2018
Number of Care Leavers in Suitable
Accommodation 163 164 158
7c. Number of Care Leavers engaging in Education, Employment and Training (EET):
October
2018
November
2018
December
2018
Number of Care Leavers EET
90 91 89
Number of Care Leavers NEET
80 85 86
155
156
157
158
159
160
161
162
163
164
165
Oct-18 Nov-18 Dec-18
Number of Care Leavers
Number of Care Leavers
52%
48% EET
NEET