corporate - magnetite minesmagnetitemines.com/images/downloads/attachments/170929_annual... · a...
TRANSCRIPT

ANNUAL REPORT 2017
CORPORATE INFORMATION CONTENTS
DIRECTORS GORDON L TOLL Executive Chairman
FRANK DEMARTE Executive Director
PETER J SCHUBERT Executive Director
MALCOLM R J RANDALL Non-Executive Director
COMPANY SECRETARY FRANK DEMARTE
STOCK EXCHANGE LISTING Australian Securities Exchange Ltd Code: MGT WEBSITE www.magnetitemines.com
PRINCIPAL REGISTERED OFFICE 118 B, Glen Osmond Road Parkside South Australia 5063 PO Box 1014 Canning Br idge Applecross Western Australia 6153
Telephone: (+61 8) 8427 0516 Facsimile: (+61 8) 8427 0515
Email: [email protected]
ABN: 34 108 102 432 SHARE REGISTER Computershare Investor Services Pty Ltd Level 11, 172 St Georges Terrace Perth, Western Australia 6000
Telephone (within Australia): 1300 850 505 Telephone (outside Australia): (+61 3) 9415 4000 Facsimile: (+61 8) 9323 2033 AUDITORS Stantons International Level 2, 1 Walker Avenue West Perth, Western Australia 6005
CHAIRMAN’S LETTER 1 REVIEW OF OPERATIONS 3 CORPORATE GOVERNANCE STATEMENT 12 DIRECTORS’ REPORT 18 REMUNERATION REPORT (AUDITED) 21 CONSOLIDATED STATEMENT OF PROFIT OR LOSS AND OTHER COMPREHENSIVE INCOME 30 CONSOLIDATED STATEMENT OF FINANCIAL POSITION 31 CONSOLIDATED STATEMENT OF CHANGES IN EQUITY 32 CONSOLIDATED STATEMENT OF CASH FLOWS 33 NOTES TO THE FINANCIAL STATEMENTS 34 DIRECTORS’ DECLARATION 65 INDEPENDENT AUDIT REPORT TO THE MEMBERS 66 AUDITOR’S INDEPENDENCE DECLARATION 68 ASX ADDITIONAL INFORMATION 69

1
DEAR SHAREHOLDERS,
Several thoughts occur as I reflect on events in the iron ore business during the 2016/17 Australian financial year.
GENERAL ISSUES
It was a time when prices in reality beat the pundits’ forecast prices very significantly and particularly for higher quality ores and concentrates.
During this time, premiums for high-grade ores and concentrates increased significantly as did discounts for low-grade ores. We observed the hitherto unusual phenomena of high-grade iron ore prices increasing while low-grade ore prices simultaneously decreased. I believe the deep discounts on low quality ores and concentrates will continue. We may witness a situation in the future, when not even deep, deep discounts will ensure the sale of poor quality ores and concentrates.
A new “quality” paradigm is emerging amongst blast furnace (BF) steel makers. Even the media and financial sectors have begun to realise that in an energy and emissions conscious world, for steel making, high-grade ores and concentrates are significantly more desirable than low-grade ores.
Phosphorous levels in some company’s Pilbara sinter blends became such that their spokes persons refuse to publicly speak about them. To offset this increase in phosphorous levels in dominant products, the steel makers, of necessity, must seek ultra low phosphorous iron sources such as our magnetite concentrates. Phosphorous, even in relatively small quantities, has an extremely deleterious effect on the strength of steel. In all steel making technologies, removing phosphorous from the molten metal is prohibitively expensive. Hence, only a low phosphorous ore/concentrate blend is an acceptable starting point for steel makers.
In the next 5 to 10 years, about 200 to 300 million tpy of mining capacity in the Pilbara will exhaust the orebodies being mined by that capacity. Development of replacement orebodies - if available - will absorb a lot of capital. In a majority of cases the quality of the replacement ore will be inferior in quality to that which it replaces. At the same time, similar events will unfold in Vale’s southern production system in Minas Gerais.
These trends are all conducive to the development of new sources of high-grade iron ores and concentrates such as those that may be produced in the Mawson Iron Province.
A NEW APPROACH TO INITIAL DEVELOPMENT
In consultation with our Company, Lodestone Equities Limited (Lodestone), our associate in the South Australian Magnetite Consortium, began work on a lower cost, fast track start up project, which would use the existing ARTC standard gauge railway. This project is based on resources on wholly owned Exploration Licenses immediately south of Olary Siding on the ARTC railway. Initial test work indicates that a product suitable for the high margin Direct Reduction steel market may be produced from these resources. Lodestone is continuing to fine-tune the configuration of this phase one, fast track development. A definitive feasibility study is planned for the near future. This lower cost, fast track project should have flow-on benefits for our company.
FUNDING THE OLARY DEFINITIVE FEASIBILITY STUDY
Lodestone has conducted a focused scoping study to select best options for the configuration of such a smaller, fast tracked, start up project. A document titled “The Narrative Report” (Narrative) is being compiled to summarise the results. The results presented in the Narrative will form the basis of a Preliminary Economic Analysis (PEA) of the Olary project. The purpose of the Narrative and the PEA (including a comprehensive financial model) is to de-risk the Detailed Feasibility Study (DFS) of the Olary Project and facilitate the raising of funds for the DFS and Basic Engineering.
MARKETING
We have “evolved” a segmented approach to sales and marketing based on the belief that we may have the ability to serve both the Direct Reduction (DR) steel making market from Lodestones resources and the Blast Furnace (BF) steel making market from both our resources and Lodestones resources. The DR market, where reduction of iron oxide to iron metal is achieved by reformed natural gas, requires very high quality lump ore or concentrates. The concentrates are usually agglomerated into pellets prior to entering the DR process. Only Vale amongst the big four can consistently supply large quantities of such high quality fine ore concentrates and then only as energy disadvantaged haematite. It requires four times more energy to make DR pellets from haematite versus magnetite concentrates. Test work to date indicates an ultra high-grade magnetite concentrate ideal for the DR market segment, can be produced from the Olary resources.

2
MARKETING CONTINUED
The epicentre of DR steel making is the Middle East and North Africa (The MENA area). New demand for DR quality concentrates in the MENA region is likely to grow by 30 to 50 million tpy in coming years. An entry to this market segment from which three of the big four are essentially excluded is imperative for our Company’s future. It is important to note that not all magnetites can serve this market. Sino Iron cannot. Karara cannot. Savage River cannot. Iron Bridge and Iron Road will not be able to service this market. They simply cannot produce the requisite quality product. Not all magnetites are created equal. The typical magnetite concentrate in global trade and in China is 66% Fe or less. Initial testing indicates that Olary’s DR product can be as high as 70% Fe and our BF product can exceed 68% Fe. The indicative quality of these products is very attractive to steel producers. Premiums for products such as these are currently significantly higher than the Pilbara 62% Fe sinter fines benchmark price.
In the blast furnace (BF) steel making area where the iron oxide is reduced to molten iron by carbon (predominantly in the form of coke) the largest proportion of the iron ore feed comprises sintered fine ores and concentrates. Sintering is a process whereby these fines and concentrates are mixed with a carbon source (usually screenings from the coke plant) and set alight with an air blast to create a fused (sintered) mass that can be fed to the BF process. Advances in the preparation of feed to sinter plants now allows the use of a significant percentage of fine concentrates in the sinter blend whereas previously this was not possible. Lodestone has been a pioneer advocate of the merits of this application and market segment.
STRATEGIC PARTNERS
We are asked very often: “If your product is so good, how come steel makers are not lining up to become your strategic partners?”
Without pretending to know the complete answer to this question, I can comment as follows:
In the BF steel sector there remains a perception of an oversupply of iron ore albeit a significant proportion of that supply is of a lousy quality.
The Chinese BF steel makers dominate world steel capacity and the Chinese capacity is dominated by state owned enterprises that are forbidden to invest in overseas iron ore mines at the moment because of poor outcomes in the recent past.
Russian and American steel makers are largely self sufficient as are Indian. European Steel makers largely source their iron ore in the Atlantic basin. Thus their interest in strategic partnering is very low.
The predicted short fall in DR quality product may make investment in DR concentrate capacity in the Mawson Iron Province attractive to Middle East steel makers. That is where we are focused - without ignoring other possibilities such as private Chinese Steel Companies and infrastructure development companies.
Yours sincerely,
Gordon Toll EXECUTIVE CHAIRMAN
3
SUMMARY OF HIGHLIGHTS
CORPORATE • Framework Agreement between Magnetite Mines Limited (Company or MGT),
Coffee House Group Limited and Lodestone Equities Limited (Lodestone) was signed, as the basis for the negotiation and execution of a formal Share Sale and Purchase Agreement for the proposed acquisition of Lodestone by the Company.
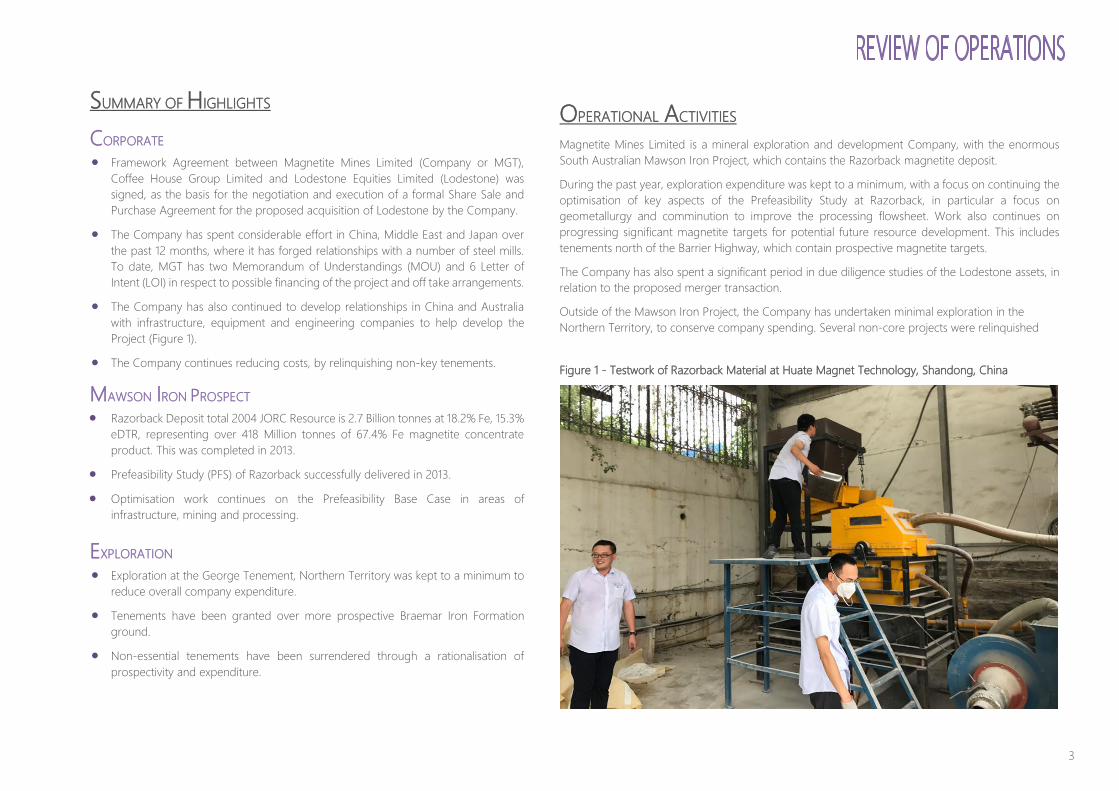
• The Company has spent considerable effort in China, Middle East and Japan over the past 12 months, where it has forged relationships with a number of steel mills. To date, MGT has two Memorandum of Understandings (MOU) and 6 Letter of Intent (LOI) in respect to possible financing of the project and off take arrangements.
• The Company has also continued to develop relationships in China and Australia with infrastructure, equipment and engineering companies to help develop the Project (Figure 1).
• The Company continues reducing costs, by relinquishing non-key tenements.
MAWSON IRON PROSPECT • Razorback Deposit total 2004 JORC Resource is 2.7 Billion tonnes at 18.2% Fe, 15.3%
eDTR, representing over 418 Million tonnes of 67.4% Fe magnetite concentrate product. This was completed in 2013.
• Prefeasibility Study (PFS) of Razorback successfully delivered in 2013.
• Optimisation work continues on the Prefeasibility Base Case in areas of infrastructure, mining and processing.
EXPLORATION • Exploration at the George Tenement, Northern Territory was kept to a minimum to
reduce overall company expenditure.
• Tenements have been granted over more prospective Braemar Iron Formation ground.
• Non-essential tenements have been surrendered through a rationalisation of prospectivity and expenditure.
OPERATIONAL ACTIVITIES Magnetite Mines Limited is a mineral exploration and development Company, with the enormous South Australian Mawson Iron Project, which contains the Razorback magnetite deposit.
During the past year, exploration expenditure was kept to a minimum, with a focus on continuing the optimisation of key aspects of the Prefeasibility Study at Razorback, in particular a focus on geometallurgy and comminution to improve the processing flowsheet. Work also continues on progressing significant magnetite targets for potential future resource development. This includes tenements north of the Barrier Highway, which contain prospective magnetite targets.
The Company has also spent a significant period in due diligence studies of the Lodestone assets, in relation to the proposed merger transaction.
Outside of the Mawson Iron Project, the Company has undertaken minimal exploration in the Northern Territory, to conserve company spending. Several non-core projects were relinquished
Figure 1 - Testwork of Razorback Material at Huate Magnet Technology, Shandong, China

4
MAWSON IRON PROJECT The Mawson Iron Project is located 250km NNE of Adelaide, South Australia, and covers large tracts of the highly prospective Braemar Iron Formation (Figure 2). It consists of five exploration licences: EL5432, EL5902, EL5240 and EL5180, which are owned by the Company and cover the Razorback deposit and its extensions. The Company is focussed on the development of the multi-billion tonne Razorback Deposit which comprises the Razorback Ridge, Razorback West, Interzone and Iron Peak orebodies (Figure 3).
The Braemar Iron Formation is the host rock to magnetite mineralisation on the project. This formation has a strike length of approximately 120km within the area controlled by the Company and has the potential to host an exploration target of 16 to 32 Billion tonnes at 11% to 25% Magnetite DTR recovery and > 68% Fe concentrates1,2.
The Company has a MOU with Braemar Infrastructure Pty Ltd (BIPL)3 to collaborate in the development of an infrastructure corridor from the Mawson Iron Project to the sheltered waters of the Spencer Gulf. This corridor includes: 1) slurry pipeline to transport the magnetite from mine site to port; 2) pipeline from the coast to the mine site to provide seawater for processing; 3) high voltage transmission lines; and 4) a floating port and filter plant ~5 miles off the coast, capable of loading Cape-size
and Vale-size ships.
The Mawson Iron Project is also surrounded by existing infrastructure allowing access to open user power, gas, heavy engineering and dormitory towns.
The Mawson Iron Project also plans to apply innovation to its mining and processing to enable its operating costs to fall within the 1st quarter of the cost curve. Mining and Processing will include: 1) ultra-high power factor blasting; 2) fully mobile in-pit crushing and conveying (IPCC); and 3) intelligent comminution and concentration. Notes: 1 The potential quantity and grade of the exploration target is conceptual in nature, there has
been insufficient exploration to define a Mineral Resource and it is uncertain if further exploration will result in the determination of a Mineral Resource. The estimate of an exploration target tonnage should not be construed as an estimate of Mineral Resource.
2 Announced 29th October 2015. 3 Announced 25th September 2013.
Figure 2 – Project Locations – Mawson Iron Project

5
Figure 3 - Aeromagnetic Image of the Mawson Iron Project, detailing the locations of the Mawson Iron Project and associated prospects.
RAZORBACK DEPOSIT Activities at the Razorback Deposit follows on from the previous year in focussing on: 1) modifying the Base Case PFS to increase the proposed production rate to 25 Mtpa; 2) optimising the PFS to further improve the project’s economics through: the application of In-Pit
Crushing and Conveying; using seawater in processing; better defining electrical power options; geometallurgy studies to better understand the ore body variability; and improving beneficiation, with emphasis on dry processing;
3) further production of magnetite concentrates for use in marketing in China and pelletizing studies and; 4) agreements in place for engineering and design of project-related infrastructure, with initial work
underway.
These activities will culminate in the commissioning of a Feasibility Study which will determine the timing of finance requirements and project development. We have also continued to work with Braemar Infrastructure Pty Ltd to further advance the infrastructure part of the project. Figure 4: Area of the Razorback Deposit

6
Razorback Resource and Exploration
A resource definition programme of approximately 36,000 metres of combined RC and diamond drilling has been undertaken over several drilling phases from April 2010 to June 2012 (Figure 4). As announced to the ASX and media on 11th June 2013, the Razorback Deposit has a 2004 JORC compliant total Resource of 2.7 Billion tonnes at 15.3% eDTR*, 18.2% Fe Head grade (Table 1). The resource has not been updated to the 2012 JORC standard, although there has been no material change in its estimate to necessitate this. The resource equates to 418 Million tonnes of 67.4% Fe concentrate equivalent (Table 2). The Razorback Project will use a relatively coarse grind size of 45 microns.
Additional work at the Iron Peak and Razorback Ridge Prospects area has identified potential higher-grade zones outside the present calculated resource. Its proximity to the proposed beneficiation plant allows additional mining options in the future development of the project. Table 1 - Total 2004 JORC Mineral Resource from the Razorback Deposit (11% eDTR cutoff)1
Prospect JORC Resource Classification
Million
Tonnes2
eDTR%*
Fe%
SiO2%
Al2O3%
P%
Razorback Indicated 833 16.0 21.7 45.2 7.3 0.20
Inferred 1,532 14.6 16.1 50.2 8.5 0.17
Iron Peak Indicated 203 16.8 20.0 45.0 7.67 0.18 Inferred 163 15.6 17.1 46.7 8.0 0.16
Total Mineral Resources 2,732 15.3 18.2 48.1 8.0 0.18 Note:
1 The Mineral Resources information for the project was prepared and first disclosed under the JORC Code 2004 and the information has not been updated since to comply with the JORC Code 2012 on the basis the information has not materially changed since it was last reported.
2 Tonnages rounded to significant values; total may not appear correct as a result.
* eDTR or equivalent Davis Tube Recovery explained in ASX announcements on the 11th June 2013 and 10th July 2013.
Table 2 - Razorback Deposit indicative product specification (45 micron grind size)
Recovery Million Tonnes
Fe%
SiO2%
Al2O3%
P%
S% Magnetite Product1
15.3% 418 67.4 4.74 0.54 0.016 0.003
Note 1: Rounded to significant figures
Figure 5 – Schematic drawing of the proposed mine layout at the Razorback Deposit for illustration purposes only

7
IRONBACK HILL PROSPECT The Ironback Hill Prospect occurs on EL5180 and is approximately 12 km south-southwest of Razorback Ridge (Figure 3). An Inferred Resource of 1,187 Mt @ 23.2% Fe (2004 JORC Compliant) was announced on 21st November 2012, and represents approximately 10 kilometres strike length of the Braemar Iron Formation. The completed drilling program included 12,466 metres RC and 2,849 metres of diamond drilling between October 2011 and April 2012 (Figure 6). Resource modelling confirmed the excellent continuity of the resource. The Resource remains open to the east and with depth. Rehabilitation of drill pads and tracks are mostly completed. The Ironback Hill Prospect would most likely be developed independently to the Razorback Project. Table 3: Total 2004 JORC compliant Inferred Mineral Resource from Ironback Hill1
Project JORC Resource Classification
Million Tonnes2
Fe%
SiO2%
Al2O3%
P% Ironback Hill Inferred 1,187 21.0 44.1 7.2 0.21
Notes: 1 The Mineral Resource information for the project was prepared and first disclosed under the JORC Code
2004 and the information has not been updated since to comply with the JORC Code 2012 on the basis the information has not materially changed since it was last reported.
2 Tonnages rounded to significant values; total may not appear correct as a result.
MAWSON IRON PROJECT EXPLORATION
Magnetite exploration within the Mawson Iron Project was carried out along the Braemar Iron Formation, in areas outside the Razorback Project and the Ironback Hill Prospect. This included a new 3D inverted magnetic model of the entire tenement package, which will better define drilling targets in the future. The exploration target was determined to be 16 to 32 Billion tonnes at 11% to 25% Magnetite DTR recovery1,2. Key targets include - Black Hills South, Dragon’s Head and Manunda Prospects.
Notes: 1 The potential quantity and grade of the exploration target is conceptual in nature, there has been
insufficient exploration to define a Mineral Resource and it is uncertain if further exploration will result in the determination of a Mineral Resource. The estimate of an exploration target tonnage should not be construed as an estimate of Mineral Resource.
2 Announced 29th October 2015.
Figure 6 – Ironback Hill Resource
NORTHERN BRAEMAR EXPLORATION Two prospective tenements (EL5962 and EL5974) were granted in the northern Braemar area, approximately 20 km north and northwest of the town of Olary (Figure 7). Combined, the tenements contain approximately 22 km strike length of Braemar Iron Formation with strong magnetic intensity, determined from open file South Australian Government magnetic imagery. The Company plans to complete initial fieldwork in the fore coming year.

8
Figure 7 – Bulk sampling at the Razorback Adit
Figure 8 – Bulk sampling at the Razorback Adit
NORTHERN TERRITORY TENEMENTS The Company retains a portfolio of gold, base metal and uranium properties in highly mineralised terrains of the Pine Creek Region in the Northern Territory. These properties are 100% owned by the Company and exist of exploration licences George EL24550 and Amangal EL27354.
The George/Amangal Project is located 95km south of Darwin and immediately southwest of Adelaide River in the Northern Territory. It covers a combined 88km2 and lies within the gold–rich Central Pine Creek Orogen; host to the well-endowed Pine Creek Goldfield, Union Reefs Goldfield and the Cosmo-Howley Belt. Typically, gold mineralisation evident at George and elsewhere in the region occurs in quartz-sulphide veins (Figure 9) hosted in saddle-reef and fault zones located proximal to anticlinal fold closures.
Modern gold exploration at George was first undertaken in the late 1980’s to early-mid 1990’s, targeting anticlinal hinges. This led to the discovery of a number of gold occurrences in outcropping quartz veins, returning rock chips up to 170 g/t Au and in soil anomalies where fold hinge areas are under transported cover. Drilling was limited and ineffective in delineating the targets at the three main prospects - Possum, Happy Valley and Arum; with low level gold mineralisation intersected. When gold price significantly receded in the mid to late 90’s, these explorers exited the area. Since that time the area has been the focus of uranium exploration with scant attention being paid to its gold potential, so leaving a number of recommendations from that time not acted upon.
Since the Company has begun assessing gold targets, the field assessment has led to the discovery of additional gold prospects, namely the Croc Paté Prospect, returning up to 11 g/t Au with along strike continuations, (Figure 10). These targets remain largely untested. (see ASX announcements on 25th November 2013 & 30th July 2014).

9
Figure 9 – Northern Territory Project Locations, Pine Creek
Figure 10 - Gold mineralised Quartz vein, George Project
Figure 11- Gold Targets, George Project

10
STATEMENT OF RESOURCES
RAZORBACK RESOURCE ESTIMATE1 (100% MAGNETITE MINES) – JUNE 2013
Prospect JORC Resource Classification
Million Tonnes2
eDTR%*
Fe%
SiO2%
Al2O3%
P%
Razorback Indicated 833 16.0 21.7 45.2 7.3 0.20 Inferred 1,532 14.6 16.1 50.2 8.5 0.17 Iron Peak Indicated 203 16.8 20.0 45.0 7.67 0.18 Inferred 163 15.6 17.1 46.7 8.0 0.16
Total Mineral Resources 2,732 15.3 18.2 48.1 8.0 0.18
Note:
1 The Mineral Resource information for the project was prepared and first disclosed under the JORC Code 2004. While the resource has been reviewed during 2014, the information has not been updated since to comply with the JORC Code 2012 and on that basis the information has not materially changed since it was last reported.
2 Rounded to significant figures.
* eDTR is the equivalent Davis Tube Recovery derived from calibrated magnetic susceptibility data and explained in ASX announcements on the 11th June 2013 and 10th July 2013.
IRONBACK HILL RESOURCE ESTIMATE1 (100% MAGNETITE MINES) – NOVEMBER 2012
Project JORC Resource Classification
Million Tonnes2
Fe%
SiO2%
Al2O3%
P%
Ironback Hill Inferred 1,187 21.0 44.1 7.2 0.21
Note:
1 The Mineral Resource information for the project was prepared and first disclosed under the JORC Code 2004. While the resource has been reviewed during 2014, the information has not been updated since to comply with the JORC Code 2012 and on that basis the information has not materially changed since it was last reported.
2 Tonnages rounded to significant values; total may not appear correct as a result.
COMPETENT PERSON STATEMENT
The details contained in this report that pertains to ore and mineralisation and the resource underpinning the production target is based upon information compiled by Dr Gavin England BSc (Hons), PhD, a full-time employee of the Magnetite Mines Limited and external consultant Mr Lynn Widenbar BSc (Hons), MSc, DIC, Principal Consultant Widenbar and Associates Pty Ltd. Dr England is a Member of the Australasian Institute of Mining and Metallurgy (AusIMM) and Australian Institute of Geoscientists (AIG). Mr Widenbar is a Member of the AusIMM. These two people have sufficient experience which is relevant to the style of mineralisation and type of deposit under consideration and to the activity which they are undertaking to qualify as a Competent Persons as defined in the December 2012 edition of the “Australasian Code for Reporting of Exploration Results, Mineral Resources and Ore Reserves” (JORC Code 2012). Dr England and Mr Widenbar consent to the inclusion in this report of the matters based upon their information in the form and context in which it appears. The Resource Statement above is based on, and fairly represents, information and supporting documentation prepared by competent persons. The information for the Razorback Deposit was prepared and first disclosed under the JORC Code 2004. The information has not been updated since to comply with the JORC Code 2012 on the basis that the information has not materially changed since it was last reported.
CORPORATE GOVERNANCE – RESERVES AND RESOURCES CALCULATIONS Due to the nature, stage and size of the Company’s existing operations, the Company believes there would be no efficiencies gained by establishing a separate mineral reserves and resources committee responsible for reviewing and monitoring the Company’s processes for calculating mineral reserves and resources and for ensuring that the appropriate internal controls are applied to such calculations. However, the Company ensures that any mineral reserve and resource calculations are prepared by competent geologists and are reviewed independently and verified (including estimation methodology, sampling, analytical and test data). The Company will report any future mineral reserves and resources in accordance with the JORC Code 2012.
11
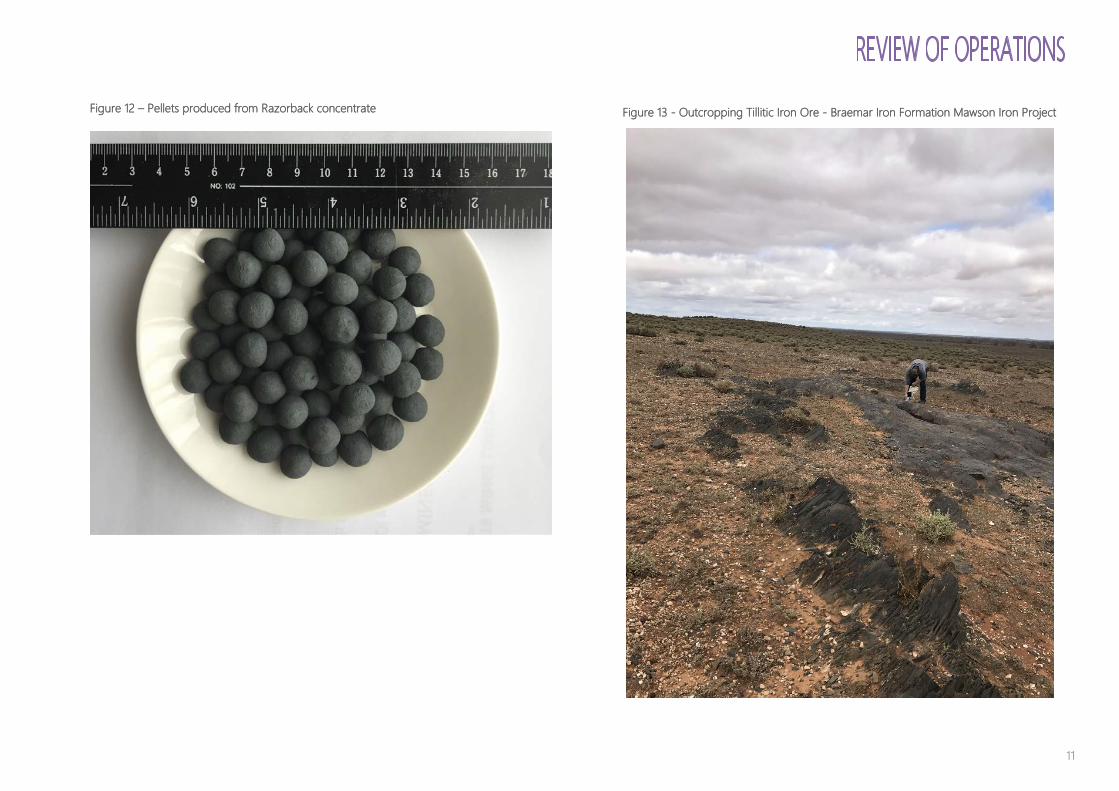
Figure 12 – Pellets produced from Razorback concentrate
Figure 13 - Outcropping Tillitic Iron Ore - Braemar Iron Formation Mawson Iron Project

12
APPROACH TO CORPORATE GOVERNANCE
Magnetite Mines Limited ABN 34 108 102 432 (Company) has established a corporate governance framework, the key features of which are set out in this statement. In establishing its corporate governance framework, the Company has referred to the recommendations set out in the ASX Corporate Governance Council's Corporate Governance Principles and Recommendations 3rd edition. The Company has followed each recommendation where the Board has considered the recommendation to be an appropriate benchmark for its corporate governance practices. Where the Company's corporate governance practices follow a recommendation, the Board has made appropriate statements reporting on the adoption of the recommendation. In compliance with the "if not, why not" reporting regime, where, after due consideration, the Company's corporate governance practices do not follow a recommendation, the Board has explained it reasons for not following the recommendation and disclosed what, if any, alternative practices the Company has adopted instead of those in the recommendation. The following governance-related documents can be found on the Company's website at http://magnetitemines.com/corporate/corporate-governance:
Charters Board Audit Committee Nomination Committee Remuneration Committee Risk Committee
Policies and Procedures Policy and Procedure for the Selection and (Re) Appointment of Directors Process for Performance Evaluations Procedure for the Selection, Appointment and Rotation of External Auditor Shareholder Communication and Investor Relations Policy Securities Trading Policy Diversity Policy (summary) Policy on Continuous Disclosure (summary) Compliance Procedures (summary) Code of Conduct (summary) Whistle-blower Policy Induction Program
The Company reports below on whether it has followed each of the recommendations during the 2016/2017 financial year (Reporting Period). The information in this statement is current at 29 September 2017. This statement was approved by a resolution of the Board on 29 September 2017.
PRINCIPLE 1 – LAY SOLID FOUNDATIONS FOR MANAGEMENT AND OVERSIGHT
Recommendation: 1.1
The Company has established the respective roles and responsibilities of its Board and management, and those matters expressly reserved to the Board and those delegated to management and has documented this in its Board Charter, which is disclosed on the Company’s website.
Recommendation: 1.2
The Company undertakes appropriate checks before appointing a person, or putting forward to shareholders a candidate for election as a director and provides shareholders with all material information in its possession relevant to a decision on whether or not to elect or re-elect a director. The checks which are undertaken, and the information provided to shareholders are set out in the Company’s Policy and Procedure for the Selection and (Re)Appointment of Directors, which is disclosed on the Company’s website.
The Company provided shareholders with all material information in relation to the re-election of Peter Schubert as a director at its 2016 Annual General Meeting.
Recommendation: 1.3 The Company has a written agreement with each director setting out the terms of their appointment. However, the Company does not have a written agreement with its Chief Executive Officer, Gordon Toll in his capacity as an executive of the Company. Nor does it have a written agreement with its Company Secretary and Chief Financial Officer, Frank DeMarte in his capacity as an executive of the Company.
Mr Toll commenced as the Company’s Chief Executive Officer on 3 November 2014. The Company had intended to enter into a written agreement with its Chief Executive Officer before the end of the Reporting Period. However, due to the continued inability of the Company to provide any cash remuneration to Mr Toll, entry into a written agreement with Mr Toll has again been deferred.

13
PRINCIPLE 1 - LAY SOLID FOUNDATIONS FOR MANAGEMENT AND OVERSIGHT CONTINUED
Recommendation: 1.3 continued
Mr DeMarte re-joined the Company as its Company Secretary and Chief Financial Officer on 22 August 2013, and since that date the Company and Mr DeMarte have not entered into a written agreement. As reported by the Company during the last reporting period, the agreement was dependent on finalising management changes/structure going forward, these management changes/structures have not been finalised because they were conditional on the Company securing the appropriate funding to progress and develop the Company’s main iron ore project.
The material terms of any employment, service or consultancy agreement the Company, or any of its child entities, has entered into with its Chief Executive Officer, any of its directors, and any other person or entity who is related party of the Chief Executive Officer or any of its directors has been disclosed in accordance with ASX Listing Rule 3.16.4 (taking into consideration the exclusions from disclosure outlined in that rule).
Recommendation: 1.4
The Company Secretary is accountable directly to the Board, through the Chair, on all matters to do with the proper functioning of the Board as outlined in the Company’s Board Charter.
Recommendation: 1.5
The Company has established a Diversity Policy, a summary of which is disclosed on the Company’s website. However, the policy does not include requirements for the Board to set measurable objectives for achieving gender diversity and to assess annually both the objectives and the Company’s progress in achieving them. Nor has the Board set measurable objectives for achieving gender diversity, but the Company actively manages diversity by recognising and utilising the contribution of diverse skills and talent from its directors, officers and employees.
The Board considers that the Company has in place arrangements to encourage diversity in employment. The Company also has an Equal Employment Opportunity and Anti- Discrimination Policy. Further, due to the Company’s current operations, size and small number of employees, the Board considers that it is difficult to set meaningful measurable objectives for achieving gender diversity. However, every effort is made to find the most suitable qualified person for any role within the Company, irrespective of age, sex, religion or any other personal characteristic or attribute, in accordance with the Company’s policy. The Board will review its position and may develop measurable objectives when the Company’s operations increase.
The respective proportions of men and women on the Board, in senior executive positions and across the whole organisation (including casuals) as at the date of this statement are set out in the following table. “Senior executive” for these purposes means those persons who have the opportunity to materially influence the integrity, strategy and operation of the Company and its financial performance, and for the Reporting Period included the Chief Executive Officer and the Company Secretary and Chief Financial Officer:
Proportion of women Whole organisation 3 out of 9 (33%) Senior Executive positions 0 out of 2 (0%) Board 0 out of 4 (0%)
Recommendation: 1.6
The Chair is responsible for evaluation of the Board and, when deemed appropriate, Board committees and individual directors in accordance with the process disclosed in the Company’s Process for Performance Evaluations.
During the Reporting Period, an evaluation of the Board, its committees and individual directors took place in accordance with the process disclosed in the Company’s Process for Performance Evaluations.
Recommendation: 1.7
The Chief Executive Officer is responsible for evaluating the performance of senior executives in accordance with the process disclosed in the Company’s Process for Performance Evaluations.
During the Reporting Period, the Company had two senior executives; the Chief Executive Officer and the Chief Financial Officer and Company Secretary (who are also Board members).
During the Reporting Period, an evaluation of the Chief Executive Officer and the Chief Financial Officer and Company Secretary were undertaken in accordance with the Company’s Process for Performance Evaluations that is, in conjunction with their reviews as members of the Board. The Chief Executive Officer is evaluated on an ongoing basis by the Board via informal discussions about performance.

14
PRINCIPLE 2 – STRUCTURE THE BOARD TO ADD VALUE Recommendation: 2.1
The Board has not established a separate Nomination Committee. Given the current size and composition of the Board, the Board believes that there would be no efficiencies gained by establishing a separate Nomination Committee. Accordingly, the Board performs the role of the Nomination Committee. Although the Board has not established a separate Nomination Committee, it has adopted a Nomination Committee Charter, which describes the role, composition, functions and responsibilities of the full Board in its capacity as the Nomination Committee, and is disclosed on the Company’s website.
When the Board convenes as the Nomination Committee it carries out those functions which are delegated to it in the Company’s Nomination Committee Charter. Separate meetings of the full Board in its capacity as the Nomination Committee are held, and minutes of those meetings are taken. The Board deals with any conflicts of interest that may occur when convening in the capacity of the Nomination Committee by ensuring that the director with conflicting interests is not party to the relevant discussions.
Details of director attendance at meetings of the full Board, in its capacity as the Nomination Committee, during the Reporting Period, are set out in a table in the Directors’ Report on page 28 of the Company’s 2017 Annual Report.
Recommendation: 2.2
The mix of skills and diversity for which the Board is looking to achieve in membership of the Board is represented by the composition of its current Board. The Board comprises directors who possess the following skills and qualifications: extensive corporate, management and marketing experience in the resources sector, financial and geological. The Board does not wish to increase its size until the Company’s operations warrant it, and considers that this mix of skills is appropriate for the Company’s current circumstances. However, the skills and diversity the Board will be looking to achieve with any future appointments include the skills and qualifications identified above and independence.
Recommendation 2.3
The Board considers the independence of directors having regard to the relationships listed in Box 2.3 of the Principles & Recommendations. The sole independent director of the Company is Malcolm Randall.
The length of service of each director is set out in the Directors’ Report on pages 18 and 19 of the Company’s 2017 Annual Report.
Recommendation: 2.4
The Board does not have a majority of directors who are independent. The Board considers that its composition is appropriate for the Company’s circumstances and includes an appropriate mix of skills and expertise relevant to the Company. The Board gives consideration to the balance of independence on the Board, and will review its composition in response to any changes in the Company’s circumstances.
Recommendation: 2.5
During the Reporting Period, the Company did not have an independent Chair.
The Chair was Mr Gordon Toll. Mr Toll is an Executive Chairman as he is also the Company’s Chief Executive Officer. The Board believes that Mr Toll is the most appropriate person for the position of Chair notwithstanding that he is also the Company’s Chief Executive Officer because of his industry experience and knowledge. The fact that Mr Toll is the Company’s Chief Executive Officer, and also that Mr Toll and his associates hold a substantial shareholding in the Company, are the determining factors that preclude him from being considered independent. The Board believes that Mr Toll makes decisions that are in the best interests of the Company.
Recommendation: 2.6
The Company has an induction program that it uses to when new directors join the Board and when new senior executives are appointed. The goal of the program is to assist new directors to participate fully and actively in Board decision-making at the earliest opportunity and to assist senior executives to participate fully and actively in management decision-making at the earliest opportunity. The Company’s Induction Program is disclosed on the Company’s website.
The full Board in its capacity as the Nomination Committee regularly reviews whether the directors as a group have the skills, knowledge and familiarity with the Company and its operating environment required to fulfil their role on the Board and the Board committees effectively using a Board skills matrix. Where any gaps are identified, the full Board in its capacity as the Nomination Committee considers what training or development should be undertaken to fill those gaps. In particular, the full Board in its capacity as the Nomination Committee ensures that any director who does not have specialist accounting skills or knowledge has a sufficient understanding of accounting matters to fulfil his or her responsibilities in relation to the Company’s financial statements.

15
PRINCIPLE 3 – ACT ETHICALLY AND RESPONSIBLY Recommendation: 3.1
The Company has established a Code of Conduct for its directors, senior executives and employees, a summary of which is disclosed on the Company’s website.
The Company has also adopted a Whistleblower Policy (which is disclosed on the Company’s website) to encourage the reporting of violations (or suspected violations) of the Company’s Code of Conduct and to provide effective protection from victimisation or dismissal to those reporting by implementing systems for confidentiality and report handling.
PRINCIPLE 4 – SAFEGUARD INTEGRITY IN CORPORATE REPORTING Recommendation: 4.1
The Board has established an Audit Committee. The members of the Audit Committee are Malcolm Randall (who is the Chair of the committee and is an independent non-executive director) and Frank DeMarte who is a non-independent executive director. The Audit Committee is not structured in compliance with Recommendation 4.1. The Board is unable to establish an Audit Committee that meets the compositional requirements of Recommendation 4.1. However, the Board considers that a committee comprised of the Company’s sole independent director and the Chief Financial Officer is most appropriate for the Company’s needs given their experience and qualifications. The relevant qualifications and experience of each of the members of the Audit Committee are set out in the Director’s Report on pages 18 and 19 of the Company’s 2017 Annual Report.
The Company has also established a Procedure for the Selection, Appointment and Rotation of its External Auditor. The Board is responsible for the initial appointment of the external auditor and the appointment of a new external auditor when any vacancy arises. Candidates for the position of external auditor must demonstrate complete independence from the Company through the engagement period. The Board may otherwise select an external auditor based on criteria relevant to the Company's business and circumstances. The performance of the external auditor is reviewed on an annual basis by the Board.
Details of director attendance at Audit Committee meetings during the Reporting Period are set out in a table in the Directors’ Report on page 28 of the Company’s 2017 Annual Report.
The Board has adopted an Audit Committee Charter which describes the Audit Committee’s role, composition, functions and responsibilities, and is disclosed on the Company’s website.
Recommendation: 4.2
Before the Board approved the Company financial statements for each of the quarters ended 30 September 2016, 31 December 2016, 31 March 2017 and 30 June 2017, the half year ended 31 December 2016 and the full-year ended 30 June 2017, it received from the Chief Executive Officer and the Chief Financial Officer a declaration that, in their opinion, the financial records of the Company for the relevant financial period have been properly maintained and that the financial statements for the relevant financial period comply with the appropriate accounting standards and give a true and fair view of the financial position and performance of the Company and the consolidated entity and that the opinion has been formed on the basis of a sound system of risk management and internal control which is operating effectively.
Recommendation: 4.3
Under section 250RA of the Corporations Act, the Company’s auditor is required to attend the Company’s annual general meeting at which the audit report is considered, and must arrange to be represented by a person who is a suitably qualified member of the audit team that conducted the audit and is in a position to answer questions about the audit. Each year, the Company writes to the Company’s auditor to inform them of the date of the Company’s annual general meeting. In accordance with section 250S of the Corporations Act, at the Company’s annual general meeting where the Company’s auditor or their representative is at the meeting, the Chair allows a reasonable opportunity for the members as a whole at the meeting to ask the auditor (or its representative) questions relevant to the conduct of the audit; the preparation and content of the auditor’s report; the accounting policies adopted by the Company in relation to the preparation of the financial statements; and the independence of the auditor in relation to the conduct of the audit. The Chair also allows a reasonable opportunity for the auditor (or their representative) to answer written questions submitted to the auditor under section 250PA of the Corporations Act.
A representative of the Company’s auditor, Stanton’s International was available at the Company’s Annual General Meeting held on 30 November 2016 via teleconference to answer any questions from shareholders.

16
PRINCIPLE 5 – MAKE TIMELY AND BALANCED DISCLOSURE Recommendation: 5.1
The Company has established written policies and procedures for complying with its continuous disclosure obligations under the ASX Listing Rules. A summary of the Company’s Policy on Continuous Disclosure and Compliance Procedures are disclosed on the Company’s website.
PRINCIPLE 6 –RESPECT THE RIGHTS OF SECURITY HOLDERS Recommendation: 6.1
The Company provides information about itself and its governance to investors via its website at www.magnetitemines.com. Recommendation: 6.2
The Company has designed and implemented an investor relations program to facilitate effective two-way communication with investors. The program is set out in the Company’s Shareholder Communication and Investor Relations Policy.
Recommendation: 6.3
The Company has in place a Shareholder Communication and Investor Relations Policy which outlines the policies and processes that it has in place to facilitate and encourage participation at meetings of shareholders.
Communication to shareholders is facilitated by the production of the annual report, quarterly reports, public announcements, and ASX releases immediately after their disclosure to the ASX which are all made available on the Company’s website. In addition, all shareholders are encouraged to attend the Annual General Meeting and use the opportunity to ask questions during the meeting and after the Chief Executive Officer’s presentation. The external auditor also attends the shareholders meeting and is available to answer shareholder questions about the conduct of the audit and the preparation and content of the auditor’s report.
PRINCIPLE 6 - RESPECT THE RIGHTS OF SECURITY HOLDERS CONTINUED
Recommendation: 6.4
Shareholders are given the option to receive communications from, and send communications to, the Company and its share registry electronically using an online service provided by the Company’s share registry. When a new shareholder appears on the Company’s share register, the Company’s share registry sends the new shareholder an introductory letter encouraging them to provide their shareholder information online, including their preferences in the way the shareholder would like to receive communications from the Company.
PRINCIPLE 7 – RECOGNISE AND MANAGE RISK Recommendation: 7.1
The Board has not established a separate Risk Committee. Given the current size and composition of the Board, the Board believes that there would be no efficiencies gained by establishing a separate Risk Committee. Accordingly, the Board performs the role of Risk Committee, and has responsibility for overseeing the Company’s risk management framework.
Although the Board has not established a separate Risk Committee, it has adopted a Risk Committee Charter, which describes the full Board in its capacity as a Risk Committee’s role, composition, functions and responsibilities. When the Board convenes as the Risk Committee it will carry out those functions which are delegated to it in the Company’s Risk Committee Charter. Items that are usually required to be discussed by a Risk Committee are discussed at Board meetings when required. The Board will deal with any conflicts of interest that may occur when convening in the capacity of the Risk Committee by ensuring that the director with conflicting interests is not party to the relevant discussions.
Recommendation: 7.2
The full Board in its capacity as the Risk Committee reviews the Company’s risk management framework annually to satisfy itself that it continues to be sound, to determine whether there have been any changes in the material business risks the Company faces and to ensure that the Company is operating within the risk appetite set by the Board. The Board carried out these reviews during the Reporting Period.
Recommendation: 7.3
The Company does not have an internal audit function. To evaluate and continually improve the effectiveness of the Company’s risk management and internal control processes, the Board relies on ongoing reporting and discussion of the management of material business risks as outlined in the Company’s Risk Management Policy.
17
PRINCIPLE 7 - RECOGNISE AND MANAGE RISK CONTINUED
Recommendation: 7.4
As the Company is not in production or have any major operations, the Company has not identified any material exposure to any environmental and/or social sustainability risks. However, the Company does have a material exposure to the following economic risks:
Economic risk type Mitigation strategies Market risk – movements in commodity prices
The group manages its exposure to market risk by monitoring market conditions and making decisions based on industry experience.
Future capital – cost and availability of funds to meet the Company’s business needs
The Company monitors its cash reserves and manages its liquidity risk by monitoring its cash reserves and forecast spending. Management is cognisant of the future demands for liquid finance requirements to finance the group’s current and future operations.
PRINCIPLE 8 – REMUNERATE FAIRLY AND RESPONSIBLY Recommendation: 8.1
The Board has established a Remuneration Committee. The members of the Remuneration Committee are Malcolm Randall (who is the Chair of the committee and is an independent non-executive director) and Frank DeMarte who is a non-independent executive director. The Remuneration Committee is not structured in compliance with Recommendation 8.1 as it comprises of only two members, and does not comprise a majority of independent directors. The Board is unable to establish a Remuneration Committee that meets the compositional requirements of Recommendation 8.1. However, the Board considers that a committee comprised of the Company’s sole independent director and Mr DeMarte is appropriate.
Details of director attendance at meetings of the Remuneration Committee held during the Reporting Period are set out in a table in the Directors’ Report on page 28 of the Company’s 2017 Annual Report.
The Board has adopted a Remuneration Committee Charter which describes the role, composition, functions and responsibilities of the Remuneration Committee, a copy of which is disclosed on the Company’s website.
PRINCIPLE 8 – REMUNERATE FAIRLY AND RESPONSIBLY CONTINUED Recommendation: 8.2
Details of remuneration, including the Company’s policy on remuneration and “clawback policy” regarding the lapsing of performance based remuneration in the event of fraudulent serious misconduct and the clawback of the performance-based remuneration in the event of a material misstatement in the company’s financial statement are contained in the “Remuneration Report” which forms part of the Directors’ Report and commences at page 21 of the Company’s 2017 Annual Report.
The Company has established an Option Incentive Plan, which directors and executive are eligible to participate in.
The directors consider that the grant of options to executive directors encourages the directors to have a greater involvement in the achievement of the Company’s objectives and to provide an incentive to strive to that end by participating in the future growth and prosperity of the Company through share ownership. Under the Company’s current circumstances, the granting of options is an incentive intended to each executive director, which is a cost effective and efficient means for the Company to provide a reward and an incentive, as opposed to alternative forms of incentive, such as the payment of additional cash compensation.
Under the Company’s current circumstances, the directors consider that the issue of options to non-executive directors represents a cost-effective way for the Company to remunerate those directors, as opposed to cash remuneration and it is designed to attract and retain suitably qualified non-executive directors, and to align their interests with the interests of other security holders.
The Option Incentive Plan includes provisions that if the Board becomes aware of a material misstatement in the Company’s financial statements or some other event has occurred which, as a result, means that the vesting conditions in respect of certain vested options were not, or should not have been determined to have been, satisfied, then the holder will cease to be entitled to those vested options (Affected Options) and the Board may take various actions, including: cancelling the relevant Affected Options for no consideration; requiring that the holder pay to the Company the after tax value of the Affected Options which have been converted into Shares or adjusting fixed remuneration, incentives or participation in the option incentive plan of a relevant holder in the current year or any future year to take account of the after tax value of the Affected Options.
Recommendation: 8.3
The Company’s Securities Trading Policy outlines the Company’s policy on prohibiting entry into transactions or arrangements which operate to limit the economic risk of participating in unvested entitlements under any equity based remuneration schemes.
18
Your directors of Magnetite Mines Limited submit their report together with the financial statements of the consolidated entity consisting of the Company and the entities it controlled at the end of, or during, the year ended 30 June 2017.
INFORMATION ON DIRECTORS The following persons were directors of the Company during the financial year and until the date of this report. Directors were in office since the start of the financial year to the date of this report unless otherwise stated.
GORDON L TOLL BE (Hons) Mining, MSc Business Executive Chairman and CEO Experience and expertise
Mr Toll is a mining engineer, entrepreneur, explorer and developer of large mining operations. Mr Toll has an extensive range of experience including acquisitions and new business, company and business turnaround, general management of companies at all levels and public company leadership including senior commercial and technical executive positions with major international resource companies including BHP Billiton, Rio Tinto, Atlantic Richfield, Texas Gulf, Ivanhoe Mines and the founding Chairman of Fortescue Metals Group. Mr Toll also led the reconstruction of the Savage River magnetite and pellet operations in Tasmania in the late 1990’s. Savage River has a 47 year history of successful magnetite production, which continues today. During his career his major commodity experience includes iron ore, coal, borates and other no-metallic industrial minerals, copper, gold, agricultural and heavy chemicals, ethanol, methanol and oil and gas.
Mr Toll was first appointed to the board on 23 September 2014. Current directorships of listed companies Director of Brazil Iron Limited Director of Satimola Limited Former directorships of listed companies in last 3 years None. Special responsibilities Chairman of the board (from 28 November 2014) Chairman of the nomination committee (from 28 November 2014).
FRANK DEMARTE BBus, FGIA, FCIS, FAICD Executive director Experience and expertise
Mr DeMarte has over 33 years of experience in the mining and exploration industry in Western Australia. Mr DeMarte has held executive positions with a number of listed mining and exploration companies and is currently an Executive Director of the Company. Mr DeMarte is experienced in areas of company secretarial practice, management accounting and corporate and financial management. Mr DeMarte holds a bachelor of business majoring in accounting and is a fellow of the Governance Institute of Australia, a fellow of the Australian Institute of Chartered Secretaries and Administrators and a fellow of the Australian Institute of Company Directors. Mr DeMarte was first appointed to the board on 23 February 2004.
Current directorships of listed companies Director of Thundelarra Limited (from March 2001) Former directorships of listed companies in last 3 years None. Special responsibilities Member of the nomination committee (from February 2004) Member of the remuneration committee (from February 2004) Member of the audit committee (from April 2012)
PETER J SCHUBERT Executive director – Investor Relations and Capital Development Experience and expertise
Mr Schubert is a professional investor with business development and entrepreneurial skills teamed with over 21 years of direct experience in international and domestic markets. Mr Schubert has strong established ties to the investment community, particularly in relation to the Australian resource sector.
During his career Mr Schubert has developed a range of businesses across various sectors with emphasis on support for the establishment of various Australian resource companies.
Mr Schubert’s experience includes manufacturing, investor relations, advertising, systems development, and capital markets.
Mr Schubert was first appointed to the board on 17 December 2015 as non-executive director and appointed as executive director on 9 December 2016. Current directorships of listed companies None.
Former directorships of listed companies in last 3 years None.
Special responsibilities Member of the nomination committee (from 17 December 2015)
19
INFORMATION ON DIRECTORS CONTINUED
MALCOLM R J RANDALL B.Applied Chem, FAICD Non-Executive director Experience and expertise
Mr Randall holds a Bachelor of Applied Chemistry Degree and is a fellow of the Australian Institute of Company Directors. He has extensive experience in corporate management and marketing in the resource sector, including more than 25 years with the Rio Tinto group of companies. His experience extends over a broad range of commodities including iron ore, diamonds, base metals, coal, uranium, and industrial minerals both in Australia and internationally. Mr Randall was first appointed to the board on 4 October 2006. Current directorships of listed companies Director of Kalium Lakes Limited (from 2016) Director of Summit Resources Limited (from 2007) Director of Thundelarra Limited (from 2003) Director of Spitfire Oil Ltd (from 2007) Director of Argosy Minerals Limited (from 2017) Former directorships of listed companies in last 3 years Director of Iron Ore Holdings Ltd (from 2003 to November 2014) Director of MZI Resources Limited (from 2006 to 2016) Special responsibilities Chairman of the audit committee (from August 2009) Member of the nomination committee (from October 2006) Chairman of the remuneration committee (from October 2011) Member of the remuneration committee (from October 2006)
COMPANY SECRETARY
FRANK DEMARTE BBus, FGIA, FCIS, FAICD The Company Secretary is Frank DeMarte. Mr DeMarte has held executive positions with a number of listed mining and exploration companies and is currently an executive director and chief financial officer of the Company. Mr DeMarte is experienced in areas of secretarial practice, management accounting and corporate and financial management. Mr DeMarte holds a bachelor of business majoring in accounting and is a fellow of the Governance Institute of Australia, a fellow of the Australian Institute of Chartered Secretaries and Administrators and a fellow of the Institute of Company Directors. Mr DeMarte was re-appointed the Company Secretary on 22 August 2013.
20
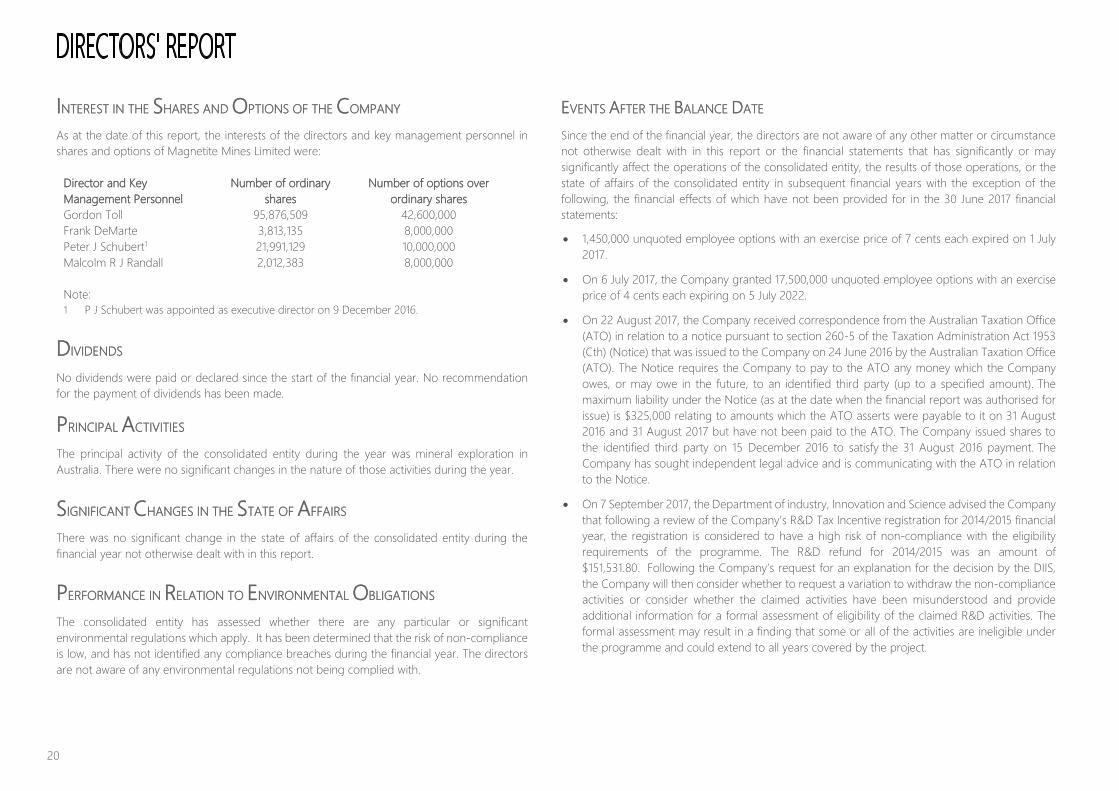
INTEREST IN THE SHARES AND OPTIONS OF THE COMPANY As at the date of this report, the interests of the directors and key management personnel in shares and options of Magnetite Mines Limited were:
Director and Key Management Personnel
Number of ordinary shares
Number of options over ordinary shares
Gordon Toll 95,876,509 42,600,000 Frank DeMarte 3,813,135 8,000,000 Peter J Schubert1 21,991,129 10,000,000 Malcolm R J Randall 2,012,383 8,000,000 Note: 1 P J Schubert was appointed as executive director on 9 December 2016.
DIVIDENDS No dividends were paid or declared since the start of the financial year. No recommendation for the payment of dividends has been made.
PRINCIPAL ACTIVITIES The principal activity of the consolidated entity during the year was mineral exploration in Australia. There were no significant changes in the nature of those activities during the year.
SIGNIFICANT CHANGES IN THE STATE OF AFFAIRS There was no significant change in the state of affairs of the consolidated entity during the financial year not otherwise dealt with in this report.
PERFORMANCE IN RELATION TO ENVIRONMENTAL OBLIGATIONS The consolidated entity has assessed whether there are any particular or significant environmental regulations which apply. It has been determined that the risk of non-compliance is low, and has not identified any compliance breaches during the financial year. The directors are not aware of any environmental regulations not being complied with.
EVENTS AFTER THE BALANCE DATE Since the end of the financial year, the directors are not aware of any other matter or circumstance not otherwise dealt with in this report or the financial statements that has significantly or may significantly affect the operations of the consolidated entity, the results of those operations, or the state of affairs of the consolidated entity in subsequent financial years with the exception of the following, the financial effects of which have not been provided for in the 30 June 2017 financial statements:
• 1,450,000 unquoted employee options with an exercise price of 7 cents each expired on 1 July 2017.
• On 6 July 2017, the Company granted 17,500,000 unquoted employee options with an exercise price of 4 cents each expiring on 5 July 2022.
• On 22 August 2017, the Company received correspondence from the Australian Taxation Office (ATO) in relation to a notice pursuant to section 260-5 of the Taxation Administration Act 1953 (Cth) (Notice) that was issued to the Company on 24 June 2016 by the Australian Taxation Office (ATO). The Notice requires the Company to pay to the ATO any money which the Company owes, or may owe in the future, to an identified third party (up to a specified amount). The maximum liability under the Notice (as at the date when the financial report was authorised for issue) is $325,000 relating to amounts which the ATO asserts were payable to it on 31 August 2016 and 31 August 2017 but have not been paid to the ATO. The Company issued shares to the identified third party on 15 December 2016 to satisfy the 31 August 2016 payment. The Company has sought independent legal advice and is communicating with the ATO in relation to the Notice.
• On 7 September 2017, the Department of industry, Innovation and Science advised the Company that following a review of the Company’s R&D Tax Incentive registration for 2014/2015 financial year, the registration is considered to have a high risk of non-compliance with the eligibility requirements of the programme. The R&D refund for 2014/2015 was an amount of $151,531.80. Following the Company’s request for an explanation for the decision by the DIIS, the Company will then consider whether to request a variation to withdraw the non-compliance activities or consider whether the claimed activities have been misunderstood and provide additional information for a formal assessment of eligibility of the claimed R&D activities. The formal assessment may result in a finding that some or all of the activities are ineligible under the programme and could extend to all years covered by the project.
21
SHARE OPTIONS Shares under option
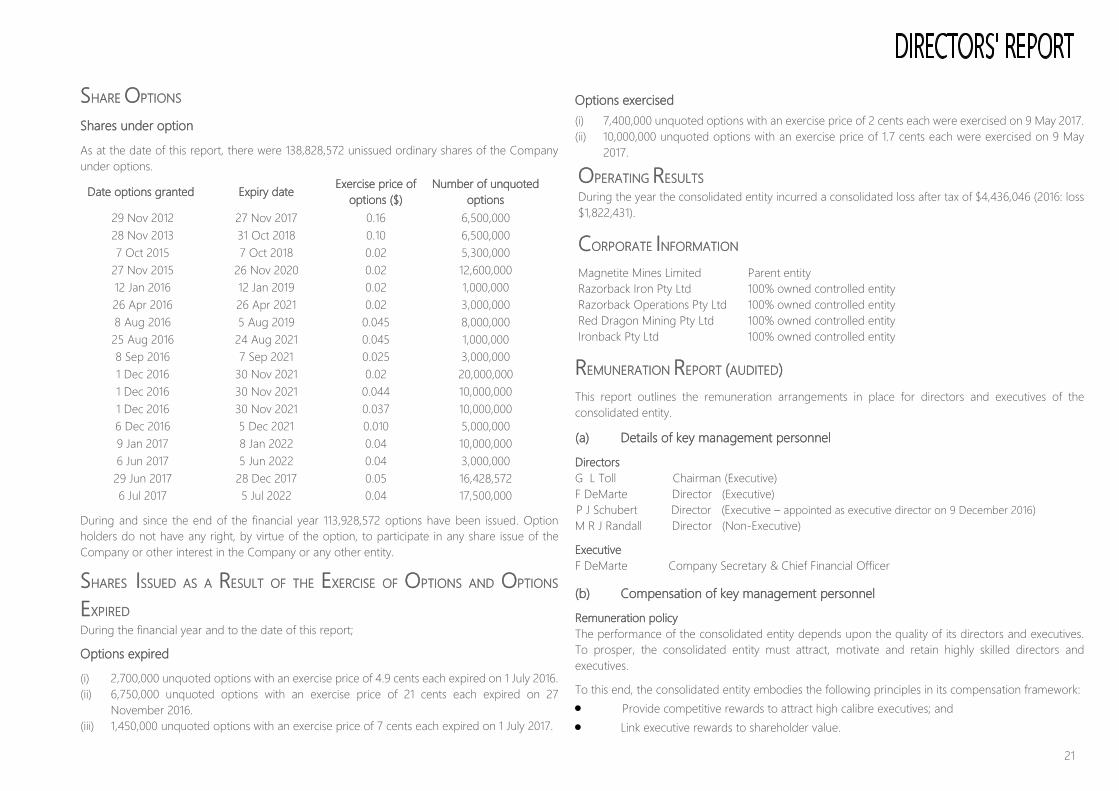
As at the date of this report, there were 138,828,572 unissued ordinary shares of the Company under options.
Date options granted Expiry date Exercise price of options ($)
Number of unquoted options
29 Nov 2012 27 Nov 2017 0.16 6,500,000 28 Nov 2013 31 Oct 2018 0.10 6,500,000 7 Oct 2015 7 Oct 2018 0.02 5,300,000
27 Nov 2015 26 Nov 2020 0.02 12,600,000 12 Jan 2016 12 Jan 2019 0.02 1,000,000 26 Apr 2016 26 Apr 2021 0.02 3,000,000 8 Aug 2016 5 Aug 2019 0.045 8,000,000 25 Aug 2016 24 Aug 2021 0.045 1,000,000 8 Sep 2016 7 Sep 2021 0.025 3,000,000 1 Dec 2016 30 Nov 2021 0.02 20,000,000 1 Dec 2016 30 Nov 2021 0.044 10,000,000 1 Dec 2016 30 Nov 2021 0.037 10,000,000 6 Dec 2016 5 Dec 2021 0.010 5,000,000 9 Jan 2017 8 Jan 2022 0.04 10,000,000 6 Jun 2017 5 Jun 2022 0.04 3,000,000 29 Jun 2017 28 Dec 2017 0.05 16,428,572 6 Jul 2017 5 Jul 2022 0.04 17,500,000
During and since the end of the financial year 113,928,572 options have been issued. Option holders do not have any right, by virtue of the option, to participate in any share issue of the Company or other interest in the Company or any other entity.
SHARES ISSUED AS A RESULT OF THE EXERCISE OF OPTIONS AND OPTIONS
EXPIRED During the financial year and to the date of this report;
Options expired
(i) 2,700,000 unquoted options with an exercise price of 4.9 cents each expired on 1 July 2016. (ii) 6,750,000 unquoted options with an exercise price of 21 cents each expired on 27
November 2016. (iii) 1,450,000 unquoted options with an exercise price of 7 cents each expired on 1 July 2017.
Options exercised (i) 7,400,000 unquoted options with an exercise price of 2 cents each were exercised on 9 May 2017. (ii) 10,000,000 unquoted options with an exercise price of 1.7 cents each were exercised on 9 May
2017.
OPERATING RESULTS During the year the consolidated entity incurred a consolidated loss after tax of $4,436,046 (2016: loss $1,822,431).
CORPORATE INFORMATION Magnetite Mines Limited Parent entity Razorback Iron Pty Ltd 100% owned controlled entity Razorback Operations Pty Ltd 100% owned controlled entity Red Dragon Mining Pty Ltd 100% owned controlled entity Ironback Pty Ltd 100% owned controlled entity
REMUNERATION REPORT (AUDITED) This report outlines the remuneration arrangements in place for directors and executives of the consolidated entity.
(a) Details of key management personnel
Directors G L Toll Chairman (Executive) F DeMarte Director (Executive) P J Schubert Director (Executive – appointed as executive director on 9 December 2016) M R J Randall Director (Non-Executive)
Executive F DeMarte Company Secretary & Chief Financial Officer
(b) Compensation of key management personnel
Remuneration policy The performance of the consolidated entity depends upon the quality of its directors and executives. To prosper, the consolidated entity must attract, motivate and retain highly skilled directors and executives.
To this end, the consolidated entity embodies the following principles in its compensation framework: • Provide competitive rewards to attract high calibre executives; and • Link executive rewards to shareholder value.

22
REMUNERATION REPORT (AUDITED) CONTINUED Remuneration committee The remuneration committee comprises majority of independent directors of the consolidated entity and is responsible for determining and reviewing compensation arrangements for the directors and all other key management personnel. The remuneration committee assesses the appropriateness of the nature and amount of compensation of key management personnel on an annual basis by reference to relevant employment market conditions with the overall objective of ensuring maximum stakeholder benefit from the retention of a high quality board and executive team. Remuneration structure In accordance with best practice corporate governance, the structure of non-executive director and executive compensation is separate and distinct. Non-executive director compensation Objective The board seeks to set aggregate compensation at a level that provides the consolidated entity with the ability to attract and retain directors of the highest calibre, whilst incurring a cost that is acceptable to shareholders. Structure The constitution and the ASX listing rules specify that the aggregate compensation of non-executive directors shall be determined from time to time by a general meeting. An amount not exceeding the amount determined is then divided between the directors as agreed. The latest determination was at the annual general meeting held on 26 November 2009 when shareholders approved an aggregate compensation of $400,000 per year.
The amount of aggregate compensation sought to be approved by shareholders and the manner in which it is apportioned amongst directors is reviewed annually. The board considers advice from external consultants as well as the fees paid to non-
executive directors of comparable companies when undertaking the annual review process. Each director receives a fee for being a director of the consolidated entity. An additional fee may also be paid for each board committee on which a director sits. The payment of additional fees for serving on a committee recognises the additional time commitments required by directors who serve on one or more sub committees. Non-executive directors have long been encouraged by the board to hold shares in the Company (purchased by the director on market). It is considered good governance for directors to have a stake in the Company on whose board they sit. The compensation of non-executive directors for the year ended 30 June 2017 is detailed as per the disclosures on page 23.
Executive compensation
Objective The entity aims to reward executives with a level and mix of compensation commensurate with their position and responsibilities within the entity so as to: • reward executives for Company, business unit and
individual performance against targets set by to appropriate benchmarks;
• align the interests of executives with those of shareholders;
• link rewards with the strategic goals and performance of the Company; and
• ensure total compensation is competitive by market standards
Structure In determining the level and make-up of executive remuneration, the remuneration committee will review individual performance, relevant comparative compensation in
the market and internally and, where appropriate, external advice on policies and practices. As at the date of this report, Mr Peter Schubert has an employment contract dated 10 January 2017 (refer page 23).
Fixed compensation
Objective Fixed compensation is reviewed annually by the remuneration committee. The process consists of a review of Companywide, business unit and individual performance, relevant comparative compensation in the market and internally and, where appropriate, external advice on policies and practices. Structure Executives are given the opportunity to receive their fixed remuneration in a variety of forms including cash and fringe benefits such as motor vehicles and expense payment plans. It is intended that the manner of payment chosen will be optimal for the recipient without creating undue cost for the Company.
Other compensation
Notwithstanding guideline 8.2 of the ASX Corporate Governance Council Principles of Good Corporate Governance and Best Practice Recommendations which provides that non-executive directors should not receive options, the directors consider that the grant of the options is designed to encourage the directors to have a greater involvement in the achievement of the Company’s objectives and to provide an incentive to strive to that end by participating in the future growth and prosperity of the Company through share ownership. Under the Company’s current circumstances, the granting of options is an incentive to each of the directors, which is a cost effective and efficient reward for the Company, as opposed to alternative forms of incentive, such as the payment of additional cash compensation to the directors. The Company has not used the services of a remuneration consultancy company during the year.
23
REMUNERATION REPORT (AUDITED) CONTINUED
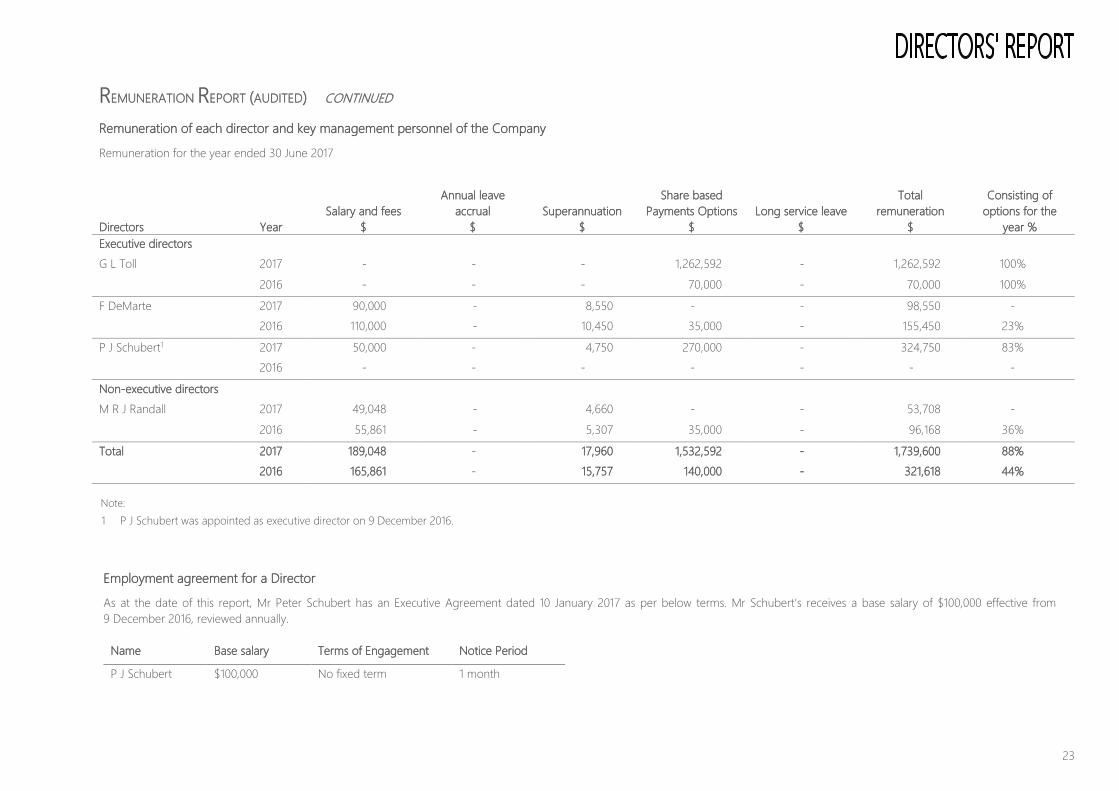
Remuneration of each director and key management personnel of the Company
Remuneration for the year ended 30 June 2017
Directors Year
Salary and fees $
Annual leave accrual
$ Superannuation
$
Share based Payments Options
$ Long service leave
$
Total remuneration
$
Consisting of options for the
year % Executive directors G L Toll 2017 - - - 1,262,592 - 1,262,592 100% 2016 - - - 70,000 - 70,000 100%
F DeMarte 2017 90,000 - 8,550 - - 98,550 - 2016 110,000 - 10,450 35,000 - 155,450 23%
P J Schubert1 2017 50,000 - 4,750 270,000 - 324,750 83% 2016 - - - - - - -
Non-executive directors M R J Randall 2017 49,048 - 4,660 - - 53,708 - 2016 55,861 - 5,307 35,000 - 96,168 36%
Total 2017 189,048 - 17,960 1,532,592 - 1,739,600 88% 2016 165,861 - 15,757 140,000 - 321,618 44%
Note: 1 P J Schubert was appointed as executive director on 9 December 2016.
Employment agreement for a Director
As at the date of this report, Mr Peter Schubert has an Executive Agreement dated 10 January 2017 as per below terms. Mr Schubert’s receives a base salary of $100,000 effective from 9 December 2016, reviewed annually.
Name Base salary Terms of Engagement Notice Period
P J Schubert $100,000 No fixed term 1 month

24
REMUNERATION REPORT (AUDITED) CONTINUED
Share-based compensation options
Compensation options: Granted and vested during the year ended 30 June 2017. Vested & granted Terms & conditions for each grant
30 June 2017 Number of options Grant date
Fair Value per option at grant
date $
Exercise price per option
$ Expiry date First exercise
date/vesting date Last exercise date % vested and exercisable at 30 June 2017
Directors G L Toll 10,000,000 1 Dec 2016 0.027 0.02 30 Nov 2021 1 Dec 2016 30 Nov 2021 100% 10,000,000 1 Dec 2016 0.027 0.017 30 Nov 2021 1 Dec 2016 30 Nov 2021 100% 10,000,000 1 Dec 2016 0.024 0.044 30 Nov 2021 1 Dec 2016 30 Nov 2021 100% 10,000,000 1 Dec 2016 0.024 0.037 30 Nov 2021 1 Dec 2016 30 Nov 2021 100% 10,000,000 9 Jan 2017 0.024 0.04 8 Jan 2022 9 Jan 2017 8 Jan 2022 100% F DeMarte - - - - - - - - P J Schubert1 10,000,000 1 Dec 2016 0.027 0.02 30 Nov 2021 1 Dec 2016 30 Nov 2021 100% M R J Randall - - - - - - - - Total 60,000,000 - - - - - - - Note: 1 P J Schubert was appointed as executive director on 9 December 2016.
Options granted as part of remuneration
Details of options over ordinary shares in the Company provided as remuneration to each director of the Company and each of the key management personnel are set out below. Each option when exercised is convertible into one ordinary share in the Company.
Vesting conditions
Options issued to directors and employees during the current financial year vest on grant date. For details on the valuation of the options, including models and assumptions used, please refer to note 25. There were no alterations to the terms and conditions of options granted as remuneration since their grant date.

25
REMUNERATION REPORT (AUDITED) CONTINUED
Equity instruments – audited
Analysis of options and rights over equity instruments granted as compensation. Details of vesting profiles of the options granted as remuneration to each director and key management person of the Group outstanding as at 30 June 2017 are detailed below.
Number of options granted
Grant date of options
Exercise Price
of Options $
Fair value of options on grant date
$
Expiry date
Executive directors
G L Toll 2,600,000 27/11/2015 0.02 70,000 26/11/2020
10,000,000 1 Dec 2016 0.02 270,000 30 Nov 2021
10,000,000 1 Dec 2016 0.044 240,000 30 Nov 2021
10,000,000 1 Dec 2016 0.037 240,000 30 Nov 2021
10,000,000 9 Jan 2017 0.04 242,592 8 Jan 2022
F DeMarte 1,500,000 29/11/2012 0.16 37,995 27/11/2017
1,500,000 28/11/2013 0.10 34,500 31/10/2018
5,000,000 27/11/2015 0.02 35,000 26/11/2020
P J Schubert 10,000,000 1 Dec 2016 0.02 270,000 30 Nov 2021
Number of
options granted
Grant date of
options
Exercise Price of Options
$
Fair value of options on grant date
$
Expiry date
Non - executive directors
M R J Randall 1,500,000 29/11/2012 0.16 37,995 27/11/2017
1,500,000 28/11/2013 0.10 34,500 31/10/2018
5,000,000 27/11/2015 0.02 35,000 26/11/2020
Options are fully vested on date of grant.

26
REMUNERATION REPORT (AUDITED) CONTINUED
Analysis of movements in options
The movement during the reporting period, by value, of options over ordinary shares in the Company held by each director and key management person is detailed below.
Directors and Executive
Granted in year $(a)
Value of options exercised in year
$(b)
Directors G L Toll 1,262,592 395,400 F DeMarte - - M R J Randall - - P J Schubert1 270,000 -
Note: 1 P J Schubert was appointed as executive director on 9 December 2016.
(a) The value of options granted in the year is the fair value of the options calculated at
grant date using the Black-Scholes option-pricing model. The total value of the options granted is included in the table above.
(b) The value of options exercised during the year is calculated as the market price of shares
of the Company as at close of trading on the date the options were exercised after deducting the price paid to exercise the option.
DIRECTORS AND EXECUTIVE DISCLOSURE Shareholdings of directors and key management personnel
The number of shares in the Company held during the financial year by each director and other key management personnel of the Company, including their personally related parties, are set out below.
30 June 2017 Balance 01-Jul-16
Ord
Granted as remuneration
Ord
On exercise of options
Ord
Net change other Ord
Balance 30-Jun- 17
Ord Directors G L Toll 78,476,509 - 17,400,000 - 95,876,509 F DeMarte 3,813,135 - - - 3,813,135 M R J Randall 2,012,383 - - - 2,012,383 P J Schubert1 20,991,129 - - - 20,991,129 Total 105,293,156 - 17,400,000 - 122,693,156 Note: 1 P J Schubert was appointed as executive director on 9 December 2016.
30 June 2016 Balance 01-Jul-15
Ord
Granted as remuneration
Ord
On exercise of options
Ord
Net change other Ord
Balance 30-Jun- 16
Ord Directors G L Toll 78,476,509 - - - 78,476,509 F DeMarte 3,813,135 - - - 3,813,135 M R J Randall 2,012,383 - - - 2,012,383 P J Schubert1 - - - 20,991,129 20,991,129 Total 84,302,027 - - 20,991,129 105,293,156
Note: 1 P J Schubert was appointed as non-executive director on 17 December 2015.
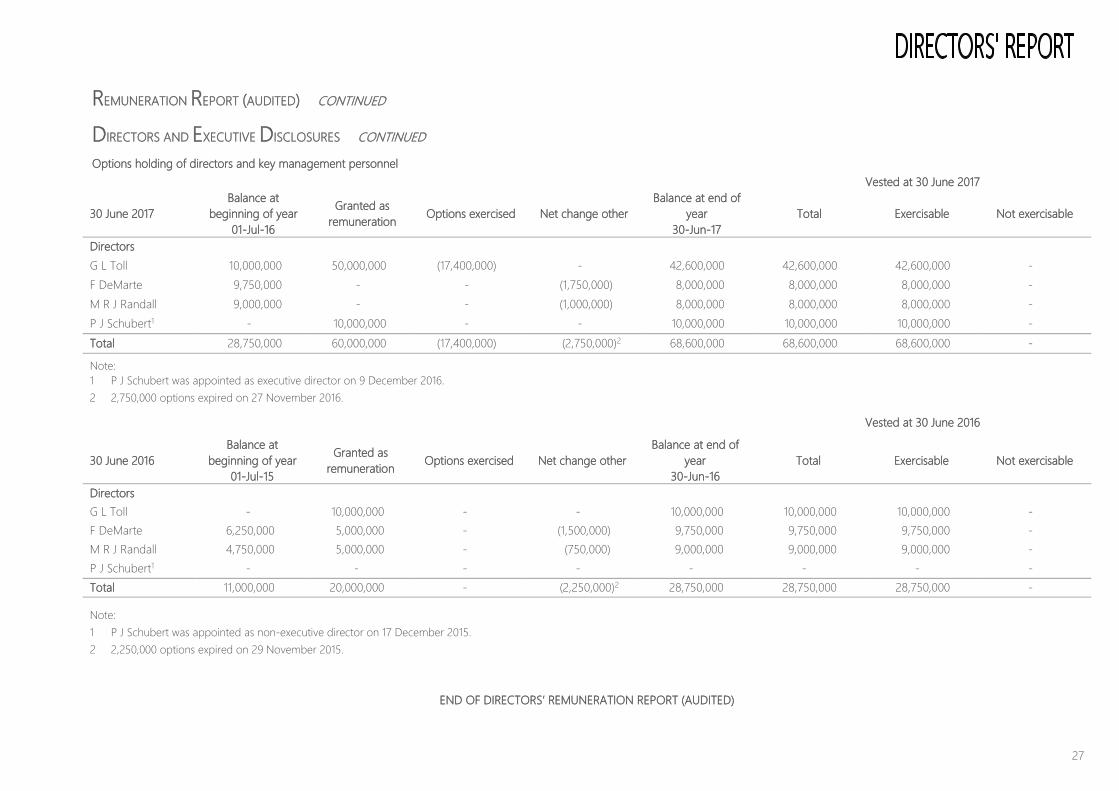
27
REMUNERATION REPORT (AUDITED) CONTINUED DIRECTORS AND EXECUTIVE DISCLOSURES CONTINUED Options holding of directors and key management personnel
Vested at 30 June 2017
30 June 2017 Balance at
beginning of year 01-Jul-16
Granted as remuneration Options exercised Net change other
Balance at end of year
30-Jun-17 Total Exercisable Not exercisable
Directors G L Toll 10,000,000 50,000,000 (17,400,000) - 42,600,000 42,600,000 42,600,000 - F DeMarte 9,750,000 - - (1,750,000) 8,000,000 8,000,000 8,000,000 - M R J Randall 9,000,000 - - (1,000,000) 8,000,000 8,000,000 8,000,000 - P J Schubert1 - 10,000,000 - - 10,000,000 10,000,000 10,000,000 - Total 28,750,000 60,000,000 (17,400,000) (2,750,000)2 68,600,000 68,600,000 68,600,000 -
Note: 1 P J Schubert was appointed as executive director on 9 December 2016.
2 2,750,000 options expired on 27 November 2016.
Vested at 30 June 2016
30 June 2016 Balance at
beginning of year 01-Jul-15
Granted as remuneration Options exercised Net change other
Balance at end of year
30-Jun-16 Total Exercisable Not exercisable
Directors G L Toll - 10,000,000 - - 10,000,000 10,000,000 10,000,000 - F DeMarte 6,250,000 5,000,000 - (1,500,000) 9,750,000 9,750,000 9,750,000 - M R J Randall 4,750,000 5,000,000 - (750,000) 9,000,000 9,000,000 9,000,000 - P J Schubert1 - - - - - - - - Total 11,000,000 20,000,000 - (2,250,000)2 28,750,000 28,750,000 28,750,000 -
Note: 1 P J Schubert was appointed as non-executive director on 17 December 2015. 2 2,250,000 options expired on 29 November 2015.
END OF DIRECTORS’ REMUNERATION REPORT (AUDITED)
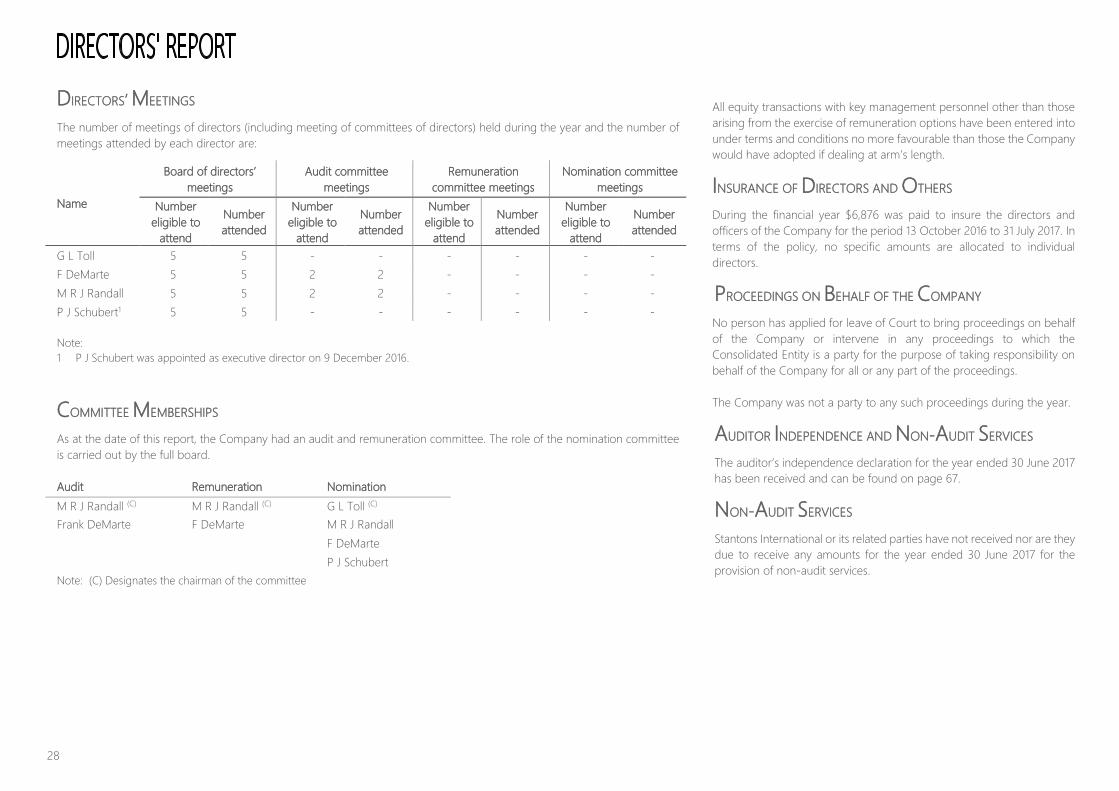
28
DIRECTORS’ MEETINGS The number of meetings of directors (including meeting of committees of directors) held during the year and the number of meetings attended by each director are:
All equity transactions with key management personnel other than those arising from the exercise of remuneration options have been entered into under terms and conditions no more favourable than those the Company would have adopted if dealing at arm’s length.
INSURANCE OF DIRECTORS AND OTHERS During the financial year $6,876 was paid to insure the directors and officers of the Company for the period 13 October 2016 to 31 July 2017. In terms of the policy, no specific amounts are allocated to individual directors.
PROCEEDINGS ON BEHALF OF THE COMPANY No person has applied for leave of Court to bring proceedings on behalf of the Company or intervene in any proceedings to which the Consolidated Entity is a party for the purpose of taking responsibility on behalf of the Company for all or any part of the proceedings. The Company was not a party to any such proceedings during the year.
AUDITOR INDEPENDENCE AND NON-AUDIT SERVICES The auditor’s independence declaration for the year ended 30 June 2017 has been received and can be found on page 67.
NON-AUDIT SERVICES Stantons International or its related parties have not received nor are they due to receive any amounts for the year ended 30 June 2017 for the provision of non-audit services.
Name
Board of directors’ meetings
Audit committee meetings
Remuneration committee meetings
Nomination committee meetings
Number eligible to
attend
Number attended
Number eligible to
attend
Number attended
Number eligible to
attend
Number attended
Number eligible to
attend
Number attended
G L Toll 5 5 - - - - - - F DeMarte 5 5 2 2 - - - - M R J Randall 5 5 2 2 - - - - P J Schubert1 5 5 - - - - - - Note: 1 P J Schubert was appointed as executive director on 9 December 2016.
COMMITTEE MEMBERSHIPS As at the date of this report, the Company had an audit and remuneration committee. The role of the nomination committee is carried out by the full board. Audit Remuneration Nomination M R J Randall (C) M R J Randall (C) G L Toll (C) Frank DeMarte F DeMarte M R J Randall F DeMarte P J Schubert Note: (C) Designates the chairman of the committee

29
OPERATIONS AND FINANCIAL REVIEW
Operations
Magnetite Mines Limited is a mineral exploration company, transitioning to mine developer. The Group has continued to progress studies and search for a strategic partner to progress the Razorback Iron Project to the next phase. The Group is also continuing its search for other projects. In this tough economic climate, the Group has had to rationalise both project and corporate expenditure including but not limited to staff redundancies. While every effort will be made to retain staff going forward, additional redundancies may be necessary to ensure the survival of the Company.
Result for the year
Operations in the financial year ended 30 June 2017 have resulted in a loss of $4.44 million compared to last year’s loss of $1.82 million.
Signed in accordance with a resolution of the directors.
Frank DeMarte DIRECTOR

30
FOR THE YEAR ENDED 30 JUNE 2017 Notes 2017
$ 2016
$ Other income 4(a) 338,995 36,794 Exploration expenditure 13 (26,652) (24,556) Gain on disposal of investment 4(b) 6,415 50,318 Employee benefits (395,488) (300,442) Share based payment expense 17(d) (2,070,479) (249,807) Professional fees (1,091,366) (524,980) Depreciation and amortisation (39,252) (43,835) General and administrative costs (436,696) (548,308) (Diminution)/increase in value of investment 9(a) - (163,796) Other expenses (159,891) 10,492 Interest expense (175,000) (145,833) Share of net loss of associate 9(a) - (42,760) Loss on settlement of loan to Aldershot 4(c) - (30,086) Reversal of non-recovery of loan to associate - 139,201 Non-recovery of loan to related party (397,161) - (Loss)/profit before finance costs (4,446,575) (1,837,598) Finance income 12,387 17,932 Finance costs (1,858) (2,765) Operating (loss)/profit before income tax (4,436,046) (1,822,431) Income tax expense 5(a) - - (Loss)/profit from continuing operations after income tax (4,436,046) (1,822,431)
(Loss)/profit for the year after tax (4,436,046) (1,822,431)
CONTINUED Notes 2017
$ 2016
$ Other comprehensive income Items that may be reclassified subsequently to profit or loss:
Foreign currency translation of associate transferred to profit or loss 17(d) - (58,880) Share of translation reserve of associate 17(d) - - Share of fair value reserve of associate 17(d) - - Share based payments reserve of associate transferred to profit or loss 17(d) - (16,058) Items that will not be reclassified to profit or loss - - Total comprehensive (loss)/income for the year, net of tax (4,436,046) (1,897,369)
(Loss)/profit for the year attributable to members of the Company (4,436,046) (1,822,431)
Total comprehensive (loss)/income for the year, net of tax, attributable to the members of the Company (4,436,046) (1,897,369)
Earnings per share from continuing operations attributable to the ordinary equity holders of the Company
Basic (loss)/earnings per share (cents per share) 6(a) (0.97) (0.47) Diluted (loss)/earnings per share (cents per share) 6(c) (0.97) (0.47) The above consolidated statement of profit or loss and other comprehensive income is to be read in conjunction with the accompanying notes.

AS AT 30 JUNE 2017
31
Notes 2017 $
2016 $
ASSETS Current assets Cash and cash equivalents 7(a) 2,199,645 1,164,415 Trade and other receivables 8(a) 319,880 216,783 Investment held for sale 9(a) - 60,000 Other financial assets 10 - 33,177
Total current assets 2,519,525 1,474,375 Non-current assets Trade and other receivables 8(b) 42,988 63,493 Plant and equipment 12 80,912 98,176 Exploration expenditure 13 8,712,362 8,315,729 Intangible assets 14 5,570 10,548
Total non-current assets 8,841,832 8,487,946 TOTAL ASSETS 11,361,357 9,962,321 LIABILITIES Current liabilities Trade and other payables 15 818,782 476,971 Provisions 16 74,846 34,243
Total current liabilities 893,628 511,214
Non-current liabilities Convertible loan note liability 27 2,500,000 2,500,000
Total Non-current liabilities 2,500,000 2,500,000
TOTAL LIABILITIES 3,393,628 3,011,214
CONTINUED Notes 2017
$ 2016
$
NET ASSETS 7,967,729 6,951,107 EQUITY Contributed equity 17(a) 49,631,512 46,249,323 Reserves 17(d) 9,970,355 7,899,876 Accumulated losses (51,634,138) (47,198,092) TOTAL EQUITY 7,967,729 6,951,107 The above consolidated statement of financial position is to be read in conjunction with the accompanying notes.

32
FOR YEAR ENDED 30 JUNE 2017
Notes Contributed Equity Reserves Accumulated Losses Total
$ $ $ $
At 1 July 2016 46,249,323 7,899,876 (47,198,092) 6,951,107 Total Comprehensive income/(loss) for the year (Loss) for the year - - (4,436,046) (4,436,046) Foreign currency reserve of associate transferred to profit or loss 17 (d) - - - - Recognised value of share based payments of associate transferred to profit or loss 17 (d) - - - - Total comprehensive income/(loss) for the year - - (4,436,046) (4,436,046) Transaction with owners recorded directly in equity: Contribution of equity, net of transaction costs 17 (b) 3,382,189 - - 3,382,189 Recognised value of share based payments 17 (d) - 2,070,479 - 2,070,479 At 30 June 2017 49,631,512 9,970,355 (51,634,138) 7,967,729
At 1 July 2015 44,519,005 7,725,007 (45,375,661) 6,868,351 Total Comprehensive income/(loss) for the year (Loss) for the year - - (1,822,431) (1,822,431) Foreign currency reserve of associate transferred to profit or loss 17 (d) - (58,880) - (58,880) Recognised value of share based payments of associate transferred to profit or loss 17 (d) - (16,058) - (16,058) Total comprehensive income/(loss) for the year - (74,938) (1,822,431) (1,897,369) Transaction with owners recorded directly in equity: Contribution of equity, net of transaction costs 17 (b) 1,730,318 - - 1,730,318 Recognised value of share based payments 17 (d) - 249,807 - 249,807 At 30 June 2016 46,249,323 7,899,876 (47,198,092) 6,951,107
The above consolidated statement of changes in equity is to be read in conjunction with the accompanying notes.
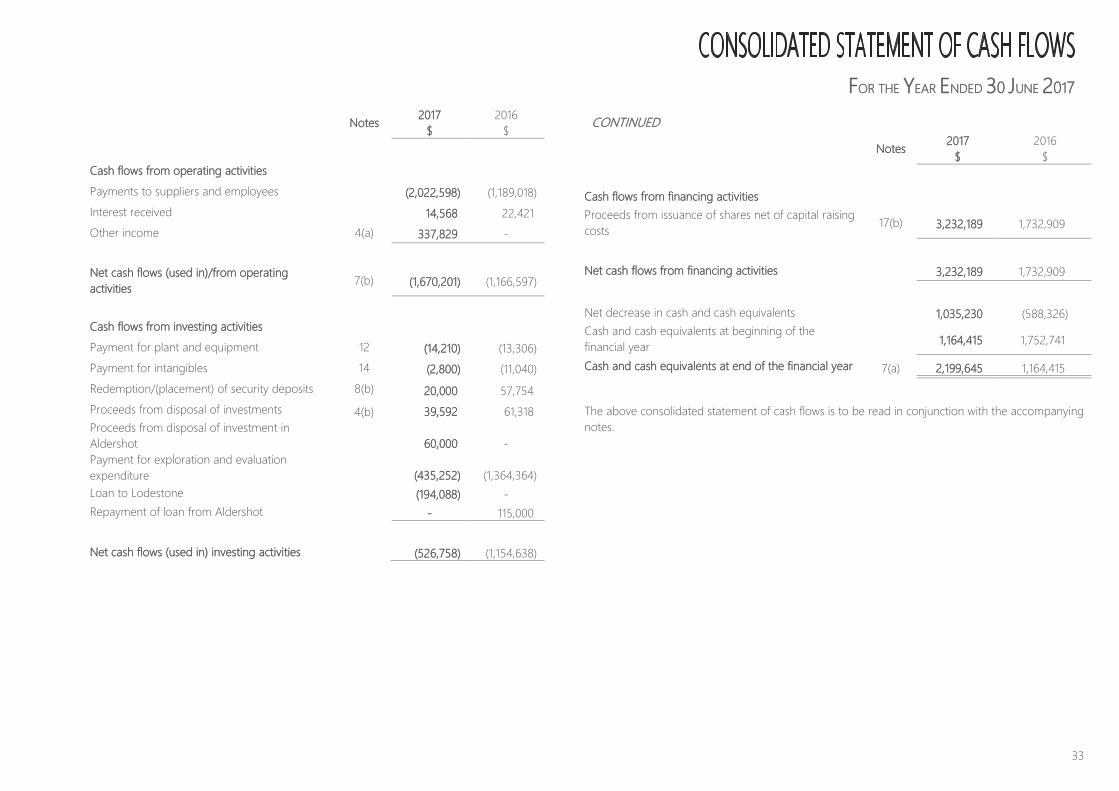
FOR THE YEAR ENDED 30 JUNE 2017
33
Notes 2017 $
2016 $
Cash flows from operating activities Payments to suppliers and employees (2,022,598) (1,189,018) Interest received 14,568 22,421 Other income 4(a) 337,829 - Net cash flows (used in)/from operating activities 7(b) (1,670,201) (1,166,597)
Cash flows from investing activities Payment for plant and equipment 12 (14,210) (13,306) Payment for intangibles 14 (2,800) (11,040) Redemption/(placement) of security deposits 8(b) 20,000 57,754 Proceeds from disposal of investments 4(b) 39,592 61,318 Proceeds from disposal of investment in Aldershot 60,000 - Payment for exploration and evaluation expenditure (435,252) (1,364,364) Loan to Lodestone (194,088) - Repayment of loan from Aldershot - 115,000 Net cash flows (used in) investing activities (526,758) (1,154,638)
CONTINUED Notes 2017
$ 2016
$ Cash flows from financing activities Proceeds from issuance of shares net of capital raising costs 17(b) 3,232,189 1,732,909
Net cash flows from financing activities 3,232,189 1,732,909 Net decrease in cash and cash equivalents 1,035,230 (588,326) Cash and cash equivalents at beginning of the financial year 1,164,415 1,752,741
Cash and cash equivalents at end of the financial year 7(a) 2,199,645 1,164,415 The above consolidated statement of cash flows is to be read in conjunction with the accompanying notes.

FOR THE YEAR ENDED 30 JUNE 2017
34
1. CORPORATE INFORMATION This financial report includes the consolidated financial statements and notes of Magnetite Mines Limited and its controlled entities (“consolidated entity or Group”). The financial report of Magnetite Mines Limited (the “Company”) for the year ended 30 June 2017 was authorised for issue in accordance with a resolution of the directors on 29 September 2017. The Company is limited by shares incorporated and domiciled in Australia whose shares are publicly traded on the Australian Securities Exchange Ltd. The nature of the operations and principal activities of the Group are described on page 20 of the Directors’ Report. Separate financial statements of the Company as an individual entity are no longer presented as the consequences of a change to the Corporations Act 2001, however required financial information for the Company as an individual entity is included in note 21.
2. SUMMARY OF SIGNIFICANT ACCOUNTING POLICIES (a) Basis of preparation
The financial report is a general-purpose financial report, which has been prepared in accordance with the requirements of the Corporations Act 2001 and Australian Accounting Standards (including Australian Accounting Standards and Interpretations). The financial report has also been prepared on a historical cost basis and the accruals basis, modified where applicable by the measurement at fair value of selected non-current assets, financial assets and financial liabilities. Going concern The accounts have been prepared on the going concern basis, which contemplates continuity of normal business activities and the realisation of assets and liabilities in the normal course of business The group recorded a loss of $4,436,046 for the year ended 30 June 2017. Total exploration expenditure written off in the year is $26,652 and no provision for impairment loss was made. The group had cash assets of $2,199,645 at 30 June 2017.
The directors consider these funds, combined with additional funds from any capital raising to be sufficient for the planned expenditure on the mineral projects for the ensuing 12 months as well as for corporate and administrative overhead costs. The directors also believe that they have the capacity to raise additional capital should that become necessary. For these reasons, the directors believe the going concern basis of preparation is appropriate. Statement of compliance
Australian Accounting Standards and Interpretations that have recently been issued or amended but are not yet effective have not been adopted by the Company for the annual reporting period ended 30 June 2017 are outlined below. The financial report complies with Australian Accounting Standards, which include Australian equivalents to International Financial Reporting Standards (AIFRS). The financial report also complies with International Financial Reporting Standards (IFRS). Principles of Consolidation The consolidated financial statements incorporate all of the assets, liabilities and results of the parent (Magnetite Mines Limited) and all of the subsidiaries. Subsidiaries are entities the parent controls. The parent controls an entity when it is exposed to, or has rights to, variable returns from its involvement with the entity and has the ability to affect those returns through its power over the entity. A list of the subsidiaries is provided in note 11.
The assets, liabilities and results of all subsidiaries are fully consolidated into the financial statements of the Group from the date on which control is obtained by the Group. The consolidation of a subsidiary is discontinued from the date that control ceases. Intercompany transactions, balances and unrealised gains or losses on transactions between Group entities are fully eliminated on consolidation. Accounting policies of subsidiaries have been changed and adjustments made where necessary to ensure uniformity of the accounting policies adopted by the Group.
Equity interests in a subsidiary not attributable, directly or indirectly, to the Group are presented as “non-controlling interests". The Group initially recognises non-controlling interests that are present ownership interests in subsidiaries and are entitled to a proportionate share of the subsidiary's net assets on liquidation at either fair value or at the non-controlling interests' proportionate share of the subsidiary's net assets.

FOR THE YEAR ENDED 30 JUNE 2017
35
2. SUMMARY OF SIGNIFICANT ACCOUNTING POLICIES CONTINUED Principles of Consolidation continued
Subsequent to initial recognition, non-controlling interests are attributed their share of profit or loss and each component of other comprehensive income. Non-controlling interests are shown separately within the equity section of the statement of financial position and statement of profit or loss and other comprehensive income.
(b) New standards and interpretations Adopted in 2016/17 FY
The Group has consistently applied the following accounting policies to all periods presented in the financial statements. The Group has considered the implications of new and amended Accounting Standards applicable for annual reporting periods beginning after 1 January 2016 but determined that their application to the financial statements is either not relevant or not material.
(c) New standards and interpretations not yet adopted
A number of new standards, amendments to standards and interpretations issued by the AASB which are not yet mandatorily applicable to the Group have not been applied in preparing these consolidated financial statements. Those which may be relevant to the Group are set out below. The Group does not plan to adopt these standards early.
• AASB 9 Financial Instruments and associated Amending Standards (applicable for annual reporting period commencing 1 January 2018)
The Standard will be applicable retrospectively (subject to the provisions on hedge accounting outlined below) and includes revised requirements for the classification and measurement of financial instruments, revised recognition and derecognition requirements for financial instruments and simplified requirements for hedge accounting.
The key changes that may affect the Group on initial application include certain simplifications to the classification of financial assets, simplifications to the accounting of embedded derivatives, upfront accounting for expected credit loss, and the irrevocable election to recognise gains and losses on investments in equity instruments that are not held for trading in other comprehensive income. AASB 9 also introduces a new model for hedge accounting that will allow greater flexibility in the ability to hedge risk, particularly with respect to hedges of non-financial items. Should the entity elect to change its hedge policies
in line with the new hedge accounting requirements of the Standard, the application of such accounting would be largely prospective.
Although the directors anticipate that the adoption of AASB 9 may have an impact on the Group’s financial instruments it is impractical at this stage to provide a reasonable estimate of such impact.
• AASB 15: Revenue from Contracts with Customers (applicable to annual reporting periods commencing on or after 1 January 2018) When effective, this Standard will replace the current accounting requirements applicable to revenue with a single, principles-based model. Apart from a limited number of exceptions, including leases, the new revenue model in AASB 15 will apply to all contracts with customers as well as non-monetary exchanges between entities in the same line of business to facilitate sales to customers and potential customers.
The core principle of the Standard is that an entity will recognise revenue to depict the transfer of promised goods or services to customers in an amount that reflects the consideration to which the entity expects to be entitled in exchange for the goods or services. To achieve this objective, AASB 15 provides the following five-step process:
- identify the contract(s) with a customer; - identify the performance obligations in the contract(s); - determine the transaction price; - allocate the transaction price to the performance obligations in the contract(s); and - recognise revenue when (or as) the performance obligations are satisfied. This Standard will require retrospective restatement, as well as enhanced disclosures regarding revenue.
The directors anticipate that the adoption of AASB 15 will not have a material impact on the Group’s revenue recognition and disclosures.
• AASB 16: Leases (applicable to annual reporting periods commencing on or after 1 January 2019)
When effective, this Standard will replace the current accounting requirements applicable to leases in AASB 117: Leases and related interpretations. AASB 16 introduces a single lessee accounting model that eliminates the requirement for leases to be classified as either operating leases or finance leases. Lessor accounting remains similar to current practice.

FOR THE YEAR ENDED 30 JUNE 2017
36
2. SUMMARY OF SIGNIFICANT ACCOUNTING POLICIES CONTINUED (c) New standards and interpretations not yet adopted continued
The main changes introduced by the new Standard are as follows: - recognition of the right-to-use asset and liability for all leases (excluding short term
leases with less than 12 months of tenure and leases relating to low value assets); - depreciating the right-to-use assets in line with AASB 116: Property, Plant and
Equipment in profit or loss and unwinding of the liability in principal and interest components;
- inclusion of variable lease payments that depend on an index or a rate in the initial measurement of the lease liability using the index or rate at the commencement date;
- application of practical expedient to permit a lessee to elect not to separate non-lease components and instead account for all components as a lease; and
- additional disclosure requirements.
The transitional provisions of AASB 16 allow a lease to either retrospectively apply the Standard to comparatives in line with AASB 108 or recognise the cumulative effect of retrospective application as an adjustment to opening equity at the date of initial application.
Although the directors anticipate that the adoption of AASB 16 may have an impact on the Group's financial statements, it is impracticable at this stage to provide a reasonable estimate of such impact.
• AASB 2014-10: Amendments to Australian Accounting Standards – Sale or Contribution of Assets between an Investor and its Associate or Joint Venture (applicable to annual reporting periods commencing on or after 1 January 2018)
This Standard amends AASB 10: Consolidated Financial Statements with regards to a parent losing control over a subsidiary that is not a “business” as defined in AASB 3: Business Combinations to an associate or joint venture and requires that:
- a gain or loss (including any amounts in other comprehensive income (OCI)) be recognised only to the extent of the unrelated investor’s interest in that associate or joint venture;
- the remaining gain or loss be eliminated against the carrying amount of the investment in that associate or joint venture; and
- any gain or loss from remeasuring the remaining investment in the former subsidiary at fair value also be recognised only to the extent of the unrelated investor’s interest in the associate or joint venture. The remaining gain or loss should be eliminated against the carrying amount of the remaining investment.
Although the directors anticipate that the adoption of AASB 2014-10 may have an impact on the Group's financial statements, it is impracticable at this stage to provide a reasonable estimate of such impact.
Other standards not yet applicable
There are no other standards that are not yet effective and that would be expected to have a material impact on the entity in the current or future reporting periods and on foreseeable future transactions.
(d) Significant accounting estimates and assumptions
The carrying amounts of certain assets and liabilities are often determined based on estimates and assumptions of future events. The key estimate and assumptions that have a significant risk of causing a material adjustment to the carrying amounts of certain assets and liabilities within the next annual reporting period are: Share based payment transactions The Company measures the cost of equity-settled transactions with employees by reference to the fair value of the equity instruments at the date at which they are granted. The fair value is determined by either an external valuer or internally using a Black-Scholes option pricing model, using the assumptions detailed in note 25. Mineral exploration and evaluation Exploration and evaluation expenditure is accumulated in respect of each identifiable area of interest. The carrying values are reviewed for impairment when events or changes in circumstances indicate the carrying value may not be recoverable. A provision for impairment is based on the directors’ best estimate of recoverable value. Exploration and evaluation costs may be carried forward in respect of an area that has not at balance sheet date reached a stage which permits a reasonable assessment of the existence or otherwise of economically recoverable reserves, and active operations in or relating to, the area of interest are continuing.

FOR THE YEAR ENDED 30 JUNE 2017
37
2. SUMMARY OF SIGNIFICANT ACCOUNTING POLICIES CONTINUED Subsidiary intercompany loans Provisions for write off of intercompany loans are made where there is significant uncertainty as to whether the loans are recoverable. Recovery of deferred tax assets Judgment is required in determining whether deferred tax assets are recognised in the balance sheet. Deferred tax assets, including those arising from un-utilised tax losses require management to assess the likelihood that the Group will generate taxable earnings in future periods, in order to utilise recognised deferred tax assets. Deferred tax assets will not be recognised until the Group is able to generate a net taxable income.
Estimates of future taxable income will be based on forecast cash flows from operations and the application of existing tax laws in each jurisdiction. To the extent that future cash flows and taxable income differ significantly from estimates, the ability of the Group to realise the net deferred tax assets recorded at the reporting date could be impacted.
Additionally, future changes in tax laws in the jurisdictions in which the Group operates could limit the ability of the Group to obtain tax deductions in future periods.
(e) Cash and cash equivalents
Cash and short-term deposits in the statement of financial position comprise cash at bank and in hand and short-term deposits with an original maturity of three months or less.
For the purposes of the statement of cash flows, cash and cash equivalents consist of cash and cash equivalents as detailed above, net of any outstanding bank overdrafts.
(f) Trade and other receivables
Trade receivables, which generally have 30-90 day terms, are recognised and carried at original invoice amount less an allowance for any uncollectible amounts.
An allowance for doubtful debts is made when there is objective evidence that the Group will not be able to collect the debts. Bad debts are written off when identified.
(g) Income tax
Current tax assets and liabilities for the current and prior periods are measured at the amount expected to be recovered from or paid to the taxation authorities. The tax rates and tax laws used to compute the amount are those that are enacted or substantively enacted by the balance sheet date.
(g) Income tax continued
Deferred income tax is provided on all temporary differences at the balance sheet date between the tax bases of assets and liabilities and their carrying amounts for financial reporting purposes.
Deferred income tax liabilities are recognised for all taxable temporary differences except:
• when the deferred income tax liability arises from the initial recognition of goodwill or of an asset or liability in a transaction that is not a business combination and that, at the time of the transaction, affects neither the accounting profit nor taxable profit or loss; or
• when the taxable temporary difference is associated with investments in subsidiaries, associates or interests in joint ventures, and the timing of the reversal of the temporary difference can be controlled and it is probable that the temporary difference will not reverse in the foreseeable future.
Deferred income tax assets are recognised for all deductible temporary differences, carry-forward of unused tax assets and unused tax losses, to the extent that it is probable that taxable profit will be available against which the deductible temporary differences and the carry-forward of unused tax credits and unused tax losses can be utilised, except:
• when the deferred income tax asset relating to the deductible temporary difference arises from the initial recognition of an asset or liability in a transaction that is not a business combination and, at the time of the transaction, affects neither the accounting profit not taxable profit or loss, or
• when the deductible temporary difference is associated with investments in subsidiaries, associates or interests in joint ventures, in which case a deferred tax asset is only recognised to the extent that it is probable that the temporary difference will reverse in the foreseeable future and taxable profit will be available against which the temporary difference can be utilised.
The carrying amount of deferred income tax assets is reviewed at each balance sheet date and reduced to the extent that it is no longer probable that sufficient taxable profit will be available to allow all or part of the deferred income tax asset to be utilised.
Unrecognised deferred income tax assets are reassessed at each balance sheet date and are recognised to the extent that it has become probable that future taxable profit will allow the deferred tax asset to be recovered.
FOR THE YEAR ENDED 30 JUNE 2017
38
2. SUMMARY OF SIGNIFICANT ACCOUNTING POLICIES CONTINUED
(g) Income tax continued Deferred income tax assets and liabilities are measured at the tax rates that are expected to apply to the year when the assets are realised or the liability is settled, based on tax rates (and tax laws) that have been enacted or substantively enacted at the balance sheet date.
Income taxes relating to items recognised directly in equity are recognised in equity and not in profit or loss.
Deferred tax assets and deferred tax liabilities are offset only if a legally enforceable right exists to set off current tax assets against current tax liabilities and the deferred tax assets and liabilities relate to the same taxable entity and the same taxation authority.
(h) Other taxes
Revenues, expenses and assets are recognised net of amount of GST except:
• when the GST incurred on a purchase of goods and services is not recoverable from the taxation authority, in which case the GST is recognised as part of the cost of acquisition of the assets or as part of the expense item as applicable; and
• receivables and payables, which are stated with the amount of GST included.
The net amount of GST recoverable from, or payable to, the taxation authority is included as part of receivables or payables in the balance sheet.
Cash flows are included in the cash flow statement on a gross basis and the GST component of cash flows arising from investing and financing activities, which is recoverable from, or payable to, the taxation authority are classified as operating cash flows.
Commitments and contingencies are disclosed net of the amount of GST recoverable from, or payable to, the taxation authority.
(i) Plant and equipment
Plant and equipment is stated at cost less any accumulated depreciation and any impairment in value. Depreciation The depreciable amount of all fixed assets is depreciated on a diminishing value basis over their useful lives to the Group commencing from the time the asset is held ready for use.
The depreciation rates used for each class of depreciable assets are:
Plant and equipment – over 4 to 10 years Motor vehicles – over 4 years Office furniture and equipment – over 3 years Impairment The carrying values of plant and equipment are reviewed for impairment when events or changes in circumstances indicate the carrying value may not be recoverable.
For an asset that does not generate largely independent cash inflows, the recoverable amount is determined for the cash-generating unit to which the asset belongs.
If any such indication exists and where the carrying value exceeds the estimated recoverable amount, the assets or cash-generating units are written down to their recoverable amount.
The recoverable amount of plant and equipment is the greater of fair value less costs to sell and value in use. In assessing value in use, the estimated future cash flows are discounted to their present value using a pre-tax discount rate that reflects current market assessments of the item value of money and the risks specific to the asset.
An item of plant and equipment is derecognised upon disposal or when no future economic benefits are expected to arise from the continued use of the asset.
Any gain or loss arising on derecognition of the asset (calculated as the difference between the net disposal proceeds and the carrying amount of the item) is included in the income statement in the period the item is being derecognised.
FOR THE YEAR ENDED 30 JUNE 2017
39
2. SUMMARY OF SIGNIFICANT ACCOUNTING POLICIES CONTINUED (j) Intangible assets
Intangible assets are made up of licences and software and are stated at cost less any accumulated amortisation and any impairment value. Amortisation The amortisation amount of all intangible assets are amortised on a straight line basis over two years of their useful lives to the Group commencing from the time the asset is held ready for use.
(k) Exploration, evaluation and development expenditure
Exploration, evaluation and development costs are accumulated in respect of each separate area of interest. Exploration and evaluation costs are carried forward where right of tenure of the area of interest is current and they are expected to be recouped through sale or successful development and exploitation of the area of interest or, where exploration and evaluation activities in the area of interest have not yet reached a stage that permits reasonable assessment of the existence of economically recoverable reserves. When an area of interest is abandoned or the directors decide that it is not commercial, any accumulated costs in respect of that area are written off in the financial period the decision was made. Each area of interest is also reviewed at the end of each accounting period and accumulated costs written off to the extent that they may not be recoverable in the future. Amortisation is not charged on costs carried forward in respect of areas of interest in the development phase until production commences.
(l) Trade and other payables
Trade payables and other payables are carried at amortised costs and represent liabilities for goods and services provided by the Group prior to the end of the financial year that are unpaid and arise when the Group becomes obliged to make future payments in respect of the purchase of these goods and services. Trade payables and other payables are carried at cost which is the fair value of the consideration to be paid in the future for goods and services received, whether or not billed to the Group.
(m) Provisions
Provisions are recognised when the Group has a present obligation (legal or constructive) as a result of a past event, it is probable that an outflow of resources embodying economic benefits will be required to settle the obligations and a reliable estimate can be made of the amount of the obligation.
When the Group expects some or all of a provision to be reimbursed, for example under an insurance contract, the reimbursement is recognised as a separate asset but only when the reimbursement is virtually certain. The expense relating to any provision is presented in the income statement net of any reimbursement.
If the effect of the time value of money is material, provisions are discounted using a current pre-tax rate that reflects the risks specific to the liability. When discounting is used, the increase in the provision due to the passage of time is recognised as a borrowing cost.
(n) Earnings per share
(i) Basic earnings per share (“EPS”) is calculated by dividing the net profit/loss attributable to members for the reporting period, after excluding any costs of servicing equity, by the weighted average number of ordinary shares of the Company, adjusted for any bonus issue.
(ii) Diluted EPS is calculated by dividing the basic EPS, adjusted by the after tax effect of financing costs associated with dilutive potential ordinary shares and the effect on net revenues and expenses of conversion to ordinary shares associated with dilutive potential ordinary shares, by the weighted average number of ordinary shares and dilutive potential ordinary shares, adjusted for any bonus issue.
(o) Contributed equity
Ordinary shares are classified as equity. Incremental costs directly attributable to the issue of new shares or options are shown in equity as a deduction, net of tax, from the proceeds.
(p) Borrowing costs
Borrowing costs are recognised as an expense when incurred. Alternatively, borrowing costs can be capitalised for qualifying assets.

FOR THE YEAR ENDED 30 JUNE 2017
40
2. SUMMARY OF SIGNIFICANT ACCOUNTING POLICIES CONTINUED (q) Leases
The determination of whether an arrangement is or contains a lease is based on the substance of the arrangement and requires an assessment of whether the fulfilment of the arrangement is dependent on the use of a specific asset or assets and the arrangement conveys a right to use the asset.
Finance leases, which transfer to the Company substantially all the risks and benefits incidental to ownership of the leased item, are capitalised at the inception of the lease at the fair value of the leased property or, if lower, at the present value of the minimum lease payments. Lease payments are apportioned between the finance charges and reduction of the lease liability so as to achieve a constant rate of interest on the remaining balance of the liability. Finance charges are recognised as an expense in profit or loss.
Capitalised leased assets are depreciated over the shorter of the estimated useful life of the asset and the lease term if there is no reasonable certainty that the Company will obtain ownership by the end of the lease term.
Operating lease payments are recognised as an expense in the income statement on a straight-line basis over the lease term. Lease incentives are recognised in the income statement as an integral part of the total lease expense.
(r) Impairment of assets
The Company assesses at each reporting date whether there is an indication that an asset may be impaired. If any such indication exists, or when annual impairment testing for an asset is required, the Company makes an estimate of the asset’s recoverable amount. An asset’s recoverable amount is the higher of its fair value less costs to sell and its value in use and is determined for an individual asset, unless the asset does not generate cash inflows that are largely independent of those from other assets or Group of assets and the asset’s value in use cannot be estimated to be close to its fair value. In such cases the asset is tested for impairment as part of the cash-generating unit to which it belongs.
When the carrying amount of an asset or cash-generating unit exceeds its recoverable amount, the asset or cash-generating unit is considered impaired and is written down to its recoverable amount. In assessing value in use, the estimated future cash flows are discounted to their
(r) Impairment of assets continued
present value using a pre-tax discount rate that reflects current market assessments of the time value of money and the risks specific to the asset.
Impairment losses relating to continuing operations are recognised in those expense categories consistent with the function of the impaired asset unless the asset is carried at re-valued amount (in which case the impairment loss is treated as a revaluation decrease).
An assessment is also made at each reporting date as to whether there is any indication that previously recognised impairment losses may no longer exist or may have decreased. If such indication exists, the recoverable amount is estimated. A previously recognised impairment loss is reversed only if there has been a change in the estimates used to determine the asset’s recoverable amount since the last impairment loss was recognised.
If that is the case the carrying amount of the asset is increased to its recoverable amount. That increased amount cannot exceed the carrying amount that would have been determined, net of depreciation, had no impairment loss been recognised for the asset in prior years. Such reversal is recognised in profit or loss unless the asset is carried at re-valued amount, in which case the reversal is treated as revaluation increase. After such a reversal the depreciation charge is adjusted in future periods to allocate the asset’s revised carrying amount, less any residual value, on a systematic basis over its remaining useful life.
(s) Investments
All investments are initially recognised at cost, being the fair value of the consideration given and including acquisition charges associated with the investment.
After initial recognition, investments, which are classified as held for trading and available-for-sale, are measured at fair value. Gains or losses on investments held for trading are recognised in the profit or loss.
Gains or losses on available-for-sale investments are recognised as a separate component of equity.
Non-derivative financial assets with fixed or determinable payments and fixed maturity are classified as held-to-maturity when the Company has the positive intention and ability to hold to maturity. Investments intended to be held for an undefined period are not included in this classification.

FOR THE YEAR ENDED 30 JUNE 2017
41
2. SUMMARY OF SIGNIFICANT ACCOUNTING POLICIES CONTINUED (s) Investments continued
Other long-term investments that are intended to be held-to-maturity, such as bonds, are subsequently measured at amortised cost using the effective interest method. Amortised cost is calculated by taking into account any discount or premium on acquisition, over the period to maturity.
For investments carried at amortised cost, gains and losses are recognised in income when the investments are derecognised or impaired, as well as through the amortisation process.
For investments that are actively traded in organised financial markets, fair value is determined by reference to stock exchange quoted market bid prices at the close of business on the balance sheet date.
For investments where there is no quoted market price, fair value is determined by reference to the current market value of another instrument which is substantially the same or is calculated based on the expected cash flows of the underlying net asset base of the investment.
Purchases and sales of financial assets that require delivery of assets within the time frame generally established by regulation or convention in the market place are recognised on the trade date i.e. the date that the Group commits to purchase the asset.
(t) Share-based payment transactions
In valuing equity-settled transactions, no account is taken of any performance conditions, other than conditions linked to the price of the shares of the Company (market conditions) if applicable.
The cost of equity-settled transactions is recognised, together with a corresponding increase in equity, over the period in which the performance and/or service conditions are fulfilled, ending on the date on which the relevant employees become fully entitled to the award (the vesting period).
(t) Share-based payment transactions continued
The cumulative expense recognised for equity-settled transactions at each reporting date until vesting date reflects:
(i) the extent to which the vesting period has expired; and (ii) the Company’s best estimate of the number of equity instruments that will ultimately vest.
No adjustment is made for the likelihood of market performance conditions being met as the effect of these conditions is included in the determination of fair value at grant date. The income statement charge or credit for a period represents the movement in cumulative expense recognised as at the beginning and end of the period.
No expense is recognised for awards that do not ultimately vest, except for awards where vesting is only conditional upon a market condition.
If the terms of an equity-settled award are modified, as a minimum an expense is recognised as if the terms had not been modified. In addition, an expense is recognised for any modification that increases the total fair value of the share-based payment arrangement, or is otherwise beneficial to the employee, as measured at the date of modification.
If an equity-settled award is cancelled, it is treated as if it had vested on the date of cancellation, and any expense not yet recognised for the award is recognised immediately. However, if a new award is substituted for the cancelled award and designated as a replacement award on the date that it is granted, the cancelled and new award are treated as if they were a modification of the original award, as described in the previous paragraph.
The dilutive effect, if any, of outstanding options is reflected as additional share dilution in the computation of earnings per share (see note 6).
FOR THE YEAR ENDED 30 JUNE 2017
42
2. SUMMARY OF SIGNIFICANT ACCOUNTING POLICIES CONTINUED (t) Share-based payment transactions continued
(1) Cash settled transaction
The Group may provide benefits to employees in the form of cash-settled share-based payments, whereby employees render services in exchange for cash, the amounts of which are determined by reference to movements in the price of the shares of the Company.
The dilutive effect, if any, of outstanding options is reflected as additional share dilution in the computation of earnings per share (see note 6).
The cost of cash-settled transactions is measured initially at fair value at the grant date using the Black-Scholes formula taking into account the terms and conditions upon which the instruments were granted (see note 25). This fair value is expensed over the period until vesting with recognition of a corresponding liability. The liability is remeasured to fair value at each balance sheet date up to and including the settlement date with changes in fair value recognised in profit or loss.
(2) Equity settled transactions
The Group provides benefits to employees (including senior executives) of the Group in the form of share-based payments, whereby employees render services in exchange for shares or rights over shares (equity-settled transactions).
There is currently one plan in place the employee option share plan, which provides benefits to all employees, excluding directors.
The cost of these equity-settled transactions with employees is measured by reference to the fair value of the equity instruments at the date at which they are granted. The fair value is determined by an external valuer or internally using a Black-Scholes option pricing model, further details of which are given in note 25.
(u) Comparatives
When required by accounting standards, comparative figures have been adjusted to conform to changes in presentation for the current financial year.
(v) Foreign currency translation
(i) Functional and presentation currency
The functional currency of the Company is measured using the currency of the primary economic environment in which the Company operates. The financial statements are presented in Australian dollars which is the Company’s functional and presentation currency. The functional currency of its previously held associate Aldershot Resources Ltd is Canadian dollar. The functional currency of all other subsidiaries is Australian dollars. (ii) Transaction and balances
Foreign currency transactions are translated into functional currency using the exchange rates prevailing at the date of the transaction. Foreign currency monetary items are translated at the year end exchange rate. Non-monetary items measured at historical costs continued to be carried at the exchange rate at the date of the transaction. Non-monetary items measured at fair value are reported at the exchange rate at the date when fair values were determined. (iii) Group companies
The financial results and position of foreign operations whose functional currency is different from the Group’s presentation currency are translated as follows:
Assets and liabilities are translated at year-end exchange rates prevailing at that reporting date. Income and expenses are translated at average exchange rates for the period. Retained profits are translated at the exchange rates prevailing at the date of the transaction.

FOR THE YEAR ENDED 30 JUNE 2017
43
2. SUMMARY OF SIGNIFICANT ACCOUNTING POLICIES CONTINUED (w) Revenue recognition
Revenue is recognised to the extent that it is probable that the economic benefits will flow to the Group and the revenue can be reliably measured.
Interest revenue is recognised on a proportional basis taking into account the interest rates applicable to the financial assets.
(x) Interests in Joint Arrangements
Joint arrangements represent the contractual sharing of control between parties in a business venture where unanimous decisions about relevant activities are required.
Separate joint venture entities providing joint venturers with an interest to net assets are classified as a "joint venture" and accounted for using the equity method.
Joint venture operations represent arrangements whereby joint operators maintain direct interests in each asset and exposure to each liability of the arrangement. The Group's interests in the assets, liabilities, revenue and expenses of joint operations are included in the respective line items of the consolidated financial statements.
Gains and losses resulting from sales to a joint operation are recognised to the extent of the other parties' interests. When the Group makes purchases from a joint operation, it does not recognise its share of the gains and losses from the joint arrangement until it resells those goods/assets to a third party.
(y) Fair Value of Assets and Liabilities
The Group measures some of its assets and liabilities at fair value on either a recurring or non-recurring basis, depending on the requirements of the applicable Accounting Standard.
Fair value is the price the Group would receive to sell an asset or would have to pay to transfer a liability in an orderly (i.e. unforced) transaction between independent, knowledgeable and willing market participants at the measurement date.
As fair value is a market-based measure, the closest equivalent observable market pricing information is used to determine fair value. Adjustments to market values may be made having regard to the characteristics of the specific asset or liability. The fair values of assets and liabilities that are not traded in an active market are determined using one or more valuation techniques. These valuation techniques maximise, to the extent possible, the use of observable market data.
To the extent possible, market information is extracted from either the principal market for the asset or liability (i.e. the market with the greatest volume and level of activity for the asset or liability) or, in the absence of such a market, the most advantageous market available to the entity at the end of the reporting period (i.e. the market that maximises the receipts from the sale of the asset or minimises the payments made to transfer the liability, after taking into account transaction costs and transport costs).
For non-financial assets, the fair value measurement also takes into account a market participant's ability to use the asset in its highest and best use or to sell it to another market participant that would use the asset in its highest and best use.
The fair value of liabilities and the entity's own equity instruments (excluding those related to share-based payment arrangements) may be valued, where there is no observable market price in relation to the transfer of such financial instruments, by reference to observable market information where such instruments are held as assets. Where this information is not available, other valuation techniques are adopted and, where significant, are detailed in the respective note to the financial statements.
FOR THE YEAR ENDED 30 JUNE 2017
44
2. SUMMARY OF SIGNIFICANT ACCOUNTING POLICIES CONTINUED (y) Fair Value of Assets and Liabilities continued
Valuation techniques
In the absence of an active market for an identical asset or liability, the Group selects and uses one or more valuation techniques to measure the fair value of the asset or liability, The Group selects a valuation technique that is appropriate in the circumstances and for which sufficient data is available to measure fair value. The availability of sufficient and relevant data primarily depends on the specific characteristics of the asset or liability being measured. The valuation techniques selected by the Group are consistent with one or more of the following valuation approaches: • Market approach: valuation techniques that use prices and other relevant information
generated by market transactions for identical or similar assets or liabilities. • Income approach: valuation techniques that convert estimated future cash flows or
income and expenses into a single discounted present value.
• Income approach: valuation techniques that convert estimated future cash flows or income and expenses into a single discounted present value.
• Cost approach: valuation techniques that reflect the current replacement cost of an asset at its current service capacity.
Each valuation technique requires inputs that reflect the assumptions that buyers and sellers would use when pricing the asset or liability, including assumptions about risks. When selecting a valuation technique, the Group gives priority to those techniques that maximise the use of observable inputs and minimise the use of unobservable inputs. Inputs that are developed using market data (such as publicly available information on actual transactions) and reflect the assumptions that buyers and sellers would generally use when pricing the asset or liability are considered observable, whereas inputs for which market data is not available and therefore are developed using the best information available about such assumptions are considered unobservable.
(y) Fair Value of Assets and Liabilities continued
Fair value hierarchy AASB 13 requires the disclosure of fair value information by level of the fair value hierarchy, which categorises fair value measurements into one of three possible levels based on the lowest level that an input that is significant to the measurement can be categorised into as follows: Level 1 Measurements based on quoted prices (unadjusted) in active markets for identical assets or liabilities that the entity can access at the measurement date. Level 2 Measurements based on inputs other than quoted prices included in Level 1 that are observable for the asset or liability, either directly or indirectly. Level 3 Measurements based on unobservable inputs for the asset or liability. The fair values of assets and liabilities that are not traded in an active market are determined using one or more valuation techniques. These valuation techniques maximise, to the extent possible, the use of observable market data. If all significant inputs required to measure fair value are observable, the asset or liability is included in Level 2. If one or more significant inputs are not based on observable market data, the asset or liability is included in Level 3.
The Group would change the categorisation within the fair value hierarchy only in the following circumstances:
(i) if a market that was previously considered active (Level 1) became inactive (Level 2 or Level 3) or vice versa; or
(ii) if significant inputs that were previously unobservable (Level 3) became observable (Level 2) or vice versa.
When a change in the categorisation occurs, the Group recognises transfers between levels of the fair value hierarchy (i.e. transfers into and out of each level of the fair value hierarchy) on the date the event or change in circumstances occurred.

FOR THE YEAR ENDED 30 JUNE 2017
45
3. SEGMENT INFORMATION Description of segments AASB 8 requires operating segments to be identified on the basis of internal reports about components of the Group that are regularly reviewed by the chief operating decision maker in order to allocate resources to the segment and to assess its performance. The Group has identified its operating segments based on the internal reports that are reviewed and used by the executive management team in assessing performance and in determining the allocation of resources. During the year the Group operated in one operating segment and one geographical area, being mineral exploration in Australia. This is the basis on which internal reports are provided to the Directors for assessing performance and determining the allocation of resources in the Group.
Consolidated (Australia) 2017 2016 $ $
Segment Revenue Other income 338,995 36,794 Finance revenue 12,387 17,932 Total revenue 351,382 54,726 Segment result Segment result1 (4,436,046) (1,822,431) Intersegment elimination - - (Loss)/Gain before income tax (4,436,046) (1,822,431) Income tax expense - - (Loss)/Gain for the year (4,436,046) (1,822,431) Segment assets and liabilities Segment assets2 11,361,357 9,962,321 Intersegment elimination - - Total assets 11,361,357 9,962,321 Segment liabilities 3,393,628 3,011,214 Intersegment elimination - - Total liabilities 3,393,628 3,011,214
Other segment information Acquisition of property, plant and equipment and intangibles 17,010 24,346 Depreciation and amortisation expense 39,252 43,835 (Reversal)/impairment of associated company loan - (139,201) Non-recovery of loan to related party 397,161 - Impairment expense on exploration assets - -
Notes: 1 Includes the Company’s share of associated company loss of $Nil (2016: $42,760) and diminution in value of investment in
associated company of $Nil (2016: Diminution in value of investment of $163,796). As at 30 June 2016 the associated company has been classified to a held for sale investment.
2 Includes investment held for sale of $Nil (2016: $60,000) in associated company listed on the TSX

FOR THE YEAR ENDED 30 JUNE 2017
46
4. OTHER INCOME AND EXPENSES Consolidated Group
2017 $
2016 $
(a) Other income Increase/(decrease) in market value of investments - 30,909 Sundry income 1,167 5,885 Income tax benefit – Research and Development grant 337,828 -
338,995 36,794 (b) Proceeds from disposal of investments
Proceeds from disposal of investments 39,592 61,318 Less carrying value of disposed investments (33,177) (11,000) Net gain on disposal of investments 6,415 50,318
(c) Proceeds from settlement of loan to Aldershot Proceeds from settlement of loan to Aldershot - 115,000 Less carrying value of loan to Aldershot inclusive of capitalised interest - (145,086) Loss on settlement of loan to Aldershot - (30,086)
5. INCOME TAX
Consolidated Group
2017 $
2016 $
(a) Numerical reconciliation of income tax expense to prima facie tax payable
(Loss)/profit before income tax from continuing operations
(4,436,046) (1,822,431)
(Loss)/gain from ordinary activities before income tax expense
(4,436,046) (1,822,431)
Prima facie tax benefit on loss from ordinary activities at 27.5% (2016: 30%)
(1,219,913) (546,729)
Tax effect of amounts which are not deductible (taxable) in calculating taxable income:
Unlisted options 488,845 58,969 R&D Tax Refund (92,903) - Fines and penalties - 254 Entertainment 2,484 545
(821,487) (486,961) Movements in unrecognised temporary differences (559,113) (1,040,359) Tax effect of current year tax losses/(recoupment of losses) for which no deferred tax asset has been recognised
1,380,600 1,527,320
Income tax expense/(benefit) - -

FOR THE YEAR ENDED 30 JUNE 2017
47
5. INCOME TAX CONTINUED Consolidated Group
2017 $
2016 $
(b) Recognised temporary differences Deferred tax assets (at 30%) Prepayments - - Property, plant and equipment - - Investment held for sale - - Provisions - - Capital raising costs - - Carry forward revenue tax losses - - - - Deferred tax liabilities (at 30%) Unearned revenue - - Capitalised tenement acquisition and exploration costs - -
- - Net recognised deferred tax liability - -
(c) Unrecognised temporary differences Deferred tax assets (at 27.5%, 2016: 30%) Prepayments - - Property, plant and equipment - - Provision for investment 109,219 970,456 Provisions for expense 144,529 122,505 Capital raising costs 194,981 74,864 Carry forward revenue tax losses 9,369,765 9,687,070 Carry forward capital tax losses 2,374,946 1,619,233 12,193,440 12,474,128 Deferred tax liabilities (at 27.5%, 2016: 30%) Unearned revenue 2 677 Prepayments 2,724 - Mineral Exploration 2,395,900 2,494,718 2,398,626 2,495,395
Potential future income tax benefits attributable to total tax losses amounting to approximately $11,744,711 (2016: $11,312,913) at 2017 corporate tax rate of 27.5% (2016: 30%), have not been brought to account at 30 June 2017 because the directors do not believe it is appropriate to regard realisation of the future income tax benefits as probable. These benefits will only be obtained if: (a) the Company derives future assessable income of a nature and of an amount sufficient to
enable the benefit from the capital deductions to be realised; (b) the Company continues to comply with the conditions for deductibility imposed by law; and (c) no changes in tax legislation adversely affect the Company in realising the benefit from the
deductions for the carry forward capital tax losses.
6. EARNINGS PER SHARE (i) Basic earnings per share
Basic earnings per share are calculated by dividing the profit/(loss) after tax attributable to equity holders of the Company by the weighted average number of ordinary shares outstanding during the year.
(ii) Diluted earnings per share
Diluted earnings per share adjusts the figures used in the determination of basic earnings per share to take into account the after income tax effect of interest and other financing costs associated with dilutive potential ordinary shares and the weighted average number of shares assumed to have been issued for no consideration in relation to dilutive potential ordinary shares.
2017 Cents
2016 Cents
(a) Basic (loss)/earnings per share From continuing operations attributable to the ordinary equity holders of the company
(0.97) (0.47)
Total basic (loss)/earnings per share attributable to the ordinary equity holders of the Company
(0.97) (0.47)
Weighted average number of ordinary shares 456,205,911 387,398,255

FOR THE YEAR ENDED 30 JUNE 2017
48
6. EARNINGS PER SHARE CONTINUED Consolidated Group
2017 $
2016 $
(b) Reconciliation of earnings used in calculating earnings per share
(Loss)/profit attributable to the ordinary holders of the Company used in calculating the basic earnings per share: (4,436,046) (1,822,431)
(4,436,046) (1,822,431)
2017 Cents
2016 Cents
(c) Diluted (loss)/earnings per share From continuing operations attributable to the ordinary equity holders of the Company (0.97) (0.47) Weighted average number of ordinary shares to determine diluted (loss)/earnings per share 456,205,911 387,398,255
7 CASH AND CASH EQUIVALENTS
Consolidated Group
2017 $
2016 $
(a) Reconciliation of cash and cash equivalents Cash and cash equivalents comprises: Cash at bank and in hand 2,198,032 164,415 Short-term deposits 1,613 1,000,000
2,199,645 1,164,415
Cash at bank earns interest at floating rates based on daily bank deposit rates. Short-term deposits are made for varying periods of between one day and three months, depending on the immediate cash requirements of the consolidated entity, and earn interest at the respective short-term deposit rates.
Consolidated Group
2017 $
2016 $
(b) Reconciliation of net (loss)/profit after income tax to net cash flows from operating activities
Net (loss)/profit for the year (4,436,046) (1,822,431) Adjustment for: Depreciation and amortisation 39,252 43,835 Exploration expenditure written off 26,652 24,556 Share options expensed 1,777,617 249,807 Consultant share options expensed 292,863 - Diminution /(increase) in value of investment - 163,796 Gain on disposal of investment (6,415) (50,318) Loss on settlement of loan to Aldershot - 30,086 Share of net loss on associate - 42,760 (Increase)/decrease in market value of investments - (30,909) Recognition of provision for non-recovery of loans - (139,201) Non-recovery of loan to related party 397,161 - Changes in assets and liabilities: (Increase)/decrease in trade and other receivables (103,097) (68,721) Increase/(decrease) in trade, other payables and provisions 341,811 390,143 Net cash from/(used in) operating activities (1,670,202) (1,166,597)
Non Cash Financing and Investing Activities In the current year there are no non cash financing and investing activities.

FOR THE YEAR ENDED 30 JUNE 2017
49
8. TRADE AND OTHER RECEIVABLES Consolidated Group
2017 $
2016 $
(a) Current
GST receivable 67,235 19,262 Prepayments 9,907 19,742 Sundry debtors1 242,738 177,779
319,880 216,783 Note: 1. Other receivables are non-interest bearing and generally on 30-90 day terms. An allowance
for doubtful debts is made when there is objective evidence that a trade receivable is impaired. As at 30 June 2017 no amounts are impaired or past due.
Consolidated Group
2017
$ 2016
$
(b) Non-current
Opening balance 63,493 120,742 Loan (repaid by)/advanced to Aldershot Resources Limited - (139,201) Reversal/(increase) of provision on loan to Aldershot Resources Limited - 139,201 Redemption of deposits (20,000) (57,754) Interest (reversed)/earned on term deposit (505) 505 Term deposit for bonds and bonds 42,988 63,493
9. INVESTMENT IN ASSOCIATES Interests that are held in the following associated company
Name Principal Activities
Country of Incorporation Shares Ownership Interest Carrying Amount of
Investments 2017 2016 2017 2016
Aldershot Resources
Ltd
Mineral Exploration Canada Ord - 40.69% - $60,000
Consolidated Group
2017 $
2016 $
(a) Movements during the year in equity accounted investment in associated companies
Balance at the beginning of the year - 341,494 Share of associated company’s loss after tax - (42,760) Share of foreign currency translation reserve of associate
- (58,880)
Share of translation reserve of associate - - Share of fair value reserve of associate - - Recognised value of share based payments of associate
- (16,058)
(Increase in)/reversal of impairment - (163,796) Reclassified to investment held for sale - (60,000) Balance at the end of the year - -
(b) Equity accounted profit/(loss) of associate are broken down as follows
Share of associate’s loss before income tax - (42,760) Share of associate’s income tax expense - -
- (42,760)

FOR THE YEAR ENDED 30 JUNE 2017
50
10. OTHER FINANCIAL ASSETS (CURRENT) Consolidated Group
2017 $
2016 $
Listed shares at fair value
Gascoyne Resources Limited - 33,177 - 33,177
Fair value is based on the market price of the shares at 30 June 2016 (refer to note 18). The shares held in Gascoyne Resources Limited was sold during the financial year.
11. CONTROLLED ENTITIES
Name Country of Incorporation
Percentage interest held
Carrying Amount of parent entity’s
investment
2017 %
2016 %
2017 $
2016 $
Razorback Iron Pty Ltd AUS 100 100 20 20 Razorback Operations Pty Ltd AUS 100 100 20 20 Red Dragon Mining Pty Ltd AUS 100 100 20 20 Ironback Pty Ltd AUS 100 100 100 100
12. PLANT AND EQUIPMENT
Consolidated Group
2017 $
2016 $
Plant and equipment, at cost 365,407 360,981 Less: accumulated depreciation (313,943) (294,369) 51,464 66,612
12. PLANT AND EQUIPMENT CONTINUED
Consolidated Group
2017 $
2016 $
Office equipment, at cost 124,551 114,768 Less: accumulated depreciation (99,170) (89,013) 25,381 25,755 Motor vehicles, at cost 52,070 52,070 Less: accumulated depreciation (48,003) (46,261) 4,067 5,809 Total property, plant and equipment 80,912 98,176 Reconciliations
Reconciliation of the carrying amounts of each class of property, plant and equipment at the beginning and end of the current financial year are set out below: Consolidated Group 2017
$ 2016
$ Plant and equipment Carrying amount at the beginning of the year 66,612 90,979 Additions 4,426 1,528 Depreciation (19,574) (25,895) Carrying amount at the end of the year 51,464 66,612
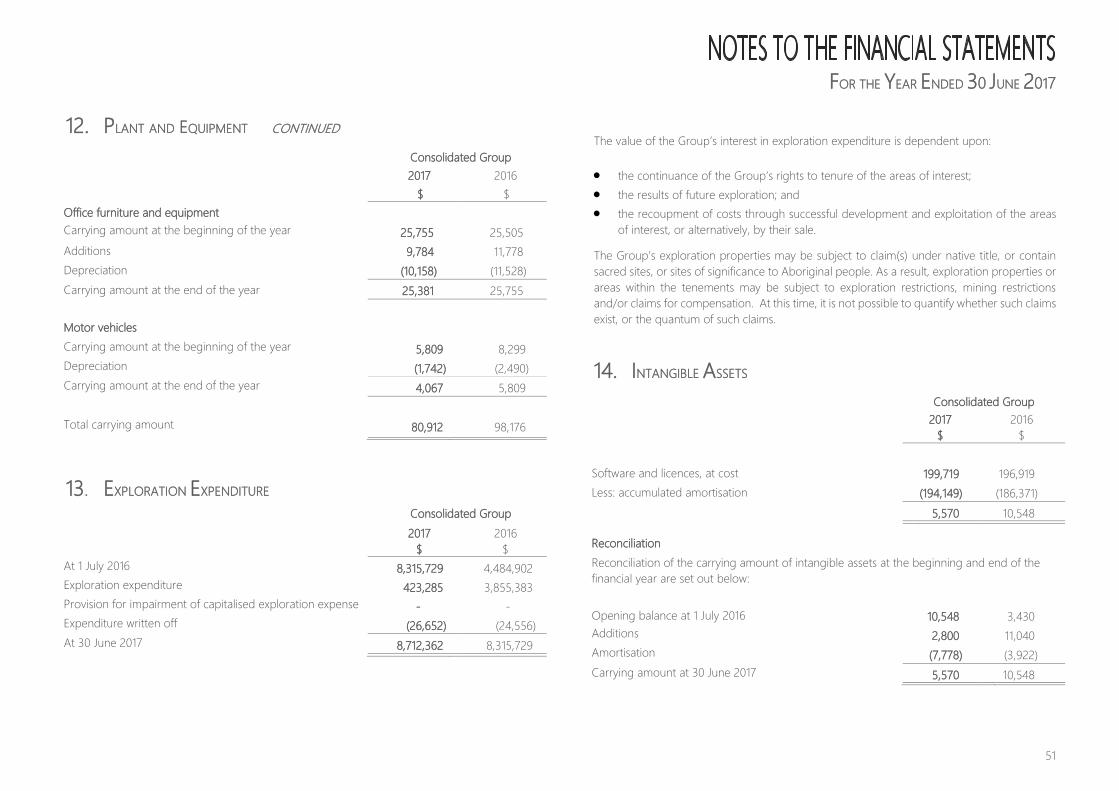
FOR THE YEAR ENDED 30 JUNE 2017
51
12. PLANT AND EQUIPMENT CONTINUED
Consolidated Group
2017
$ 2016
$ Office furniture and equipment Carrying amount at the beginning of the year 25,755 25,505 Additions 9,784 11,778 Depreciation (10,158) (11,528) Carrying amount at the end of the year 25,381 25,755 Motor vehicles Carrying amount at the beginning of the year 5,809 8,299 Depreciation (1,742) (2,490) Carrying amount at the end of the year 4,067 5,809 Total carrying amount 80,912 98,176
13. EXPLORATION EXPENDITURE Consolidated Group
2017 $
2016 $
At 1 July 2016 8,315,729 4,484,902 Exploration expenditure 423,285 3,855,383 Provision for impairment of capitalised exploration expense - - Expenditure written off (26,652) (24,556) At 30 June 2017 8,712,362 8,315,729
The value of the Group’s interest in exploration expenditure is dependent upon: • the continuance of the Group’s rights to tenure of the areas of interest; • the results of future exploration; and • the recoupment of costs through successful development and exploitation of the areas
of interest, or alternatively, by their sale.
The Group’s exploration properties may be subject to claim(s) under native title, or contain sacred sites, or sites of significance to Aboriginal people. As a result, exploration properties or areas within the tenements may be subject to exploration restrictions, mining restrictions and/or claims for compensation. At this time, it is not possible to quantify whether such claims exist, or the quantum of such claims.
14. INTANGIBLE ASSETS
Consolidated Group
2017 $
2016 $
Software and licences, at cost 199,719 196,919 Less: accumulated amortisation (194,149) (186,371) 5,570 10,548 Reconciliation Reconciliation of the carrying amount of intangible assets at the beginning and end of the financial year are set out below: Opening balance at 1 July 2016 10,548 3,430 Additions 2,800 11,040 Amortisation (7,778) (3,922) Carrying amount at 30 June 2017 5,570 10,548

FOR THE YEAR ENDED 30 JUNE 2017
52
15. TRADE AND OTHER PAYABLES (CURRENT)
Consolidated Group
2017
$ 2016
$ Trade payables1 818,782 476,971 Note 1: Trade payables are non-interest bearing and are normally settled on 30-60 day terms
16. PROVISIONS (CURRENT)
Consolidated Group
2017 $
2016 $
Employee benefits 74,846 34,243
17. CONTRIBUTED EQUITY AND RESERVES
(a) Issued and paid up capital
Number of shares 2017
Number of shares 2016
2017 $
2016 $
Ordinary shares 546,294,264 438,329,539 49,631,512 46,249,323 Total 546,294,264 438,329,539 49,631,512 46,249,323
(b) Movement in ordinary shares on issue
Number of shares
Issue price $
Total $
Balance at 30 June 2015 353,979,539 44,519,005 Placement 39,350,000 0.015 590,250 Placement 35,000,000 0.025 875,000 Placement 10,000,000 0.030 300,000 Less transaction costs - - (34,932) Balance at 30 June 2016 438,329,539 46,249,323 Option Conversion 7,400,000 0.020 148,000 Option Conversion 10,000,000 0.017 170,000 Issue of shares 3,846,154 0.039 150,000 Placement 21,004,285 0.035 735,150 Placement 65,714,286 0.035 2,300,000 Less transaction costs - - (120,961) Balance at 30 June 2017 546,294,264 49,631,512

FOR THE YEAR ENDED 30 JUNE 2017
53
(c) Movement in options on issue
Balance at the beginning of the
year
Issued during the year
Exercised during the year
Cancelled during the year
Expired during the year
Balance at the end of the year
Unquoted options exercisable at 4.9 cents, on or before 1 July 2016 2,700,000 - - - (2,700,000) - Unquoted options exercisable at 21 cents, on or before 27 November 2016 6,750,000 - - - (6,750,000) - Unquoted options exercisable at 7 cents, on or before 1 July 2017 1,450,000 - - - - 1,450,000 Unquoted options exercisable at 16 cents, on or before 27 November 2017 6,500,000 - - - - 6,500,000 Unquoted options exercisable at 5 cents, on or before 28 December 2017 - 16,428,572 - - - 16,428,572 Unquoted options exercisable at 2 cents, on or before 7 October 2018 5,300,000 - - - - 5,300,000 Unquoted options exercisable at 10 cents, on or before 31 October 2018 6,500,000 - - - - 6,500,000 Unquoted options exercisable at 2 cents, on or before 12 January 2019 1,000,000 - - - - 1,000,000 Unquoted options exercisable at 4.5 cents, on or before 5 August 2019 - 8,000,000 - - - 8,000,000 Unquoted options exercisable at 2 cents, on or before 26 November 2020 20,000,000 - (7,400,000) - - 12,600,000 Unquoted options exercisable at 2 cents, on or before 26 April 2021 3,000,000 - - - - 3,000,000 Unquoted options exercisable at 4.5 cents, on or before 24 August 2021 - 1,000,000 - - - 1,000,000 Unquoted options exercisable at 2.5 cents, on or before 7 September 2021 - 3,000,000 - - - 3,000,000 Unquoted options exercisable at 2 cents, on or before 30 November 2021 - 20,000,000 - - - 20,000,000 Unquoted options exercisable at 1.7 cents, on or before 30 November 2021 - 10,000,000 (10,000,000) - - - Unquoted options exercisable at 4.4 cents, on or before 30 November 2021 - 10,000,000 - - - 10,000,000 Unquoted options exercisable at 3.7 cents, on or before 30 November 2021 - 10,000,000 - - - 10,000,000 Unquoted options exercisable at 10 cents, on or before 5 December 2021 - 5,000,000 - - - 5,000,000 Unquoted options exercisable at 4 cents, on or before 8 January 2022 - 10,000,000 - - - 10,000,000 Unquoted options exercisable at 4 cents, on or before 5 June 2022 - 3,000,000 - - - 3,000,000 Total 53,200,000 96,428,572 (17,400,000) - (9,450,000) 122,778,572

FOR THE YEAR ENDED 30 JUNE 2017
54
(d) Reserves Consolidated Group 2017
$ 2016
$ Listed option reserve
Balance at the beginning of the year 1,007,941 1,007,941
Proceeds from option issue - -
Balance at the end of the year 1,007,941 1,007,941 Foreign currency Balance at the beginning of the year - 58,880 Foreign currency translation reserve of associate transferred to profit or loss (note 9a) - (58,880) Share of translation reserve of associate - -
Balance at the end of the year - - Share based payments reserve
Balance at the beginning of the year 6,891,935 6,658,186
Value of share based payments to directors and employees 1,777,617 196,563
Value of share based payments to consultants 292,862 53,244 Share based payment reserve of associate transferred to profit or loss (note 9a) - (16,058)
Balance at the end of the year 8,962,414 6,891,935
Total reserves at year end 9,970,355 7,899,876
Listed option reserve This reserve is used to record the proceeds from the issue of listed options, net of expenses of the issue.
Foreign currency translation reserve This reserve is used to record exchange differences arising on transactions of the Group entities that do not have a functional currency of Australian dollars and have been translated into Australian dollars for presentation purposes as described in note 2(v).
Share based payments reserve This reserve is used to record the value of equity benefits provided to directors, employees and consultants as part of their remuneration. Refer note 25 for further details.
Fair value reserve The fair value reserve is to record the movement in the value of the investments held as available for sale.

FOR THE YEAR ENDED 30 JUNE 2017
55
18. FINANCIAL INSTRUMENTS The Group’s principal financial instruments comprise of cash and short term deposits. The main purpose of these financial instruments is to maintain the Group’s operations. The Group has various other financial assets and liabilities such as trade receivables and trade payables. (a) Interest rate risk
The Group is exposed to movements in market interest rates on short term deposits. The policy is to monitor the interest rate yield curve out to 120 days to ensure a balance is maintained between the liquidity of cash assets and the interest rate return. Details of the significant accounting policies and methods adopted, including the criteria for recognition, the basis of measurement and the basis on which income and expenses are recognised, in respect of each class of financial asset, financial liability and equity instrument are disclosed in note 2 to the financial statements
The Group’s exposure to interest rate risk, which is the risk that a financial instrument’s value will fluctuate as a result of changes in market interest rates and the effective weighted average interest rate for each class of financial assets and financial liabilities comprises Floating interest rate Fixed interest rate –
1 year or less Fixed interest rate –
1 to 3 years Non-interest bearing Total
Consolidated 2017
$ 2016
$ 2017
$ 2016
$ 2017
$ 2016
$ 2017
$ 2016
$ 2017
$ 2016
$ Financial assets Cash and cash equivalents 2,047,301 127,075 1,613 1,000,000 - - 150,731 37,340 2,199,645 1,164,415 Trade and other receivables1 - - 22,988 43,493 - - 329,973 217,041 352,961 260,534 Investment held for sale - - - - - - - 60,000 - 60,000 Other financial assets - - - - - - - 33,177 - 33,177 Total financial assets 2,047,301 127,075 24,601 1,043,493 - - 480,704 347,558 2,552,606 1,518,126 Financial liabilities Trade and other payables - - - - - - (818,782) (476,971) (818,782) (476,971) Convertible loan note liability - - - - (2,500,000) (2,500,000) - - (2,500,000) (2,500,000) Total financial liabilities - - - - (2,500,000) (2,500,000) (672,949) (476,971) (3,318,782) (2,976,971) Net financial assets/(liabilities) 2,047,301 127,075 24,601 1,043,493 (2,500,000) (2,500,000) (192,245) (129,413) (766,176) (1,458,845) Weighted average interest rate 0.75% 0.75% 2.06% 2.81% 7% 7%
Note 1: Trade and other receivables excludes prepayments

FOR THE YEAR ENDED 30 JUNE 2017
56
18. FINANCIAL INSTRUMENTS CONTINUED Consolidated Group
2017 $
2016 $
Reconciliation of net financial assets/(liabilities) to net assets
Net financial assets/(liabilities) as above (766,176) (1,458,845) Prepayments (note 8a) 9,907 19,742 Plant and equipment (note 12) 80,912 98,176 Exploration & evaluation expenditure (note 13) 8,712,362 8,315,729 Intangibles (note 14) 5,570 10,548 Provisions (note 16) (74,846) (34,243) Net assets per statement of financial position 7,967,729 6,951,107 The net fair value of all financial assets and liabilities at balance date approximate to their carrying value. (b) Credit risk
Credit risk refers to the risk that a counter party will default on its contractual obligations resulting in financial loss to the Group. The Group has adopted the policy of only dealing with credit worthy counterparties and obtaining sufficient collateral or other security where appropriate, as a means of mitigating the risk of financial loss from defaults. The Group’s primary banker is National Australia Bank, at balance date a majority of all operating accounts are with this bank excluding the short term deposits which are held with other financial institutes. All funds on deposit are placed with reputable counterparties with an “A” credit rating or higher. The carrying amount of financial assets recorded in the financial statements, net of any provisions for losses, represents the Group’s maximum exposure to credit risk.
(c) Net fair value of financial assets and liabilities
The net fair value of the financial assets and financial liabilities approximates their carrying value, except for the fair value of equity investments traded on organised markets which have been valued by reference to the market prices prevailing at balance date for those equity investments. (d) Foreign currency risk
The Group is not exposed to foreign exchange currency risk at balance date. In prior periods the Group was exposed to foreign exchange currency risk primarily due to investment in associate transactions denominated in foreign currency. (e) Liquidity risk
The Group manages its liquidity risk by monitoring its cash reserves and forecast spending. Management is cognisant of the future demands for liquid finance requirements to finance the Group’s current and future operations. (f) Market risk
The Group manages its exposure to market risk by monitoring market conditions and making decisions based on industry experience.

FOR THE YEAR ENDED 30 JUNE 2017
57
18. FINANCIAL INSTRUMENTS CONTINUED
Financial Risk Management
Consolidated 2017 Financial assets
Level 1 $
Level 2 $
Total $
Financial assets at fair value through the profit or loss
Investments held for trading - - - Total - - -
Consolidated 2016 Financial assets
Level 1 $
Level 2 $
Total $
Financial assets at fair value through the profit or loss
Investments held for trading1 33,177 - 33,177 Total 33,177 - 33,177
Note 1: On 14 July 2016, the Company sold its remainder of shares held in Gascoyne Resources Limited for $39,532
Level 1 The fair value of these financial assets has been based on the closing quoted bid prices at reporting date. Level 2 Valuation techniques such as those using comparisons to similar investments for which market observable prices are available have been adopted to determine the fair values of these investments.
19. SENSITIVITY ANALYSIS
(a) Interest rate risk
The following table represents a summary of the interest rate sensitivity of the Group’s financial assets at the balance sheet date on the deficit for the year and equity for a 1% change in interest rates. It is assumed that the change in interest rates is held constant throughout the reporting period.
Consolidated 30 June 2017
Carrying amount
$
Interest rate risk -1%
Interest rate risk + 1%
Net loss $
Equity $
Net gain $
Equity $
Financial assets
Cash and cash equivalents 2,199,645 (21,996) (21,996) 21,996 21,996
Other receivables 22,988 (230) (230) 230 230 Total 2,222,633 (22,226) (22,226) 22,226 22,226
Consolidated 30 June 2016
Carrying amount
$
Interest rate risk -1%
Interest rate risk + 1%
Net loss $
Equity $
Net gain $
Equity $
Financial assets
Cash and cash equivalents 1,127,075 (11,271) (11,271) 11,271 11,271
Other receivables 43,493 (435) (435) 435 435 Total 1,170,568 (11,706) (11,706) 11,706 11,706
The Group also has $2,500,000 in convertible loan notes at a fixed interest rate of 7% per annum.
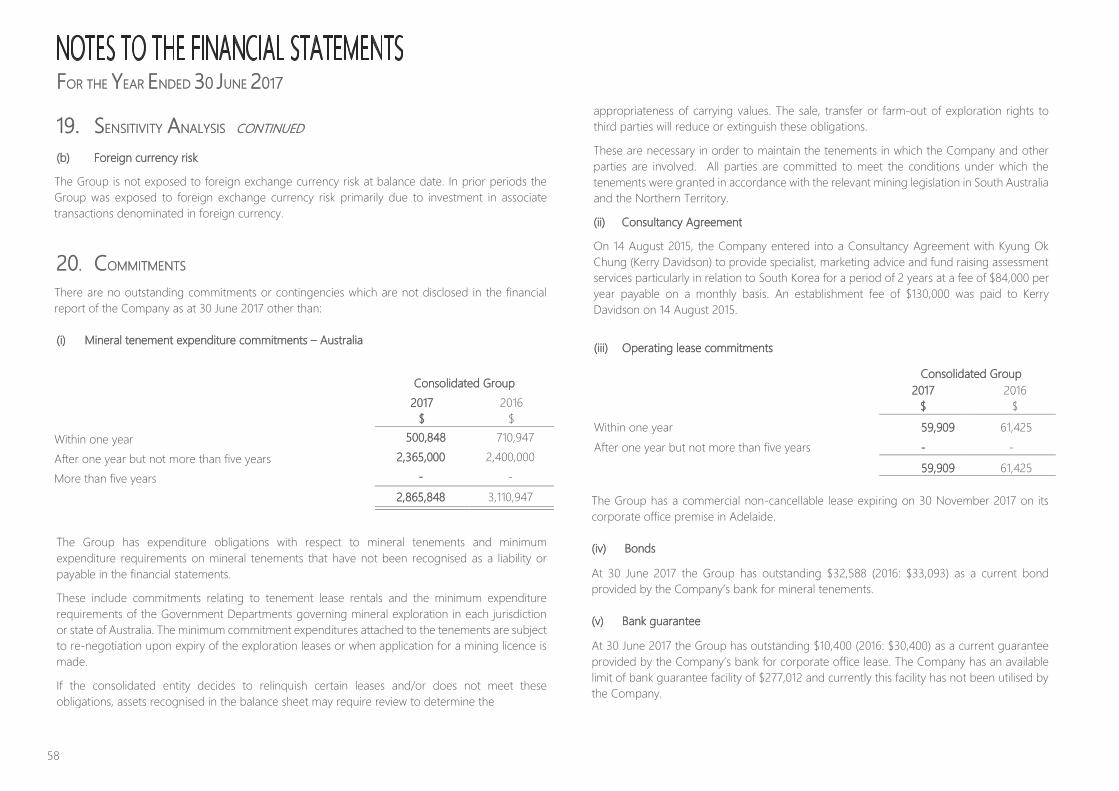
FOR THE YEAR ENDED 30 JUNE 2017
58
19. SENSITIVITY ANALYSIS CONTINUED
(b) Foreign currency risk
The Group is not exposed to foreign exchange currency risk at balance date. In prior periods the Group was exposed to foreign exchange currency risk primarily due to investment in associate transactions denominated in foreign currency.
20. COMMITMENTS There are no outstanding commitments or contingencies which are not disclosed in the financial report of the Company as at 30 June 2017 other than: (i) Mineral tenement expenditure commitments – Australia
Consolidated Group
2017 $
2016 $
Within one year 500,848 710,947
After one year but not more than five years 2,365,000 2,400,000
More than five years - - 2,865,848 3,110,947
The Group has expenditure obligations with respect to mineral tenements and minimum expenditure requirements on mineral tenements that have not been recognised as a liability or payable in the financial statements.
These include commitments relating to tenement lease rentals and the minimum expenditure requirements of the Government Departments governing mineral exploration in each jurisdiction or state of Australia. The minimum commitment expenditures attached to the tenements are subject to re-negotiation upon expiry of the exploration leases or when application for a mining licence is made.
If the consolidated entity decides to relinquish certain leases and/or does not meet these obligations, assets recognised in the balance sheet may require review to determine the
appropriateness of carrying values. The sale, transfer or farm-out of exploration rights to third parties will reduce or extinguish these obligations.
These are necessary in order to maintain the tenements in which the Company and other parties are involved. All parties are committed to meet the conditions under which the tenements were granted in accordance with the relevant mining legislation in South Australia and the Northern Territory.
(ii) Consultancy Agreement
On 14 August 2015, the Company entered into a Consultancy Agreement with Kyung Ok Chung (Kerry Davidson) to provide specialist, marketing advice and fund raising assessment services particularly in relation to South Korea for a period of 2 years at a fee of $84,000 per year payable on a monthly basis. An establishment fee of $130,000 was paid to Kerry Davidson on 14 August 2015.
(iii) Operating lease commitments
Consolidated Group
2017 $
2016 $
Within one year 59,909 61,425 After one year but not more than five years - - 59,909 61,425 The Group has a commercial non-cancellable lease expiring on 30 November 2017 on its corporate office premise in Adelaide. (iv) Bonds
At 30 June 2017 the Group has outstanding $32,588 (2016: $33,093) as a current bond provided by the Company’s bank for mineral tenements. (v) Bank guarantee
At 30 June 2017 the Group has outstanding $10,400 (2016: $30,400) as a current guarantee provided by the Company’s bank for corporate office lease. The Company has an available limit of bank guarantee facility of $277,012 and currently this facility has not been utilised by the Company.

FOR THE YEAR ENDED 30 JUNE 2017
59
21. PARENT ENTITY
2017
$ 2016
$ Financial Position
Assets Current assets 2,519,506 1,474,355 Non-current assets 8,842,011 8,488,126 Total assets 11,361,517 9,962,481 Liabilities Current liabilities (893,628) (511,214) Non-current liabilities (2,500,000) (2,500,000) Net Assets 7,967,889 6,951,267 Equity Issued capital 49,631,512 46,249,323 Accumulated losses (51,633,978) (47,197,932) Reserves Listed option reserve 1,007,941 1,007,941 Share based payments reserve 8,962,414 6,891,935 Total equity 7,967,889 6,951,267 Financial Performance (Loss)/profit for the year after income tax (4,436,046) (1,897,369) Total comprehensive income/(loss) (4,436,046) (1,897,369) Mineral tenement expenditure commitments Within one year 500,848 710,947 After one year but not more than five years 2,365,000 2,400,000 More than five years - - 2,865,848 3,110,947
The commitments relate to the Company and its subsidiaries as the Company funds its subsidiaries’ activities.
22. AUDITOR’S REMUNERATION Consolidated Group
2017 $
2016 $
Audit and review of the financial report of the consolidated entity 42,000 42,000 42,000 42,000
23. RELATED PARTY DISCLOSURES Amounts paid and payable to Thundelarra Limited, in which F DeMarte, M R J Randall are directors and shareholders, in the normal course of business in 2016/2017 for administration purposes totalled $242 (2016: $166) and the balance included in trade creditors is $Nil (2016: $Nil). Amounts received and receivable from Thundelarra Limited in the normal course of business totalled $Nil (2016: $Nil)
Loans advanced to Lodestone Equities Limited total $397,161 (2016: $Nil) at 30 June 2017. This amount is part of a Framework agreement that has been entered with this company on 7 April 2017.
Loans advanced to subsidiary, Razorback Iron Pty Ltd total $26,565,047 (2016: $26,271,662) at 30 June 2017.
Loans advanced to subsidiary, Razorback Operations Pty Ltd total $2,266 (2016: $1,455) at 30 June 2017.
Loans advanced to subsidiary, Red Dragon Mining Pty Ltd total $1,877 (2016: $1,628) at 30 June 2017.
Loans advanced to subsidiary, Ironback Pty Ltd total $3,318,327 (2016: $3,125,932) at 30 June 2017.
Loans advanced to Gordon Toll total $237,344 (2016: $167,284) at 30 June 2017. The total loan amount of $237,344 was repaid by Gordon Toll on 25 August 2017.

FOR THE YEAR ENDED 30 JUNE 2017
60
24. DIRECTORS AND EXECUTIVE DISCLOSURES
(a) Details of directors and key management personnel
Directors
G L Toll Chairman (Executive) F DeMarte Director (Executive) P J Schubert1 Director (Executive) M R J Randall Director (Non-Executive)
Executive
F DeMarte Company Secretary & Chief Financial Officer
Note:
1 P J Schubert was appointed as executive director on 9 December 2016. Consolidated Group (b) Compensation for directors and key management
personnel 2017
$ 2016
$
Short term employee benefits and termination benefits 189,048 165,861
Annual leave provision - - Post-employment benefits 17,960 15,757 Share based payments 1,532,592 140,000 Long service leave - - Total compensation 1,739,600 321,618 (c) Loans to key management personnel
There were no loans to key management personnel during the year. (d) Other transactions and balances with key management personnel and their related parties
Disclosures relating to other transactions and balances with key management personnel are included and set out in note 23.
25. SHARE BASED PAYMENTS Options are granted under the Company employee share option plan (“ESOP”) which was approved by the shareholders on 28 November 2014. The ESOP is available to any person who is a director, or an employee (whether full-time or part-time) of the Company or of an associated body corporate of the Company (“Eligible Person”).
Subject to the rules set out in the ESOP and the listing rules, the Company (acting through the board) may offer options to any eligible person at such time and on such terms as the board considers appropriate.
There are no voting or dividend rights attached to the options. There are no voting rights attached to the unissued ordinary shares. Voting rights will be attached to the unissued ordinary shares when the options have been exercised.
The expense recognised in the income statement in relation to share-based payments during the financial year is disclosed in consolidated statement of comprehensive income.
(a) Directors and Employees Options
The following table illustrates the number and weighted average exercise price of and movements in directors and employees share options issued during the year:
2017 Number
2017 WAEP $
2016 Number
2016 WAEP $
Outstanding at beginning of the year 50,200,000 0.08 32,750,000 0.17 Granted during the year 68,000,000 0.03 26,300,000 0.02 Exercised during the year (17,400,000) 0.02 - - Expired/lapsed during the year (9,450,000) 0.16 (8,850,000) 0.25 Outstanding at the end of the year 91,350,000 0.05 50,200,000 0.08 Exercisable at the end of the year 91,350,000 50,200,000
(i) the weighted average remaining contractual life for the directors and employees options outstanding as at 30 June 2017 is 3.3 years (2016: 2.62 years);
(ii) the weighted average exercise price for options outstanding at the end of the year was $0.05 (2016: $0.08);
(iii) the weighted average exercise price of options granted during the year was $0.03 (2016: $0.02); and
(iv) the fair value of the equity-settled share options granted under the plan is estimated as at the date of grant using a Black-Scholes option pricing model taking into account the terms and conditions upon which the options were granted.

FOR THE YEAR ENDED 30 JUNE 2017
61
(i) Issue of directors’ options
On 30 November 2016 approval was granted at annual general meeting to issue the directors of the Company with 60,000,000 options. During the financial year the Company granted below directors share options. The options were issued at no consideration and carry no dividend or voting rights. The options are not quoted on the Australian Securities Exchange Ltd.
• On 1 December 2016, the Company granted 20,000,000 unquoted options with an exercise price of 2 cents each expiring on 30 November 2021; and
• On 1 December 2016, the Company granted 10,000,000 unquoted options with an exercise price of 1.7 cents each expiring on 30 November 2021; and
• On 1 December 2016, the Company granted 10,000,000 unquoted options with an exercise price of 4.4 cents each expiring on 30 November 2021; and
• On 1 December 2016, the Company granted 10,000,000 unquoted options with an exercise price of 3.7 cents each expiring on 30 November 2021; and
• On 9 January 2017, the Company granted 10,000,000 unquoted options with an exercise price of 4 cents each expiring on 8 January 2022.
(ii) Issue of employee options
During the financial year the Company granted below employee share options.
• On 8 August 2016, the Company granted 8,000,000 unquoted options with an exercise price of 4.5 cents each expiring on 5 August 2019.
(b) Issue of consultant options
During the financial year the Company granted below consultant share options.
• On 25 August 2016, the Company granted 1,000,000 unquoted options with an exercise price of 4.5 cents each expiring on 24 August 2021; and
• On 8 September 2016, the Company granted 3,000,000 unquoted options with an exercise price of 2.5 cents each expiring on 7 September 2021; and
• On 6 December 2016, the Company granted 5,000,000 unquoted options with an exercise price of 10 cents each expiring on 5 December 2021; and
• On 6 June 2017, the Company granted 3,000,000 unquoted options with an exercise price of 4 cents each expiring on 5 June 2022.
25. SHARE BASED PAYMENTS CONTINUED The following table lists the inputs to the model used for the year ended 30 June 2017
Number of options 8,000,000 1,000,000 3,000,000 20,000,000 10,000,000
Share Price at grant date 4.8 cents 4.2 cents 3.8 cents 4.5 cents 4.5 cents Option exercise price 4.5 cents 4.5 cents 2.5 cents 2 cents 1.7 cents Expiry date 5/08/19 24/08/21 7/09/21 30/11/21 30/11/21 Expected life of the option (years)
3 years 5 years 5 years 5 years 5 years
Vesting period (months) - - - - - Dividend yield (%) - - - - - Expected volatility (%) 194% 193% 195% 100% 100% Risk-free interest rate (%) 1.45% 1.54% 1.60% 2.16% 2.16% Fair value of options 3.1 cents 2.8 cents 2.6 cents 2.7 cents 2.7 cents Vesting date Grant date Grant date Grant date Grant date Grant date
Number of options 10,000,000 10,000,000 5,000,000 10,000,000 3,000,000
Share Price at grant date 4.5 cents 4.5 cents 4.5 cents 4.5 cents 5 cents Option exercise price 4.4 cents 3.7 cents 10 cents 4 cents 4 cents Expiry date 30/11/21 30/11/21 5/12/21 8/01/22 5/06/22 Expected life of the option (years)
5 years 5 years 5 years 5 years 5 years
Vesting period (months) - - - - - Dividend yield (%) - - - - - Expected volatility (%) 100% 100% 100% 100% 111% Risk-free interest rate (%) 2.16% 2.16% 2.23% 2.16% 1.90% Fair value of options 2.4 cents 2.4 cents 2 cents 2.4 cents 2.9 cents Vesting date Grant date Grant date Grant date Grant date Grant date

FOR THE YEAR ENDED 30 JUNE 2017
62
25. SHARE BASED PAYMENTS CONTINUED
The following table lists the inputs to the model used for the year ended 30 June 2016
Number of options 5,300,000 20,000,000 1,000,000 3,000,000
Share Price at grant date 1.7 cents 1.3 cents 2.8 cents 2.6 cents Option exercise price 2 cents 2 cents 2 cents 2 cents Expiry date 7/10/18 26/11/20 12/01/19 26/04/21 Expected life of the option (years)
3 years 5 years 3 years 5 years
Vesting period (months) - - - - Dividend yield (%) - - - - Expected volatility (%) 102% 112.3% 212% 194% Risk-free interest rate (%) 1.86% 2.27% 2% 2.23% Fair value of options 0.7 cents 0.7 cents 1.9 cents 1.8 cents Vesting date Grant date Grant date Grant date Grant date
26. CONTINGENT LIABILITIES
As at 30 June 2017, the Company has the following contingent liabilities:
Agreement with Mintech Resources Pty Ltd
Pursuant to a Variation Deed dated 11 August 2015, the Company finalised the acquisition of a 100% interest in EL 5432 (formally EL 4267) covering the Razorback Ridge area on the following terms:
1) The issue of Redeemable Convertible Notes on 31 August 2015 with a face value of $2.5 million (Notes issued on 31 August 2015 - refer to note 27)
2) Resource payments to Mintech calculated at $0.01 per DTR tonne of measured resources (resource payment = tonne of measured resource x $0.01 x [(Average DTR% of Resource tonnes)/100]). DTR means potentially recoverable tonnes of magnetite as determined by the Davis Tube Recovery technique;
3) A Production Payment of $3,000,000 to Mintech within 20 Business Days of the Company receiving payment of at least 95% of the purchase price for the first commercial shipment of Product from the tenement; and
4) A 1% Royalty on the Value of the Product produced from the tenement measured at the “mine gate”.
Agreement with Goldus Pty Ltd
Pursuant to a Variation Deed dated 11 August 2015, the Company has finalised the acquisition of a 100% interest in EL 5180 and EL 5240 which surround the Razorback Ridge area on the following terms:
1) A payment of $350,000 (paid to Goldus on 11 August 2015);
2) A second payment of $420,000 (paid to Goldus on 31 August 2015);
3) Resource payments to Goldus calculated at $0.01 per DTR tonne of measured resources;
4) A Production Payment of $3,000,000 to Goldus within 20 Business Days of the Company receiving payment of at least 95% of the purchase price for the first commercial shipment of Product from the tenements; and
5) A 1% Royalty on the Value of the Product produced from the tenement measured at the “mine gate”.
The Company has also agreed to provide geological and other technical and commercial services for the evaluation of other EL’s held by Goldus and Mintech.

FOR THE YEAR ENDED 30 JUNE 2017
63
26. CONTINGENT LIABILITIES CONTINUED
ATO Garnishee Notice
On 22 August 2017, the Company received correspondence from the Australian Taxation Office (ATO) in relation to a notice pursuant to section 260-5 of the Taxation Administration Act 1953 (Cth) (Notice) that was issued to the Company on 24 June 2016 by the Australian Taxation Office (ATO). The Notice requires the Company to pay to the ATO any money which the Company owes, or may owe in the future, to an identified third party (up to a specified amount). The maximum liability under the Notice (as at the date when the financial report was authorised for issue) is $325,000 relating to amounts which the ATO asserts were payable to it on 31 August 2016 and 31 August 2017 but have not been paid to the ATO. The Company issued shares to the identified third party on 15 December 2016 to satisfy the 31 August 2016 payment. The Company has sought independent legal advice and is communicating with the ATO in relation to the Notice. R&D Tax Incentive Claim for 2014/2015
On 7 September 2017, the Department of industry, Innovation and Science advised the Company that following a review of the Company’s R&D Tax Incentive registration for 2014/2015 financial year, the registration is considered to have a high risk of non-compliance with the eligibility requirements of the programme. The R&D refund for 2014/2015 was an amount of $151,531.80. Following the Company’s request for an explanation for the decision by the DIIS, the Company will then consider whether to request a variation to withdraw the non-compliance activities or consider whether the claimed activities have been misunderstood and provide additional information for a formal assessment of eligibility of the claimed R&D activities. The formal assessment may result in a finding that some or all of the activities are ineligible under the programme and could extend to all years covered by the project.
27. CONVERTIBLE LOAN NOTE LIABILITY
Consolidated Group
2017
$ 2016
$ Convertible Notes 2,500,000 2,500,000 2,500,000 2,500,000
Pursuant to a Variation Deed dated 11 August 2015 with Mintech Resources Pty Ltd, the Company issued Redeemable Convertible Notes on 31 August 2015 with a face value of $2,500,000 on the following terms:
a) the Redeemable Convertible Notes have a 48 month term from the issue date; b) interest of 7% per annum, payable 12 months in arrears on the anniversary from the
issue date; c) at least 5 days before maturity or redemption of the Redeemable Convertible Notes the
Company can elect the: (i) Redeemable Convertible Notes be redeemed by cash equivalent to the face value
of the Redeemable Convertible Notes; (ii) Redeemable Convertible Notes convert into fully paid ordinary shares in the
Company equivalent to the face value of the Redeemable Convertible Notes at a price equivalent to the Company’s VWAP over 90 consecutive days;
(iii) Redeemable Convertible Notes convert into a combination of cash and fully paid ordinary shares as defined in (i) and (ii); or
(iv) Company may extend the maturity date by a single further period of 12 months on a cash payment of $250,000 extension fee to Mintech.

FOR THE YEAR ENDED 30 JUNE 2017
64
28. EVENTS AFTER THE BALANCE SHEET DATE
Since the end of the financial year, the directors are not aware of any other matter or circumstance not otherwise dealt with in this report or the financial statements that has significantly or may significantly affect the operations of the consolidated entity, the results of those operations, or the state of affairs of the consolidated entity in subsequent financial years with the exception of the following, the financial effects of which have not been provided for in the 30 June 2017 financial statements:
• 1,450,000 unquoted employee options with an exercise price of 7 cents each expired on 1 July 2017.
• On 6 July 2017, the Company granted 17,500,000 unquoted employee options with an exercise price of 4 cents each expiring on 5 July 2022.
• On 22 August 2017, the Company received correspondence from the Australian Taxation Office (ATO) in relation to a notice pursuant to section 260-5 of the Taxation Administration Act 1953 (Cth) (Notice) that was issued to the Company on 24 June 2016 by the Australian Taxation Office (ATO). The Notice requires the Company to pay to the ATO any money which the Company owes, or may owe in the future, to an identified third party (up to a specified amount). The maximum liability under the Notice (as at the date when the financial report was authorised for issue) is $325,000 relating to amounts which the ATO asserts were payable to it on 31 August 2016 and 31 August 2017 but have not been paid to the ATO. The Company issued shares to the identified third party on 15 December 2016 to satisfy the 31 August 2016 payment. The Company has sought independent legal advice and is communicating with the ATO in relation to the Notice.
• On 7 September 2017, the Department of industry, Innovation and Science advised the Company that following a review of the Company’s R&D Tax Incentive registration for 2014/2015 financial year, the registration is considered to have a high risk of non-compliance with the eligibility requirements of the programme. The R&D refund for 2014/2015 was an amount of $151,531.80. Following the Company’s request for an explanation for the decision by the DIIS, the Company will then consider whether to request a variation to withdraw the non-compliance activities or consider whether the claimed activities have been misunderstood and provide additional information for a formal assessment of eligibility of the claimed R&D activities. The formal assessment may result in a finding that some or all of the activities are ineligible under the programme and could extend to all years covered by the project.
65
In accordance with a resolution of the directors of Magnetite Mines Limited, I state that: In the opinion of the directors: (a) the financial statements, notes and the additional disclosures included in the directors’ report
designated as audited, of the Company and the consolidated entity are in accordance with the Corporations Act 2001, including:
(i) giving a true and fair view of the consolidated entity’s financial position as at 30 June
2017 and of its performance for the year ended on that date; and (ii) complying with accounting standards and the Corporations Regulations 2001; and
(b) there are reasonable grounds to believe that the Company will be able to pay its debts as and
when they become due and payable. (c) the financial report also complies with International Financial Reporting Standards as described
in note 2(a). This declaration has been made after receiving the declarations required to be made to the directors in accordance with section 295A of the Corporations Act 2001 for the financial year ended 30 June 2017. On behalf of the board
Frank DeMarte DIRECTOR 29 September 2017 Perth, Western Australia
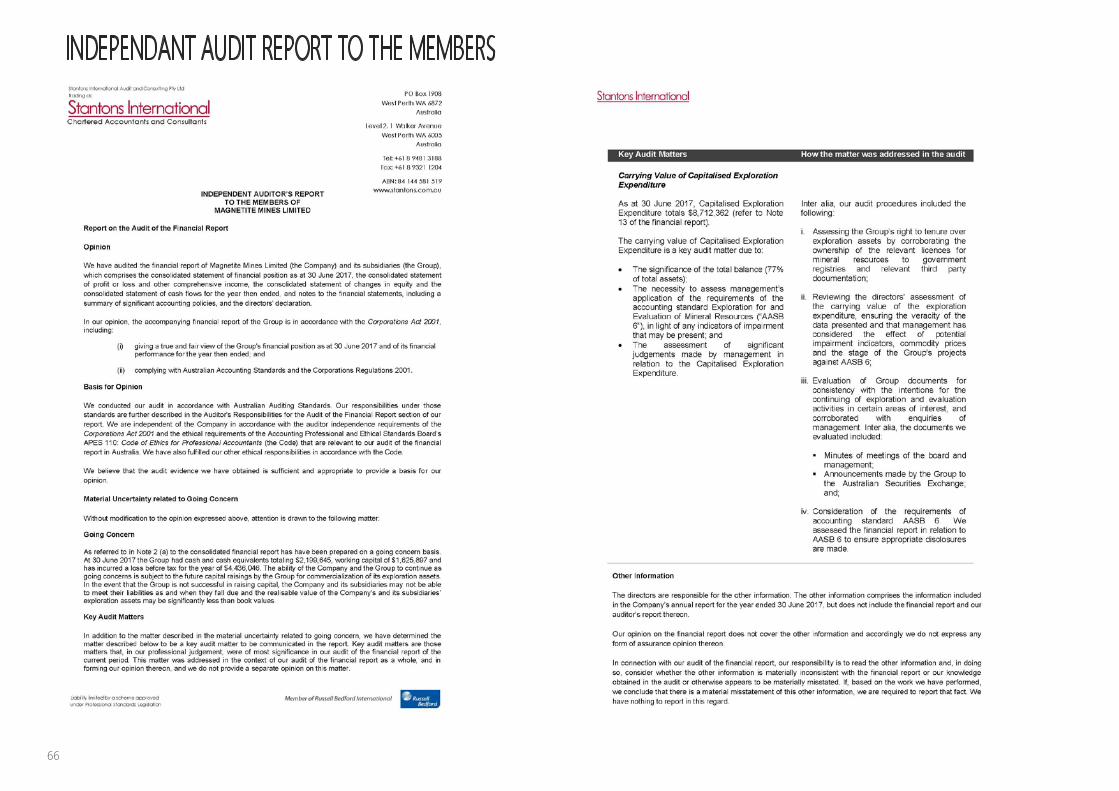
66

67

68

69
The following information dated 25 September 2017 is required by the Listing Rules of the ASX Limited.
1. DISTRIBUTION AND NUMBER OF HOLDER OF EQUITY SECURITIES The number of holders, by size of holding, in each class of security are:
Fully paid ordinary shares
1 – 1,000 478
1,001 – 5,000 560
5,001 – 10,000 241
10,001 – 100,000 817
100,001 and over 400
Totals 2,496
Holding less than a marketable parcel 1,413
2. TWENTY LARGEST HOLDERS OF QUOTED SECURITIES
(a) Ordinary Shares
Shares Held Holder Number % NATIONAL NOMINEES LIMITED 87,222,493 15.97
COFFEE HOUSE GROUP LIMITED 78,476,509 14.37
MANGO BAY ENTERPRISES INCORPORATED 45,065,000 8.25
CITICORP NOMINEES PTY LIMITED 26,736,657 4.89
RAGGED RANGE MINING PTY LTD & ASSOCIATES 24,841,343 4.55
JP MORGAN NOMINEES AUSTRALIA LIMITED 18,016,480 3.30
HSBC CUSTODY NOMINEES (AUSTRALIA) LIMITED 6,407,952 1.17
CHIN NOMINEES PTY LTD 5,750,000 1.05
CHIN NOMINEES PTY LTD 5,521,348 1.01
MR RICK WAYNE CRABB 5,294,362 0.97
FLORYNA PTY LTD 5,000,000 0.92
BNP PARIBAS NOMINEES PTY LTD 4,244,101 0.78
MR ROBERT BRUCE WILLIAMSON & MRS JOCELYN WILLIAMSON 4,148,907 0.76
MR FRANK DEMARTE 3,813,135 0.70
ALCARDO INVESTMENTS LIMITED 3,788,951 0.69
MR WILLIAM JANSEN & MRS MARILYN GAIL JANSEN 3,575,000 0.65
MR SIAT YOON CHIN 3,408,819 0.62
MR MICHAEL ERNEST GRANATA 3,400,000 0.62
THUNDELARRA EXPLORATION LTD 2,872,265 0.53
CVC LIMITED 2,860,000 0.52
Total 340,443,322 62.32

70
3. SUBSTANTIAL SHAREHOLDERS
An extract from the Company’s register of substantial shareholders is set out below:
7. SCHEDULE OF TENEMENTS
Tenement Name Location
Tenement Number and
Type Holder/
Application Share Held Status
Amangal NT EL27354 MGT 100 Granted 2/12/09 George NT EL24550 MGT 100 Granted 12/12/05 Razorback SA EL5180 MGT 100 Granted 17/09/12 Razorback SA EL5240 MGT 100 Granted 10/12/12 Razorback SA EL5432 MGT 100 Granted 22/06/14 Razorback SA EL5902 MGT 100 Granted 01/12/16 Bimbowrie SA EL5962 MGT 100 Granted 12/05/17 Outalpa SA EL5974 MGT 100 Granted 16/06/17
Disposed of during the reporting period
Cooper Hill SA EL5340 MGT 100 Surrendered 07/10/16
Two Sisters* SA EL4842 MGT ILU
0 100 Surrendered 13/03/17
* Rights to explore for iron ore granted during reporting period. (see ASX announcement 29/4/2015)
Key to Tenement Type
EL = Exploration Licence
Key to Holders
MGT = Magnetite Mines Limited ILU = Iluka Resources Limited
Location
SA – South Australia NT – Northern Territory
Name Number of Shares Held %
NATIONAL NOMINEES LIMITED 87,222,493 15.97
COFFEE HOUSE GROUP LIMITED 78,476,509 14.37
MANGO BAY ENTERPRISES INCORPORATED 45,065,000 8.25
4. VOTING RIGHTS The Company’s share capital is of one class with the following voting rights: (a) Ordinary Shares
On a show of hands every shareholder presents in person or by proxy shall have one vote and upon a poll each share shall have one vote. (b) Options
The Company’s options have no voting rights.
5. STOCK EXCHANGE LISTING Magnetite Mines Limited ordinary shares are listed on all member exchanges of the ASX Limited. The home exchange is the ASX Limited.
6. RESTRICTED SECURITIES There are no ordinary shares on issue that have been classified by the ASX Limited, Perth as restricted securities.