corporate income tax, legal form of organization, and ... · chen: econ one research, 1625 shattuck...
TRANSCRIPT
FEDERAL RESERVE BANK OF ST. LOUIS Research Division
P.O. Box 442 St. Louis, MO 63166
______________________________________________________________________________________
The views expressed are those of the individual authors and do not necessarily reflect official positions of the Federal Reserve Bank of St. Louis, the Federal Reserve System, or the Board of Governors.
Federal Reserve Bank of St. Louis Working Papers are preliminary materials circulated to stimulate discussion and critical comment. References in publications to Federal Reserve Bank of St. Louis Working Papers (other than an acknowledgment that the writer has had access to unpublished material) should be cleared with the author or authors.
RESEARCH DIVISIONWorking Paper Series
Corporate Income Tax, Legal Form of Organization, andEmployment
Daphne Chen Shi Qi
and Don Schlagenhauf
Working Paper 2017-021Ahttps://doi.org/10.20955/wp.2017.021
July 2017
Corporate Income Tax, Legal Form of Organization, and Employment
By Daphne Chen, Shi Qi and Don Schlagenhauf ∗
Draft: July, 2017
A dynamic stochastic occupational choice model with heterogeneous agents is de-
veloped to evaluate the impact of a corporate income tax reduction on employment.
In this framework, the key margin is the endogenous entrepreneurial choice of
legal form of organization (LFO). A reduction in the corporate income tax bur-
den encourages adoption of the C corporation legal form, which reduces capital
constraints on firms. Improved capital re-allocation increases overall productive
efficiency in the economy and therefore expands the labor market. Relative to the
benchmark economy, a corporate income tax cut can reduce the non-employment
rate by up to 7 percent.
Since the inception of the corporate income tax in 1909, the appropriateness of this tax as a gov-
ernment revenue instrument has been debated in both the policy and academic arenas. Economists
have invested considerable efforts in understanding the incidence of a corporate income tax as well
as its impact on firm decisions. Over the last few years, concerns with the corporate income tax
have been focused on its potential negative effects on employment. Politicians have suggested that
a cut in the corporate income tax rate could be an engine for job creation. This paper addresses
the question “Will a decline in the corporate income tax generate jobs?”
The economic literature on the corporate income tax is voluminous.1 Much of the literature
views the corporate income tax as a tax on capital. The main focus of early works is to identify
the incidence of the tax burden on factor inputs. This is exemplified by Harberger (1962)’s seminal
paper, as well as Feldstein (1978), Feldstein and Slemrod (1980), and Shoven (1976). A capital tax is
∗ Chen: Econ One Research, 1625 Shattuck Ave Suite 200, Berkeley, CA, 94706, dchen@econone. Qi: Economics Department,College of William and Mary, P.O. Box 8795 Williamsburg, VA 23187, [email protected]. Schlagenhauf: Federal Reserve Bank ofSt. Louis, St. Louis, MO 63102, [email protected]. We acknowledge the useful comments of Juan Carlos Conesa, CarlosGarriga, Ellen McGrattan, Victor Rios-Rull, and seminar participants at the Federal Reserve Bank of Cleveland, Universityof Toronto, University of Connecticut, the 2012 and 2013 Midwest Macroeconomics Meetings, the 2013 Society for EconomicDynamics Meetings, and the 2014 North American Econometric Society Summer Meetings as well as two anonymous refereesand the editor, Richard Rogerson. The views expressed in this article are those of the authors and do not necessarily reflectthe views of the Federal Reserve System, the Board of Governors, or the regional Federal Reserve Banks. Any errors are solelyour own.
1See Auerbach (2006) for a more comprehensive overview of this literature.
1

2
inherently distortionary, and the literature finds that lowering the corporate income tax can improve
economic efficiency. However, it is often assumed, as is the case in Harberger (1962), that the
existence of the corporate income tax does not affect the aggregate labor and capital supply in the
economy. The earlier literature pays less attention to how the corporate income tax affects aggregate
factor supplies in the economy, in particular the aggregate labor supply. Moreover, some of the
early work, such as Bradford (1981), Jorgenson (1963), and King and Fullerton (1984), examine
the treatment of capital depreciation, investment incentives, dividends, and capital gains. Among
them, Stiglitz (1976) stresses that some of the costs associated with corporate capital financing,
such as interest payments on debts, are corporate tax deductible. Stiglitz argues that, without
uncertainty, the corporate income tax becomes non-distortionary in this institutional context. So
a natural question arises: “How can a corporate income tax reduction generate additional jobs?”
In this paper, we argue that a reduction in the corporate income tax can result in job growth,
even when this tax is treated as a tax on pure corporate profit (i.e., all labor and capital costs
are tax deductible). To evaluate the potential employment effect of a corporate income tax, this
paper develops a dynamic stochastic occupational choice model with heterogeneous agents. Agents
in the economy are able to choose between being non-employed, a worker, or an entrepreneur.
Model dynamics are introduced in a manner similar to Hopenhayn and Rogerson (1993), which
allow consideration of firm entry, exit, and size distribution. In addition, the model considers the
corporate income tax implications of job creation, destruction, and reallocation across firms.
Two key elements allow the model to generate employment effects. The first key margin is a
firm’s choice of the legal form of organization (LFO). A firm chooses to be either a pass-through
business or a C corporation. The motivation to include the LFO choice is that this decision can
have important implications for employment, productivity, and growth of a firm. In the United
States, 75 percent of the firms were of the pass-through legal form in 2011, and they hired nearly
half of all workers. Pass-through firms include sole proprietorships, partnerships, limited liability
firms, and S corporations. Although many legal differences exist between the pass-through legal
form and the C corporation legal form, our model focuses on the essential trade-off a firm must
face when choosing the LFO. A disadvantage of a firm filing as a C corporation is that the firm is
subject to double taxation. A C corporation must pay the corporate income tax on its corporate
profits. If remaining profits are distributed to shareholders, these profits are subject to the personal
income tax. On the other hand, if a firm files as a pass-through entity, all profits are passed through
to the business owners who are subject only to the personal income tax. The LFO choice also has
implications for the access to capital. Pass-through entities are subject to legal restrictions on

VOL. NO. 3
access to capital. Legally, a pass-through entity can have no more than 100 shareholders and no
foreign, institutional, or corporate shareholders. This type of firm cannot issue preferred stock,
which limits its ability to attract “deep-pocket” investors such as venture capitalists. Given these
restrictions, pass-through businesses are more likely to be capital constrained compared with C
corporations. Data are examined across industry sectors and firm size classes to provide evidence
that capital constraints indeed differ by LFO.
To understand the importance of endogenizing the choice of LFO, consider a representative firm
faced with fixed input factor prices in a static perfectly competitive environment. If the firm is a
pass-through entity and not subject to the corporate income tax, a change in the corporate income
tax rate would not impact the firm’s hiring decisions. If the firm is organized as a C corporation and
all capital and labor costs are tax deductible, a change in the corporate income tax rate does not
distort the relative input prices of capital and labor. In this situation, the firm’s output level and
employment decisions are not affected in the static environment. However, if the firm is allowed to
choose between LFO, a reduction in the corporate income tax rate would encourage a pass-through
firm to become a C corporation in an environment of a high corporate income tax rate. As a
result of the change in LFO, this firm would have additional access to capital, allowing expansion
of operations and hiring of additional workers.2
A second key element in the model is individual heterogeneity. Similar to Lucas (1978), agents in
the model economy are heterogeneous in both productivity and asset holdings. Productivity evolves
according to an exogenous first-order Markov process, while asset saving decisions are endogenous
in the model. An agent makes occupational decisions after knowing his current productivity shock
and asset holdings. Hence, there is no uncertainty over occupational choice in the current period.
Because of these heterogeneities, the corporate income tax can distort individual occupational
decisions.
A distortion in the occupational decision can impact the allocation of capital among firms in the
economy. Ideally, marginal products of capital should be equalized across all firms in the economy.
This means, more-productive firms would utilize more capital than less-productive firms. In our
model, entrepreneurs finance their operations either by using personal wealth or by accessing the
external capital market. More-productive entrepreneurs, with small individual personal wealth, are
more likely to be capital constrained without external capital. If these firms choose the pass-through
2A firm’s ability to change LFO is an empirically important margin. For example, the State of Kansas enacted a taxcut package that eliminated the state income tax on pass-through entities in 2012. From 2012 to 2014, 393,814 entities tookadvantage of this tax policy change. As a result, the total pass-through income reported by those entities had increased by11%. This indicates that LFO decisions are responsive to income tax rate changes. (See ”Testimony: Reexamining Kansas’Pass-through Carve-out,” Tax Foundation, January 19, 2017.)

4
legal form to avoid double taxation, their access to a wider set of capital markets could be restricted.
A high corporate income tax rate can cause an inefficiency by leaving some high marginal-return-
to-capital firms without sufficient access to capital. The higher the corporate income tax rate, the
more severe such capital misallocation would become. Because access to capital is central in our
analysis of the employment effect, a distortion in capital allocation, caused by the corporate income
tax, would impact the overall labor demand in the economy.
In addition, a reduction in the corporate income tax can lead to the entry of new C corporations.
This happens when workers with managerial talents, faced with a lower corporate income tax, decide
to become C corporate entrepreneurs. From this perspective, the corporate income tax is effectively
a tax on entrepreneurship, and it is an entry deterrent on firms.3 Empirically, the jobs generated
by new entry firms can be important for the long-term labor market outlook. Haltiwanger, Jarmin
and Miranda (2013) finds that younger firms, conditional on survival, are the key to employment
growth compared with mature firms. While the new entry firms positively affect labor demand,
they would also have, albeit more subtle, impacts on labor supply. As some workers leave the
labor market to become entrepreneurs, labor supply in the economy would inevitably be negatively
affected. This necessarily creates job openings to be filled by previously non-employed agents in
the economy.
The model is calibrated to match key economic statistics such as the non-employment rate, the
wealth distribution, and measures relating to the size distribution of firms and firm dynamics. Using
the calibrated model, this paper quantitatively evaluates the impact that lowering the corporate
income tax rate has on firm LFO choices, economic output, consumption, capital utilization, wealth
distribution, and welfare, as well as employment and aggregate productivity. A series of policy
experiments are conducted with respect to the corporate income tax rate. The policy changes
are assumed to be revenue neutral, so the government must adjust the personal income tax to
offset changes in revenue from the corporate income tax. With a lower corporate income tax rate,
a significant fraction of firms switch from pass-through entities to C corporations. These firms,
facing less severe capital constraints, increase in size and hire additional workers. Due to changes
in LFO and new entry, the fraction of C corporations in the economy would increase significantly.
If the corporate income tax is eliminated, the fraction of C corporations in the economy would
increase by more than 20 percentage points compared with the calibrated benchmark economy.
The fraction of employment by pass-through entities would be dwarfed by that of C corporations,
3The model reflects the recent developments in the literature on small business, where Hurst and Pugsley (2011) show asignificant fraction of entrepreneurs choose to own businesses due to non-pecuniary reasons and never intend to grow their firms.Precisely, the model includes a non-pecuniary benefit for entrepreneurs owning their own businesses.

VOL. NO. 5
which would hire about 94 percent of all workers in the economy. Because a higher fraction of firms
have better access to capital, the economy experiences an increase in output, consumption, and
capital formation. The decline in the corporate income tax burden does increase the wealth gap.
The increase in the wealth Gini coefficient is about 2 percent.
As expected, a reduction in the corporate income tax rate leads to moderate job growth. An
increase in aggregate labor demand raises the effective wage level in the economy, which leads to
more employment. If the corporate income tax would be eliminated, the model predicts that the
non-employed population would decrease from 34.1 percent to 31.7 percent, about a 7 percent fall
in the relative non-employment rate. Interestingly, productivity misallocation due to distortions in
occupational choice is relatively moderate. With the elimination of the corporate income tax, total
factor productivity (TFP) would increase by about 0.9 percent.
A welfare analysis is conducted to examine various corporate income tax regimes. A reduction
in the corporate income tax rate does not always improve welfare. This is a result of the revenue
neutrality assumption. A decrease in the corporate income tax rate can result in an increase in
the personal income tax rate to compensate for the loss of the corporate income tax revenue. This
creates a negative impact on economic welfare. Similar to Fehr et al. (2013), we find that the lower
corporate income tax rate leads to increases in output, capital, consumption, and wages. They find
that a cut of the tax rate to 9 percent can maintain revenue neutrality. We find that a cut of the
tax rate to about 10 percent maximizes average economic welfare. With the tax cut, the widening
of the corporate income tax base allows the government to maintain revenue neutrality without
large increases in the personal income tax burden. In the meantime, workers have improved welfare
as after-tax wages are higher, and C corporate entrepreneurs are better off because of the reduced
corporate income tax liability. Therefore, an overwhelming majority of the population would be in
favor of the corporate income tax cut.
The findings in this paper contribute to the literature on the corporate income tax. This paper
shows that corporate tax policy is intimately linked to the employment rate in the economy, par-
ticularly through its impact on the LFO choice. A large portion of the literature on the corporate
income tax treats this tax as a tax on capital income. The effect on labor demand comes from the
distortion of relative input factor costs. The literature has pointed out that a capital tax can affect
per capita hours worked in the economy. For example, taking a comprehensive view, McGrattan
(2012) includes all types of capital taxes paid by businesses. She finds that changes in tax rates
on dividend income and undistributed profits had a particularly large effect on investment and
consequently hours worked during the Great Depression. This paper takes a simpler view of the

6
corporate income tax. All capital costs are fully deductible in our model, so the direct distortion
of the tax on relative input factor costs within a firm is minimal. This allows us to focus on the
distortion of the corporate income tax on the LFO choice. This distortion can have a large impact
on the employment level in the economy. In particular, the non-employment rate reduction due to a
corporate income tax cut can be more than twice as large if our model takes into full consideration
entrepreneurs’ endogenous LFO choices.
Because our results rely heavily on entrepreneurial choices of the LFO, this paper also relates
to the literature on how organization form responds to the corporate income tax policy. Earlier
works, such as Harberger (1962), have a fixed demarcation between corporate and non-corporate
sectors. While not allowing choices over organizational forms, Bradford (1978) and Harberger
(1995) argue that raising the corporate tax causes capital outflow, leaving abundant amounts of
labor, and hence reduces the equilibrium pre-tax wage. Gravelle and Kotlikoff (1989), noticing the
deficiency of this approach, endogenize the choice of organizational form. Later works, such as
Gordon and MacKie-Mason (1994), Gordon and Slemrod (2000), Kotlikoff and Miao (2010), and
Mackie-Mason and Gordon (1997) follow this trend and explicitly allow incorporation decisions
in the model. The mechanisms through which the corporate income tax affects incorporation
decisions can be different. For example, Kotlikoff and Miao (2010) show that the corporate income
tax impacts entrepreneurs’ incorporation decisions by affecting business risk sharing. Similar to
Gordon and MacKie-Mason (1994) and Mackie-Mason and Gordon (1997), firms in our model
do not choose to incorporate to avoid the burden of double taxation. In their papers, firms’
incorporation decisions hinge upon the income tax progressivity. In contrast, in this paper, firms
choose to incorporate because pass-through businesses are more likely to be capital constrained
compared with C corporations. Empirically, Gordon and MacKie-Mason (1994), Goolsbee (1998),
and Mackie-Mason and Gordon (1997) have generally found no major shifts between organizational
forms in response to tax changes. One reason is that the historical variation in federal corporate tax
rates had been almost negligible. The notable exception is Goolsbee (2004), who uses cross-sectional
variation in state corporate tax rates to measure the organizational response. The predicted LFO
changes in response to changes in the corporate income tax rate in this paper is in line with the
findings in Goolsbee (2004).4
The main mechanism through which our model generates an employment effect is the lessening of
4Employing the Gruber and Saez (2002) bunching approach to examine the elasticity of the corporate tax income in theUnited Kingdom, Devereux, Liu and Loretz (2014) examine the decision on whether to declare firm income as either corporateprofit or personal income in response to the corporate income tax rate change. They find the elasticity of the share of incomerecorded as corporate profits is small and positive with respect to the difference between personal and corporate income taxrates. This is indirect evidence of an organizational response due to a change in the corporate income tax rate.

VOL. NO. 7
restrictions on firms’ access to capital. In this vein, our paper shares similarity to the strand of the
literature that includes Anagnostopoulos, Carceles-Poveda and Lin (2012), Chetty and Saez (2005),
and Gourio and Miao (2010), who examine the effect of dividend and capital gain tax reforms in
2003. These papers enrich the understanding of how double taxation on corporate earnings affects
investment efficiency. Gourio and Miao (2010), for example, show that cutting dividend tax and
capital gains tax increases aggregate productivity due to reducing the friction in the reallocation
of capital across firms. Cutting taxes in their setting encourages firms to issue more equity and
break away from liquidity constraints, while cutting taxes in our setting encourages firms to switch
LFO and gain wider access to capital. The respective focuses of those papers are very different
from the focus of this paper. While the aforementioned papers focus on investment efficiency, this
paper focuses on employment and organizational form responses. However, this paper does share
a similar feature - namely, firm heterogeneity plays a central role in the analysis. The existence
of heterogeneity makes it possible that more-efficient capital allocation can improve aggregate
productivity.
In analyzing overall economic productivity, our paper also contributes to the literature on pro-
ductivity misallocation across heterogeneous firms. There is a long strand of papers studying
how productivity misallocation can potentially affect firm employment decisions. One example is
Hopenhayn and Rogerson (1993), who find that a firing tax can distort the allocation of labor
across firms, and this can lead to a TFP loss of 5 percent. Also related to our paper, Guner,
Ventura and Xu (2008) use a version of the Lucas (1978) model to study size-dependent policies
and misallocation. Empirically, many recent papers, such as Hsieh and Klenow (2009), Midrigan
and Xu (2014), and Restuccia and Rogerson (2008), have estimated TFP losses due to productivity
misallocation. From this perspective, our paper shares similarities with two papers.5 Erosa (2001)
shows financial costs of raising capital can affect entrepreneurial occupational choice and therefore
cause misallocation of financial assets. In our paper, the corporate income tax has a similar role
in distorting LFO choices. Midrigan and Xu (2014) study and evaluate how financial friction can
determine TFP. Importantly, our paper, as in Midrigan and Xu (2014), incorporates two channels
through which TFP can be affected by capital market imperfection. In our model, the corporate
income tax first distorts firm entry decisions and second generates dispersion in marginal returns
to capital across existing firms of different tightness of capital constraints. Interestingly, because
of these two channels, we find that the effect of a reduction on the corporate income tax on overall
5Many other papers also document the implications of credit market imperfection and TFP - for example, Amaral andQuintin (2010), Buera, Kaboski and Shin (2011), and Caselli and Gennaioli (2013). See Restuccia and Rogerson (2013) for amore detailed overview.

8
economic efficiency is non-monotone. On one hand, a reduction in the corporate income tax rate
encourages existing firms to adopt the C corporation legal form and reduces productivity misal-
location through loosening capital constraints. On the other hand, the reduction in the tax rate
induces entry by low-productivity firms, hence causing sizable efficiency loss. Because of the two
counter-balancing forces, we find that the elimination of the corporate income tax has a relatively
small overall effect on TFP, an increase of only about 0.9 percent.
The remainder of the paper is organized as follows. Section I presents the model and defines a
stationary equilibrium. Section II lends empirical support to the modeling of capital constraints.
Section III details the calibration procedure and analyzes the calibration results of the benchmark
model. Section IV considers policy experiments, discusses the implications on employment and
productivity, analyzes the importance of LFO choices, and provides welfare analyses. Section V
concludes.
I. The Model
In this paper, a dynamic stochastic occupational choice model is developed. Time is discrete
and infinite, indexed by t = 0, 1, 2, ....6 The economy consists of a unit measure of heterogeneous
agents, a financial intermediary and a government. Next, the decisions of each type of agent in the
model is described, and then the stationary equilibrium is defined.
A. Agents
Agents are heterogeneous in their productive talents and asset holdings. They can choose between
being non-employed, a worker, or an entrepreneur. An entrepreneur can decide whether to operate
the firm as a pass-through business or as a C corporation.
Each agent is endowed with one unit of time that can be allocated between work n and leisure
l = 1 − n. The work-leisure decision is discrete. Either an agent works full time n = n or spends
all the time in leisure n = 0. Agents discount the future at rate β ∈ [0, 1].
Agent heterogeneity is reflected through the agent’s state variables, which include the agent’s pro-
ductivity z and asset level a. Productivity evolves according to an exogenous first-order Markov
process that is independent across agents, where ρ(z′|z) denotes the probability of receiving pro-
ductivity z′ tomorrow conditional on today’s productivity being z.
While productivity evolves exogenously, agents make asset holding decisions endogenously. Each
period, after observing current productivity z and asset level a, an agent decides on the asset
6For notational convenience, we suppress the time subscript t in the following model description.

VOL. NO. 9
holding next period a′. There is a non-borrowing constraint such that a′ must be non-negative.
The interest rate for asset savings is r.
Agent occupational choice decision χ is defined over a set of choices. An agent can alternatively
choose to be non-employed, in which case χ = N, become an employed worker, χ = E, or be an
entrepreneur. The entrepreneurship decision, depending on both agent productivity z and asset
level a, is modeled similar to Cagetti and De Nardi (2006) and Quadrini (2000). In addition, this
model allows for LFO choices. An entrepreneur can organize a firm as a pass-through entity, then
χ = P, or as a C corporation, in which case χ = C. At the beginning of a period, agents make
occupational decisions after observing their current-period state variables z and a.
An agent’s occupational choice also determines labor supply n. If an agent decides to be non-
employed, χ = N , then all time is allocated to leisure and n = 0. Otherwise, for χ ∈ {E,P,C}, an
agent is assumed to work full time, or n = n.
Agent preference u(c, n, ι) depends on current consumption level c, working hours n, and en-
trepreneurial choice ι. In particular, we assume agents value consumption c, leisure 1− n, and the
opportunity to be an entrepreneur. The utility function takes the form
u(c, n, ι) = v(c, n) + ι · η.
The indicator ι shows whether or not an agent is an entrepreneur. If ι = 0, an agent is either
non-employed or a worker. On the other hand, ι = 1 indicates that the agent is operating either a
pass-through entity or a C corporation. Entrepreneurship is accompanied by a constant increase in
utility η ≥ 0 . Hurst and Pugsley (2011) refers to this additional utility as the agent’s non-pecuniary
benefits from owning a business. This aids in explaining the empirical pattern first documented by
Hurst and Pugsley (2011) that a large number of small businesses never intend to grow larger. For
the purpose of this paper, the magnitude of η is calibrated to match the size distribution of firms
in the model economy.
All agents, regardless of occupational types, are subject to a personal income tax. If m is taxable
personal income, then the total tax is given by a personal income tax function T p(m). C corporate
profits are subject to a corporate income tax. If π is the C corporate profit, then the total tax is
given by a corporate income tax function T c(π).
We next describe the agent’s problem under each of the occupations χ ∈ {N,E, P,C}.

10
Non-employed Agent. — An agent, choosing to be non-employed, receives a lump-sum transfer,
b, from the government each period. This transfer and any interest income earned, ra, are subject
to the personal income tax.
An agent’s value function depends on productivity z and asset level a. If an agent is non-employed,
the post-occupational-choice value function is denoted as WN (z, a), which is given by
WN (z, a) = maxc≥0,a′≥0
u(c, 1, 0) + βEz′|zV (z′, a′)(1)
subject to: c = (b+ ra)− T p(b+ ra) + a− a′.
Employed Worker. — If an agent decides to become an employed worker, he earns a wage w on
effective labor zn. Total income of this agent is comprised of earnings wzn and interest income
ra. Both sources of income are subject to the personal income tax. The workers’ value function,
WE(z, a), is defined as
WE(z, a) = maxc≥0,a′≥0
u(c, 1− n, 0) + βEz′|zV (z′, a′)(2)
subject to: c = (wzn+ ra)− T p(wzn+ ra) + a− a′.
Entrepreneur. — The income of an entrepreneur depends on the firm’s profit generated from
production activities. All entrepreneurs have the same production function F (z, k, l), which is
increasing in productivity z, capital k, and labor l. Firms hire labor at wage rate w. Capital
costs include both costs of depreciation and opportunity cost. Capital depreciates at rate δ. The
opportunity cost of using a unit of capital is r, which is the return to saving a unit of asset. A
firm’s profit in a given period is defined as
π(z, k, l) = F (z, k, l)− (r + δ)k − wl.
An entrepreneur can operate a firm either as a pass-through business or a C corporation. The
choice of LFO depends on two essential differences. First, the profits of C corporations are subject
to both the corporate income tax and the personal income tax, while the profits of pass-through
businesses are passed through to their owners and only subject to the personal income tax. Double
taxation is a clear disadvantage of electing the C corporation legal form. On the other hand, C
corporations face less restriction on accessing capital. Empirical evidence supporting this claim is
presented in Section II.

VOL. NO. 11
An entrepreneur self-finances the capital input of the firm or receives external capital from an
financial intermediary. Firms receive external financing offers in a probabilistic fashion. The
advantage of being a C corporation is that the chance of a C corporation receiving external financing
offers (ϕc) is higher than that of a pass-through business (ϕp). We assume, upon receiving the offer,
an entrepreneur can raise as much external capital as the firm requires. A firm without an external
financing offer must self-finance all the firm’s capital input, so k ≤ a.
This difference between external financing probabilities ϕc and ϕp is a key feature in our model.
The difference in ϕc and ϕp is intended to capture the varying capital constraints faced by firms
of different LFO. The value of ϕ is strictly between zero and 100 percent, which indicates that
firms can access external financing but the access is not unlimited. In our framework, when the
difference between ϕc and ϕp is large enough to overcome the disadvantage of double taxation,
some entrepreneurs, especially those with high managerial talent z and limited personal wealth,
would find it optimal to elect the C corporation legal form for their businesses.
Next, optimization problems for both the pass-through and the C corporate entrepreneurs are
specified.
A Pass-through Entrepreneur is not subject to the corporate income tax. However, both en-
trepreneurial and interest incomes are subject to the personal income tax. If a pass-through firm
self-finances, the value of an entrepreneur is
WP,self (z, a) = maxc≥0,a′≥0,k≥0,l≥0
u(c, 1− n) + βEz′|zV (z′, a′)(3)
subject to: c = (π(z, k, l) + ra)− T p(π(z, k, l) + ra) + a− a′;
k ≤ a.
On the other hand, if a pass-through firm receives external financing, the entrepreneur no longer
faces the capital constraint k ≤ a. The value of the entrepreneur is
WP,ext(z, a) = maxc≥0,a′≥0,k≥0,l≥0
u(c, 1− n) + βEz′|zV (z′, a′)(4)
subject to: c = (π(z, k, l) + ra)− T p(π(z, k, l) + ra) + a− a′.
The ex-ante value function of a pass-through business before knowing whether it is offered an
12
external financing opportunity is
(5) WP (z, a) = (1− ϕp)WP,self (z, a) + ϕpWP,ext(z, a).
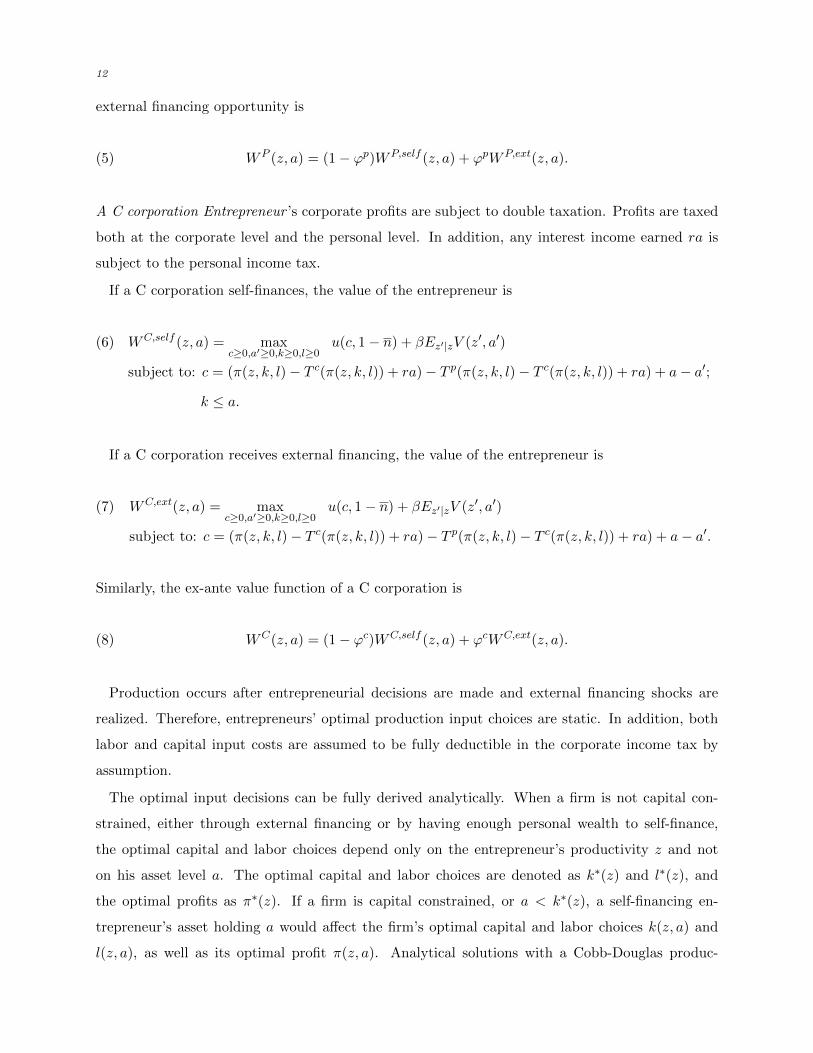
A C corporation Entrepreneur ’s corporate profits are subject to double taxation. Profits are taxed
both at the corporate level and the personal level. In addition, any interest income earned ra is
subject to the personal income tax.
If a C corporation self-finances, the value of the entrepreneur is
WC,self (z, a) = maxc≥0,a′≥0,k≥0,l≥0
u(c, 1− n) + βEz′|zV (z′, a′)(6)
subject to: c = (π(z, k, l)− T c(π(z, k, l)) + ra)− T p(π(z, k, l)− T c(π(z, k, l)) + ra) + a− a′;
k ≤ a.
If a C corporation receives external financing, the value of the entrepreneur is
WC,ext(z, a) = maxc≥0,a′≥0,k≥0,l≥0
u(c, 1− n) + βEz′|zV (z′, a′)(7)
subject to: c = (π(z, k, l)− T c(π(z, k, l)) + ra)− T p(π(z, k, l)− T c(π(z, k, l)) + ra) + a− a′.
Similarly, the ex-ante value function of a C corporation is
(8) WC(z, a) = (1− ϕc)WC,self (z, a) + ϕcWC,ext(z, a).
Production occurs after entrepreneurial decisions are made and external financing shocks are
realized. Therefore, entrepreneurs’ optimal production input choices are static. In addition, both
labor and capital input costs are assumed to be fully deductible in the corporate income tax by
assumption.
The optimal input decisions can be fully derived analytically. When a firm is not capital con-
strained, either through external financing or by having enough personal wealth to self-finance,
the optimal capital and labor choices depend only on the entrepreneur’s productivity z and not
on his asset level a. The optimal capital and labor choices are denoted as k∗(z) and l∗(z), and
the optimal profits as π∗(z). If a firm is capital constrained, or a < k∗(z), a self-financing en-
trepreneur’s asset holding a would affect the firm’s optimal capital and labor choices k(z, a) and
l(z, a), as well as its optimal profit π(z, a). Analytical solutions with a Cobb-Douglas produc-

VOL. NO. 13
tion function F (z, k, l) = zkγlθ are presented in Appendix A. In the appendix, we show that
π(z, a) = (1−θ)κγ
1−θ−γκ1−θ−γ π∗(z), where κ = min{a/k∗(z), 1} measures the tightness of a firm’s capital
constraint. Firms with relatively high z or relatively low a have relatively low κ and are more
capital constrained. A low κ leads to lower profits, so this type of firm benefits more from having
external financing and is more likely to choose the C corporation legal form.
Value Function. — In the beginning of a period, given productivity z and asset position a, an
agent makes the occupational decision that maximizes the ex-ante value function over different
choices of being non-employed, an employed worker, a pass-through entrepreneur, or a C corporate
entrepreneur:
(9) V (z, a) = max{WN (z, a),WE(z, a),WP (z, a),WC(z, a)}.
Solving the problem determines the optimal occupational choice decisions, χ(z, a), consumption
choices, c(z, a), asset saving decisions, a′(z, a), and labor supply decisions, n(z, a).
Distribution. — Let µ(z, a) denote the invariant cross-sectional distribution measure of agents
with productivity z and asset a. The evolution of this distribution depends on the endogenous asset
choice a′(z, a) and the exogenous Markov process of the productivity z. For any set of future asset
levels A and any future productivity z′, the following equation must be satisfied in the stationary
equilibrium:
(10) µ(z′,A) =
∫z,a
1{a′(z,a)∈A}ρ(z′|z)µ(dz, da).
B. Financial Intermediary
A financial intermediary behaves competitively and earns zero profit. The behavior of the finan-
cial intermediary is fairly mechanical in our model. It extends external financing offers in a random
and probabilistic fashion based on a firm’s declared LFO. A pass-through business has a ϕp chance
of receiving the external financing offer, and a Corporation has a ϕc chance of receiving the offer.
Then as long as a firm accepts the external financing offer, the financial intermediary raises all
needed capital. The model abstracts away from any financing costs. In equilibrium, the interest
rate on savings r adjusts until the capital market is cleared.
14
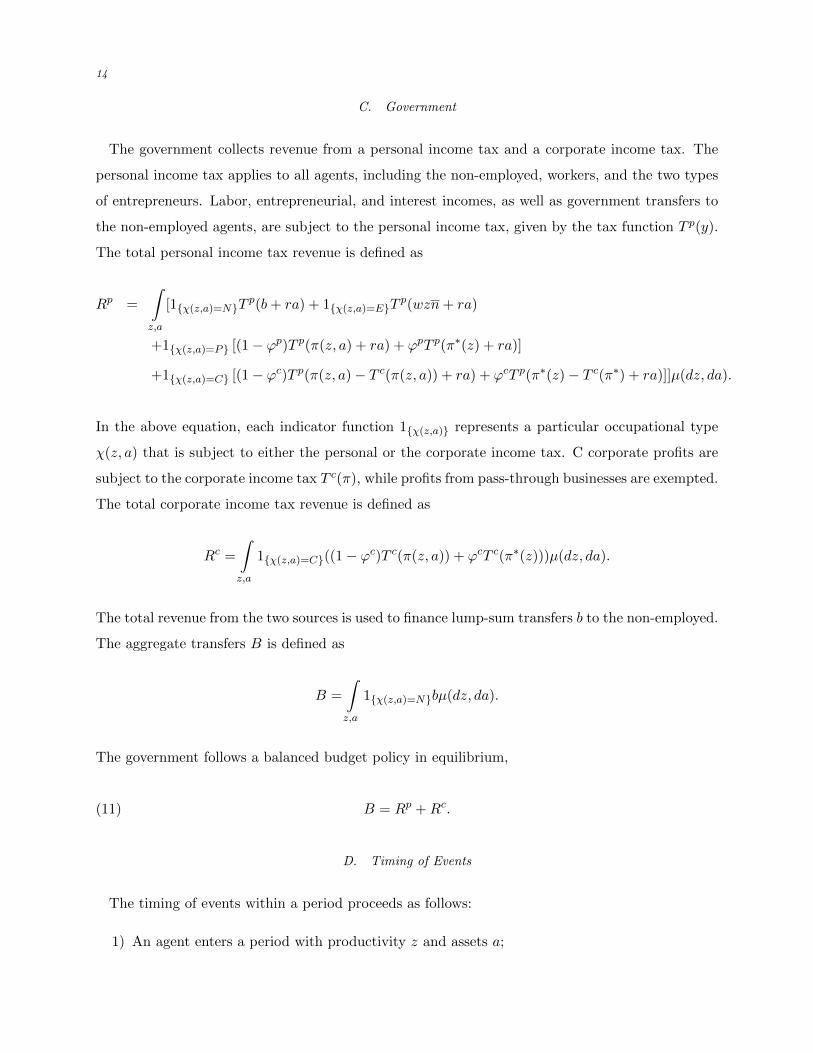
C. Government
The government collects revenue from a personal income tax and a corporate income tax. The
personal income tax applies to all agents, including the non-employed, workers, and the two types
of entrepreneurs. Labor, entrepreneurial, and interest incomes, as well as government transfers to
the non-employed agents, are subject to the personal income tax, given by the tax function T p(y).
The total personal income tax revenue is defined as
Rp =
∫z,a
[1{χ(z,a)=N}Tp(b+ ra) + 1{χ(z,a)=E}T
p(wzn+ ra)
+1{χ(z,a)=P} [(1− ϕp)T p(π(z, a) + ra) + ϕpT p(π∗(z) + ra)]
+1{χ(z,a)=C} [(1− ϕc)T p(π(z, a)− T c(π(z, a)) + ra) + ϕcT p(π∗(z)− T c(π∗) + ra)]]µ(dz, da).
In the above equation, each indicator function 1{χ(z,a)} represents a particular occupational type
χ(z, a) that is subject to either the personal or the corporate income tax. C corporate profits are
subject to the corporate income tax T c(π), while profits from pass-through businesses are exempted.
The total corporate income tax revenue is defined as
Rc =
∫z,a
1{χ(z,a)=C}((1− ϕc)T c(π(z, a)) + ϕcT c(π∗(z)))µ(dz, da).
The total revenue from the two sources is used to finance lump-sum transfers b to the non-employed.
The aggregate transfers B is defined as
B =
∫z,a
1{χ(z,a)=N}bµ(dz, da).
The government follows a balanced budget policy in equilibrium,
(11) B = Rp +Rc.
D. Timing of Events
The timing of events within a period proceeds as follows:
1) An agent enters a period with productivity z and assets a;

VOL. NO. 15
2) The occupational decision χ is made;
3) The financial intermediary makes random external financing offers, and firms receive offers;
4) Production occurs. All agents receive their respective earnings;
5) The government levies taxes to finance transfers and exogenous government spending;
6) Consumption and saving decision are made; and
7) Agents draw new productivity shocks, and the period ends.
E. Labor Market
The effective labor supply from an employed worker is his productivity z times the hours worked
n. We aggregate over all employed workers to obtain the total labor supply,
LS =
∫z,a
1{χ(z,a)=E}znµ(dz, da).
Both pass-through firms and C corporations demand labor. Aggregating labor demand across
entrepreneur types gives the measure of total labor demand. That is,
LD =
∫z,a
[1{χ(z,a)=P}((1− ϕp)l(z, a) + ϕpl∗(z))
+1{χ(z,a)=C}((1− ϕc)l(z, a) + ϕcl∗(z))]µ(dz, da).
In equilibrium, the wage w clears the labor market, so
(12) LS = LD.
F. Capital Market
Capital supply in the market is the sum of all agents’ assets, which is defined as
KS =
∫z,a
a′(z, a)µ(dz, da).

16
Both pass-through firms and C corporations demand capital. Aggregating capital demand across
entrepreneurs under different organizational forms gives the total capital demand,
KD =
∫z,a
[1{χ(z,a)=P}((1− ϕp)k(z, a) + ϕpk∗(z))
+1{χ(z,a)=C}((1− ϕc)k(z, a) + ϕck∗(z))]µ(dz, da).
In equilibrium, the interest rate r clears the capital market, so
(13) KS = KD.
G. Equilibrium Definition
A stationary equilibrium consists of a set of agents’ decision rules, χ∗(z, a), c∗(z, a), a′∗(z, a),
n∗(z, a), a wage rate w∗, an interest rate r∗, and a distribution µ∗(z, a), such that given a personal
income tax function T p(·), a corporate income tax function T c(·), and non-employment transfer b:
1) The decision rules χ∗(z, a), c∗(z, a), a′∗(z, a), n∗(z, a) solve the agent’s optimization problem
as stated in equations (1), (2), (5), (8), and (9);
2) The distribution µ∗(z, a) as defined in equation (10) reproduces itself;
3) The government budget condition as stated in equation (11) is satisfied;
4) The labor market as expressed in equation (12) is cleared; and
5) The capital market as expressed in equation (13) is cleared.
Both labor and capital markets are cleared. Hence, by Walras’ law, the goods market also clears
in the equilibrium. Appendix B outlines the algorithm for solving the model.
II. Empirical Evidence of Different Capital Constraints by LFO
In the model framework described in the previous section, the difference in capital constraints by
LFO is a key margin in understanding why some entrepreneurs choose to operate C corporations. As
previously mentioned, the legal codes of the United States have imposed restrictions on pass-through
businesses’ sources of capital. For example, they cannot have more than 100 shareholders, they
cannot issue preferred stocks to attract venture capitals, and they are excluded from investments

VOL. NO. 17
by corporate, partnership, and foreign investors. This section provides empirical support to show
that, due to these restrictions, a pass-through business is more likely to be capital constrained than
a C corporation. Evidence is provided to show that the difference in capital constraints by LFO is
robust across different industry sectors and firm size classes.
A. Capital-to-Output Ratio by LFO
In the model, entrepreneurs make static profit maximization decisions.7 When a firm is not
capital constrained, its optimal choice of capital input k∗(z) and optimal output y∗(z) are only
functions of the entrepreneur’s productivity level z, holding other parameters fixed. In this setting,
an unconstrained firm’s capital-to-output ratio is determined by the output elasticity of capital γ
and marginal cost of capital r + δ,k∗(z)
y∗(z)=
γ
r + δ.
When an entrepreneur faces capital constraints and a < k∗(z), we can similarly derive
k(z, a)
y(z, a)=
a
y(z, a)= κ(z, a)
1−γ−θ1−θ
γ
r + δ,
where κ(z, a) = min{a/k∗(z), 1} measures the tightness of a firm’s capital constraint. As long as
κ < 1, the capital-to-output ratio is k(z,a)y(z,a) <
k∗(z)y∗(z) . Therefore, the tighter the capital constraint
a firm faces, the lower its capital-to-output ratio. Because κ is increasing in asset holding a and
decreasing in productivity shock z, a firm would have a lower capital-to-output ratio if its owner
has relatively higher productivity and/or relatively lower personal wealth to finance the firm’s
operation.
In the model, a firm’s capital constraint is removed once it receives external financing. On average,
external financed firms should have higher capital-to-output ratios compared with self-financing
firms. Because the model postulates different probabilities of receiving external financing for firms
of different LFO, the average capital-to-output ratios are likely to be different by LFO status. Of
course, it is not necessarily always the case a priori that C corporations have a higher average
capital-to-output ratio than pass-through businesses. For example, entrepreneurs with enough
personal wealth (a ≥ k∗(z)) can choose to self-finance pass-through businesses, while facing no
capital constraints at all. However, if it is empirically documented that C corporations have higher
capital-to-output ratios than pass-through businesses, then one can deduce that C corporations are
indeed less capital constrained. Then the assumption that C corporations have a higher probability
7Appendix A provides a more detailed derivation of the analytical results shown in this subsection.

18
of receiving external financing (ϕc > ϕp) is a reasonable one.
Data available in the National Income and Product Accounts (NIPA) from the U.S. Bureau of
Economic Analysis and the Corporation Complete Report from the Internal Revenue Service (IRS)
are used to calculate the average capital-to-output ratios by LFO. Our model period is five years.
Hence, the five-year average capital-to-output ratio is 0.306 for pass-through firms and 0.371 for C
corporations. The procedure used to determine the capital-to-output ratios by LFO is similar to
that of McGrattan and Prescott (2013).8 The details are presented in Appendix C.
Different industries have very different production technologies and hence very different capital-
to-output ratios. It is possible that C corporations are disproportionately concentrated in industry
sectors with relatively high-capital-intensity production technologies. In this case, a higher average
C corporation capital-to-output ratio is merely reflecting the inter-industry technology differences,
rather than capital constraint differences across different LFO. For robustness, a proxy measure of
the capital-to-output ratios by LFO across different industry sectors is examined. The estimated
annual capital-to-output ratios across all major non-agricultural industry sectors is presented in
Appendix C.9 As can be seen in Table C1 of the Appendix, although this ratio clearly varies across
industry, the capital-to-output ratios of C corporations are consistently higher than those of pass-
through businesses in almost all industry sectors.10 The only exceptions are the “Finance and
insurance” and “Real estate” sectors, where capital-to-output ratios are larger in the pass-through
sector. A possible explanation is that firms in these sectors handle tremendous amounts of loans
and investment products (such as mortgages) for their clients, which are counted as part of their
operating assets. Smaller pass-through businesses, such as small real estate partnerships, or limited
liability insurance companies are disproportionately affected. The capital-to-output ratios are likely
to be distorted for these pass-through businesses.
C corporations have higher capital-to-output ratios not only when controlling for industry sector,
but also when controlling for firm size. Firm size can be a concern as it is well documented that
firm size is positively correlated with the capital-to-output ratio. Adding to the concern is that
large firms in the U.S. are almost exclusively C corporations. This suggests that the documented
capital intensity difference between C corporations and pass-through businesses could simply reflect
the difference in the efficiency scales of large corporate firms versus small pass-through businesses.
8These numbers are lower than many other estimates of capital-to-output ratios in the literature, because household durables(such as residential housing) are excluded from the private fixed asset calculations.
9Data limitation has restricted us to use business asset-to-receipts ratios calculated from the 2011 IRS data to proxy forcapital-to-output ratios. In addition, the IRS does not report assets for Sole Proprietors, so our calculation of pass-throughbusinesses do not include them.
10C corporation capital-to-output ratios are also higher in almost all the sub-industry sectors. For example, this is true forall 20 sub-industry sectors in the manufacturing industry, from “Food manufacturing” to “Petroleum product manufacturing.”

VOL. NO. 19
To alleviate this concern, a proxy measure of the capital-to-output ratios by LFO across different
firm size categories is presented in Appendix C.11 As can be seen in Table C2 of the Appendix,
the C corporate sector is dominated by large corporations, as firms with $50 million or more in
business receipts generate 90 percent of all the sales. In contrast, firms with $50 million or more
in business receipts generate only 38 percent of the sales in the pass-through sector. As expected,
the capital-to-output ratio is higher for larger corporate firms. When the data are segmented into
different size categories, C corporations consistently have higher capital-to-output ratios compared
with pass-through businesses in every size category.
The empirical evidence supports the notion that C corporations have higher capital-to-output
ratios than pass-through businesses after controlling for either industry sector or firm size category.
Hence, the capital-to-output data suggest that C corporations face less severe constraints on capital
than pass-through businesses.
B. Probability of Small Businesses Receiving External Equity by LFO
An alternative approach to provide support for the assumption concerning the relative probability
of receiving external financing is to examine the sources of business finance. Most large firms in
the U.S. are publicly traded C corporations, which receive a large amount of public equity. But
this is not sufficient to show C corporations have more opportunity to receive external equity.
The financing of small businesses needs to be examined as well. In particular, empirical evidence is
presented in this section to show that (1) a sizable fraction of small businesses are capital constrained
and require external financing; and (2) among these small businesses, the probability of receiving
external funding varies by LFO. In particular, C corporations are more likely to receive external
investment.
The 2003 Survey of Small Business Finance data, collected by the Federal Reserve System, is
used for this analysis. These survey data contain only businesses with 500 employees or fewer,
thus excluding large corporate firms. The survey includes questions on the organizational type
of the business, whether the business raised additional equity, and the sources of the additional
equity raised. Additional information on these data is available in Appendix D. For the following
analysis, we restrict our attention to three major industry sectors: manufacturing, wholesale and
retail trade, and services.
Capital constraints are one of the most important reasons for a business to raise additional equity.
11The IRS does not report assets by both size of businesses and LFO. This data limitation has restricted us to use capital-income-to-business-receipts ratios calculated from the 2011 IRS data to proxy for the capital-to-output ratios. We provide amore detailed discussion of this in Appendix C.

20
A total of 6.1 percent of all the firms surveyed reported raising additional equity. Among these, 7.4
percent of all the C corporations and 5.7 percent of all the pass-through businesses raised additional
equity. Because firms can raise capital by other means (such as loans), and firms could have raised
capital in non-survey years, these numbers should be considered as a lower bound estimate of the
fraction of firms who require additional capital.
The survey provides firms’ sources of additional equity. By excluding sources of equity, such as
equity from existing owners, employees, or family members, this analysis focuses on small businesses
that raised equity from three external sources, namely, (1) venture capitalists, (2) public stock
offerings, and (3) angel investors. Of these sources, pass-through firms are barred by law from
receiving external funding from (1) and (2), so they can raise external equity only from angel
investors, who are affluent private informal investors.
Summary statistics of the percentage of firms’ external equity sources by both LFO and industry
sectors are presented below.
Table 1—External Equity Sources by LFO
Wholesale &Overall Manufacturing Retail Trade Services
S C S C S C S CVenture Capital 0.0% 2.8% 0.0% 7.1% 0.0% 0.0% 0.0% 3.5%Public 0.0% 1.2% 0.0% 3.9% 0.0% 0.0% 0.0% 1.0%Angel 6.0% 11.2% 0.0% 25.9% 2.4% 0.0% 12.5% 13.7%External Equity 6.0% 14.2% 0.0% 36.8% 2.4% 0.0% 12.5% 15.6%
In the survey data, among pass-through businesses, only S corporations raised external equity. In
cases where an S corporation had additional equity, only 6.0 percent raised capital from an external
source. In contrast, 14.2 percent of small C corporations raised additional equity from external
sources. In the capital-intensive manufacturing industry, over one third of the C corporations
surveyed used external equity, while no S corporations used any external equity. One might suspect
that few manufacturing firms use the S corporate form, but this is not the case. In Manufacturing,
the number of S corporations is about half that of C corporations. While significantly smaller than
the C corporate sector, the S corporate sector is a significant part of the Manufacturing industry.
In contrast, almost no firms in Wholesale and Retail Trade use external financing. The only
exception is the 2.4 percent of the S corporations that have private angel investors. This sector is
the only place where S corporations can potentially use more external finance than C corporations.
In Services, a higher percentage of C corporations consistently use more external equity than S

VOL. NO. 21
corporations. The percentage differential is smaller than what is observed in Manufacturing.
Table D of the Appendix presents results from three logit regression models. These models
control for owner characteristics, firm credit risks, industry sector, geographic region, and firm sizes.
Consistent with Table 1, the regression results indicate that C corporations have a higher chance of
receiving external financing than pass-through businesses. These regression models indicate that C
corporations are as much as 8 times more likely to receive external equity financing as pass-through
firms. The evidence on external equity financing by LFO suggest that, even for small businesses,
C corporations are less likely to be capital constrained.
III. Calibration
This section provides the details on the calibration of the model, presents some motivation behind
the choices of calibration targets, and discusses the implications of the calibration results.
A. Model Specification
The model period is five years. The reason for using a five-year model is twofold. First, changes
to a firm’s LFO status can occur over a few years. For instance, when a C corporation converts to
a S corporation, this firm could still pay C corporation taxes on some of its income (i.e., selling of
appreciated assets). The Small Business Jobs Act of 2010 stipulates that the recognition period of
status conversion is 5 years. Therefore, using five-year periods in the model is appropriate as the
model abstracts from these complex tax treatments during the conversion period. In addition, indi-
vidual agents in the model make occupational decisions based on their current period asset position
and productivity draw. The model abstracts away from direct intertemporal dependency of occu-
pational status. Hence, to avoid high-frequency temporary occupational changes, it is preferable in
our calibration to use a five-year model period.
The logarithm of productivity z follows an AR(1) process with autocorrelation %z and standard
deviation σz, or log(z′) = %z log(z)+ ε, where ε ∼ N(0, σ2ε). Numerically, the method developed in
Tauchen (1986) is used to construct a first-order Markov process approximation.

22
Agent per-period utility is assumed to have the functional form 12
u(c, n, ι) = α log(c) + (1− α) log(1− n) + ι · η.
Agents value consumption c and leisure 1−n. The relative importance of consumption to leisure is
given by the parameter α. The indicator function ι identifies whether an agent is an entrepreneur.
Entrepreneurs receive non-pecuniary benefit η ≥ 0 from running their own businesses. The value
of η is calibrated to match empirical targets, such as the firm size distribution.13
To allow for progressivity in the personal income tax, the personal income tax function proposed
by Gouveia and Strauss (1994) is employed. Given any income m, the total personal income tax is
T p(m) = a0
(m− (m−a1 + a2)
− 1a1
),
where (a0, a1, a2) are parameters. In this functional form, parameter a0 is the limiting average
tax rate when m → ∞, and parameter a1 captures progressivity. In particular, when a1 = 0,
the personal tax system is purely proportional, T p(m) = a0m; when a1 > 0, the average taxes
are strictly increasing in income m. This functional form is adopted by recent papers on optimal
taxation, such as Conesa and Krueger (2006) and Conesa, Kitao and Krueger (2009). Following the
approach in these papers, we use parameter values of a0 = 0.258 and a1 = 0.768 from the original
estimation of Gouveia and Strauss (1994). The parameter a2 is chosen so that the government
budget constraint is balanced in the equilibrium.
The corporate income tax obligation is assumed to be proportional to profits, or T c(π) = τ c · π.
A corporate income tax function could be estimated to take into account the progressivity in the
U.S. corporate tax code. However, the legislative corporate tax rates are not applicable due to
12This functional form is a special case of the following function
u(c, n, ι) =(cα(1− n)1−α)1−ξ − 1
1− ξ+ ι · η,
which is a constant-relative-risk-aversion transformation of the Cobb-Douglas utility function. This preference specification isconsistent with balanced growth. One of the focuses of this paper is the employment effect of a change in the corporate incometax rate. The employment effect is largely dependent upon agents’ labor supply decisions, which is a function of real wages inthe economy. In this preference specification, the relative share of working to leisure is constant with respect to wages, so theincome effect of an increase in wage cancels out with the substitution effect. In the special case, the CRRA parameter ξ is setto be 1. Calibration exercise with this more general form of utility function yields a CRRA parameter ξ close to 1. Fixing theCRRA parameter ξ > 1, our policy experiments give similar qualitative results.
13In an alternative calibration exercise, agents are allowed to have different non-pecuniary benefits η’s. In particular, wenormalize η = 0 for one group of the population and set η > 0 for another group. However, for the purpose of this paper,the size of the employment change in the policy experiment does not change very much if such possibility is allowed. This isbecause most of the employment effect is caused by entrepreneurs’ actions, either by switching LFO or entering the market. Iftwo groups are allowed, the overwhelming majority of entrepreneurs under any corporate tax policy come from the group withη > 0. For the simplicity of the state space and computation, agents have the same non-pecuniary benefits η > 0 in the model.

VOL. NO. 23
the myriad of corporate tax loopholes. To avoid dealing with issues of legislative versus effective
corporate tax rates, the proportional tax assumption seems appropriate. The average effective
corporate income tax rate τ c is estimated and assumed to be the same for all C corporations.
The production function is assumed to have a Cobb-Douglas functional form F (z, k, n) = zkγnθ.
Parameters γ and θ are the capital and labor intensity parameters, respectively. To ensure an
interior solution, the production function is assumed to have decreasing returns to scale and α+β <
1.
B. Independently Calibrated Parameters
In the model, an agent is either non-employed with leisure being 1 or working full time with
leisure being 1 − n. We set n by assuming that individuals have 98 hours a week of substitutable
time not spent eating, sleeping, or engaged in other personal care. If an agent spends 40 hours
a week working full time, n approximately equals 0.4. The calibration of n is similar to others’
treatments in the literature, such as Hansen and Imrohoroglu (1992).
The corporate income tax rate τ c is set to be the average effective tax rates from 2000-2010,
which is calculated based on NIPA and the Corporation Complete Report from the IRS. Following
similar definitions in Mertens and Ravn (2013), the average corporate income tax rate is the federal,
state, and local taxes on corporate income (NIPA Table 3.1 line 5) excluding tax on Federal Reserve
Banks (NIPA Table 3.2 line 8) divided by the corporate income tax base; the corporate income
tax base is the total income subject to tax from all active corporations, other than those filing
forms 1120S, 1120-REIT, and 1120-RIC (IRS Complete Report Table 12 line 81). Based on our
calculation, the average effective corporate income tax rate is 28.5 percent.
The depreciation rate δ is the total depreciation of private fixed assets by corporate firms, part-
nerships, and sole proprietorships (NIPA Fixed Asset Table 6.4 line 2, 6, and 7) divided by the
total private fixed assets of corporate firms, partnerships, and sole proprietorships (NIPA Fixed
Asset Table 6.1 line 2, 6, and 7). The estimated annual depreciation rate is 8.2 percent. Hence,
the five-year capital depreciation rate is 35 percent. Table 2 summarizes the set of parameters that
are independently calibrated.
Table 2—Parameters Calibrated Independently
Description Parameter Value SourceFull-time Hours Worked n 0.40 dataCorporate Income Tax Rate τ c 0.285 dataDepreciation Rate on Capital (5 year) δ 0.35 dataLimiting Avg. Personal Income Tax Rate a0 0.258 Gouveia and Strauss (1994)
Personal Income Tax Progressivity Parameter a1 0.768 Gouveia and Strauss (1994)

24
C. Calibration Results
The remaining parameters in the model are calibrated jointly in the benchmark stationary equi-
librium. These parameters and their calibrated values are summarized in Table 3.
Table 3—Parameters Calibrated Jointly in Equilibrium
Description Parameter ValueProduction Function Parameter on Capital γ 0.241Production Function Parameter on Labor θ 0.643Productivity Persistence %z 0.821Standard Deviation of Productivity σz 0.245Cobb-Douglas Utility Parameter on Consumption α 0.501Discount Rate (5 year) β 0.770Non-employment Lump Sum Transfer b 0.238Pass-Through Business External Financing Probability ϕp 0.462C corporation External Financing Probability ϕc 0.717Entrepreneurial Non-pecuniary Benefit η 0.305
A set of empirical moments are carefully chosen to help pin down these parameters. These data
moments discipline the model so as to capture certain significant economic aspects central to our
policy experiments. A comparison of the data and model moments is presented in Table 4.
Table 4—Data and Model Moments
Targeted MomentsStatistics Data Model ErrorNon-Employment Fraction 0.334 0.341 2.1%Average Workers per Firm 21.807 21.778 −0.1%Fraction of C corporations 0.228 0.226 −0.9%Employment % of C corporations 0.548 0.561 2.4%Pass-Through Capital-Output Ratio (5 year) 0.306 0.313 2.3%C corporation Capital-Output Ratio (5 year) 0.371 0.376 1.3%Fraction of New Firm Entry (5 year) 0.344 0.330 −4.1%Emp. Fraction of New Entry Firm (5 year) 0.114 0.118 3.5%Fraction of Small Business (< 20 Employees) 0.875 0.789 −9.8%Employment Fraction of Small Business 0.192 0.184 −4.2%Wealth Gini Index 0.816 0.845 3.6%Percentage of Wealth in Top 1% 0.340 0.424 24.7%Percentage of Wealth in Top 10% 0.714 0.784 9.8%Percentage of Wealth in Top 20% 0.834 0.886 6.2%Percentage of Wealth in Top 40% 0.950 0.955 0.5%Percentage of Wealth in Top 60% 0.990 0.979 −1.1%
The benchmark model fits the data well. In particular, almost all the model moments are within

VOL. NO. 25
a 10 percent difference from the targeted data moments, the only exception is the percentage of
wealth held by the most wealthy individuals. Next, the choices and fits of target moments are
discussed, as well as their relationship to the calibrated model parameters.
Importantly, the calibrated model is able to match a number of job market and LFO statistics.
The average number of workers per firm in the data is 21.807, which is calculated from the 2011
County Business Patterns of the Statistics of U.S. Businesses published by the U.S. Census Bureau.
This data source reports “Number of Firms” and “Employment” by both employment size and LFO.
The same data source reports that 22.8 percent of all the businesses in the U.S. are C corporations,
and they hire 54.8 percent of all the employees. The calibrated model matches these targets closely.
In the model, the average number of workers per firm is 21.8, the fraction of C corporations is 22.6
percent, and the employment fraction of C corporations is 56.1 percent.
The calibration of production function parameters is fairly standard. The calibrated values of
labor intensity parameter θ = 0.643 is within the range of the values found in recent literature, such
as Gomes (2001) and Gourio and Miao (2010). The calibrated values of capital intensity parameter
γ = 0.241 is lower than those found in the literature (for example, γ = 0.311 in Gourio and Miao
(2010)). This is because in obtaining target capital-to-output ratios, we exclude household durables
(such as residential housing) from the private fixed asset calculations. If we use γ = 0.311, the
annual capital-to-output ratios would be close to 3, which is the value typically employed in the
literature.
To balance government budget in the equilibrium, the tax function parameter is calibrated to be
a2 = 0.725.
The persistence parameter %z of the productivity Markov process and the standard deviation
σz of the productivity shock distribution are calibrated to match data moments of firm dynamics,
such as the fraction of entry firms and the employment fraction of entry firms. The firm entry
and exit dynamics are governed by the productivity process, and only agents with relatively high
productivity level z choose to operate firms in our model. In the stationary equilibrium, the fraction
of new firm entrants is the same as the fraction of exiting firms. As a result, the calibration targets
include only firm entry statistics from the 2011 Longitudinal Business Database (LBD) from the
U.S. Census. Because the model period is 5 years, all the firms aged less than or equal to five years
are considered entry firms in our calculation. In 2011, 34.4 percent of all the firms were established
in the previous 5 years, and these firms hire about 11.4 percent of all the workers over the five-year
period. The calibrated value of the persistence parameter is %z = 0.821 and the standard deviation

26
parameter is estimated to be σz = 0.245.14
The model is also calibrated to match small business statistics, such as the fraction of small
businesses and the employment fraction of small businesses. These target moments are computed
from the 2011 County Business Patterns of the Statistics of U.S. Businesses, which is published by
the U.S. Census Bureau. A “small business” is defined as a firm with 20 employees or fewer. This
is the definition employed in Hurst and Pugsley (2011). In the U.S. economy, 87.5 percent of all
firms are classified as small businesses and they hire about 19.2 percent of all the employees.15
The utility parameter α and the discount rate β are related to agents’ asset saving decisions.
These parameters are calibrated to match the Gini coefficient for wealth and the wealth distribution.
The wealth Gini index of 0.816 and the wealth distribution listed in Table 4 is sourced from J. Diaz-
Gimenez, A. Glover, and J.-V. Rios-Rull (2011). The calibrated value of the utility parameter is
α = 0.501, and the calibrated 5-year discount rate is β = 0.67, which implies a discount rate of
about 0.95 per annum. The model over-predicts the fraction of wealth held by the top 1 percent,
suggesting that the very wealthy agents are accumulating assets faster than in the data. As a
result, the model economy has a higher level of wealth inequality than in the data. This points to
a limitation of our model as we do not incorporate a stock market or firms distributing dividend
income. All the profits earned by large corporations are distributed directly to its entrepreneur.
Highly talented entrepreneurs with sufficient access to capital can accumulate assets very quickly.
In other words, our model has a higher return to “talent” than in the real economy. In a later
discussion, we show that most of the employment effect and productivity misallocation in our model
comes from new entry firms and pass-through businesses switching to be C corporations. These
firms are usually not publicly traded. Large public firms would still remain large public firms with
a corporate tax policy change. This abstraction, while it greatly simplifies our analysis, does not
change the key margins in our model.
The non-employment lump-sum transfer payment b is calibrated to match the non-employed
fraction of population in the United States. The non-employed population consists of individuals
who do not currently hold a job. This includes unemployed workers and those who are out of the
labor force. Unemployed workers who are actively seeking a new job are considered a part of the
labor force. The model period of five years is longer than the average unemployment duration of
six months. Because this paper is interested in long-term policy implications, the non-employment
14In comparison with recent papers, such as Gourio and Miao (2010), the standard deviation parameter is similar, but thepersistence parameter is slightly higher. This is largely due to the 5-year period assumption.
15Our model generates measures of workers, instead of numbers of workers, hired by firms. By calculating average workerper firm and measures of workers and firms in the model, we can construct a measure of worker average effective labor. Then,for each firm, we divide the measures of workers by the average effective labor to calculate the number of workers.

VOL. NO. 27
rate instead of unemployment rate is used in the calibration. The employed civilian labor force as a
percentage of population (persons 16 years of age and over, 65 years of age and under) in the year
2011 is 66.6 percent, as reported in the Labor Force Statistics of the Current Population Survey by
the Bureau of Labor Statistics. So the non-employed fraction of population used in our calibration
is 33.4 percent. The calibrated parameter value is b = 0.238.
In reality, the government does not have a transfer program specifically designed for non-employed
persons. To see if the calibrated parameter b makes sense, its calibrated value is compared with two
closely related government benefit programs. A related program is unemployment insurance, which
is available to workers who recently lost their jobs and are actively seeking employment. According
to the U.S. Department of Labor guidelines and statistics, an unemployed person is paid up to
26 weeks (half-year) for an average of around $1,200 per month.16 In 2011, the BLS reports the
average monthly salary was $3,769. This means that the ratio of annual maximum unemployment
insurance to average annual salary is around 16 percent. Of course, non-employment includes
individuals who are not actively seeking jobs. For these individuals who are not employed and
have no other incomes, the Supplemental Nutrition Assistance Program (food stamps) can be
used as another measure of comparison. Based on the U.S. Department of Agriculture guidelines,
households without income are eligible to receive food stamps with a maximum value equivalent to
the cost of foods in the USDA Thrifty Food Plan.17 In 2011, the monthly cost of the Thrifty Food
Plan for a family of 4 is $544.50, which is 14.4 percent of the average monthly salary in that year.
In our model, the average wage of a worker is 1.63, so the non-employment transfer of b = 0.238 is
14.6 percent of the average wage. This means the calibrated value of non-employment transfer is in
line with unemployment insurance and the food stamp programs offered by the U.S. government.
Two important parameters in the model are a pair of external financing probability parameters
ϕp and ϕc. The capital-to-output ratios by LFO are used to pin down these parameters. As detailed
in Section II.A, both NIPA and IRS data are used to calculate the capital-to-output ratios. The
five-year capital-to-output ratios are 0.306 and 0.371 for pass-through firms and C corporations,
respectively. This calibration indicates that ϕp = 46.2% and ϕc = 71.7%. Hence, C corporations are
more than 55 percent more likely to receive external financing offers than pass-through businesses
in the model.
Hurst and Pugsley (2011) document that most small businesses are very different from large
16Unemployment insurance varies by state. It is calculated based on the person’s salary in a previous job. On averagein the U.S., unemployment insurance replaces about 46.6 percent of an unemployed person’s salary in 2011, according tohttps://workforcesecurity.doleta.gov. Our tabulation of unemployment insurance is on an annual basis, which takes into accountthat the transfer would only last up to 26 weeks or half a year.
17For more detailed information, please refer to https://www.cnpp.usda.gov.

28
corporate firms, as they seldom intend to grow into a large enterprise. In fact, based on the
survey results from the Panel Study of Entrepreneurial Dynamics, Hurst and Pugsley (2011) report
that 50.5 percent of the entrepreneurs own businesses for non-pecuniary reasons. To see if our
calibrated parameter of non-pecuniary benefits is reasonable, the model is re-simulated after setting
the parameter η = 0, while holding all other parameters fixed. This change results in the number
of entrepreneurs falling by 55.1 percent, which is slightly higher than what is reported in Hurst and
Pugsley (2011). Furthermore, the effect of the non-pecuniary benefit on owning businesses differs
by LFO. Removing the non-pecuniary benefit would reduce the number of pass-through business
owners by 63.6 percent and reduce the number of C corporations by 28.6 percent. In the model
and in the data, C corporations on average are larger in size than pass-through businesses. Our
results, hence, are consistent with the findings in Hurst and Pugsley (2011), in that non-pecuniary
benefits disproportionately affect small businesses.
D. Occupational Choice in Benchmark Economy
The benchmark model provides insights into the behavior of agents in the economy. The rela-
tionship between productivity and asset (or capital) levels is examined to better understand the
occupational choice decision. In Figure 1, the occupational choice decision is presented as a function
of both productivity level z (Y-axis) and asset level a (X-axis). Both axes are in log scale.
Figure 1. Occupational Choices in Benchmark Economy
0.001 0.01 0.1 1 Asset level a (Log Scale)
0.5
1
1.5
2
2.5
3
Pro
duct
ivity
z (
Log
Sca
le)
C CorporationPass-Through
Worker
Non-employed
Agents choose to be non-employed for two reasons. For the vast majority of the non-employed

VOL. NO. 29
agents, very low productivity draws forced them to choose a fixed non-employment lump-sum
transfer b over an effective labor wage wzn. However, some very wealthy individuals also choose
to be non-employed. This is a result of their preference toward leisure. These individuals are very
small in number. Of all the non-employed individuals, less than 0.02 percent have wealth in the
top 1 percent of the wealth distribution.
A majority of the agents (61.2 percent) are workers. A typical worker is moderately talented so
that their wage earning is higher than the non-employment transfer. For a fixed asset level, they
are not talented enough to choose to be an entrepreneur. In other words, the opportunity cost of
forgoing their wage income is greater than their likely income from operating a business. Employed
workers are usually not the most wealthy agents in the economy, as wealthier individuals find it
more attractive to either own businesses or simply not work and enjoy leisure.
Entrepreneurs who can self-finance a large portion of their business typically find the pass-through
business form to be more attractive, as they can avoid double taxation. Not all pass-through
businesses rely on self-financing. A majority of pass-through entrepreneurs are capital constrained
ex ante, but find double taxation to be too prohibitive to choose the C corporation legal form.
On average, a constrained pass-through entrepreneur’s personal wealth accounts for about only 8.6
percent of the optimal level of capital required by his firm.
Conditional on having the same productivity, pass-through entrepreneurs usually have higher
personal wealth than C corporation owners. However, despite having less than one-third of the
number of pass-through businesses, C corporations hold about 60 percent of the total capital
demanded. This is a result of C corporation entrepreneurs generally having higher productivity
levels along with a better chance of accessing external capital. All C corporate entrepreneurs are
capital constrained ex ante and choose the C corporation form to increase the chance of receiving
external financing. Two types of agents prefer to be entrepreneurs operating a C corporation. They
are either the very talented managers, or they face severe capital constraint. These two conditions
are not mutually exclusive; in fact, talented managers who intend to operate large-scale firms are
more likely to face stringent capital constraint. In the model, the average C corporate entrepreneur’s
personal wealth accounts for about 0.03 percent of the optimal level of capital required by his firm.
Because some C corporations do not receive external financing offers, these firms are severely capital
constrained. As a result, the model is able to generate a distribution of small C corporations.

30
IV. Policy Experiment
In this section, we use the benchmark model to study the aggregate impact of a decline in the
corporate income tax rate. In the policy experiment, we vary the corporate income tax rate from
the benchmark rate of 28.5 percent all the way to zero, while holding the calibrated parameters
fixed. Throughout the policy experiment, the personal income tax parameter a2 is allowed to vary
so that the government budget remains balanced. Wage and interest rates adjust to clear both
the labor and capital markets, allowing the general equilibrium effects to be reflected in the new
equilibrium. The main focus is on the impacts of a corporate income tax rate change on employment
and productivity.
A. Aggregate Policy Effects
The aggregate policy effects from lowering the corporate income tax are summarized in Table 5.
Table 5—Effects of Lowering the Corporate Income Tax
Benchmark Change in Corporate Income Tax Rateτ c =28.5% τ c =20% τ c =10% τ c =0%
Panel AFraction of C Corp. 22.6% 34.4% 44.5% 56.0%
(52.2%) (96.9%) (147.8%)Emp. Fraction of C Corp 56.1% 68.5% 82.5% 94.3%
(22.1%) (47.1%) (68.1%)Avg. Worker per Firm 21.778 21.557 21.167 20.643
(−1.0%) (−2.8%) (−5.2%)Panel BLabor (L) 0.313 0.314 0.317 0.320
(0.3%) (1.3%) (2.2%)Capital (K) 0.263 0.266 0.274 0.281
(1.1%) (4.2%) (6.8%)Output (Y ) 0.625 0.633 0.644 0.650
(1.3%) (3.0%) (4.0%)Consumption (C) 0.533 0.539 0.549 0.553
(1.1%) (3.0%) (3.8%)Panel CWealth Gini 0.845 0.843 0.852 0.864
(−0.2%) (0.8%) (2.3%)Panel DNon-Employment Rate 34.1% 33.0% 32.3% 31.7%
(−3.3%) (−5.3%) (−7.0%)
Note: The percentage changes from to the benchmark statistics are included in the parentheses.

VOL. NO. 31
Panel A focuses the effect of a policy change on firm behaviors and examines how a decline
in the corporate income tax rate impacts the share of C corporations, the employment share of C
corporations, and the average size of firms. In the table, the percentage changes from the benchmark
values appear in parentheses.
The most direct effect of lowering the corporate income tax is on the size of the C corporate
sector. As can be seen, both the number of firms that file as a C corporation and the fraction of
employment by C corporations increase as the corporate income tax rate declines. These changes
are expectedly large. In comparison with the benchmark equilibrium, if the corporate income tax
is eliminated, the fraction of C corporations in the economy more than doubles from 22.6 percent
to 56.0 percent. As a result, the C corporate sector would account for more than 94 percent of the
employment in the economy, compared with 56.1 percent in the benchmark economy.
The increase in the share of C corporations comes from two sources. First, a significant fraction
of pass-through firms switch LFO and become C corporations. Lowering the corporate income
tax lessens the burden of double taxation. The C corporate legal form becomes more attractive to
entrepreneurs, as C corporations have a higher chance of receiving external financing. In fact, at the
zero corporate income tax rate, the remaining pass-through businesses are entirely self-financing.
Noticeably, these pass-through firms are small in size, and they hire only a very small fraction of
the overall employed labor (less than 6 percent) in the economy.
Second, the decline in the corporate tax burden encourages some workers to quit their jobs
and become C corporate entrepreneurs. These agents have moderately high productivity, but
relatively low wealth. In the benchmark economy, these individuals’ opportunity costs of forgoing
their wage income are too high compared with their expected earnings from operating a self-
financing pass-through business. However, the decline in the corporate income tax rate decreases
the double taxation burden and thus raises their expected earnings of running an externally financed
C corporation. When the expected after-tax corporate profit becomes higher than their effective
labor income, they become C corporate entrepreneurs. In the model, if the corporate income
tax is eliminated, the increase in overall entrepreneurship is about 5 percent. Most of the new
entrepreneurs operate small businesses, so the fraction of small business correspondingly increases
by 4.6 percent. This contributes to the overall decrease in average firm size when the corporate
income tax rate is lowered. As seen in Table 5, the average number of workers per firm drops by
5.2 percent compared with the benchmark economy when the corporate income tax is eliminated.
The two aforementioned sources of the C corporate sector expansion are illustrated in Figure
2, where agents’ occupational choices are examined in the benchmark economy relative to an

32
economy without a corporate income tax. The relative importance of the two margins is measured
in Subsection IV.C.
Figure 2. Occupational Choices in Policy Experiment
0.001 0.01 0.1 1 Asset level a (Log Scale)
0.5
1
1.5
2
2.5
3
Pro
duct
ivity
z (
Log
Sca
le)
τc = 28.5%
τc = 0%
C Corporation
Pass-Through
Worker
Non-employed
Panel B of Table 5 focuses on the aggregate implication of a corporate income tax cut on the
economy. Both aggregate output and aggregate consumption increase. The elimination of the
corporate income tax would increase aggregate consumption by 3.8 percent and aggregate output
by 4.0 percent. The demand for capital would increase by 6.8 percent while the demand for effective
labor would increase by 2.2 percent. This means most of the aggregate output increase is caused
by firms’ more intensive use of capital. The expansion of the C corporate sector is the main reason
behind the increase in the demand for capital. The C corporate legal form loosens a firm’s capital
constraint. More firms would have increased access to capital, as a lower corporate income tax rate
leads to an expansion in the C corporation sector. The large increase in capital demand suggests
that the corporate income tax potentially distorts capital allocation among firms. We discuss the
implications of this distortion on productivity in Subsection IV.D.
Panel C of Table 5 presents the implication of a reduction in the corporate income tax on the
wealth distribution. Decreasing corporate income tax skews the wealth distribution to the right.
The Gini coefficient increases from 0.845 to 0.864. As a share of the total wealth in the economy,
the wealth of the top 1 percent of individuals increases from 42.4 percent to 44.7 percent, and the
wealth of the top 10 percent of individuals increases from 78.4 percent to 81.6 percent. Lowering the
corporate income tax allows more talented entrepreneurs to keep a larger fraction of their corporate

VOL. NO. 33
profits. For instance, entrepreneurs who are in the top 5 percent in terms of productivity have on
average 17 percent higher asset holdings when the corporate income tax is eliminated. This is the
main reason behind the increase in the wealth Gini. However, this does not necessarily mean that
less-talented agents are worse off. For those who have productivity in the bottom 5 percent, their
asset holdings increase by 2 percent when the corporate income tax is eliminated.18
Panel D of Table 5 reports the employment effect from a reduction in the corporate income tax
rate. If the corporate income tax rate is reduced to zero, the model finds that the fraction of
non-employed individuals decreases from 34.1 percent to 31.7 percent. This is a reduction of 2.4
percentage points or 7.0 percent in the non-employment rates relative to the benchmark economy.19
This suggests that jobs can be created by reducing the corporate income tax rate. The causes of
the observed employment effect are discussed in Section IV.B.
An important issue is whether the model can reasonably predict firms’ LFO responses to a
corporate income tax rate change. Previous literature, such as Gordon and MacKie-Mason (1994),
Mackie-Mason and Gordon (1997), and Goolsbee (1998), find very little movement between LFO
caused by a corporate tax rate change. Part of the reason is that these papers use time-series
data, where the variation in corporate tax rates has been small historically. Goolsbee (2004)
uses cross-sectional census data across states and industries in the retail trade sector and finds
that the relative taxation of corporate to personal income plays an important role in the share of
firms, employment and sales by C corporations versus pass-through entities.20 He finds that an
increase in the corporate tax rate level by 0.1 decreases the C corporations share of all firms by
0.25 and the employment share of C corporation by 7-15 percent. In this model, when the tax
rate is increased by the same amount, the C corporation fraction goes down by about 0.12, and
C corporate employment share goes down by 13 percent. The smaller response from the model is
partially a result of Goolsbee (2004) restricting his empirical analysis to the retail sector, which is
likely to generate a larger response. In this paper, no restriction is made with respect to firms being
in a specific sector. In addition, Goolsbee (2004) finds little evidence that a change in the corporate
income tax rate impacts relative operating ratios of corporate versus non-corporate sectors, such
as labor intensity. In our model, an increase of 0.01 in the corporate income tax rate changes the
relative ratio of average effective labor demand to output between the two LFO by a negligible
18Not all agents have an increase in asset holding. Those pass-through entrepreneurs with moderate productivity, who remainas pass-through entrepreneurs after the elimination of the corporate income tax, would on average have 11 percent less in assetholdings.
19The employment effect found in this paper is relatively robust with respect to the specifications of the external financingprobability parameters. If the parameter ϕp is increased by 10 percent, while ϕc remains unchanged, the decrease in relativenon-employment rate changes from 7.0 percent to 7.3 percent. Similarly, he parameter ϕc is increased by 10 percent, while ϕp
remains unchanged, the decrease in relative non-employment rate changes from 7.0 percent to 7.5 percent.20His analysis of pass-through entities include partnerships and sole proprietorships, but not S corporations.

34
amount (less than 0.1 percent). This suggests that, in both the data and the model, the distortions
caused by the corporate income tax are primarily due to changes in LFO rather than within any
particular organizational form.
B. Personal Income Tax and Input Factor Prices
Besides affecting entrepreneurial choices of LFO, a change in the corporate income tax rate
indirectly affects agents’ occupational decisions through its effects on other important economic
variables. Of particular importance are the personal income taxation, interest rate, and wages. In
this subsection, the implication of the changes in these variables are considered, with particular
focus on how employment could be affected.
The decline in the corporate income tax rate would necessarily change the government revenue
collected from C corporations. In the policy analysis, the assumption is that the government would
maintain a balanced government budget. In practice, this is accomplished by adjusting the personal
income tax function parameter a2. In particular, the higher the parameter a2, the more personal
tax is collected for a given income, and vice versa. The changes required in this parameter for
various changes in the corporate income tax rate are depicted in Panel (a) of Figure 3.
Figure 3. Policy Effects on Wage, Interest Rate, and Personal Income Tax
00.050.10.150.20.285Corp. tax rate (dec.)
0.6
0.65
0.7
0.75
0.8(a). Tax Func. Para.
00.050.10.150.20.285Corp. tax rate (dec.)
96
98
100
102
104
Ben
chm
ark
norm
aliz
ed to
100 (c). Eff. Wage Rate
00.050.10.150.20.285Corp. tax rate (dec.)
96
98
100
102
104
Ben
chm
ark
norm
aliz
ed to
100 (b). Interest Rate
A decline in the corporate income tax rate does not always result in a loss of government revenue.
If the decline in the corporate income tax rate is small, the increase in corporate entrepreneurship
and the subsequent increase in corporate taxable income outweighs the decline in the corporate
income tax rate. This would result in an increase in tax revenue. Consequently, the government
would be able to cut the personal income tax (a lower a2), while maintaining a balanced budget.
As the reduction in the corporate income tax rate becomes larger, resulting in a loss of total tax

VOL. NO. 35
revenue, the government must then increase personal income tax collection to maintain the policy’s
revenue neutrality. In the extreme case of the elimination of the corporate income tax, as shown
in Figure 3, the personal income tax function parameter increases from 0.725 in the benchmark
economy to 0.750 when the corporate income tax is zero. To give some perspective of such an
increase, for a typical non-employed agent with no other income except for the government transfer
of 0.238, his personal income tax would increase by 2.7 percent. Because this type of agent has the
lowest possible individual tax base, this increase represents the largest possible percentage increase
in tax bills. This shows that the relative increase in personal income tax collection is modest.
Under most of the corporate tax cut regimes in our policy analysis, the government is able to
balance its budget without increasing the personal income tax burden on individual households in
the economy.
Panel (b) of Figure 3 shows the implications of a change in the corporate income tax rate on the
interest rate. The interest rate would increase with a moderate decline of the corporate income
tax rate. As mentioned, a reduction in the corporate income tax rate leads to more C corporations
in the economy. C corporate firms are less capital constrained and have wider financial access to
external capital. This results in an increase in the demand for capital and raises the interest rate.
However, as can be seen in Panel (b) of Figure 3, the interest rate actually decreases by about
2 percent when the corporate income tax is eliminated. This is because the increase in supply
for capital would more than offset the increase in demand. The elimination of the C corporate
income tax burden along with its distortionary effects would result in agents holding and saving
more assets, thus increasing the supply for capital in the economy. Compared with the benchmark
economy, agents on average save 5.2 percent more assets (a′) in the economy without the corporate
income tax. This increase in capital supply puts downward pressure on interest rates and would
dominate the capital demand response in the limiting case when the corporate income tax rate is
set at zero.
The most important factor in an agent’s employment decision is the wage rate. As can be
seen in Panel (c) of Figure 3, the effective wage rate is monotonically increasing with a decline in
the corporate income tax rate. As previously discussed, the decline in the corporate income tax
rate encourages the formation of C corporations, which in turn drives up the total labor demand
in the economy. Hence, employees receive higher compensation per effective unit of labor. In
considering this result, three aspects of the model must be discussed. Firstly, all entrepreneurs are
considered working full-time, so the switching between workers and entrepreneurs does not change
the non-employment rate. Secondly, the model predicts that most of the employment effect comes

36
from non-employed agents switching to be workers, which is shown in Figure 2. Although the
personal income tax burden (parameter a2) does slightly increase when the corporate income tax
is eliminated, tax avoidance has little to do with the change in the non-employment rate. The
model, as in the U.S. tax code, assumes that the non-employment transfer b is subject to personal
income tax. This means that if the effective wage wzn is higher than the non-employment transfer
b, an agent with a given amount of interest income ra would have a higher after-tax income from
being a worker than being non-employed regardless of the changes to the personal income tax
function. Therefore, an increase in effective wage rate w is a sufficient cause of a non-employed
agent becoming a worker. Thirdly, a higher effective wage increases the marginal cost of labor,
which has disproportionate negative effects on more labor-intensive pass-through firms. A higher
wage rate also increases the opportunity costs of entrepreneurship. As a result, some of the least
profitable pass-through business owners choose to become workers in this new tax regime.
To analyze the general equilibrium effect on input factor prices, a separate policy simulation is
conducted holding the effective wage rate fixed at the level in benchmark economy. Compared with
the general equilibrium setting, an elimination of the corporate income tax in this setting leads
to an increase in the demand for capital that is 2.6 times higher and the increase in the demand
for labor that is 7 times higher. These results indicate that the general equilibrium price feedback
effect is important in the analysis of the corporate tax reform. This is consistent with the findings
in the literature, such as Gourio and Miao (2010).
C. Employment Effect Decomposition
Section IV.A shows that lowering the corporate income tax encourages the formation of additional
C corporations and subsequently leads to a higher employment rate in the economy. The increase
in the number of C corporations is the result of pass-through business entrepreneurs switching LFO
and the entry of newly formed C corporations by previous non-entrepreneurs. In this section, the
observed employment effects are decomposed into both channels and evaluated.
Figure 4 examines the responsiveness of the non-employment rate to a corporate income tax rate
change. In this figure, the non-employment rate change for a given corporate income tax rate τ c is
normalized by the non-employment rate in the benchmark economy, where the corporate income
tax rate is 28.5 percent.21 The solid black line shows how the relative non-employment rate changes
with a decline in the corporate income tax rate. As can be seen, if the corporate income tax rate
is reduced to zero, the non-employment rate is reduced by about 7 percentage points relative to
21Figure 4 graphsnon-employment rate(τc)
non-employment rate(τc=28.5%)for each possible corporate tax rate in the policy analysis.

VOL. NO. 37
the non-employment rate in the benchmark economy. The same information is also summarized in
Panel C of Table 5.
Figure 4. Responsiveness of Non-employment Rate to Corporate Tax Rate Change
00.050.10.150.20.25Corporate Income Tax Rate (Decreasing)
90
91
92
93
94
95
96
97
98
99
100N
onem
ploy
men
t Rat
e R
elat
ive
toN
onem
ploy
men
t Rat
e at
τc =2
8.5%
Model with LFO ChoiceOnly C CorporationsOnly Pass-through Businesses
To ascertain the relative importance of the two aforementioned channels of employment effect,
two cases are examined. One case restricts all firms to be organized only as pass-through businesses,
while the other case restricts all firms to be organized only as C corporations. For each case, the
restricted model is recalibrated and then the non-employment responses to changes in the corporate
income tax rate are examined and compared with the unrestricted case.
The blue dashed-dotted line in Figure 4 represents the non-employment rate changes in the first
restricted model. If firms are not allowed to be organized as C corporations, not surprisingly,
changes in the corporate income tax rate have no effect on the non-employment rate at all. Clearly,
any employment effect of the corporate income tax policy can only come from having C corporations
in the economy. The second restricted model, where firms are restricted to be only C corporations,
is more interesting because it allows for C corporation formation from upstart non-entrepreneurs,
but does not allow for switching between LFO. The non-employment rate changes in this case is
represented by the red dashed line in Figure 4. As indicated, the non-employment rate falls when
the corporate income tax rate is lowered. However, the decline is much less compared with the
case where a LFO choice is possible. If the corporate income tax is eliminated in an economy with
only C corporations, the normalized non-employment rate declines by 3 percent, compared with 7

38
percent in an economy where the LFO choice is available.22
This result shows the importance of considering LFO choices in the corporate tax policy analysis.
In particular, the decline in the non-employment rate due to a corporate income tax cut can be more
than twice as large when entrepreneurs’ endogenous LFO choices are taken into full consideration.
D. Effects on Aggregate Productivity
A change in LFO, from a pass-through business to a C corporation, can reduce a firm’s capital
constraint. As a result of better access to capital, a firm’s productivity may increase, which can lead
to additional hiring. Thus, the employment effect is the symptom of improved capital allocation.
In this section, we discuss the impact of the corporate income tax on capital reallocation and
productivity.
A mismatch exists between agents’ entrepreneurial talents and their initial wealth. Ideally, the
financial market should channel capital from less-talented agents to more-talented entrepreneurs
who are capital-constrained . Capital reallocation would continue until the marginal returns to
capital are equalized across firms in the economy. In the model, the corporate income tax does not
directly distort the capital input choice within a firm. The distortion occurs when managerially
talented entrepreneurs with little personal wealth choose the pass-through legal form in order to
avoid double taxation. The adoption of the pass-through legal form limits the flow of external
capital into a firm and leads to inefficiency in the reallocation of capital. The severity of capital
constraints faced by pass-through entrepreneurs determines the magnitude of productivity loss from
the misallocation of capital in the economy. A decline in the corporate income tax rate improves
the efficiency of capital reallocation. For example, the fraction of capital-constrained entrepreneurs
decreases from 38.4 percent in the benchmark economy to 28.9 percent in an economy where the
corporate income tax is removed.
Besides the distortion to LFO choice, the corporate income tax can serve as a barrier to firm
entry. As can be seen in Figure 2, the threat of double taxation may keep agents of relatively
lower productivity from becoming entrepreneurs. In the benchmark economy, such an individual’s
effective wage is high enough so that remaining a worker is more attractive than operating a
capital-constrained pass-through business. This agent’s productivity, however, is not high enough
to compensate for the income loss due to the double taxation. Hence, the choice of the C corporate
legal form is not dominating, even with a better access to capital. If the corporate income tax rate
22Alternatively, the benchmark model’s parameters are used to simulate the restricted model’s non-employment rate responsewithout recalibration. The response to a lowering of the corporate income tax is even smaller in that case. The non-employmentrate drops by only 1.6 percent when the corporate income tax is eliminated.

VOL. NO. 39
is reduced, the tax burdens of becoming an entrepreneur are lower. In this environment, this agent
may quit his job and choose to operate a C corporation. This also means that the new entry C
corporate firms are likely to be less productive than the existing firms. This can be seen in Table
6, where the average managerial quality per firm, defined as Z∗ =
∫χz,a∈{P,C} zµ
∗(z,a)∫χz,a∈{P,C} µ
∗(z,a), falls with a
decline in the corporate income tax rate. If the corporate income tax is eliminated, the average
managerial quality of a firm declines by 1.6 percent.
Table 6—Corporate Income Tax and Measures of Productivity
Benchmark Change in Corporate Income Tax Rateτ c =28.5% τ c =20% τ c =10% τ c =0%
Average Managerial Quality (Z∗) 2.379 2.371 2.359 2.340(−0.3%) (−0.8%) (−1.6%)
Average Effective Labor (n∗) 0.511 0.508 0.505 0.503(−0.6%) (−1.1%) (−1.5%)
Average Labor Productivity (Y/L) 1.997 2.016 2.032 2.031(1.0%) (1.7%) (1.7%)
TFP1 = Y/(LθKγ) 1.820 1.834 1.841 1.836(0.8%) (1.2%) (0.9%)
TFP2 = Y/(Z∗LθKγ) 0.765 0.774 0.781 0.785(1.1%) (2.1%) (2.6%)
Note: The percentage changes from to the benchmark statistics are included in the parentheses.
These new entrepreneurs leave their prior jobs, thus creating job vacancies that are available
to previously non-employed agents from the benchmark economy. The non-employed agents are
less productive. Replacing some of the most productive workers with some of the least productive
workers means that the average labor productivity, defined as n∗ =
∫χz,a∈{E} znµ
∗(z,a)∫χz,a∈{E} µ
∗(z,a), declines. As
can be seen in Table 6, the average labor productivity declines by 1.5 percent when the corporate
income tax is eliminated.
In Section IV.A, the decline in the corporate income tax rate leads to more employment in the
C corporate sector. The prior result suggests that getting more people to work comes with the
cost that the new and less managerially talented entrepreneurs are paying higher wages to recruit
less-productive workers.
The decline in the corporate income tax rate does make the allocation of capital more efficient
in the economy. However, less-productive firms are allowed to operate in the market. To better
understand the implications of these two counteracting forces, three measures of aggregate produc-
tivity in the model economy are constructed. One measure is aggregate output per effective labor,
Y/L. With this measure, aggregate effective labor, L, takes into account the decline in average la-
bor productivity due to more-productive workers being replaced by less-productive workers. Table

40
6 indicates that a non-monotonic relationship exists between aggregate output per effective labor
and the corporate income tax rate. Aggregate output per effective labor increases with a moderate
reduction in the corporate income tax rate, but declines when the tax rate reduction becomes large.
This suggests that allowing better access to capital can improve aggregate productivity. However,
an increase in access to capital to lower-productivity entrepreneurs can lower aggregate productivity
in the economy.
In addition, we provide two measures of TFP. First, suppose the relationship between aggregate
output, Y , aggregate capital, K, and aggregate effective labor, L, can be written as Y = TFP1 ·
KγLθ, where γ and θ are the calibrated capital and labor intensity parameters of the production
function. As can be seen in Table 6, compared with the measure of aggregate output per effective
labor, a non-monotonic relationship between aggregate productivity and the corporate income tax
rate is more apparent with this TFP measure. In particular, TFP1 increases by 1.2 percent relative
to the benchmark economy when the corporate income tax rate is 0.10. However, TFP1 increases
by only 0.9 percent when the corporate income tax is set to zero.23
The model allows two channels for capital market imperfections to impact TFP. They are the
capital misallocation channel and the entry distortion channel. As previously discussed, a decline
in the corporate income tax rate can lead to entry of low-productivity firms and a potentially lower
Z∗. To measure aggregate productivity loss due to capital misallocation, a second measure TFP2
is constructed to take into account the decline in average managerial quality of firms Z∗. With
this measure, aggregate labor in the economy is defined as (Z∗)1/θ · L, and aggregate output is
defined as Y = TFP2 ·Kγ · (Z∗ · Lθ). As can be seen in the last row of Table 6, TFP2 increases
monotonically with a decline in the corporate income tax rate. More efficient capital reallocation
can increase aggregate productivity in the economy by 2.6 percent.
Like many results in the literature, as in Hsieh and Klenow (2009), Restuccia and Rogerson
(2008), and Restuccia and Rogerson (2013), the above results highlight the importance of agent
heterogeneity in measuring productivity misallocation. The corporate income tax generates dis-
persion in marginal returns to capital across existing firms due to different tightness of capital
constraints by LFO. In addition, an increase in the employment rate need not be uniformly cor-
related with an increase in productivity. In fact, as less-talented entrepreneurs enter the market,
the average managerial quality falls, which could cause TFP to fall. The idea that the entry mar-
gin counteracts with the productivity misallocation margin is similar to that in Midrigan and Xu
23All the computations of Table 6 assume that the government maintains a balanced budget by varying the personal incometax parameter a2 . Doing away with this assumption changes the results very little. For example, Table 6 has TFP1 = 1.836when τc = 0. If parameter a2is held fixed, TFP1 = 1.838 when τc = 0.

VOL. NO. 41
(2014).
E. Welfare
This section considers the welfare implications of lowering the corporate income tax rate. A
decline in the corporate income tax rate has an ambiguous effect on aggregate welfare. On one hand,
C corporations benefit from such a reduction as they can retain more of their profits. On the other
hand, the corporate tax revenue may decrease, which requires an increase in the personal income
tax revenue to maintain a balanced government budget. The increase in personal income taxation
can adversely impact all agents in the economy. In this section, both aggregate and distributional
welfare effects are evaluated quantitatively by comparing the consumption-equivalent welfare values
between stationary equilibria under different corporate income tax rates.
Let V bench(z, a) be lifetime utility for an agent in state (z, a) in the benchmark economy, and let
V policy(z, a; τ c) be its counterpart in a stationary equilibrium with a policy change in the corporate
income tax rate τ c. For each agent, the percent of consumption he is willing to forgo in all contin-
gencies and in all future periods in order to live in the counterfactual economy is determined. This
consumption-equivalent welfare ξ(z, a; τ c) is such that24
V policy(z, a; τ c) =∞∑t=0
βt−1[α ln(cbencht (1 + ξ(z, a; τ c))) + (1− α) ln(1− nbencht ) + ιbencht η].
If the consumption-equivalent welfare ξ(z, a; τ c) is positive, then the agent is better off in the
counterfactual economy with the new corporate income tax rate τ c. If it is negative, the agent has
incurred a welfare loss after the policy change.25
Figure 5 graphs the average consumption-equivalent welfare for various corporate income tax
rates. This graph has an inverse U-shape. The peak occurs at a corporate income tax rate of about
10 percent where the average welfare gain is 1.32 percent. If the corporate income tax is eliminated,
the average welfare gain is 1.21 percent.
Establishing the aggregate welfare benefits that could occur from a decrease in the corporate
income tax rate is important. Equally important are the distribution welfare impacts from this
policy change. Table 7 reports the consumption-equivalent welfare by agents’ occupations in the
24The analytical derivation of ξ(z, a; τc) is given in Appendix E.25It is also possible to compare ex-ante welfare. Suppose all agents are born into steady states with zero assets and draw
their productivity z from the invariant distribution implied by the Markov process. The ex-ante consumption-equivalentwelfare can then be calculated by Ξ(τc) =
∫z ξ(z, a = 0; τc)G(dz). In our analysis, the ex-ante consumption-equivalent welfare
is monotonically increasing with a decline in the corporate income tax rate. With zero corporate income tax, the ex-anteconsumption-equivalent welfare is 1.91 percent.

42
benchmark economy. Two changes in the corporate income tax rate are examined. One scenario
is decreasing the corporate income tax rate to 10 percent, which is the rate that maximizes the
aggregate consumption-equivalent welfare. In the other scenario, the corporate income tax is com-
pletely eliminated. Both policy changes would enjoy popular support in the economy. Lowering the
corporate income tax rate directly lowers the tax obligation of C corporations and increases their
after-tax profitability. In each scenario, C corporate entrepreneurs on average have the most to gain,
compared with agents of other occupations. The average consumption-equivalent welfare of a C
corporate entrepreneur is 8.58% when the corporate income tax rate is 10 percent, and it is 13.58%
when the corporate income tax is eliminated. These gains are much larger in magnitude compared
with the welfare gain of an average agent in the economy, which are 1.32% and 1.21%, respectively.
Moreover, the lower the corporate income tax rate, the higher the consumption-equivalent welfare
of a C corporate entrepreneur becomes. All C corporate entrepreneurs would support a corporate
income tax cut.
Figure 5. Average Consumption Equivalent Welfare in Policy Experiment
00.050.10.150.20.285Corporate Income Tax Rate (Decreasing)
0
0.2
0.4
0.6
0.8
1
1.2
1.4
Con
sum
ptio
n E
quiv
alen
ts (
%)
All workers in the benchmark economy would also support the corporate income tax cut. Workers
benefit from an increase in the effective wage rate, which is more than enough to offset the increase in
the personal income tax burden. In addition, a small fraction of workers in the benchmark economy
who become C corporate entrepreneurs benefit from the reduction in the corporate income tax rate.
However, the average consumption-equivalent welfare of a worker is much lower than that of a C
corporate entrepreneur. An average worker in the benchmark economy would have a consumption-

VOL. NO. 43
equivalent welfare of 1.57% when the corporate income tax rate is set at 10 percent, and it is 1.49%
when the tax rate is zero. The consumption-equivalent welfare is lower when the corporate income
tax is eliminated due to the corresponding increase in the personal income tax burden.
Table 7—Welfare By Occupation
Proportion Average Welfare Percentage in FavorOccupation of Agents Gain (%) of Policy Change
τ c = 10% τ c = 0% τ c = 10% τ c = 0%Non-employed 0.341 0.81 0.51 100.00 97.06Worker 0.631 1.57 1.49 100.00 100.00Pass-through 0.022 0.83 1.40 63.64 41.03C corporation 0.006 8.58 13.58 100.00 100.00Overall 1.000 1.32 1.21 99.21 97.66
Pass-through businesses in the benchmark economy do not uniformly benefit from a lower corpo-
rate tax rate. A sizable fraction of pass-through entrepreneurs in the benchmark economy would
change LFO and become C corporate entrepreneurs under the new tax regimes. They support
the corporate income tax rate changes because they would benefit from improved access to capital
and higher profitability. Other pass-through entrepreneurs would be hurt by the lower corporate
income tax rates. Unlike C corporate entrepreneurs, the entrepreneurs who remain as pass-through
business owners do not receive any relief in their tax burden when the corporate income tax rate
is lowered. A decline in the corporate income tax rate leads to an increase in a firm’s labor cost as
the effective wage rate increases. In addition, a pass-through entrepreneur faces a higher personal
income tax. As a result, they would not be in favor of a corporate income tax cut. Higher personal
income taxes and higher labor costs also mean the support for a corporate tax policy change may
decline as the cut in the corporate income tax rate becomes larger. About 64 percent of pass-
through businesses in the benchmark economy would support lowering the corporate income tax
rate to 10 percent. This percentage declines to 41 percent if the corporate income tax is eliminated.
The average consumption-equivalent welfare of pass-through firms is positive. The consumption-
equivalent welfare for an average pass-through firm in the benchmark economy is 0.83% when the
tax rate is lowered to 10 percent, and it is 1.40% when the tax rate is set at zero. The average gain
of a pass-through entrepreneur is larger when the corporate income tax rate is zero, because those
who switch to operate C corporations would gain disproportionately more with a deeper cut in the
corporate income tax.
The average non-employed agent in the benchmark economy is better off under either tax-cut
regime. A lower corporate income tax rate stimulates labor demand in the economy. A non-

44
employment agent has a better chance of finding a job in the future. The potential labor earnings
also increase because the after-tax effective wage rate becomes higher. As a result, all non-employed
agents would support a corporate income tax cut to 10 percent, and 97 percent would support
eliminating the corporate income tax. However, the average welfare gain is small due to the
increase in the personal income tax collection on non-employment transfers. For a non-employed
individual in the benchmark economy, the average consumption-equivalent welfare is 0.81% when
the tax rate is 10 percent, and it is 0.51% if the tax is eliminated.
In general, a large majority of agents (more than 97%) would support a corporate income tax cut.
The corporate income tax reform in our model improves production efficiency by lessening capital
constraints for a significant fraction of the firms in the economy. Better production efficiency leads
to a higher aggregate output and a larger average corporate profit in the economy. As a result,
the corporate tax base in the economy becomes larger, and the government does not need to rely
on a large increase in the personal income tax collection to maintain a balanced budget. A higher
wage rate also means that the mass working-class households are likely to support the tax reform.
In addition, higher aggregate productivity leads to an increase in wealth for a large fraction of the
population, so we don’t see a large redistribution of wealth from the poor to the wealthy, as in
papers like Domeij and Heathcote (2004).26
V. Conclusion
This paper develops a dynamic stochastic occupational choice model with heterogeneous agents
and incorporates endogenous entrepreneurial decisions with respect to legal form of organization.
Taking into consideration the general equilibrium effect under the assumption of revenue neutrality,
a calibrated model is employed to evaluate the impact of a reduction in the corporate income tax
rate. Both LFO switching and new firm entry lead to a significant increase in the relative size of
the C corporate sector. Because the C corporation legal form offers better access to capital, the
expansion of the C corporate sector increases economic output, consumption, and capital formation.
Decreasing the corporate income tax burden also moderately increases the wealth gap.
A reduction in the corporate income tax rate leads to moderate job growth. If the corporate
income tax would be eliminated, the model predicts that the non-employed population would
decrease from 34.1 percent to 31.7 percent, about a 7 percent fall in the relative non-employment
26An important contribution of Domeij and Heathcote (2004) is that they take into account transitional dynamics and showthat comparing welfare across steady states can be misleading. Although transitional dynamic analysis is omitted here, wehave analyzed transitional dynamics of our model under a slightly different specification in a previous version of the paper. Thewelfare implications change little. In particular, a vast majority (80 percent) of the agents in the economy would support theelimination of the corporate income tax.

VOL. NO. 45
rate. Endogenous LFO choice is a key margin in explaining the employment effect. In particular,
the non-employment reduction due to a corporate income tax cut can be more than twice as large
if a model takes into full consideration entrepreneurs’ endogenous LFO choices.
In the economy, the corporate income tax distorts firm entry decisions and generates dispersion
in marginal returns to capital across existing firms due to different tightness of capital constraints.
Interestingly, the effect of a reduction of the corporate income tax rate on overall economic efficiency
is non-monotonic. Because of the two counterbalancing forces, eliminating the corporate income
tax has a relatively small overall effect on TFP (an increase of only about 0.9 percent). The
productivity loss due to capital misallocation caused by the corporate income taxation is estimated
to be 2.6 percent.
A welfare analysis is conducted to examine the different corporate income tax regimes. A re-
duction in the corporate income tax rate does not always improve welfare. Average welfare is
maximized with a 10 percent corporate income tax rate. With a lower corporate income tax rate,
the widening of the corporate income tax base allows the government to maintain revenue neutral-
ity without large increases in the personal income tax burden. At the same time, workers’ welfare
improves due to higher after-tax wages, and C corporation entrepreneurs are better off due to the
reduction in the corporate income tax liability. An overwhelming majority of the population would
be in favor of the corporate income tax cut in this environment. Specifically, 99 percent of the
population would support a corporate income tax cut to 10 percent, and 97.7 percent would be in
favor of the elimination of the corporate income tax.
An important contribution of the paper is to point out the importance of considering LFO choice
when evaluating the corporate income tax policy. For future research, two aspects of the LFO
choice can be further explored. C corporations can finance business operations using retained
earnings. Firm-owned capital, in a dynamic environment, can aid faster firm growth. This offers
an alternative explanation why firms choose to be C corporations. The current model can also
be extended to analyze the sources of corporate finance and LFO choices. For debt financing, we
can consider the possibility of firm default. Corporations, including both C and S corporations,
have limited liabilities. Better management of future default risk offers another possible reason for
firms to incorporate. For equity financing, the model can incorporate modeling of shareholders.
The corporate income tax can potentially affect the risk of equity issuing and investment efficiency,
which in turn affect a firm’s LFO choices. In both aspects, the main challenge is the complexity in
modeling firms’ ownership structure across periods while taking into account possible changes in
LFO, which we hope to overcome in future papers.

46
REFERENCES
Amaral, Pedro S, and Erwan Quintin. 2010. “Limited Enforcement, Financial Intermedia-
tion, and Economic Development: a Quantitative Assessment.” International Economic Review,
51(3): 785–811.
Anagnostopoulos, Alexis, Eva Carceles-Poveda, and Danmo Lin. 2012. “Dividend and
Capital Gains Taxation Under Incomplete Markets.” Journal of Monetary Economics, 59(7): 599–
611.
Atesagaoglu, Orhan, Eva Carceles-Poveda, and Alexis Anagnostopoulos. 2014. “Capital
Income Taxation with Household and Firm Heterogeneity.” Stony Brook University.
Auerbach, Alan J. 2002. “Taxation and Corporate Financial Policy.” In Handbook of Public
Economics. Vol. 3 of Handbook of Public Economics, , ed. A. J. Auerbach and M. Feldstein,
Chapter 19, 1251–1292. Elsevier.
Auerbach, Alan J. 2006. “Who Bears the Corporate Tax? A Review of What We Know.” Tax
Policy and the Economy, 1–40.
Ballard, Charles L, John B Shoven, and John Whalley. 1985. “General Equilibrium Com-
putations of the Marginal Welfare Costs of Taxes in the United States.” American Economic
Review, 75(1): 128–38.
Bradford, David F. 1978. “Factor Prices may be Constant but Factor Returns are Not.” Eco-
nomics Letters, 1(3): 199–203.
Bradford, David F. 1981. “The Incidence and Allocation Effects of a Tax on Corporate Distri-
butions.” Journal of Public Economics, 15(1): 1–22.
Buera, Francisco J, Joseph P Kaboski, and Yongseok Shin. 2011. “Finance and Develop-
ment: A Tale of Two Sectors.” The American Economic Review, 101(5): 1964–2002.
Cagetti, Marco, and Mariacristina De Nardi. 2006. “Entrepreneurship, Frictions, and
Wealth.” Journal of Political Economy, 114(5): 835–870.
Carroll, Christopher D. 2006. “The Method of Endogenous Gridpoints for Solving Dynamic
Stochastic Optimization Problems.” Economics Letters, 91(3): 312–320.
Caselli, Francesco, and Nicola Gennaioli. 2013. “Dynastic Management.” Economic Inquiry,
51(1): 971–996.

VOL. NO. 47
Chen, Daphne, and Shi Qi. 2016. “The Importance of Legal Form of Organization on Small
Corporation External Financing.” Economic Inquiry, 54(3): 1607–1620.
Chetty, Raj, and Emmanuel Saez. 2005. “Dividend Taxes and Corporate Behavior: Evidence
from the 2003 Dividend Tax Cut.” The Quarterly Journal of Economics, 120(3): 791–833.
Clausen, Andrew, and Carlo Strub. 2012. “Envelope Theorems for Non-smooth and Non-
concave Optimization.” University of Pennsylvania.
Cole, Rebel. 2011. “How do Firms Choose Legal Form of Organization?” University Library of
Munich, Germany MPRA Paper 32591.
Conesa, Juan Carlos, and Dirk Krueger. 2006. “On the Optimal Progressivity of the Income
Tax Code.” Journal of Monetary Economics, 53(7): 1425–1450.
Conesa, Juan Carlos, Sagiri Kitao, and Dirk Krueger. 2009. “Taxing Capital? Not a Bad
Idea After All!” The American Economic Review, 99(1): 25–48.
Cooley, Thomas F., and Vincenzo Quadrini. 2001. “Financial Markets and Firm Dynamics.”
American Economic Review, 91(5): 1286–1310.
Davis, Steven J., John C. Haltiwanger, and Scott Schuh. 1998. Job Creation and Destruc-
tion. Vol. 1 of MIT Press Books, The MIT Press.
Davis, Steven J., John Haltiwanger, Ron Jarmin, and Javier Miranda. 2007a. “Volatility
and Dispersion in Business Growth Rates: Publicly Traded versus Privately Held Firms.” In
NBER Macroeconomics Annual 2006, Volume 21. NBER Chapters, 107–180. National Bureau of
Economic Research, Inc.
Davis, Steven J., John Haltiwanger, Ron Jarmin, and Javier Miranda. 2007b. “Volatil-
ity and Dispersion in Business Growth Rates: Publicly Traded versus Privately Held Firms.”
National Bureau of Economic Research, Inc NBER Macroeconomics Annual 2006.
Devereux, Michael P, Li Liu, and Simon Loretz. 2014. “The Elasticity of Corporate Taxable
Income: New Evidence from UK Tax Records.” American Economic Journal: Economic Policy,
6(2): 19–53.
Diaz-Gimenez, J., A. Glover, and J.-V. Rios-Rull. 2011. “Facts on the Distributions of
Earnings, Income, and Wealth in the United States: 2007 Update.” Federal Reserve Bank of
Minneapolis Quarterly Review, 34(1): 2–31.

48
Domeij, David, and Jonathan Heathcote. 2004. “On the Distributional Effects of Reducing
Capital Taxes.” International Economic Review, 45(2): 523–554.
Ellen R. McGrattan, Richard Rogerson, and Randall Wright. 1997. “An Equilibrium
Model of the Business Cycle with Household Production and Fiscal Policy.” International Eco-
nomic Review, 38(2): 267–290.
Erosa, Andres. 2001. “Financial Intermediation and Occupational Choice in Development.” Re-
view of Economic Dynamics, 4(2): 303–334.
Fehr, Hans, Sabine Jokisch, Ashwin Kambhampati, and Laurence J Kotlikoff. 2013.
“Simulating the Elimination of the US Corporate Income Tax.” National Bureau of Economic
Research.
Feldstein, Martin. 1978. “The Welfare Cost of Capital Income Taxation.” In Research in Taxa-
tion. NBER Chapters, 29–51. National Bureau of Economic Research, Inc.
Feldstein, Martin S, and Joel Slemrod. 1980. “Personal Taxation, Portfolio Choice, and the
Effect of the Corporation Income Tax.” Journal of Political Economy, 88(5): 854–66.
Gomes, Joao F. 2001. “Financing Investment.” American Economic Review, 91(5): 1262–1285.
Goolsbee, Austan. 1998. “Taxes, Organizational form, and the Deadweight Loss of the Corporate
Income Tax.” Journal of Public Economics, 69(1): 143–152.
Goolsbee, Austan. 2004. “The Impact of the Corporate Income Tax: Evidence from State Or-
ganizational Form Data.” Journal of Public Economics, 88(11): 2283–2299.
Gordon, Roger H, and Jeffrey K MacKie-Mason. 1994. “Tax Distortions to the Choice of
Organizational Form.” Journal of Public Economics, 55(2): 279–306.
Gordon, Roger H, and Joel B Slemrod. 2000. “Are” Real” Responses to Taxes Simply In-
come Shifting Between Corporate and Personal Tax Bases?” Does Atlas Shrug?: The Economic
Consequences of Taxing the Rich, 240.
Gourio, Francois, and Jianjun Miao. 2010. “Firm Heterogeneity and the Long-Run Effects of
Dividend Tax Reform.” American Economic Journal: Macroeconomics, 2(1): 131–68.
Gouveia, Miguel, and Robert P Strauss. 1994. “Effective Federal Individual Income Tax
Functions: An Exploratory Empirical Analysis.” National Tax Journal, 317–339.

VOL. NO. 49
Gravelle, Jane G, and Laurence J Kotlikoff. 1989. “The Incidence and Efficiency Costs of
Corporate Taxation When Corporate and Noncorporate Firms Produce the Same Good.” Journal
of Political Economy, 97(4): 749–80.
Gruber, Jon, and Emmanuel Saez. 2002. “The Elasticity of Taxable Income: Evidence and
Implications.” Journal of public Economics, 84(1): 1–32.
Guner, Nezih, Gustavo Ventura, and Yi Xu. 2008. “Macroeconomic Implications of Size-
dependent Policies.” Review of Economic Dynamics, 11(4): 721–744.
Haltiwanger, John, Ron Jarmin, and Javier Miranda. 2013. “Who Creates Jobs? Small
versus Large versus Young.” The Review of Economics and Statistics, 95(2): 347–361.
Hansen, Gary D., and Ayse Imrohoroglu. 1992. “The Role of Unemployment Insurance
in an Economy with Liquidity Constraints and Moral Hazard.” Journal of Political Economy,
100(1): 118–142.
Harberger, Arnold C. 1962. “The Incidence of the Corporation Income Tax.” Journal of Political
Economy, 70(3): 215–40.
Harberger, Arnold C. 1995. “The ABCs of Corporation Income Taxation.” American Council
for Capital Formation, Tax Policy and Economic Growth, 1: 51–73.
Hopenhayn, Hugo A. 1992. “Entry, Exit, and Firm Dynamics in Long Run Equilibrium.” Econo-
metrica, 60(5): 1127–50.
Hopenhayn, Hugo, and Richard Rogerson. 1993. “Job Turnover and Policy Evaluation: A
General Equilibrium Analysis.” Journal of Political Economy, 101(5): 915–38.
Hsieh, Chang-Tai, and Peter J Klenow. 2009. “Misallocation and Manufacturing TFP in
China and India.” The Quarterly Journal of Economics, 124(4): 1403–1448.
Hurst, Erik, and Benjamin Pugsley. 2011. “What Do Small Businesses Do?” Brookings Papers
on Economic Activity, 2011(2): 73–118.
Imrohoroglu, Ayse, and Selale Tuzel. 2014. “Firm-level Productivity, Risk, and Return.”
Management Science, 60(8): 2073–2090.
Imrohoroglu, Selahattin. 1998. “A Quantitative Analysis of Capital Income Taxation.” Inter-
national Economic Review, 39(2): 307–28.

50
Iskhakov, Fedor, John Rust, and Bertel Schjerning. 2012. “A Generalized Endogenous Grid
Method for Discrete-continuous Choice.” University of Technology Sydney mimeo.
J. Diaz-Gimenez, A. Glover, and J.-V. Rios-Rull. 2011. “Facts on the Distributions of
Earnings, Income, and Wealth in the United States: 2007 Update.” Federal Reserve Bank of
Minneapolis Quarterly Review, 34(1): 2–31.
Jensen, Michael C. 1986. “Agency Costs of Free Cash Flow, Corporate Finance, and Takeovers.”
American Economic Review, 76(2): 323–29.
Jorgenson, Dale W. 1963. “Capital Theory and Investment Behavior.” The American Economic
Review, 53(2): 247–259.
King, Mervyn A, and Don Fullerton. 1984. The Taxation of Income from Capital: a Compar-
ative Study of the United States, the United Kingdom, Sweden and West Germany. University of
Chicago Press.
Kotlikoff, Laurence J., and Jianjun Miao. 2010. “What Does the Corporate Income Tax Tax?
A Simple Model without Capital.” National Bureau of Economic Research, Inc NBER Working
Papers 16199.
Kotlikoff, Laurence J, and Lawrence H Summers. 1987. “Tax Incidence.” Handbook of Public
Economics, 2: 1043–1092.
Lucas, Robert E. 1978. “On the Size Distribution of Business Firms.” The Bell Journal of
Economics, 9(2): 508–23.
Mackie-Mason, Jeffrey K, and Roger H Gordon. 1997. “How Much Do Taxes Discourage
Incorporation?” The Journal of Finance, 52(2): 477–506.
McGrattan, Ellen, and Edward Prescott. 2013. “On Financing Retirement with an Aging
Population.” Federal Reserve Bank of Minneapolis Staff Report, 472.
McGrattan, Ellen R. 2012. “Capital Taxation During the U.S. Great Depression.” The Quarterly
Journal of Economics, 127(3): 1515–1550.
McGrattan, Ellen R., and Edward C. Prescott. 2000. “Is the Stock Market Overvalued.”
Federal Reserve Bank of Minneapolis Quarterly Review, 24(4): 20–40.
McGrattan, Ellen R., and Edward C. Prescott. 2005. “Taxes, Regulations, and the Value of
U.S. and U.K. Corporations.” Review of Economic Studies, 72(3): 767–796.

VOL. NO. 51
McGrattan, E., Richard Rogerson, and Randall Wright. 1997. “An Equilibrium Model
of the Business Cycle with Household Production and Fiscal Policy.” International Economic
Review, 38(2): 267–290.
Mertens, Karel, and Morten O. Ravn. 2013. “The Dynamic Effects of Personal and Corporate
Income Tax Changes in the United States.” American Economic Review, 103(4): 1212–1247.
Miao, Jianjun, and Pengfei Wang. 2014. “Lumpy Investment and Corporate Tax Policy.”
Journal of Money, Credit and Banking, 46(6): 1171–1203.
Midrigan, Virgiliu, and Daniel Yi Xu. 2014. “Finance and Misallocation: Evidence from
Plant-level Data.” The American Economic Review, 104(2): 422–458.
Quadrini, Vincenzo. 2000. “Entrepreneurship, Saving, and Social Mobility.” Review of Economic
Dynamics, 3(1): 1–40.
Restuccia, Diego, and Richard Rogerson. 2008. “Policy Distortions and Aggregate Produc-
tivity with Heterogeneous Establishments.” Review of Economic Dynamics, 11(4): 707–720.
Restuccia, Diego, and Richard Rogerson. 2013. “Misallocation and Productivity.” Review of
Economic Dynamics, 16(1).
Shoven, John B. 1976. “The Incidence and Efficiency Effects of Taxes on Income from Capital.”
Journal of Political Economy, 84(6): 1261–83.
Stiglitz, Joseph E. 1976. “The Corporation Tax.” Journal of Public Economics, 5(3-4): 303–311.
Tauchen, George. 1986. “Finite State Markov-Chain Approximations to Univariate and Vector
Autoregressions.” Economics Letters,, 20: 177–181.