corporate greenhouse gas emissions reduction plan
TRANSCRIPT

Township of Langley
Corporate Greenhouse Gas Emissions Reduction Plan
Submitted to: Submitted by:
The Sheltair Group The Township of Langley’s Water Resources and Environment Department
Final Report June 2006


Township of Langley Corporate GHG Emission Reduction Plan
Summary
Background
The Township of Langley is a participant in the Partners for Climate Protection (PCP) Program, implemented through the Federation of Canadian Municipalities (FCM). The program is a five milestone framework to develop and implement greenhouse gas (GHG) reduction activities at the corporate and community level. The Township joined in early 2001, and has completed PCP Milestone 1 of the program to develop a baseline inventory of emissions.
Objective
This project entails developing a corporate greenhouse gas (GHG) management plan for the Township to meet PCP Milestones 2 (establish a target) and 3 (develop an action plan).
Methodology
Using the data from the Milestone 1 report, as well as additional utility information, research, and interviews and discussions with Township managers, the energy and GHG emission profiles were updated to 2004. Two forecasts of GHG energy emissions were then generated, which were used to evaluate emission reduction options and define a reduction target for the Township.
Energy and Emission Profiles
An emissions profile (i.e. a snap-shot of all emissions at one point in time) has been developed for the years 2000 and 2004 - building on the Milestone 1 profiles generated for 1995, 1999, and 2003. The energy consumption and associated GHG emissions have changed over the past decade due to substantial changes in the infrastructure that the Township operates.
The energy uses that generate the majority of the GHGs attributable to Township activities are building operations (notably the aquatic centers) and vehicle fleet operations.
Forecast Scenarios
Two forecast scenarios of energy consumption and GHG emissions were made. Both scenarios account for increased population as well as potential new facilities defined in the Township’s ten year capital plan.
The first, a business-as-usual forecast called “BAU2000 Forecast”, estimated the future emissions based on the operating condition in the baseline year (2000). This forecast does not include recent energy conservation efforts such as signal light replacements, energy efficient lighting retrofits at three major civic buildings, or
F inal Report (June 2, 2006) | Page i

Township of Langley Corporate GHG Emission Reduction Plan
the new municipal facility, which is targeting to achieve LEEDTM Silver status, nor does it include any future energy reduction activities.
The second scenario called the “Emission Reduction Plan (ERP) forecast”, includes the conservation efforts since 2000 as well as the estimated effects of a determined course of energy reduction in the future.
Results
GHG emissions profile results are summarized in Table S-1 for the year 2000 (proposed baseline year), and the 2010 emissions based on the two scenarios developed. Year 2000 emissions are estimated at 5160 tonnes of CO2 equivalent. The BAU2000 forecast predicts that emissions will increase by 19% by 2010 if no emission reduction actions are taken. The emission reduction scenario forecasts that emissions will decline by 11.7% from the year 2000 as a result of recent and future actions.
Recommendation: That the Township adopt a GHG Emissions Reduction Target of “10% below year 2000 levels by the year 2010”.
Table S-1: GHG Forecast Summary
Scenario and Year Emissions (t CO2e)
Change from 2000 (t CO2e)
Change from 2000 ( % )
2000 Baseline 5160 -- -- 2010 BAU2000 6150 + 990 + 19.2 2010 Reduction Plan 4555 - 605 - 11.7
Note: “ t CO2e ” = tonnes of CO2 equivalent emissions
Actions
Through discussions with Township staff, research, and reviews of the emission profiles, a set of proposed actions is defined. These actions, highlighted in the report, include reducing energy consumption in existing and future facilities, increasing usage of biodiesel and promoting “GHG awareness” amongst staff. These actions require a substantial commitment, and are based on other projects that have typically achieved acceptable payback returns.
Implementation
An implementation strategy has been proposed. The desire is to integrate GHG reduction activities with other corporate environmental, energy reduction, and sustainability related activities. A reporting structure has been recommended to ensure the follow through on proposed actions.
F inal Report (June 2, 2006) | Page ii

Township of Langley Corporate GHG Emission Reduction Plan
Contents
Summary..............................................................................................................................................i Contents ............................................................................................................................................ iii List of Tables....................................................................................................................................... v List of Figures ..................................................................................................................................... v Abbreviations....................................................................................................................................vi Acknowledgements .......................................................................................................................vii
1 Introduction ............................................................................................................... 1 1.1 Background...................................................................................................................... 1
1.1.1 Climate Change and Greenhouse Gas Emissions ........................................... 1 1.1.2 The Kyoto Protocol and Canada’s Commitments to Reductions................. 1 1.1.3 The Partners for Climate Protection Program ................................................... 1 1.1.4 Corporate vs. Community Actions ..................................................................... 2
1.2 Objectives......................................................................................................................... 3 1.3 Project Methodology...................................................................................................... 3
2 Situation Analysis and Local Context ..................................................................... 5 2.1 The Township’s Commitment to Climate Protection ................................................. 5 2.2 Location and Geography.............................................................................................. 5 2.3 Population ........................................................................................................................ 7 2.4 Service Growth ................................................................................................................ 7 2.5 Implications for Program Development....................................................................... 7
3 GHG Emissions Profile and Forecasts...................................................................... 8 3.1 Township Energy Supply and Use.................................................................................. 8
3.1.1 Township Energy Consumption Profile ............................................................... 8 3.1.2 Energy Supply and Associated GHG emissions ................................................ 9 3.1.3 Energy End Use and Associated GHG Emissions .............................................. 9
3.2 GHG Profile ..................................................................................................................... 11 3.3 Baseline Year .................................................................................................................. 12 3.4 Business-as-usual (BAU2000) Forecast ........................................................................... 12 3.5 Emission Reduction Plan Forecast............................................................................... 13 3.6 Forecast Summary......................................................................................................... 14 3.7 GHG Emissions Reduction Target ................................................................................ 15
3.7.1 Target Setting ....................................................................................................... 15 3.7.2 Reductions by End Use ....................................................................................... 15
3.8 Implications for Program Design ................................................................................. 18
4 GHG Reduction Opportunities ............................................................................... 19 4.1 Existing Buildings............................................................................................................. 20 4.2 New Buildings ................................................................................................................. 22 4.3 Recreation Centers ....................................................................................................... 24
F inal Report (June 2, 2006) | Page iii

Township of Langley Corporate GHG Emission Reduction Plan
4.4 Vehicles........................................................................................................................... 25 4.5 Utility Services ................................................................................................................. 28
4.5.1 Street and Traffic Lighting................................................................................... 28 4.5.2 Water, Sewage, and Drainage......................................................................... 29 4.5.3 Solid Waste (Township facilities) ........................................................................ 30 4.5.4 Parks....................................................................................................................... 31
4.6 Purchasing ...................................................................................................................... 32 4.7 Demonstrations of Leadership..................................................................................... 33 4.8 Implications for Program Implementation................................................................. 34
5 Program Implementation ....................................................................................... 35 5.1 Description...................................................................................................................... 35 5.2 Program Delivery ........................................................................................................... 35
5.2.1 Program Champion ............................................................................................ 35 5.2.2 Program Coordinator.......................................................................................... 35 5.2.3 Resource Requirements...................................................................................... 36 5.2.4 Integration with other activities......................................................................... 36
5.3 Reporting ........................................................................................................................ 37 5.3.1 Reporting Requirements..................................................................................... 37 5.3.2 Reporting Activities.............................................................................................. 37
5.4 Potential Funding Partners ........................................................................................... 39
6 Next Steps ................................................................................................................ 40
7 Appendices ............................................................................................................. 41
F inal Report (June 2, 2006) | Page iv

Township of Langley Corporate GHG Emission Reduction Plan
List of Tables
Table 1: Township of Langley Profile .......................................................................................................... 6 Table 2: Past and Potential Service Growth in the Township................................................................. 7 Table 3: ToL Corporate Energy Consumption Profile 2004..................................................................... 8 Table 4: Top Natural Gas Consumers within the Township (2004)....................................................... 10 Table 5: GHG Emission Factors ................................................................................................................. 11 Table 6: Township Corporate GHG Emissions, 2000 and 2004............................................................. 11 Table 7: GHG Forecast Summary............................................................................................................. 14 Table 8: Hypothetical Emission Reductions Used to Generate the “Emission Reduction Plan”
Forecast.............................................................................................................................. 16 Table 9: Summary of Forecasted GHG Reductions by Activity Category ........................................ 17 Table 10: Programs Available to Manage Corporate Emissions......................................................... 39
List of Figures
Figure 1: Location Map of the Township of Langley in the Lower Mainland ....................................... 6 Figure 2: Breakdown of ToL (a) Energy Supply and (b) Corresponding GHG Emissions (2004) ........ 9
Figure 3: Breakdown of ToL (a) Energy End-Use and (b) Resulting GHG Emissions, (2004)............. 10
Figure 4: Historical and Scenario Forecasted GHG Emissions.............................................................. 14
F inal Report (June 2, 2006) | Page v

Township of Langley Corporate GHG Emission Reduction Plan
Abbreviations
CBIP Commercial Building Incentive Program
CEP Community Energy Plan
CO2 Carbon Dioxide
DSM Demand Side Management
ERM Emission Reduction Measures
FCM Federation of Canadian Municipalities
GHG Greenhouse Gas
GJ Gigajoules (one billion joules)
GWh Giga Watt Hour (1 million kWh)
GVRD Greater Vancouver Regional District
HVAC Heating Ventilation and Air Conditioning
LAP Local Action Plan (for Greenhouse Gas Emission Reduction)
LEED Leadership in Energy and Environmental Design
OCP Official Community Plan
PCP Partners for Climate Protection Program
SFD Single Family Dwelling
tCO2e tonnes Carbon Dioxide Equivalent
ToL Township of Langley
F inal Report (June 2, 2006) | Page vi

Township of Langley Corporate GHG Emission Reduction Plan
Acknowledgements
This report was prepared by Ron Macdonald with guidance and input from Innes Hood of The Sheltair Group. Ryan Schmidt was the Township project manager.
Numerous Township staff contributed to this report by providing knowledge, experience, and information. This included (in no specific order): Ryan Schmidt; Harb Chohan; Brad Badelt; Rene Payer; Terry Veer; Earl Erickson; Bill Lindahl; John McQueen; Wyatt Babcock; Timo Siira; Dellarae Sawchuk, and Colin Wright. A special acknowledgement is made to Harb Chohan, who assembled a thorough dataset for the Milestone 1 baseline report.
Further utility data was provided by Dina Matterson of BC Hydro, and Hans Mertins of Terasen Gas.
The effort of these people is appreciated.
F inal Report (June 2, 2006) | Page vii

Township of Langley Corporate GHG Emission Reduction Plan
1 Introduction
1.1 Background
1.1.1 Climate Change and Greenhouse Gas Emissions
Human activities - primarily the burning of fossil fuels - are resulting in increased concentrations of carbon dioxide and other greenhouse gases (GHGs) in the atmosphere. These excess GHGs accelerate the heat trapping ‘greenhouse effect’ within the atmosphere, and contribute to global climate change. The effects of climate change include disruptions to our climate and weather systems, with resulting impacts to the natural systems that humans rely upon. These changes are expected to occur within a few decades, and some researchers believe the effects are already observable.
1.1.2 The Kyoto Protocol and Canada’s Commitments to Reductions
The Kyoto Protocol is an international agreement to manage greenhouse gas emissions. Canada is signatory to the agreement which came into force in 2005. In the agreement Canada has committed to reducing its total emissions of greenhouse gases to 6% below 1990 levels by the year 2012.
Over the past 15 years, Canada’s emissions have increased from 596 million tones to 740 million tones per year - an increase of 24% 1. Thus, meeting a target reduction of 6% below the baseline year has become a substantial challenge.
An important comment about the Kyoto commitments is that they describe the total emissions of GHGs. That is, these emissions are not on a basis of per person, or per dollar of GPD. Even though the nation’s population and economy will grow, the available amount of emissions does not. This will entail a continued effort for efficiency improvements and conservation.
1.1.3 The Partners for Climate Protection Program
Climate change is a global issue, yet addressing it will require countless local actions worldwide. In Canada, the Federation of Canadian Municipalities (FCM) has developed the Partners for Climate Protection (PCP) Program to guide municipal governments towards reducing GHG emissions. The PCP program defines a process for municipal governments to quantify their GHG emissions and then to develop and implement action plans that can achieve emissions reductions.
1 http://www.ec.gc.ca/pdb/ghg/inventory_report/2003_factsheet/2003Factsheet_e.cfm#s1
F inal Report (June 2, 2006) | Page 1
Township of Langley Corporate GHG Emission Reduction Plan
The PCP program consists of five milestones:
1. Conduct a baseline emission analysis for municipal operations and the community.
2. Establish GHG reduction targets for both municipal operations and the community.
3. Develop a local action plan outlining action items to reduce energy use and greenhouse gas emissions from municipal operations and throughout the community.
4. Establish a program to implement action items that will reduce GHG emissions.
5. Continue to monitor, verify, and report GHG reduction achievements and amend the action plan accordingly to reflect new strategies.
Over 125 municipalities from across Canada have joined the PCP program including 39 in BC2. Of the municipalities in BC that have joined the PCP program, as of January 2006, two municipalities have achieved Milestone 4 (City of North Vancouver and Whistler), and the City of Vancouver has developed a local action plan in accordance with Milestone 3. The remainder of the participating municipalities are in the process of collecting baseline information or developing their management plans (Milestones 1, 2, and 3).
1.1.4 Corporate vs. Community Actions
GHG Emissions Reduction Plans address a municipality’s GHG emissions, including both corporate (municipal operations) and community sources.
• Corporate GHG emissions result from the energy consumption and solid waste generated during the delivery of municipal services and operation of facilities. Primary sources are: i) the combustion products from natural gas and liquid fuels, ii) the indirect emissions created during the generation of consumed electricity, and iii) the decay products of waste generated by the municipality. The uses associated with these emissions are building operations (heat and lighting), vehicle fleet operations, and infrastructure operations (water, wastewater, and solid waste). Many actions that can reduce corporate emissions are within the powers of municipal Council and staff.
• Community GHG emissions result from all the energy consumption activities within the community. For most urban areas, the primary sources are the combustion products from natural gas and liquid fuels, and the indirect emissions created during the generation of consumed electricity. There will also be GHG contributions from the decay products of waste generated by residents.
2 see www.fcm.ca
F inal Report (June 2, 2006) | Page 2
Township of Langley Corporate GHG Emission Reduction Plan
Uses associated with this energy consumption are primarily water and space heating, transportation, and electricity consumption. Actions that can reduce community emissions are partially within the influence of municipalities, but also require actions by other levels of government and the citizens at large (which can often be assisted or encouraged by the municipality).
1.2 Objectives
This project entails developing a corporate greenhouse gas (GHG) management plan for the Township. This plan is structured according to Milestones 2 and 3 of the Partners for Climate Protection program. Specific objectives of this project are as follows:
• Review the emissions inventory and forecasts created in 2004 and update or revise as appropriate;
• Establish a corporate GHG reduction target in accordance with the PCP program’s Milestone 2;
• Develop an Emissions Reduction Plan (ERP) to meet the requirements of Milestone 3;
• Define strategies for the implementation of the plan; and
• Assist with identifying potential funding sources for implementing the plan.
1.3 Project Methodology
This analysis included a background information review; an update of the GHG emissions baseline and forecast; an assessment of reduction opportunities assessment process involving Township staff, and the development of an implementation plan.
1. Background and Situation Review
Available background information was reviewed to better understand the existing and potential future emissions sources operated by the Township. Specific information reviewed included the:
• PCP Milestone 1 report,
• 10 year capital forecasts,
• 2005 - 2009 Financial Plan
2. Update of the GHG emissions baseline and forecasts
The GHG baseline was reviewed and updated to 2004 using updated utility information. A forecast of a “Business as Usual” (BAU) scenario based on the facilities and conditions in place in 2000 was developed. This included a consideration of both the planned and potential future facilities as well as population-based growth of Township services.
F inal Report (June 2, 2006) | Page 3

Township of Langley Corporate GHG Emission Reduction Plan
An “Emissions Reduction Plan” scenario forecast was developed that included energy reductions, using typical reduction estimates for specific service areas. The scenario evaluation was used to identify a potential target for GHG reduction.
3. Opportunities Identification
Potential opportunities were identified through meetings and interviews with senior Township staff. Options were identified through a brainstorming session that which sought to define management knowledge and comfort with each potential action. The purpose of these meetings and interviews was to compile current and potential emission reduction activities that could form part of Langley’s GHG management plan.
4. Implementation Plan
This component focused on developing an implementation plan to manage corporate energy use and GHG emissions, based on the management framework defined and feedback obtained through the consultation process.
F inal Report (June 2, 2006) | Page 4

Township of Langley Corporate GHG Emission Reduction Plan
2 Situation Analysis and Local Context
An array of factors contributes to how the Township consumes energy and produces GHG emissions. This section provides an overview of these factors.
2.1 The Township’s Commitment to Climate Protection
The Township of Langley Council committed its support for the PCP program in 2001 by resolving that:
“the Township of Langley communicate to the FCM its support for the partners for Climate Protection Program and its interest in participating in the PCP program”3
In April 2002, Council indicated its support for the Kyoto Protocol by resolving that:
“the Township of Langley endorses ratification of the Kyoto Protocol” 4
A corporate GHG emissions baseline was prepared by Township staff and completed in September 20045.
In November 2005, staff sent an update report to Council, informing them of the current work to develop a corporate action plan. 6
2.2 Location and Geography
The Township of Langley is located in the Lower Mainland region of BC between the Fraser River and the US border (Figure 1). The municipality was incorporated in 1873.
Langley Township has an area of 322 square kilometers making it the second largest municipal area within the Greater Vancouver Regional District (GVRD). It is comprised of several major residential and urban areas (a “Community of Communities”) separated by large areas of agricultural land. Much of the agricultural land is contained within the Agricultural Land Reserve. (see Table 1).
3 Township of Langley Regular Council Meeting Minutes January 15, 2001, available via links from www.tol.bc.ca to http//langley.ihostez.com/contentengine/launch.asp 4 Township of Langley Regular Council Meeting Minutes April 8, 2002, available via links from www.tol.bc.ca to http//langley.ihostez.com/contentengine/launch.asp 5 Township of Langley, 2004, “Township of Langley Greenhouse Gas Inventory and Forecast Report with Recommendations for the Development of a Corporate Action Plan”, prepared by the ToL Environment Department, September 2004. 6 Township of Langley Regular Council Meeting Minutes November 7, 2005, available via links from www.tol.bc.ca to http//langley.ihostez.com/contentengine/launch.asp
F inal Report (June 2, 2006) | Page 5

Township of Langley Corporate GHG Emission Reduction Plan
Figure 1: Location Map of the Township of Langley in the Lower Mainland
Table 1: Township of Langley Profile7
Descriptor Magnitude
Community Total Township Area 316 square kilometers
(122 square miles) Area within the Agricultural Land Reserve (ALR) 238 square kilometers
(92 square miles) Population (2004 estimate) 94,775 Population within the defined communities (2004 estimate) [see Note a]
67,624 (71 % of total)
5-year Population Growth Rate, 1996 – 2001 [see Note a]
8.4 % over 5 years 1.6 % annually
5-year Population Growth Rate, 1991 – 1996 [see Note a]
22 % over 5 years 4.0 % annually
Township Township Staff 2003: Full time, part time, auxiliary 839 Equipment and Vehicle Fleet (number) 137
Notes: (a) The defined communities are Fort Langley, Walnut Grove, Willoughby, Murrayville, Brookswood/Fernridge, and Aldergrove.
(b) Five year periods shown are census intervals.
7 Ref. http://www.bcstats.gov.bc.ca/data/pop/pop/mun/Mun9605a.asp
F inal Report (June 2, 2006) | Page 6

Township of Langley Corporate GHG Emission Reduction Plan
2.3 Population
The population in the Township is estimated at 94,775 (2004) and population growth has been substantial in the past two decades ranging from 4.0% annually in the early 1990s to about 1.6% annually from 1996 to 2001.
2.4 Service Growth
A result of the population growth is a requirement for expanded services - both utility services as well as recreational services. Recent and potential future facilities growth is shown in Table 2.
Table 2: Past and Potential Service Growth in the Township
Proposed Items Year
Buildings/Rec Walnut Grove Expansion 1999 Buildings Civic Facility (municipal hall will no longer be used) 2005 Buildings/Rec W.C. Blair Expansion (gymnasium, multi-use facilities) 2007 Buildings Museum Replacement 2007 or beyond Buildings/Rec Aldergrove Kinsmen Center (undefined scope) 2008 or beyond Buildings/Rec Willowbrook Rec Center (undefined scope) 2009 or beyond Water Three new booster pump stations 2006 Sewer One New lift Station 2006 Parks Five new sports field lighting systems 2007 - 2010 Vehicles 6 new vehicles in 2006. 2006
Notes: (1) Listed facilities are either completed or have been identified in the 10-year capital plans. Future facilities have not been confirmed or approved. (2) This list is a sampling and may not be complete.
2.5 Implications for Program Development
Major issues and their implications for designing a corporate GHG plan are:
• The Township is a growing community with increasing service demands into the future.
• The population is spread over a large service area. About 71% live in the defined communities and the remainder, are spread throughout the Township.
• A large area of the Township is contained within the Agricultural Land Reserve and this will limit developmental sprawl. The expansion of utility services will be in regions that are already serviced. Thus it is expected that the growth of sewer, water, and lighting system energy demands will be below the expected growth rate of the population.
F inal Report (June 2, 2006) | Page 7
Township of Langley Corporate GHG Emission Reduction Plan
3 GHG Emissions Profile and Forecasts
This section reviews the Township of Langley’s energy consumption, and identifies the different energy uses and their corresponding GHG emissions. Primary energy sources are electricity, natural gas, and vehicle fuels (gasoline and diesel). The end uses that generate the majority of the GHGs are building operations (notably the aquatic centers) and vehicle fleet operations.
An emissions profile (i.e. a snap-shot of all emissions at one point in time) has been developed for the years 2000 and 2004, building on the Milestone 1 profiles generated for 1995, 1999, and 2003.
The profile was then used to develop two forecasts of future GHG emissions - a “Business as Usual” forecast - based on year 2000 operating conditions and an Emission Reduction Plan (ERP) forecast. The Emission Reduction Plan forecast was used to estimate potential reductions in GHG emissions and a proposed reduction target.
3.1 Township Energy Supply and Use
3.1.1 Township Energy Consumption Profile
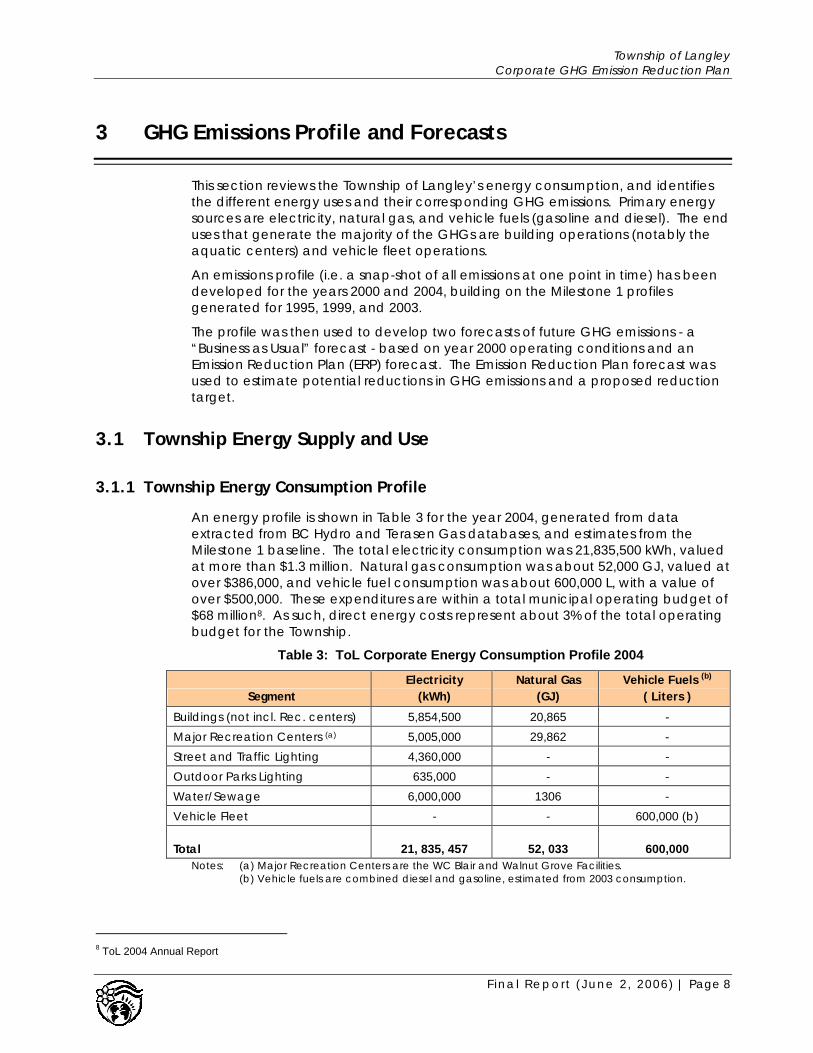
An energy profile is shown in Table 3 for the year 2004, generated from data extracted from BC Hydro and Terasen Gas databases, and estimates from the Milestone 1 baseline. The total electricity consumption was 21,835,500 kWh, valued at more than $1.3 million. Natural gas consumption was about 52,000 GJ, valued at over $386,000, and vehicle fuel consumption was about 600,000 L, with a value of over $500,000. These expenditures are within a total municipal operating budget of $68 million8. As such, direct energy costs represent about 3% of the total operating budget for the Township.
Table 3: ToL Corporate Energy Consumption Profile 2004
Segment Electricity
(kWh) Natural Gas
(GJ) Vehicle Fuels (b)
( Liters )
Buildings (not incl. Rec. centers) 5,854,500 20,865 - Major Recreation Centers (a) 5,005,000 29,862 - Street and Traffic Lighting 4,360,000 - - Outdoor Parks Lighting 635,000 - - Water/Sewage 6,000,000 1306 - Vehicle Fleet - - 600,000 (b)
Total 21, 835, 457 52, 033 600,000 Notes: (a) Major Recreation Centers are the WC Blair and Walnut Grove Facilities. (b) Vehicle fuels are combined diesel and gasoline, estimated from 2003 consumption.
8 ToL 2004 Annual Report
F inal Report (June 2, 2006) | Page 8

Township of Langley Corporate GHG Emission Reduction Plan
3.1.2 Energy Supply and Associated GHG emissions
A breakdown of energy consumption by fuel, expressed in common units of GJ of energy, is shown in Figure 2a. Figure 2b shows the GHG emissions that result from the consumption of this energy9.
Apparent in Figure 2 is that while over 50% of the energy supplied is in the form of electricity, only about 15% of the GHG emissions result from electricity consumption. This is because the electricity supply in BC is primarily from hydro-electric sources, and has lower associated GHG emissions than coal or gas-turbine electricity10. Consequently, the majority of the corporate emissions are derived from natural gas and vehicle fuel combustion.
a)
Electricity
Vehicle Fuels
Natural Gas
Energy 2004 Energy b)
Electricity
Natural Gas
Waste
Vehicle Fuels
GHGs 2004 GHGs
Figure 2: Breakdown of ToL (a) Energy Supply and (b) Corresponding GHG Emissions (2004)
3.1.3 Energy End Use and Associated GHG Emissions
The energy use can be viewed from the perspective of its end use rather than the energy source. A breakdown of the different end uses of energy (all forms combined) is shown for each type of use in Figure 3. Figure 3a shows the energy consumption and Figure 3b shows the associated GHG emissions.
Apparent from Figure 3 is that buildings and vehicles consume the greatest portion of the Township’s energy, and result in the vast majority of the GHG emissions.
9 Also included are the GHG emissions from solid waste generated, which is not a primary energy source but does form part of the GHG emissions inventory. 10 This is not the case for all areas of Canada. For example, in Alberta, where most of the electricity derives from coal powered thermal generation, the GHG emissions for each unit of electricity are more than30 time greater than in BC.
F inal Report (June 2, 2006) | Page 9

Township of Langley Corporate GHG Emission Reduction Plan
a)
Vehicles
Street and traffic
lighting
Water/ Sewage
Buildings
Energy 2004 Energy Use b)
Vehicles
Buildings
Water/ Sewage
Solid Waste
Street and traffic
lighting
GHGs 2004 GHG Emissions
Figure 3: Breakdown of ToL (a) Energy End-Use and (b) Resulting GHG Emissions, (2004)
The consumption of natural gas provides further insight into the nature of the Township facilities energy consumption and GHG emissions. Table 4 highlights the greatest consumers of natural gas operated by the Township. The two aquatic centers consume almost 60% of the total consumed gas, and combined with the next five largest users, consume 84% of the natural gas used by the Township. This means that reduction efforts targeted at these facilities can have the greatest potential for reducing energy and GHG emissions.
It should be noted that two of the facilities - the Langley Civic Center and the Aldergrove Community Arena are owned by the Township but operated by third parties.
Table 4: Top Natural Gas Consumers within the Township (2004)
Building2004 Consumption
(GJ)
Share of ToLTotal Consumption
(% of total)Walnut GroveRec Center 21,743 42 WC Blair Rec Center 8,119 16 Langley Civic Center 3,585 7 RCMP Building 3,283 6 Operations Center 3,133 6 Aldergrove Comm Arena 2,464 5 Water Treatment Plant 1,306 3 Other Accounts (number=34) 8,400 16
Total 52,033 100
F inal Report (June 2, 2006) | Page 10

Township of Langley Corporate GHG Emission Reduction Plan
3.2 GHG Profile
To generate a GHG profile based on energy use, the consumption of each type of energy is converted into an associated emission of GHGs. Emissions factors used to convert energy consumption are shown in Table 5.
Table 5: GHG Emission Factors
Energy Source Emission Factor Units of emission factors
Electricity 35 t CO2e / GWh Natural Gas 0.049 t CO2e / GJ Diesel 2.730 t CO2e / 1000 L Gasoline 2.360 t CO2e / 1000 L Propane 1.530 t CO2e / 1000 L
Notes: (a) t CO2e = tonnes of CO2 equivalent emissions (b) The GHG intensity factor for electricity is assumed to be 35 t / GWh for all years. In practice, it varies from year to year. For the period from 1989 to 2003 there is no trend, and so the average value (35) is used for all GHG calculations.
GHG emission profiles are calculated by multiplying energy consumption by the associated emission factor. The Township’s GHG emissions in 2000 and 2004 are summarized in Table 6. For most service areas, the GHG emissions have increased from 2000 to 2004.
The buildings emissions are shown to have declined by 60 tonnes per year. A slight portion of this decrease (3 tonnes) is due to decreased electricity use and the remainder (57 tonnes) is due to decreased natural gas consumption. This difference is likely due to weather differences between years (colder years require more fuel) and is likely not indicative of changes in the building stock. Vehicle fleet emissions are shown to have declined by 200 tonnes per year from 2000 to 2004.
Table 6: Township Corporate GHG Emissions, 2000 and 2004
Segment 2000
(t CO2 e) 2004
(t CO2 e) 2004
(% of total)
Buildings (not incl Rec centers) 1282 1222 24 Major Recreation Centers (a) 1547 1633 32 Street and Traffic Lighting 143 153 3 Outdoor Parks Lighting 12 22 0.4 Water/Sewage 247 273 6 Vehicle Fleet 1541 1341 26 Solid Waste Generated 390 423 8 Total 5161 5067 100
Notes: (a) Major Recreation Centres are the WC Blair and Walnut Grove Facilities
F inal Report (June 2, 2006) | Page 11

Township of Langley Corporate GHG Emission Reduction Plan
3.3 Baseline Year
The PCP program suggests using 1995 as a baseline year for developing action plans and reduction targets, though it is at the discretion of each community to define its own baseline and target. The Milestone 1 baseline created emissions profiles for 1995, 1999 and 2003. This work has updated those profiles for the years 2000 and 2004.
Based on a review of the profiles it is recommended that the year 2000 be used as a baseline year. Reasons for this include:
• The year 2000 more closely reflects the current operating situation at the Township than 1995. For example, the Walnut Grove Recreation center – a major energy consumer – was expanded to include a swimming pool in 1999.
• The Northwest Langley waste water treatment plant was transferred to the GVRD in 1996. As a result, this consumption is included in the 1995 year profile, but not in later profiles.
• The year 2000 more closely aligns to the date that the ToL committed to the PCP program (Council resolution in January 2001).
• The year 2000 precedes the implementation of the lighting retrofits at the operations center and RCMP buildings, and the construction of the new civic facility which incorporates many energy efficiency and resource conservation features. Selecting a baseline prior to these efforts allows those reductions to be included in the forecasting - in essence provided acknowledgement to these activities within the plan.
3.4 Business-as-usual (BAU2000) Forecast
A business-as-usual (BAU) forecast was developed starting with the baseline year (2000). In this forecast, energy consumption and GHG emissions are forecast to 2010 using the profiles established for 2000 known and possible growth conditions.
Assumptions included in this forecast are that:
• energy consumption remains at the current level for existing buildings.
• the former municipal hall is removed at the end of 2005. A new facility of the same size as the new Civic facility is built and consumes energy at a similar intensity (energy per square foot) as the former municipal hall.
• electricity consumption for street and traffic lights and water, drainage, and sewage pumping grows at a fixed annual rate, assumed to be 1%. (NB This is less than the population growth rate and assumes that some of the new population does not require new facilities).
• outdoor sportsfield lighting remains constant at existing facilities, and five new facilities are installed, each having 36- or 72- 1000 W lighting arrays.
• vehicle fuel use increases at a fixed annual rate - here assumed to be 3%, which is the expected rate of population growth.
F inal Report (June 2, 2006) | Page 12

Township of Langley Corporate GHG Emission Reduction Plan
• solid waste generation at municipal facilities increases at a fixed annual rate, assumed to be 3 %, comparable to population growth rates.
• new future facilities built between 2005 and 2010 are estimated (albeit simplistically) by approximations to existing facilities. This includes a new museum (e.g. new museum is estimated to double in size and so current museum energy consumption is doubled), a gym expansion at WC Blair (10% more electricity), and aquatic centers at Aldergrove and Willoughby (each using half the energy consumption of the current WC Blair)11.
Under this forecast - named the BAU2000 forecast, corporate emissions are expected to reach 6150 t CO2e in 2010, an increase of 19.2% above the year 2000 baseline emissions.
3.5 Emission Reduction Plan Forecast
A scenario planning forecast was derived from the emission profiles. For each category of energy consumption, an energy consumption reduction (% of 2000 consumption) was considered and the total emissions were recalculated to 2010. The reductions chosen are discussed in Section 4. Assumptions for this forecast included:
• the new Township Civic Facility natural gas consumption is estimated to be 40% of the BAU2000 scenario (a 60% reduction has been estimated by the LEED certification team), and electricity consumption is estimated as 75% of the BAU scenario12.
• the same new building facilities are included as the BAU2000 forecast, however their energy consumption is reduced by the amount input as a reduction target.
• all other consumption is reduced by the reduction target selected for that segment from a year 2000 level.
To generate a forecast, a range of values were input to the forecast model. These were selected as being technically and economically reasonable, though admittedly challenging, and will require effort and resources. The results of this estimation are called the Emission Reduction Plan forecast.
Using estimated reduction factors, the forecasted emissions in year 2010 are expected to be 4555 t CO2e per year, a decrease of 11.7% from the year 2000 emissions.
11 These estimates are approximate and are intended to highlight the increasing energy consumption and GHG emissions resulting from growth in the community. While these items are identified as possible projects in the 10-year capital plan, none of them have yet been evaluated for need, scoped, designed, or approved. Any, all, or none of these may eventually be built. 12 These reductions are on a ‘per square foot’ basis. Given that the new ToL’s occupied space in the new facility is 3.8 times larger than the former municipal hall, the move to the new facility and removal of the municipal hall will result in an increase of total energy consumption even though this is a more energy efficient facility.
F inal Report (June 2, 2006) | Page 13
Township of Langley Corporate GHG Emission Reduction Plan
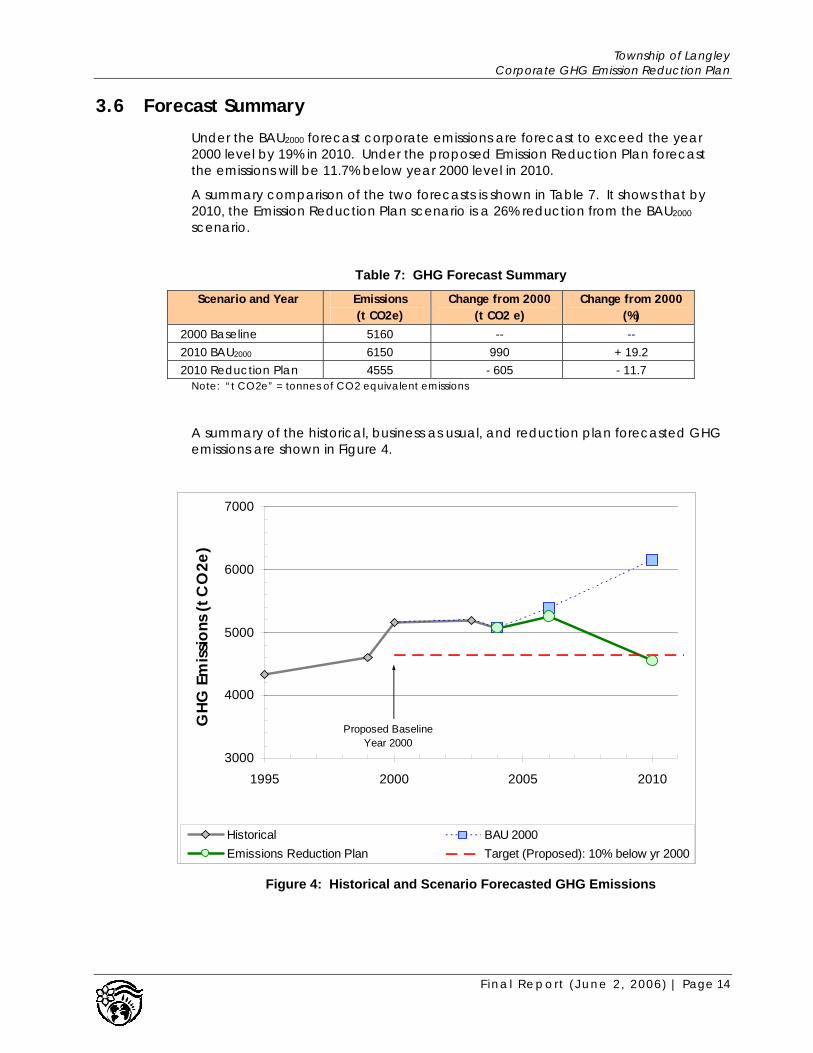
3.6 Forecast Summary
Under the BAU2000 forecast corporate emissions are forecast to exceed the year 2000 level by 19% in 2010. Under the proposed Emission Reduction Plan forecast the emissions will be 11.7% below year 2000 level in 2010.
A summary comparison of the two forecasts is shown in Table 7. It shows that by 2010, the Emission Reduction Plan scenario is a 26% reduction from the BAU2000 scenario.
Table 7: GHG Forecast Summary
Scenario and Year Emissions (t CO2e)
Change from 2000 (t CO2 e)
Change from 2000 (%)
2000 Baseline 5160 -- -- 2010 BAU2000 6150 990 + 19.2 2010 Reduction Plan 4555 - 605 - 11.7
Note: “t CO2e” = tonnes of CO2 equivalent emissions
A summary of the historical, business as usual, and reduction plan forecasted GHG emissions are shown in Figure 4.
3000
4000
5000
6000
7000
1995 2000 2005 2010
GHG
Em
issio
ns (t
CO
2e)
Historical BAU 2000Emissions Reduction Plan Target (Proposed): 10% below yr 2000
Proposed BaselineYear 2000
Figure 4: Historical and Scenario Forecasted GHG Emissions
F inal Report (June 2, 2006) | Page 14

Township of Langley Corporate GHG Emission Reduction Plan
3.7 GHG Emissions Reduction Target
3.7.1 Target Setting
The establishment of a target is a powerful tool for planning purposes13. Specifically it can:
• communicate the objective to a range of audiences;
• maintain focus on the objective to be achieved;
• be used to develop and get approval for action plans and program activities;
• provide a base for measuring and reporting; and
• encourage accountability of departments through a system of review and reporting.
Establishing a target that is not achievable does not benefit the program, nor does it provide incentive for staff to find energy reduction measures.
Through experimentation with the forecasting tool, it became apparent that almost no reasonable scenarios would achieve a reduction to levels near the suggested PCP target (which is 20% below 1995 levels).
A new reduction target is proposed. Based on the estimation of the previous section, an emission reduction target of a 10% reduction below year 2000 levels is proposed.
3.7.2 Reductions by End Use
A summary of the energy use reductions that were assumed to generate the scenario forecast is shown in Table 8 and the associated GHG reductions estimated are shown in Table 9. For multi energy facilities, this scenario assumes similar reductions in both electrical and fossil fuel energy. The reductions described are an overall end use average and it is recognized that there will not be complete implementation of reduction activities at all facilities.
This represents a challenging target - particularly to those areas experiencing rapid growth. However, as described in the next section, the actions required to achieve this target are technically valid, have been implemented in other jurisdictions, and have reasonable economic paybacks.
13 In the context of GHG management a target should be viewed as a positive, encouraging, motivating, and accountable goal, for which a challenging and bold (yet achievable) value should be set. Establishing a target also implies that the organization will provide the support and commitment to achieve the target.
F inal Report (June 2, 2006) | Page 15

Township of Langley Corporate GHG Emission Reduction Plan
Table 8: Hypothetical Emission Reductions Used to Generate the “Emission Reduction Plan” Forecast
Reduction from 2000 Level by 2010
Segment (%)Existing Buildings 25%Rec Centers 25%New Buildings * 50%Vehicle Fuel Consumption 10%Steet, Signal and Sports field Lighting 10%Water / Sewage 5%Waste Reduction 40%* Note: For new buildings, "Reduction from 2000 Level" means reduction compared to a comparably sized BAU facility.
The reductions shown in Table 8, are intended as an indication of the magnitude of reduction required to meet the target, and are not necessarily recommended as specific departmental sub-targets.
Table 8 highlights the range of reductions required to meet the target. The final mix of reductions achieved from each subject area will evolve through the development of business cases for each area.
Comments about the reduction amounts shown in Table 8 include:
• Existing and new buildings have the greatest potential to reduce energy through retrofits and energy efficient design.
• The recreation centers, which generate the greatest GHG emissions (about 32% of the total - see Table 6) present a unique opportunity for GHG reductions14. In particular, the proposed expansion/renovation of the W.C. Blair facility presents an opportunity to review the water heating systems for the pool (regardless of whether the pool is part of the retrofit itself).
• The vehicle fleet is an area where efforts to reduce fuel use will reduce emissions.
• Different levels of GHG emissions reduction are possible in each service area. Some areas, such as water or sewage are limited in their ability to reduce emissions since these are set by the amount of water consumption or wastewater generated.
Some of these end-use reductions may appear challenging but many examples of significant emission reductions exist. For example:
• Construction of new civic buildings in accordance with LEED Silver typically reduces energy consumption by 30%. The new civic facility with a ground source heat pump space heating system is estimated to use 60% less natural gas than a conventional building of its size.
14 Note that this is not unique to the Township of Langley. In the City of North Vancouver Corporate GHG Baseline (1995) emissions inventory, the Lonsdale Recreation Center contributes 1/3 of the city’s total emissions.
F inal Report (June 2, 2006) | Page 16

Township of Langley Corporate GHG Emission Reduction Plan
• Energy retrofits of existing buildings can achieve significant savings. For example, School District 44 in North Vancouver recently completed energy retrofits in its facilities with energy savings of 35%.
• The Hyde Creek Recreation Center in Port Coquitlam was retrofitted with solar water heaters in 2004 and has reduced natural gas consumption by 44% and total energy consumption by 30%.
• Use of bio-diesel is currently being piloted in several municipalities including the Township and can reduce emissions from diesel vehicles by 10% to 15% (using a biodiesel 20% mixture).
• Fleet management, driver awareness, right-sizing and anti-idling activities, can reduce fleet vehicle fuel consumption by about 10% without any significant costs. The City of Richmond estimates that it has decreased fuel consumption by up to 10% through such measures in two years. Technology changes (like smaller vehicles) will result in even greater emission reductions.
Table 9: Summary of Forecasted GHG Reductions by Activity Category
Scenario and Year Emission
Reduction (t CO2e / yr)
Resulting Emissions
(t CO2e / yr)
Baseline 2000 Baseline Emissions 5160
BAU2000 Scenario BAU2000 Scenario: Emissions in 2010 6150 Reductions from BAU2000 scenario based on activities performed to-date (2000 - 2005) 289 2010 Emissions based on actions performed to-date with no further initiatives 5861
Emission Reduction Plan Scenario Buildings 292 Recreation Centers 408 New Buildings 259 Vehicle Fleet 159 Lighting 19 Water, Drainage, Sewage 14 Waste 156 Emissions Reduction Plan Scenario: Emissions in 2010 4554
Note: “t CO2e” = tones of CO2 equivalent emissions
F inal Report (June 2, 2006) | Page 17

Township of Langley Corporate GHG Emission Reduction Plan
3.8 Implications for Program Design
Based on this analysis, the primary sources of GHG emissions in the Township are vehicles and buildings, with the two major aquatic centers accounting for a substantial portion (over 30%) of the total emissions. Thus, a substantial GHG emissions reduction opportunity exists by focusing efforts on these large energy consumers.
However, reductions in other areas should not be neglected. Fossil fuel reduction (for the purpose of reducing GHG emissions) without acknowledging potential increases in electricity consumption would be counter-productive and is not recommended. Ideally, an energy management strategy and GHG emissions reduction plan should acknowledge that all energy resources are valuable, and efforts should be made to conserve each one. Trade-offs may occur (e.g. increased electricity consumption and reduced natural gas consumption from a building retrofit), and these can be evaluated as part of an overall energy management strategy.
The benefits of maintaining a focus on all areas of energy reduction include:
• better opportunities to retrofit buildings as entire systems and not by individual components;
• opportunities to take advantage of third party funding (PowerSmart, Green Funds) through initiatives that include electricity conservation;
• maintaining an incentive for all departments to be involved with energy reduction and conservation; and
• maintaining a consistent message to staff that all energy conservation is important.
The following section describes action plan activities that can be implemented to make progress towards the target.
F inal Report (June 2, 2006) | Page 18

Township of Langley Corporate GHG Emission Reduction Plan
4 GHG Reduction Opportunities
This section presents a summary of identified GHG reduction opportunities. These have been defined through discussions with the ToL staff, review of the energy consumption and emissions profiles, and review of relevant literature.
These opportunities and the reductions that can be achieved are used to estimate an action plan scenario. As such, they describe potential reductions achievable but do not provide complete business cases for each action. Actions are identified in each of the following areas:
• Existing Buildings
• New Buildings
• Recreation Centers
• Vehicles
• Utility Services (Water, Sewage &Drainage)
• Parks
• Procurements and Purchasing, and
• Corporate Leadership
F inal Report (June 2, 2006) | Page 19

Township of Langley Corporate GHG Emission Reduction Plan
4.1 Existing Buildings
Overview and Current Actions
This category includes the existing building stock - primarily the civic facility, the operations center, and the RCMP detachment along with fire halls, libraries, museums, etc.
Lighting retrofits were implemented as part of BC Hydro PowerSmart incentive programs at the RCMP detachment, the Operations Center and the former Municipal Hall with savings of several hundred thousand kWh per year of electricity annually. No retrofits have been implemented to address space heating or domestic hot water heating.
Proposed Actions
Action: Description Departmental Responsibility
1 Review directly managed buildings for retrofit opportunities Consideration should be given to retrofitting to a standard such as LEEDTM for existing buildings (LEED EB).
This initiative includes energy efficiency retrofits of existing corporate owned and managed facilities in the Township. Opportunities may exist at the RCMP detachment and operations center. Not withstanding the lighting retrofits already completed, additional opportunities may include:
• Building automation systems to integrate and control the major mechanical and electrical systems,
• Building envelope retrofits, including glazing, insulation and air tightness,
• Heating ventilation and air conditioning equipment upgrades, and
• Domestic hot water systems. Costs:
• Audits range from zero-cost walk through reviews to several thousand dollars for an engineering audit. Typical costs are in the range of $0.10 to $0.20 per square foot.
• Mechanical and electrical system retrofits range from $3 - $5 per square foot.
• Building Envelope retrofits cot in the range of $30 to $50 per square foot of wall space.
• Payback periods for typical commercial or office building retrofits are in the range of 5 to 8 years.
• Staff time will be required to conduct or contract the audits, evaluate the results, and prepare a budget item and business case for actions and then manage the retrofit.
Potential Reductions: Building retrofits are capable of achieving operating savings of 25% to 35% (total energy) with payback periods of 5 to 8 years.
Facilities
F inal Report (June 2, 2006) | Page 20

Township of Langley Corporate GHG Emission Reduction Plan
Action: Description Departmental Responsibility
Key Challenges: Many of the buildings are small - libraries, fire halls, etc. -and resulting payback times may be longer than for the large facilities.
2 Review non-operated buildings for conservation opportunities
Two ice arenas are owned by the Township but are operated under contract. The operator pays the electricity costs. Reduction activities could include installing a low emissivity (“low e”) ceiling, lighting controls, new efficient pump motors, and low flow showerheads in change rooms. Costs: Audits range from zero-cost walk through reviews to several thousand dollars for an engineering audit. Implementation of any identified actions is unknown. Potential Reductions: Smaller savings (potentially 10%) are assumed for non-operated buildings. Key Challenges: The owner -contractor relationship should be examined to align the savings incentive with the investment (e.g. capital projects vs. operational/house-keeping activities).
Facilities
F inal Report (June 2, 2006) | Page 21

Township of Langley Corporate GHG Emission Reduction Plan
The new Civic Facility is expected to meet LEED status.
4.2 New Buildings
Overview and Current Actions
The long term capital plan has identified several new facilities that may be built in the coming years (see Table 2), including a new museum, an expansion to the W.C. Blair facility, and possible new fitness centers in Aldergrove or Willoughby. New facilities represent the major source of new emissions identified in the BAU2000 scenario. Building new facilities to energy efficient standards will reduce the growth of emissions.
Proposed Actions
Action: Description Departmental Responsibility
3 Build all new buildings to a high energy efficient standard, with a focus on reducing fossil fuel use. Buildings greater than 5000 sq ft be constructed to LEED standards (recommended silver as target).
All new facilities (over a threshold size, and likely only those that are habited) built to a high level of energy efficiency, with a focus on reducing fossil fuel use. Energy efficiency alone may be pursued in building design and often such efforts are encompassed in a broader ‘Green Building’ criteria - which also meets a range of other sustainability criteria. Potential Reductions: LEED Silver (or Gold) rated buildings can achieve energy savings of 30% to 40% compared to traditional design. Efforts such as ground source heat pumps for space heating can reduce natural gas consumption even more dramatically (e.g. new Civic facility is expected to use 60% less energy for space heating than a traditional design). Costs: Capital cost premium for LEED buildings has been estimated at 1% to 3% of the total cost. This premium is typically paid back in 3 to 7 years through energy savings. Key Challenges: May require extra project management time by ToL for the process of LEED certification.
Facilities
F inal Report (June 2, 2006) | Page 22

Township of Langley Corporate GHG Emission Reduction Plan
Action: Description Departmental Responsibility
4 Build all new aquatic facilities using alternative heating systems (i.e. non fossil fuel, solar, heat pumps).
All new or upgraded aquatic facilities will be built using alternative energy sources for pool water heating (i.e. non fossil fuel) such as solar or ground source heat pumps. Costs: Consideration early in the design stage should minimize any incremental capital cost to a few percent. Potential Reductions: Savings can range up to 30 % or total energy and 44% of natural gas. Key Challenges:
• Incremental capital costs, • Solar regime is not always consistent with the
energy demand profile.
Facilities
F inal Report (June 2, 2006) | Page 23

Township of Langley Corporate GHG Emission Reduction Plan
4.3 Recreation Centers
Overview and Current Actions
The Walnut Grove recreation center and the W.C. Blair pool consume almost 60% of the natural gas used by the Township. Natural gas costs have risen five-fold since the mid-1990s and a limited North American supply means that current prices are not expected to decline.
The W.C Blair pool has reduced it gas consumption by about 20% between 1998 and 200415. The Walnut Grove facility has increased gas consumption by about 20% since 2000.
Proposed Actions
Action: Description Departmental Responsibility
5 Recreation Center Energy Audit.
Conduct an audit of these facilities to identify energy reduction possibilities. The focus should be on reducing natural gas consumption - used for pool, hot water, and space heating. (NB Past walk through audits may have been performed.) Costs: Audit costs range from zero (walk through) to a few thousand dollars for an engineering review. Implementation costs could be any where from $10,000 to $500,000 depending on actions identified. Payback periods are expected to be in the 5 - 8 year range though grant funding or increasing utility prices would alter that. Potential Reductions: Unknown Key Challenges:
• Walnut Grove: Existing technology is relatively recent (late 1990s) and there will be limited economics for pursuing a higher efficiency boiler.
• WC Blair: No change to be enacted until a decision is made regarding the possible expansion or renovation of the pool.
• Retro-fitting the existing facilities may have layout constraints.
Facilities Parks and Recreation
15 The reason for this reduction is currently not known.
F inal Report (June 2, 2006) | Page 24

Township of Langley Corporate GHG Emission Reduction Plan
4.4 Vehicles
Overview and Current Actions
The Township maintains a fleet of about 150 pieces of equipment, including heavy equipment (dump trucks, flat deck trucks, graders, loaders, and back hoes), as well as a fleet of cars, vans, and pick-up trucks16. Vehicle fleet operations resulted in about one quarter of the Township’s GHG emissions in 2004. Past or current actions have included:
• Vehicle purchases to include consideration of ‘right-sizing’ which has resulted in management staff using compact pick-up trucks.
• Providing pooled vehicles for office staff. Currently a fleet of 6 older model cars and vans is used by office staff for travel to and from work sites.
• Purchasing fuel efficient vehicles. The Township has purchased a “Smart Car” to be used by the by-law enforcement department, which frequently needs to send only one person to a site.
• Implementing propane fueled vehicles. The Township had used propane for fuel on a number of its vehicles (as well as the RCMP vehicles) but this has been phased out for operational reasons.
• Implementing a biodiesel program. The Township initiated the use of a 5% biodiesel blend in the fall of 2005, and moved to a 10% mixture in the Spring of 2006. It is evaluating the performance and intends to further increase the bio-diesel concentration level in stages. If no issues are identified, the intention is to go to a 20 % mixture. Bio-diesel is estimated to cost a 3 cent per liter premium (with costs in late 2005 in the $1.00 per liter range).
• Developing an anti-idling policy to reduce unnecessary vehicle operation. To date, this policy has included minimal staff engagement and education to promote the policy.
The Township has purchased this fuel efficient “Smart Car”.
16 The Township maintains the RCMP vehicle fleet under a contracting arrangement with the RCMP services manager.
F inal Report (June 2, 2006) | Page 25

Township of Langley Corporate GHG Emission Reduction Plan
Proposed Actions
Action: Description Departmental Responsibility
6 Aggressive right-sizing
Establish a more aggressive program of ‘right-sizing’ vehicles. This would require all new vehicles to be of the most fuel-efficient nature for the defined staff / task. Costs:
• Some purchases will result in some cost savings (e.g. buying a Toyota Echo rather than a pick-up truck).
• Some vehicles may carry a premium. (NB This initiative does not recommend buying hybrid, natural gas, or propane vehicles, which may carry a cost premium).
Potential Reductions: To be determined. Key Challenges:
• Slow turnover into the vehicle stock - a complete changeover of vehicles will take many years.
• Staff acceptance. • Operational considerations may prevent some
reductions. • Will not affect off-road or the heavy duty fleet
(e.g. dump trucks, street sweepers, etc.)
Equipment / Fleet Management
7 “Fleet Smart” or “Green Fleet” style staff engagement programs.
Implement “Fleet Smart” or “Green Fleet” activities. Fleet Smart is a program developed by Natural Resources Canada and includes educational, operational, and maintenance guidance to reduce energy consumption. Green Fleet is a fleet accreditation system being piloted by Fleet Challenge BC and the Province of BC. Costs: Some disbursements for posters, and promotional materials. Staff time required for planning and defining activities, and maintaining the program. Staff time for attendance and activities. Potential Reductions: Reductions of 10 % on fuel costs are possible. Key Challenges: Staff engagement must be carefully targeted to be successful.
Equipment / Fleet Management
8 Continue step-wise increase in biodiesel blend.
Continue the biodiesel initiative as conditions permit. Costs: Current bio-diesel carries a cost premium of about three cents per liter. Potential Reductions: Full implementation of B20 (20% biodiesel) can reduce GHG emissions by 10% to 15% for the same fuel consumption.
Equipment / Fleet Management
F inal Report (June 2, 2006) | Page 26
Township of Langley Corporate GHG Emission Reduction Plan
Action: Description Departmental Responsibility
Key Challenges: Older vehicles may not be able to use higher blends.
9 Alternative fuel evaluation
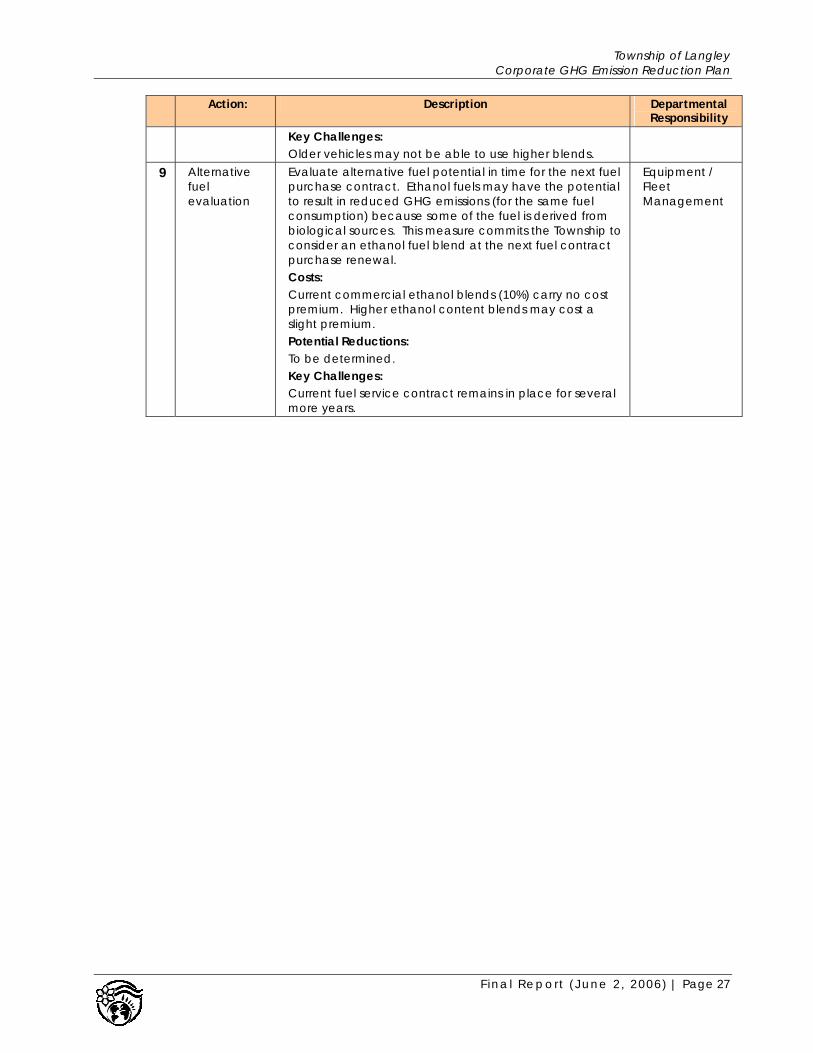
Evaluate alternative fuel potential in time for the next fuel purchase contract. Ethanol fuels may have the potential to result in reduced GHG emissions (for the same fuel consumption) because some of the fuel is derived from biological sources. This measure commits the Township to consider an ethanol fuel blend at the next fuel contract purchase renewal. Costs: Current commercial ethanol blends (10%) carry no cost premium. Higher ethanol content blends may cost a slight premium. Potential Reductions: To be determined. Key Challenges: Current fuel service contract remains in place for several more years.
Equipment / Fleet Management
F inal Report (June 2, 2006) | Page 27

Township of Langley Corporate GHG Emission Reduction Plan
F inal Report (June 2, 2006) | Page 28
4.5 Utility Services
4.5.1 Street and Traffic Lighting
Overview and Current Actions
The Township owns and maintains over 5500 ornamental lighting fixtures and the complete inventory of traffic signal lights within the community, while BC Hydro owns and maintains another 1700 street lights. The Township pays the power for the accounts it owns and a flat rate charge for the BC Hydro-owned lights.
The Township participated in BC Hydro’s LED traffic light change out program and since 1999 has replaced green and red incandescent traffic signal bulbs with high efficiency LED lights. For this program the Township and BC Hydro shared the capital cost. The Township’s contribution was paid through the energy savings directly to BC Hydro (i.e. no capital dollar outlay was required). As the existing orange lights burnout, they will be replaced with LEDs.
No changes to street lighting systems have been made17.
Proposed Actions
Action: Description Departmental Responsibility
10 Streetlight retrofits Maintain awareness of emerging technologies for street lighting retrofits. BC Hydro may develop a program of incentives though no program currently exists and the Township should consider participation. The potential exists to execute a pilot or broader scale replacement project if grant or incentive funds can be located. The Township should compile the relevant information to support such a grant application18. Costs: Calgary’s program cost about $200 per light for the fixture purchase and contract labor - this was a large program (over 40,000 bulbs) so Township costs might be higher. Would require portion of a ToL staff person. Potential Reductions: Uncertain. Depending on level of savings.
Operations
17 Current street lights are typically 200 or 250 W high pressure sodium (HPS) bulbs. Street lighting changes include the change to a lower wattage bulb (and associated ballast) and a flat lens to allow an equivalent lighting with 100 or 150 Watt bulbs (City of Calgary pers communication). These typically require the change out of the entire fixture. Often grant money is required to make these changes feasible - for example, the City of Calgary’s lighting change out program included just over 1/3 of the capital cost paid for by grants and the remaining from electricity savings resulting in about 5 year payback periods. 18 For example, the Federation of Canadian Municipalities (FCM) administers Federal Green Municipal Enabling Funds and holds requests for funding for energy efficiency activities. These frequently require that the up front business case development has been completed as the programs fund implementation but not studies.
All signal lights were replaced with energy efficient LED lights.
Township of Langley Corporate GHG Emission Reduction Plan
Action: Description Departmental Responsibility
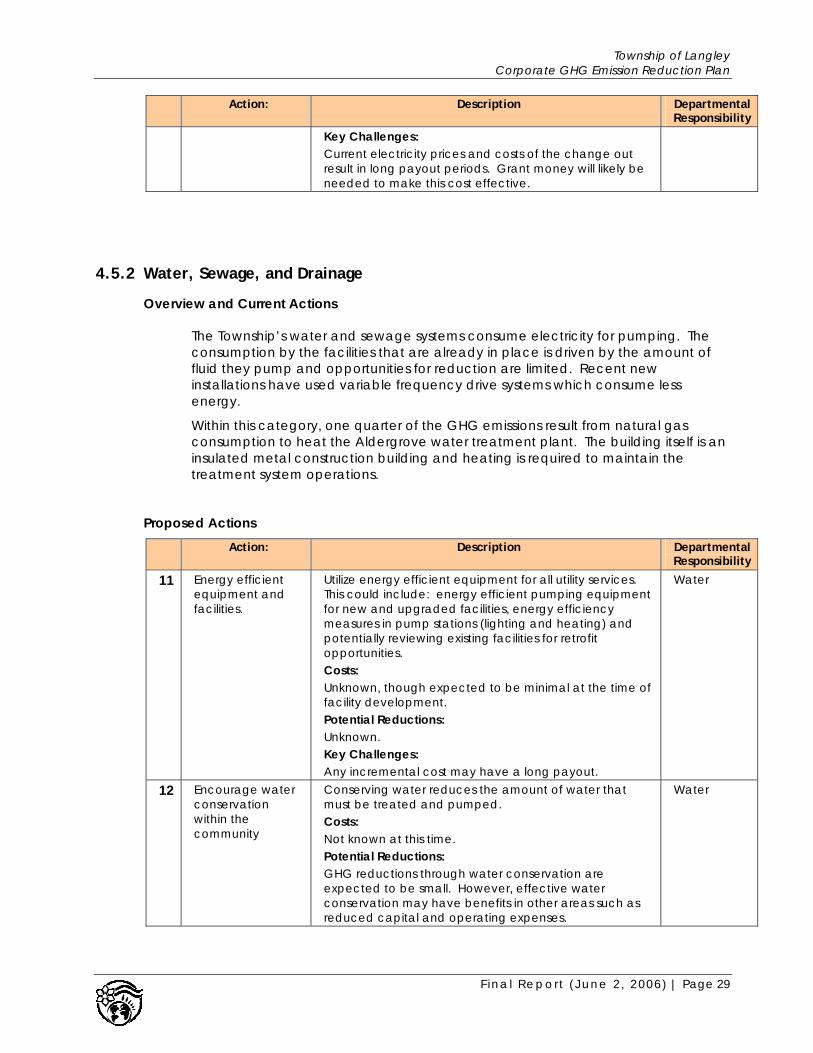
Key Challenges: Current electricity prices and costs of the change out result in long payout periods. Grant money will likely be needed to make this cost effective.
4.5.2 Water, Sewage, and Drainage
Overview and Current Actions
The Township’s water and sewage systems consume electricity for pumping. The consumption by the facilities that are already in place is driven by the amount of fluid they pump and opportunities for reduction are limited. Recent new installations have used variable frequency drive systems which consume less energy.
Within this category, one quarter of the GHG emissions result from natural gas consumption to heat the Aldergrove water treatment plant. The building itself is an insulated metal construction building and heating is required to maintain the treatment system operations.
Proposed Actions
Action: Description Departmental Responsibility
11 Energy efficient equipment and facilities.
Utilize energy efficient equipment for all utility services. This could include: energy efficient pumping equipment for new and upgraded facilities, energy efficiency measures in pump stations (lighting and heating) and potentially reviewing existing facilities for retrofit opportunities. Costs: Unknown, though expected to be minimal at the time of facility development. Potential Reductions: Unknown. Key Challenges: Any incremental cost may have a long payout.
Water
12 Encourage water conservation within the community
Conserving water reduces the amount of water that must be treated and pumped. Costs: Not known at this time. Potential Reductions: GHG reductions through water conservation are expected to be small. However, effective water conservation may have benefits in other areas such as reduced capital and operating expenses.
Water
F inal Report (June 2, 2006) | Page 29

Township of Langley Corporate GHG Emission Reduction Plan
4.5.3 Solid Waste (Township facilities)
Overview and Current Actions
Corporate waste generation was estimated at 878 tonnes for 2003 resulting in estimated GHG emissions of 423 tonnes of CO2 equivalent in 200419. A Township specific waste breakdown is not available.
Paper recycling is provided at the operations center and the new civic facility. No other recycling programs (i.e. plastics, bottles, or metals) are available at Township facilities.
Proposed Actions
Action: Description Departmental Responsibility
13 Enhance recycling and waste reduction opportunities.
This initiative would see expanded recycling programs at all municipal facilities. In particular, the pools, recreation centers, and fitness centers are prime locations for demonstrating leadership in the community by providing high profile recycling opportunities. The operations center waste stream should also be reviewed for potential opportunities. Costs: Program costs - unknown Evaluation of potential options could require a portion of a person’s time for a few weeks. Potential Reductions: Unknown. Key Challenges: The relatively small amount of waste may prohibit the development of a cost effective program.
Operations
19 ToL Milestone 1 Report. The amount of waste generated may be an over-estimate as it was based on dumpster pick-up schedules and assumes all dumpsters were full when emptied.
F inal Report (June 2, 2006) | Page 30

Township of Langley Corporate GHG Emission Reduction Plan
4.5.4 Parks
Overview and Current Actions
Parks energy consumption is primarily electricity used for sports field lighting, washroom and change room lighting and water heating. Timers have been established at the lit sports fields that require a button to be pushed in order for the lights to be activated. This prevents the lights from coming on when the fields are not in use (rainy evenings or nights with no scheduled events).
A computerized irrigation system was implemented in 2002/2003 at the McLeod Park sports field that uses soil moisture sensors and weather data to control the sprinkler system, watering only as needed. Water consumption was reduced by 6.8 million L (about 22%). It was expanded in 2004 to fields in Walnut Grove, Fort Langley Park, and Milner Park20.
Proposed Actions
Action: Description Departmental Responsibility
14 Pursue the most efficient lighting technologies.
Implement the most energy efficient lighting at the sports field facilities as appropriate. Costs: Minimal at the time of design and installation. Likely cost prohibitive to retrofit any existing facilities. Potential Reductions: Small but high profile link to other sustainability initiatives.
Parks
20 ToL, 2004, Milestone 1 report
F inal Report (June 2, 2006) | Page 31

Township of Langley Corporate GHG Emission Reduction Plan
4.6 Purchasing
Overview and Current Actions
Procurement processes are a powerful tool for selecting and promoting energy reduction actions. During discussions, no opposition was raised to defining energy efficient conditions within purchasing tenders, provided that a competitive environment was maintained (i.e. specifications should not be defined to limit a purchase to a single supplier).
Proposed Actions
Action: Description Departmental Responsibility
15 Energy efficient purchasing
Establish a purchasing policy to select only EnergyStar rated appliances and electronics, for products where this rating has been established. Costs: • Zero or very small cost implications expected for
common items (e.g. computer monitors). • Some appliances (e.g. an energy efficient washing
machine) may carry a cost premium. Potential Reductions: EnergyStar rated appliances use less energy than defined minimum performance specifications. Key Challenges: None identified. For many categories of appliances, there is no cost premium for an EnergyStar rated product.
Purchasing
16 Energy efficient contract specifications
Endeavor to include energy efficiency specifications in RFP and tendering documents where appropriate. This could include specification of minimum performance, or evaluation criteria related to energy efficiency. The desired result would be increased use of products and services that are energy efficient in the way that they are manufactured, used, and disposed of. Examples might be to include some evaluation points in a courier service RFP based on the proponents energy efficient fleet, or a specification for office supplies that includes recycled paper content. Costs: • No direct disbursements expected. • Possible incremental staff time required to craft
contract specifications or evaluate proposals. Potential Reductions: Emissions (and reductions) of suppliers are not included in the Township’s inventory. This activity is more for profile and promotion within the community. Key Challenges: • Challenging specifications for some products. • Marketplace unfamiliarity.
All departments with purchasing to administer.
F inal Report (June 2, 2006) | Page 32

Township of Langley Corporate GHG Emission Reduction Plan
4.7 Demonstrations of Leadership
Overview and Current Actions
While all GHG emission reduction activities undertaken are a demonstration of the Township’s leadership towards sustainability, most are executed to meet a defined service requirement, in response to public demand, or based on a business case that defines an acceptable economic rate of return.
This section includes actions that could be undertaken to demonstrate a leadership position in energy and GHG management. These may not have an economic return, but may be desired to demonstrate to the community the Township’s commitment to energy reduction and sustainability. They may also be useful to provide visible demonstration projects of actions and technologies that could be undertaken in the broader community. These actions may also include educational and awareness activities to promote energy reduction and GHG management.
Demonstrations of leadership will become more important in the future as the Township decides how to develop and implement a community wide program.
Proposed Actions Possible Action: Description Departmental
Responsibility
Car pooling Provide incentives and facilitate staff car pooling. Environment Reduce vehicle trips between operations center and civic facility.
Encourage staff to reduce extra vehicle trips between the operations center and the new civic facility. Many possibilities exist - staff will be best qualified to identify these. Some examples might be: • scheduling meetings at the start of the work-day
rather than mid-morning to prevent extra trips between locations.
• providing ‘hoteling’ work stations at each site so that visiting staff can check email etc. and avoid trips back and forth.
• staff car-pooling to meetings between the sites.
All
Solar water heating
Install a solar water heater at one of the sports fields change rooms, or the summer outdoor pool. The objective would be to showcase leadership.
Parks
Highlight the Civic Center facilities
Develop permanent signage around the staff and public areas of the new Civic facility to highlight the Green building features.
Facilities / Environment
Promotions Include energy efficiency and GHG reduction activities in corporate activities. Examples might be: • The waste pick-up calendar • Earth Day or Clean Air day activities • School or community promotions
Environment
F inal Report (June 2, 2006) | Page 33
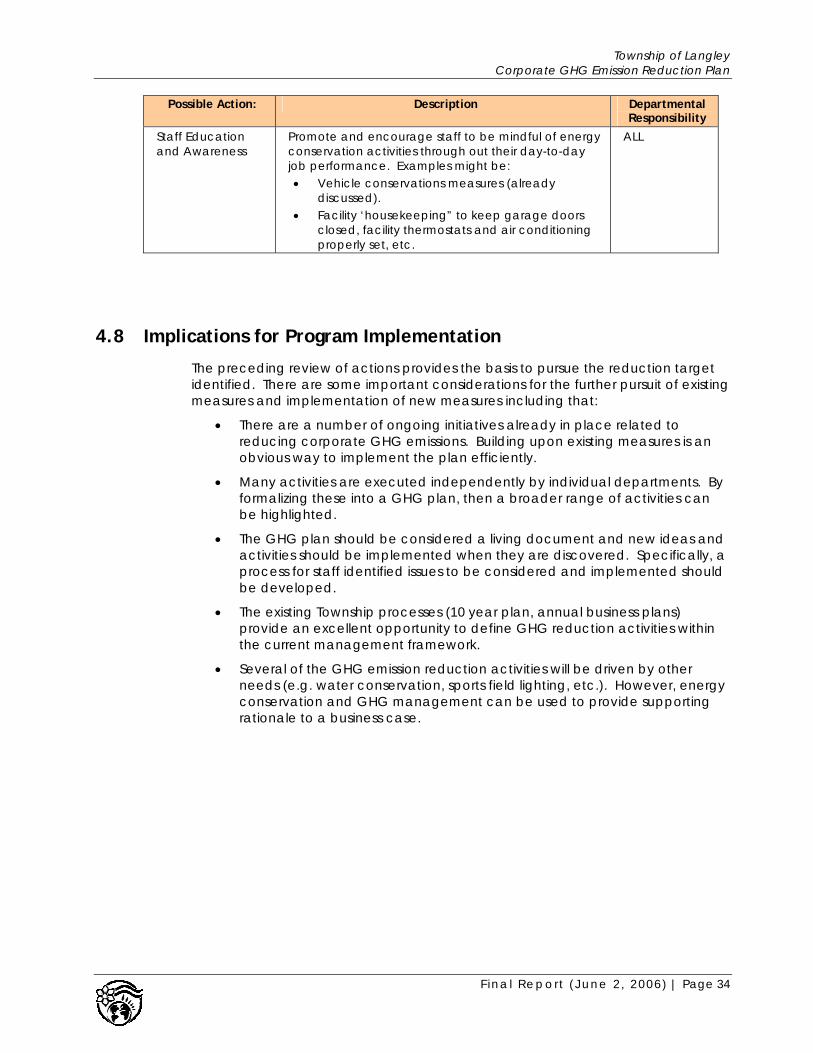
Township of Langley Corporate GHG Emission Reduction Plan
Possible Action: Description Departmental Responsibility
Staff Education and Awareness
Promote and encourage staff to be mindful of energy conservation activities through out their day-to-day job performance. Examples might be: • Vehicle conservations measures (already
discussed). • Facility ‘housekeeping” to keep garage doors
closed, facility thermostats and air conditioning properly set, etc.
ALL
4.8 Implications for Program Implementation
The preceding review of actions provides the basis to pursue the reduction target identified. There are some important considerations for the further pursuit of existing measures and implementation of new measures including that:
• There are a number of ongoing initiatives already in place related to reducing corporate GHG emissions. Building upon existing measures is an obvious way to implement the plan efficiently.
• Many activities are executed independently by individual departments. By formalizing these into a GHG plan, then a broader range of activities can be highlighted.
• The GHG plan should be considered a living document and new ideas and activities should be implemented when they are discovered. Specifically, a process for staff identified issues to be considered and implemented should be developed.
• The existing Township processes (10 year plan, annual business plans) provide an excellent opportunity to define GHG reduction activities within the current management framework.
• Several of the GHG emission reduction activities will be driven by other needs (e.g. water conservation, sports field lighting, etc.). However, energy conservation and GHG management can be used to provide supporting rationale to a business case.
F inal Report (June 2, 2006) | Page 34

Township of Langley Corporate GHG Emission Reduction Plan
5 Program Implementation
This section provides an overview of the implementation activities for the plan, a summary of potential emissions reduction results, and a proposed monitoring and reporting process.
5.1 Description
Program Name: Township of Langley Corporate GHG Action Plan
Objective: The Township has established an objective for this program to reduce corporate greenhouse gas emissions by 10 % by 2010 compared to a year 2000 baseline level.
The corporate GHG management plan establishes means to reducing energy and greenhouse gas emissions from in-house activities, with a primary focus on buildings, recreation centers, and the vehicle and machinery fleet. The program will work to strengthen and expand existing and new activities at the Township.
5.2 Program Delivery
5.2.1 Program Champion
A program champion will need to be identified at the management level. This person will be responsible for activities defined under the plan. Responsibilities will include:
• Ensuring that individual supervisors and mangers are executing their respective activities.
• Including energy management activities in annual budgets and building business cases for implementation activities.
• Reporting to council annually or as required on the progress of the plan activities.
5.2.2 Program Coordinator
A person will be required to coordinate energy efficiency and GHG activities. This could be from within the Environment Department, or the Facilities and Operations department. Activities would include:
• Annual reporting by department leaders to the program champion - compilation of data etc.
• Facilitating awareness activities with staff - announcements and promotions
F inal Report (June 2, 2006) | Page 35

Township of Langley Corporate GHG Emission Reduction Plan
• Tracking and monitoring progress
The intention would be to ensure follow through with actions and identify opportunities to inter link energy reduction and GHG management with other activities. Staff resources might be in the range of two to four weeks of staff time per year (for the coordinator functions) depending on the level of activity.
5.2.3 Resource Requirements
Corporate emissions reductions will be achieved utilizing a combination of existing operating budgets and staffing and new funding. For example building energy audits can range from free “walk through” audits provided by utility companies to detailed engineering studies costing several thousand dollars.
Similarly a driver education campaign may require some money for posters, window stickers, etc. The GHG Program budget should include funds for these activities.
Staff time required to engage these activities should be recognized. Attempting to conduct these activities ‘off the side of the desk’ may not prove effective. Staff who do spend efforts on energy and GHG management need management support that this is an acceptable use of time. Acknowledgement can include inclusion in job descriptions or performance reviews.
Once a specific energy reduction activity is identified, the actions needed to implement will be developed into a business case for that respective department’s budgeting.
5.2.4 Integration with other activities
An important consideration is to highlight the interconnected nature of many Township activities. Many activities are performed for a variety of reasons and will have only a small effect on GHG emissions, yet the energy reduction and GHG benefit can be highlighted. This maintains a consistent message to staff and may add sustainability-themed weight to a funding decision or business case. There will be countless examples but might include:
• A satellite works yard was mentioned because of the large driving distances within the community. Such a decision would be based on operational and budgetary considerations, but the energy savings through reduced driving should be highlighted.
• Water conservation activities will reduce water pumping and associated electricity savings.
• The “Arbour Ribbon“ to enhance trees and greenery can include GHG benefits of carbon sequestration (these may not be large).
• The “Towards Sustainability” initiative carries many subject areas and themes. The energy and GHG issues can be highlighted in their appropriate location.
F inal Report (June 2, 2006) | Page 36
Township of Langley Corporate GHG Emission Reduction Plan
5.3 Reporting
5.3.1 Reporting Requirements
Measuring the success of the program will require reporting information of the emissions reductions achieved from individual activities and the total Township emissions.
At the program level this likely will consist of annual (or bi-annual) reports that describe energy consumption and GHG emissions, program activities and upcoming initiatives.
Minimum reporting requirements would include:
• Progress on the implementation of the different activities including a description of the current status, progress made, and changes or new understandings gained, an estimate of the time and resources spent on each item.
• Actual performance using collected utility, purchasing records for those actions that are directly measurable through quantified data.
• Total GHG emissions.
Additional reporting might include:
• Qualitative assessment of each project’s visibility and potential for replication.
• Qualitative assessment of project secondary benefits (social and environmental impacts).
• Descriptive case studies to promote the plan.
5.3.2 Reporting Activities
A range of data collection is required to compile the information for the GHG reporting. This will use spreadsheet templates provided in Appendix A. The data required includes:
Natural Gas Consumption:
[Contact as of April 2006 is Hans Mertins, Analyst, (604) 592-7753].
The Township currently maintains 41 accounts with Terasen Gas and the data is available as far back as mid-2003. For the creation of the 2004 energy and emissions profiles, the data was obtained to December 2004 and is provided in Table A- 1 in Appendix A. For annual reporting, the latest data (complete calendar year of interest) should be obtained from Terasen and the table updated.
F inal Report (June 2, 2006) | Page 37

Township of Langley Corporate GHG Emission Reduction Plan
Electricity Consumption:
[Contact as of April 2006 is Dina Matterson, Key Account Manager, (604) 453-6225]
The Township maintains about 120 metered accounts with BC Hydro and another 110 streetlight accounts are billed on a fixed rate basis to the Township. The baseline report had obtained detailed consumption data for all these accounts. For the 2004 profiles, only the metered accounts were updated, and the other accounts were carried over from previous years (e.g. 1999 streetlight consumption assumed for 2002 and 2003 consumption for 2004).
For future reporting, current data should be obtained for the year of interest and compiled into the spreadsheet. Typically only the metered accounts need to be updated. It should be noted that some new accounts are expected each year.
Vehicle Fuel Consumption:
[Contact is John McQueen, ToL Vehicle Operations]
The Township Vehicle Fleet operations group maintains records on fuel consumption for all the Township vehicles.
For future reporting the total fuel consumption of each fuel type should be obtained from the vehicles group (at a minimum). If possible, an individual vehicle consumption breakdown would be useful to identify the largest users and possible target reduction activities.
Some confounding factors were identified in the baseline report and include that:
• Some users (e.g. fire department vehicles) commonly fill up at retail fuel stations and bill the amount to accounts, though there is not a consistent method of accounts and it can be difficult to extract these charges. As well, these charges represent dollars only, and an estimate will have to be made of the liters of fuel consumed.
• Some staff use personal vehicles for work activities and charge back to operating or capital accounts on a mileage basis. This was small in the baseline review, but may increase as a result of the new Civic Facility moving some staff further from the operations center.
Corporate Solid Waste Generation:
[Contact is Harb Chohan, ToL Solid Waste Operations]
Corporate solid waste is estimated on the basis of the number of dumpsters, the frequency of emptying, and an estimate of the typical level of filling. This method can be continued, however a review of the number of dumpsters emptied should be obtained.
F inal Report (June 2, 2006) | Page 38
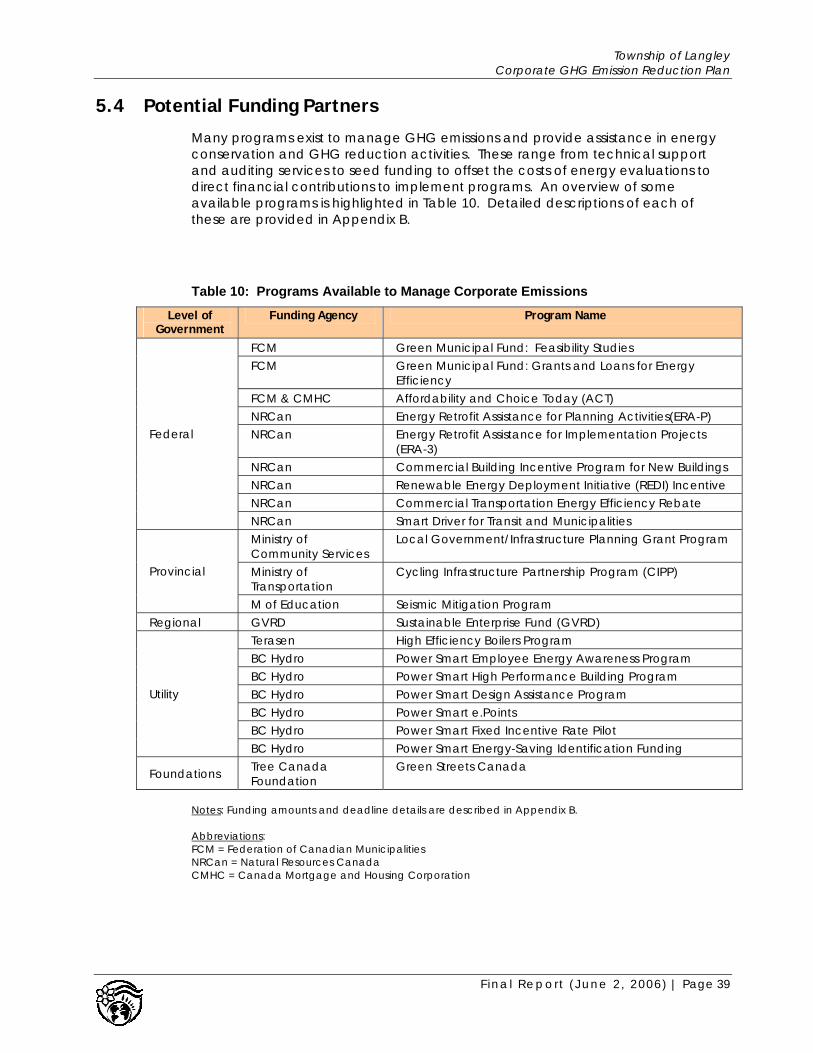
Township of Langley Corporate GHG Emission Reduction Plan
5.4 Potential Funding Partners
Many programs exist to manage GHG emissions and provide assistance in energy conservation and GHG reduction activities. These range from technical support and auditing services to seed funding to offset the costs of energy evaluations to direct financial contributions to implement programs. An overview of some available programs is highlighted in Table 10. Detailed descriptions of each of these are provided in Appendix B.
Table 10: Programs Available to Manage Corporate Emissions
Level of Government
Funding Agency Program Name
FCM Green Municipal Fund: Feasibility Studies FCM Green Municipal Fund: Grants and Loans for Energy
Efficiency FCM & CMHC Affordability and Choice Today (ACT) NRCan Energy Retrofit Assistance for Planning Activities(ERA-P) NRCan Energy Retrofit Assistance for Implementation Projects
(ERA-3) NRCan Commercial Building Incentive Program for New Buildings NRCan Renewable Energy Deployment Initiative (REDI) Incentive NRCan Commercial Transportation Energy Efficiency Rebate
Federal
NRCan Smart Driver for Transit and Municipalities Ministry of Community Services
Local Government/Infrastructure Planning Grant Program
Ministry of Transportation
Cycling Infrastructure Partnership Program (CIPP) Provincial
M of Education Seismic Mitigation Program Regional GVRD Sustainable Enterprise Fund (GVRD)
Terasen High Efficiency Boilers Program BC Hydro Power Smart Employee Energy Awareness Program BC Hydro Power Smart High Performance Building Program BC Hydro Power Smart Design Assistance Program BC Hydro Power Smart e.Points BC Hydro Power Smart Fixed Incentive Rate Pilot
Utility
BC Hydro Power Smart Energy-Saving Identification Funding
Foundations Tree Canada Foundation
Green Streets Canada
Notes: Funding amounts and deadline details are described in Appendix B. Abbreviations: FCM = Federation of Canadian Municipalities NRCan = Natural Resources Canada CMHC = Canada Mortgage and Housing Corporation
F inal Report (June 2, 2006) | Page 39

Township of Langley Corporate GHG Emission Reduction Plan
6 Next Steps
A sequence of activities is required to move from planning to action. This includes:
• Council endorsement and formal approval of the plan.
• Internal launch of the plan to notify staff that corporate emission reductions activities have commenced
• Initiating plan defined actions. Two areas to start would include initiating a vehicle consumption reduction program and evaluating some of the building stock for retrofit opportunities. At a minimum, funds for conducting thorough energy audits of the most promising building opportunities should be sought as soon as possible.
• Seeking partnership funding. Funding applications for assistance to implement specific projects should be sought as soon as the project is identified. Many of these programs (e.g. Federal Green Funds) have time lags of several months for funding approval.
F inal Report (June 2, 2006) | Page 40

Township of Langley Corporate GHG Emission Reduction Plan
7 Appendices
Appendix A: Energy and GHG Profiles for the Township of Langley
Appendix B: Compendium of Identified Potential Funding Sources
F inal Report (June 2, 2006) | Page 41

Township of Langley Corporate GHG Emission Reduction Plan
Appendices
F inal Report (June 2, 2006)

Township of Langley Corporate GHG Emission Reduction Plan
Appendices
Appendix A: Energy and GHG Profiles for the Township of Langley
Table A-1: Township Natural Gas Consumption
Table A-2: Township Electricity Consumption
F inal Report (June 2, 2006)
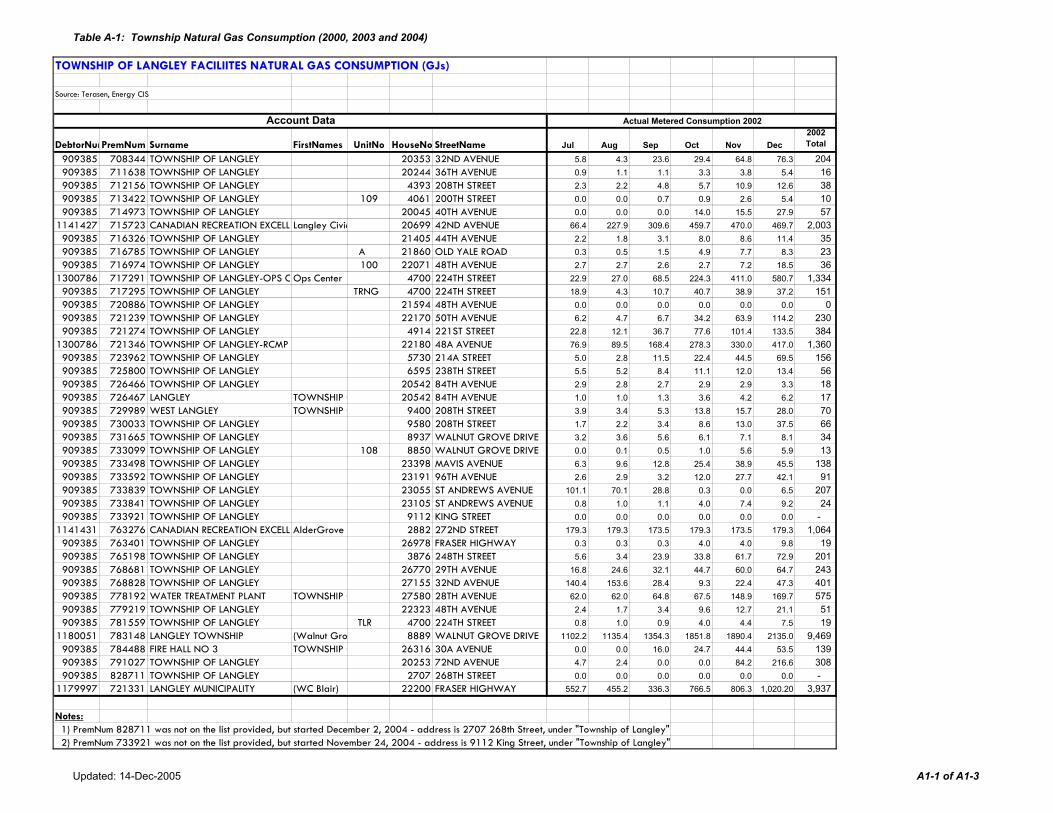
Table A-1: Township Natural Gas Consumption (2000, 2003 and 2004)
TOWNSHIP OF LANGLEY FACILIITES NATURAL GAS CONSUMPTION (GJs)
Source: Terasen, Energy CIS
DebtorNumPremNum Surname FirstNames UnitNo HouseNo StreetName Jul Aug Sep Oct Nov Dec2002 Total
909385 708344 TOWNSHIP OF LANGLEY 20353 32ND AVENUE 5.8 4.3 23.6 29.4 64.8 76.3 204 909385 711638 TOWNSHIP OF LANGLEY 20244 36TH AVENUE 0.9 1.1 1.1 3.3 3.8 5.4 16 909385 712156 TOWNSHIP OF LANGLEY 4393 208TH STREET 2.3 2.2 4.8 5.7 10.9 12.6 38 909385 713422 TOWNSHIP OF LANGLEY 109 4061 200TH STREET 0.0 0.0 0.7 0.9 2.6 5.4 10 909385 714973 TOWNSHIP OF LANGLEY 20045 40TH AVENUE 0.0 0.0 0.0 14.0 15.5 27.9 57
1141427 715723 CANADIAN RECREATION EXCELLELangley Civic 20699 42ND AVENUE 66.4 227.9 309.6 459.7 470.0 469.7 2,003 909385 716326 TOWNSHIP OF LANGLEY 21405 44TH AVENUE 2.2 1.8 3.1 8.0 8.6 11.4 35 909385 716785 TOWNSHIP OF LANGLEY A 21860 OLD YALE ROAD 0.3 0.5 1.5 4.9 7.7 8.3 23 909385 716974 TOWNSHIP OF LANGLEY 100 22071 48TH AVENUE 2.7 2.7 2.6 2.7 7.2 18.5 36
1300786 717291 TOWNSHIP OF LANGLEY-OPS C Ops Center 4700 224TH STREET 22.9 27.0 68.5 224.3 411.0 580.7 1,334 909385 717295 TOWNSHIP OF LANGLEY TRNG 4700 224TH STREET 18.9 4.3 10.7 40.7 38.9 37.2 151 909385 720886 TOWNSHIP OF LANGLEY 21594 48TH AVENUE 0.0 0.0 0.0 0.0 0.0 0.0 0 909385 721239 TOWNSHIP OF LANGLEY 22170 50TH AVENUE 6.2 4.7 6.7 34.2 63.9 114.2 230 909385 721274 TOWNSHIP OF LANGLEY 4914 221ST STREET 22.8 12.1 36.7 77.6 101.4 133.5 384
1300786 721346 TOWNSHIP OF LANGLEY-RCMP 22180 48A AVENUE 76.9 89.5 168.4 278.3 330.0 417.0 1,360 909385 723962 TOWNSHIP OF LANGLEY 5730 214A STREET 5.0 2.8 11.5 22.4 44.5 69.5 156 909385 725800 TOWNSHIP OF LANGLEY 6595 238TH STREET 5.5 5.2 8.4 11.1 12.0 13.4 56 909385 726466 TOWNSHIP OF LANGLEY 20542 84TH AVENUE 2.9 2.8 2.7 2.9 2.9 3.3 18 909385 726467 LANGLEY TOWNSHIP O 20542 84TH AVENUE 1.0 1.0 1.3 3.6 4.2 6.2 17 909385 729989 WEST LANGLEY TOWNSHIP O 9400 208TH STREET 3.9 3.4 5.3 13.8 15.7 28.0 70 909385 730033 TOWNSHIP OF LANGLEY 9580 208TH STREET 1.7 2.2 3.4 8.6 13.0 37.5 66 909385 731665 TOWNSHIP OF LANGLEY 8937 WALNUT GROVE DRIVE 3.2 3.6 5.6 6.1 7.1 8.1 34 909385 733099 TOWNSHIP OF LANGLEY 108 8850 WALNUT GROVE DRIVE 0.0 0.1 0.5 1.0 5.6 5.9 13 909385 733498 TOWNSHIP OF LANGLEY 23398 MAVIS AVENUE 6.3 9.6 12.8 25.4 38.9 45.5 138 909385 733592 TOWNSHIP OF LANGLEY 23191 96TH AVENUE 2.6 2.9 3.2 12.0 27.7 42.1 91 909385 733839 TOWNSHIP OF LANGLEY 23055 ST ANDREWS AVENUE 101.1 70.1 28.8 0.3 0.0 6.5 207 909385 733841 TOWNSHIP OF LANGLEY 23105 ST ANDREWS AVENUE 0.8 1.0 1.1 4.0 7.4 9.2 24 909385 733921 TOWNSHIP OF LANGLEY 9112 KING STREET 0.0 0.0 0.0 0.0 0.0 0.0 -
1141431 763276 CANADIAN RECREATION EXCELLEAlderGrove 2882 272ND STREET 179.3 179.3 173.5 179.3 173.5 179.3 1,064 909385 763401 TOWNSHIP OF LANGLEY 26978 FRASER HIGHWAY 0.3 0.3 0.3 4.0 4.0 9.8 19 909385 765198 TOWNSHIP OF LANGLEY 3876 248TH STREET 5.6 3.4 23.9 33.8 61.7 72.9 201 909385 768681 TOWNSHIP OF LANGLEY 26770 29TH AVENUE 16.8 24.6 32.1 44.7 60.0 64.7 243 909385 768828 TOWNSHIP OF LANGLEY 27155 32ND AVENUE 140.4 153.6 28.4 9.3 22.4 47.3 401 909385 778192 WATER TREATMENT PLANT TOWNSHIP O 27580 28TH AVENUE 62.0 62.0 64.8 67.5 148.9 169.7 575 909385 779219 TOWNSHIP OF LANGLEY 22323 48TH AVENUE 2.4 1.7 3.4 9.6 12.7 21.1 51 909385 781559 TOWNSHIP OF LANGLEY TLR 4700 224TH STREET 0.8 1.0 0.9 4.0 4.4 7.5 19
1180051 783148 LANGLEY TOWNSHIP (Walnut Gro 8889 WALNUT GROVE DRIVE 1102.2 1135.4 1354.3 1851.8 1890.4 2135.0 9,469 909385 784488 FIRE HALL NO 3 TOWNSHIP O 26316 30A AVENUE 0.0 0.0 16.0 24.7 44.4 53.5 139 909385 791027 TOWNSHIP OF LANGLEY 20253 72ND AVENUE 4.7 2.4 0.0 0.0 84.2 216.6 308 909385 828711 TOWNSHIP OF LANGLEY 2707 268TH STREET 0.0 0.0 0.0 0.0 0.0 0.0 -
1179997 721331 LANGLEY MUNICIPALITY (WC Blair) 22200 FRASER HIGHWAY 552.7 455.2 336.3 766.5 806.3 1,020.20 3,937
Notes: 1) PremNum 828711 was not on the list provided, but started December 2, 2004 - address is 2707 268th Street, under "Township of Langley" 2) PremNum 733921 was not on the list provided, but started November 24, 2004 - address is 9112 King Street, under "Township of Langley"
Account Data Actual Metered Consumption 2002
Updated: 14-Dec-2005 A1-1 of A1-3

Table A-1: Township Natural Gas Consumption (2000, 2003 and 2004)
TOWNSHIP OF LANGLEY FACILIITES NATURAL GAS CONSUMPTION (GJs)
Source: Terasen, Energy CIS
DebtorNumPremNum Surname FirstNames UnitNo HouseNo StreetName909385 708344 TOWNSHIP OF LANGLEY 20353 32ND AVENUE 909385 711638 TOWNSHIP OF LANGLEY 20244 36TH AVENUE 909385 712156 TOWNSHIP OF LANGLEY 4393 208TH STREET 909385 713422 TOWNSHIP OF LANGLEY 109 4061 200TH STREET 909385 714973 TOWNSHIP OF LANGLEY 20045 40TH AVENUE
1141427 715723 CANADIAN RECREATION EXCELLELangley Civic 20699 42ND AVENUE 909385 716326 TOWNSHIP OF LANGLEY 21405 44TH AVENUE 909385 716785 TOWNSHIP OF LANGLEY A 21860 OLD YALE ROAD 909385 716974 TOWNSHIP OF LANGLEY 100 22071 48TH AVENUE
1300786 717291 TOWNSHIP OF LANGLEY-OPS C Ops Center 4700 224TH STREET 909385 717295 TOWNSHIP OF LANGLEY TRNG 4700 224TH STREET 909385 720886 TOWNSHIP OF LANGLEY 21594 48TH AVENUE 909385 721239 TOWNSHIP OF LANGLEY 22170 50TH AVENUE 909385 721274 TOWNSHIP OF LANGLEY 4914 221ST STREET
1300786 721346 TOWNSHIP OF LANGLEY-RCMP 22180 48A AVENUE 909385 723962 TOWNSHIP OF LANGLEY 5730 214A STREET 909385 725800 TOWNSHIP OF LANGLEY 6595 238TH STREET 909385 726466 TOWNSHIP OF LANGLEY 20542 84TH AVENUE 909385 726467 LANGLEY TOWNSHIP O 20542 84TH AVENUE 909385 729989 WEST LANGLEY TOWNSHIP O 9400 208TH STREET 909385 730033 TOWNSHIP OF LANGLEY 9580 208TH STREET 909385 731665 TOWNSHIP OF LANGLEY 8937 WALNUT GROVE DRIVE 909385 733099 TOWNSHIP OF LANGLEY 108 8850 WALNUT GROVE DRIVE 909385 733498 TOWNSHIP OF LANGLEY 23398 MAVIS AVENUE 909385 733592 TOWNSHIP OF LANGLEY 23191 96TH AVENUE 909385 733839 TOWNSHIP OF LANGLEY 23055 ST ANDREWS AVENUE 909385 733841 TOWNSHIP OF LANGLEY 23105 ST ANDREWS AVENUE 909385 733921 TOWNSHIP OF LANGLEY 9112 KING STREET
1141431 763276 CANADIAN RECREATION EXCELLEAlderGrove 2882 272ND STREET 909385 763401 TOWNSHIP OF LANGLEY 26978 FRASER HIGHWAY 909385 765198 TOWNSHIP OF LANGLEY 3876 248TH STREET 909385 768681 TOWNSHIP OF LANGLEY 26770 29TH AVENUE 909385 768828 TOWNSHIP OF LANGLEY 27155 32ND AVENUE 909385 778192 WATER TREATMENT PLANT TOWNSHIP O 27580 28TH AVENUE 909385 779219 TOWNSHIP OF LANGLEY 22323 48TH AVENUE 909385 781559 TOWNSHIP OF LANGLEY TLR 4700 224TH STREET
1180051 783148 LANGLEY TOWNSHIP (Walnut Gro 8889 WALNUT GROVE DRIVE 909385 784488 FIRE HALL NO 3 TOWNSHIP O 26316 30A AVENUE 909385 791027 TOWNSHIP OF LANGLEY 20253 72ND AVENUE 909385 828711 TOWNSHIP OF LANGLEY 2707 268TH STREET
1179997 721331 LANGLEY MUNICIPALITY (WC Blair) 22200 FRASER HIGHWAY
Notes: 1) PremNum 828711 was not on the list provided, but started December 2, 2004 - address is 2707 268th Street, 2) PremNum 733921 was not on the list provided, but started November 24, 2004 - address is 9112 King Street,
Account Data
Jan Feb Mar Apr May Jun Jul Aug Sep Oct Nov Dec2003 Total
82.7 76.7 60.6 51.7 17.8 7.2 3.7 2.3 21.7 29.8 81.1 100.2 535 5.2 4.3 3.6 2.1 1.1 0.9 0.9 1.0 0.9 4.1 4.8 6.6 36
13.4 12.1 9.9 8.6 3.6 2.0 1.5 1.3 4.4 5.9 10.9 14.0 88 5.4 5.5 3.5 1.2 0.2 0.1 0.0 0.0 0.8 1.0 6.2 7.5 31
30.2 24.5 12.2 1.4 0.1 0.0 0.0 0.0 0.4 9.7 20.7 31.3 131 488.3 487.8 422.0 216.8 102.9 58.0 76.9 200.2 253.1 378.9 489.9 535.2 3,710 11.1 8.4 8.7 5.4 3.7 1.1 1.0 0.9 2.6 6.0 6.4 10.7 66 8.9 6.9 7.1 6.1 2.4 1.9 1.1 3.5 3.4 3.5 3.9 8.1 57
18.7 15.3 10.0 8.7 1.9 0.1 0.0 0.0 3.0 13.4 15.3 28.5 115 627.3 503.0 498.1 315.3 183.1 58.5 20.7 8.3 79.0 339.9 358.4 532.9 3,525 38.8 39.2 43.4 37.3 19.0 11.3 7.9 10.5 24.2 37.3 36.1 37.3 342 0.0 0.0 0.0 0.0 0.0 0.0 0.0 0.0 0.0 0.0 0.0 0.0 -
124.5 108.2 114.3 70.3 25.9 8.1 3.3 8.9 21.5 56.3 105.5 147.9 795 140.9 124.1 116.6 83.3 60.7 22.2 4.4 4.8 15.5 91.1 161.2 195.9 1,021 458.3 442.9 446.4 388.1 292.7 98.1 25.8 25.8 96.0 294.9 419.0 510.7 3,499 64.9 54.3 55.8 37.8 18.9 7.5 2.9 1.6 1.4 34.6 67.8 76.6 424 14.6 14.0 12.3 9.7 7.0 4.6 4.3 3.8 7.5 10.3 11.7 13.5 113 3.2 2.8 3.1 2.9 2.7 2.3 2.3 2.1 2.4 3.0 3.0 3.6 33 6.7 5.4 5.2 3.3 2.1 0.6 0.3 0.4 1.4 3.8 6.7 7.8 44
27.1 21.8 22.3 12.2 11.1 3.1 3.1 2.6 6.0 20.6 20.3 24.9 175 35.1 24.6 26.7 22.4 10.3 1.4 1.4 1.3 2.3 10.2 34.8 47.8 218 15.3 24.6 28.6 36.7 31.7 12.8 8.6 5.3 5.8 16.6 44.9 60.5 291 10.6 9.9 13.7 7.4 0.9 0.0 0.0 0.0 0.0 2.9 21.9 24.7 92 52.1 47.9 40.0 19.2 15.8 7.7 7.1 7.4 12.5 18.5 50.3 60.6 339 46.6 39.6 35.4 21.0 10.7 3.9 2.8 2.8 2.7 18.8 37.0 41.2 263 17.3 18.1 17.8 14.4 28.5 64.1 59.7 88.5 21.5 14.4 21.4 26.3 392 9.4 6.2 5.1 3.1 0.9 0.8 0.8 0.8 1.1 3.7 7.1 9.2 48 0.0 0.0 0.0 0.0 0.0 0.0 0.0 0.0 0.0 0.0 0.0 0.0 -
179.3 162.0 179.3 173.5 179.3 173.5 179.3 162.8 238.1 293.7 322.4 253.5 2,497 8.3 9.9 8.5 5.9 2.4 0.4 0.1 0.2 0.7 3.7 13.6 15.5 69
79.0 73.6 63.4 53.0 21.9 10.2 3.9 1.2 20.9 30.3 66.8 88.4 513 82.9 74.7 76.0 56.2 36.5 32.2 11.2 9.3 19.3 29.4 90.4 95.5 614 16.7 65.1 29.3 15.5 18.1 106.4 126.1 122.7 21.5 11.0 33.6 24.0 590
167.8 111.9 116.7 75.1 74.8 72.4 42.5 38.6 71.6 77.9 121.1 130.3 1,101 16.6 16.4 18.0 15.1 6.6 2.0 1.8 1.3 2.6 7.4 8.0 13.2 109 7.8 6.2 6.0 2.7 1.5 0.6 0.6 0.6 0.9 2.1 2.8 6.5 38
2065.0 1995.8 2056.4 1813.9 1600.1 1483.1 1385.2 1351.1 1295.3 2005.7 2726.0 2769.9 22,548 70.2 74.4 50.0 29.7 13.9 5.4 3.8 3.0 5.6 38.7 61.0 87.4 443
123.5 105.9 113.7 69.8 30.0 8.5 2.1 2.6 10.8 43.8 89.1 130.3 730 0.0 0.0 0.0 0.0 0.0 0.0 0.0 0.0 0.0 0.0 0.0 0.0 -
933.1 947.8 1,022.30 904.7 828.4 667.1 573.6 599.2 629.9 767.4 958 961.4 9,793
Actual Metered Consumption 2003
Updated: 14-Dec-2005 A1-2 of A1-3

Table A-1: Township Natural Gas Consumption (2000, 2003 and 2004)
TOWNSHIP OF LANGLEY FACILIITES NATURAL GAS CONSUMPTION (GJs)
Source: Terasen, Energy CIS
DebtorNumPremNum Surname FirstNames UnitNo HouseNo StreetName909385 708344 TOWNSHIP OF LANGLEY 20353 32ND AVENUE 909385 711638 TOWNSHIP OF LANGLEY 20244 36TH AVENUE 909385 712156 TOWNSHIP OF LANGLEY 4393 208TH STREET 909385 713422 TOWNSHIP OF LANGLEY 109 4061 200TH STREET 909385 714973 TOWNSHIP OF LANGLEY 20045 40TH AVENUE
1141427 715723 CANADIAN RECREATION EXCELLELangley Civic 20699 42ND AVENUE 909385 716326 TOWNSHIP OF LANGLEY 21405 44TH AVENUE 909385 716785 TOWNSHIP OF LANGLEY A 21860 OLD YALE ROAD 909385 716974 TOWNSHIP OF LANGLEY 100 22071 48TH AVENUE
1300786 717291 TOWNSHIP OF LANGLEY-OPS C Ops Center 4700 224TH STREET 909385 717295 TOWNSHIP OF LANGLEY TRNG 4700 224TH STREET 909385 720886 TOWNSHIP OF LANGLEY 21594 48TH AVENUE 909385 721239 TOWNSHIP OF LANGLEY 22170 50TH AVENUE 909385 721274 TOWNSHIP OF LANGLEY 4914 221ST STREET
1300786 721346 TOWNSHIP OF LANGLEY-RCMP 22180 48A AVENUE 909385 723962 TOWNSHIP OF LANGLEY 5730 214A STREET 909385 725800 TOWNSHIP OF LANGLEY 6595 238TH STREET 909385 726466 TOWNSHIP OF LANGLEY 20542 84TH AVENUE 909385 726467 LANGLEY TOWNSHIP O 20542 84TH AVENUE 909385 729989 WEST LANGLEY TOWNSHIP O 9400 208TH STREET 909385 730033 TOWNSHIP OF LANGLEY 9580 208TH STREET 909385 731665 TOWNSHIP OF LANGLEY 8937 WALNUT GROVE DRIVE 909385 733099 TOWNSHIP OF LANGLEY 108 8850 WALNUT GROVE DRIVE 909385 733498 TOWNSHIP OF LANGLEY 23398 MAVIS AVENUE 909385 733592 TOWNSHIP OF LANGLEY 23191 96TH AVENUE 909385 733839 TOWNSHIP OF LANGLEY 23055 ST ANDREWS AVENUE 909385 733841 TOWNSHIP OF LANGLEY 23105 ST ANDREWS AVENUE 909385 733921 TOWNSHIP OF LANGLEY 9112 KING STREET
1141431 763276 CANADIAN RECREATION EXCELLEAlderGrove 2882 272ND STREET 909385 763401 TOWNSHIP OF LANGLEY 26978 FRASER HIGHWAY 909385 765198 TOWNSHIP OF LANGLEY 3876 248TH STREET 909385 768681 TOWNSHIP OF LANGLEY 26770 29TH AVENUE 909385 768828 TOWNSHIP OF LANGLEY 27155 32ND AVENUE 909385 778192 WATER TREATMENT PLANT TOWNSHIP O 27580 28TH AVENUE 909385 779219 TOWNSHIP OF LANGLEY 22323 48TH AVENUE 909385 781559 TOWNSHIP OF LANGLEY TLR 4700 224TH STREET
1180051 783148 LANGLEY TOWNSHIP (Walnut Gro 8889 WALNUT GROVE DRIVE 909385 784488 FIRE HALL NO 3 TOWNSHIP O 26316 30A AVENUE 909385 791027 TOWNSHIP OF LANGLEY 20253 72ND AVENUE 909385 828711 TOWNSHIP OF LANGLEY 2707 268TH STREET
1179997 721331 LANGLEY MUNICIPALITY (WC Blair) 22200 FRASER HIGHWAY
Notes: 1) PremNum 828711 was not on the list provided, but started December 2, 2004 - address is 2707 268th Street, 2) PremNum 733921 was not on the list provided, but started November 24, 2004 - address is 9112 King Street,
Account Data
Jan Feb Mar Apr May Jun Jul Aug Sep Oct Nov Dec2004 Total
90.1 78.4 48.2 32.5 15.1 4.8 4.3 4.0 20.2 28.1 75.4 99.3 500 7.2 4.7 4.0 1.8 1.2 1.0 0.9 0.9 0.9 3.7 4.5 6.2 37
11.8 9.7 8.7 4.3 2.3 1.7 1.4 1.3 4.2 5.6 10.2 12.9 74 5.5 4.4 1.9 0.9 0.3 0.0 0.0 0.0 0.6 0.9 3.3 4.4 22
26.1 15.3 14.5 2.9 0.0 0.0 0.0 0.0 1.4 7.2 19.8 29.7 117 561.5 448.8 455.7 148.4 46.4 29.6 24.4 54.3 258.5 452.0 514.3 591.3 3,585
9.5 10.3 10.0 5.9 2.7 2.6 2.7 2.4 2.9 8.2 9.6 13.1 80 11.7 10.2 6.6 5.8 1.8 1.7 1.7 1.7 1.6 2.8 8.4 10.4 64 34.8 22.0 20.6 10.0 8.4 3.8 0.1 0.0 0.0 4.2 25.9 32.8 163
658.5 452.4 337.7 204.4 95.9 77.0 14.1 18.7 62.3 194.1 372.9 645.2 3,133 37.3 36.6 41.0 39.1 24.4 21.5 11.8 2.4 4.3 25.1 37.1 48.6 329 0.0 0.0 0.0 0.0 0.0 0.0 0.0 0.0 0.0 0.0 0.0 0.0 -
139.9 109.8 74.9 34.0 13.1 2.4 2.2 2.2 17.3 60.2 104.9 141.3 702 184.9 136.3 103.2 54.6 23.9 7.0 3.1 4.3 10.7 50.9 104.8 173.2 857 495.6 387.8 341.3 261.9 221.5 134.7 56.1 69.2 144.3 277.3 387.9 505.4 3,283 83.7 73.1 65.4 44.9 28.2 14.8 2.8 7.5 24.6 50.5 68.7 64.3 529 6.7 9.4 21.4 9.8 7.6 5.0 3.6 3.6 6.4 11.7 13.7 14.8 114 3.2 2.1 1.8 0.6 0.8 1.2 1.1 1.1 1.5 1.6 1.7 1.8 18 8.5 7.0 5.1 2.7 2.3 1.1 1.0 0.5 0.0 0.0 0.0 0.0 28
35.9 22.6 21.3 8.8 5.1 4.4 3.6 3.5 4.7 13.0 20.5 21.4 165 46.2 32.7 12.7 2.0 1.9 1.8 1.5 1.1 0.5 8.0 30.0 33.0 171 66.5 50.8 39.2 24.0 8.7 6.0 6.1 5.6 6.4 9.5 15.4 20.0 258 25.5 16.4 14.2 4.4 1.0 0.0 0.3 0.1 1.7 6.6 17.3 26.4 114 66.4 55.2 39.7 26.1 14.0 10.2 5.4 9.4 16.3 27.3 44.9 57.6 373 45.3 35.9 26.9 19.8 7.4 5.3 2.5 2.8 3.0 13.2 35.4 44.1 242 23.6 18.9 16.0 14.6 24.5 50.0 91.2 72.5 44.9 13.6 19.9 26.3 416 9.7 7.1 4.4 3.2 1.1 1.0 0.9 1.2 1.6 3.4 6.8 8.0 49 0.0 0.0 0.0 0.0 0.0 0.0 0.0 0.0 0.0 0.0 9.8 7.7 17
395.3 366.5 337.5 61.4 28.4 24.7 18.7 97.3 216.3 256.4 316.0 345.1 2,464 16.3 11.8 9.5 3.9 4.0 0.8 0.6 1.7 1.7 11.8 11.7 18.8 93 82.3 73.3 44.6 27.6 11.4 1.9 1.7 1.6 24.1 36.6 70.0 90.1 465
111.0 73.9 54.5 33.3 21.2 19.6 7.5 10.8 31.8 36.0 63.0 65.1 528 59.6 52.9 28.5 7.7 3.1 118.7 120.3 129.7 24.3 8.4 24.9 43.5 622
129.7 106.7 18.4 141.6 99.4 82.2 68.7 64.8 92.8 137.4 169.6 194.2 1,306 21.7 22.9 7.7 1.1 0.2 0.2 0.2 2.2 6.8 7.1 15.2 23.5 109 6.7 4.6 4.3 2.0 0.7 0.7 0.7 0.7 1.0 3.6 3.3 6.2 35
2859.4 2522.6 2093.2 1575.1 1722.3 1154.7 877.4 911.8 683.9 2270.9 2446.2 2625.5 21,743 82.8 66.9 42.6 25.9 14.8 7.1 5.5 4.2 17.7 29.1 55.3 85.2 437
120.9 80.6 57.4 32.2 12.2 5.8 3.0 4.0 9.2 52.4 124.1 151.4 653 0.0 0.0 0.0 0.0 0.0 0.0 0.0 0.0 0.0 0.0 0.0 18.8 19
942.1 684.6 747.2 709.1 746.2 528.0 524.5 532.2 583.8 641.3 655.2 825.3 8,119
Actual Metered Consumption 2004
Updated: 14-Dec-2005 A1-3 of A1-3

Table A-2: Township Electricity Consumption (1995, 1999, 2000, 2003 and 2004)
Account Number Acct Closed Date Category Sub-Category Account Description Rate
Code Service Address 1995 1999 2000 2003 2004
(kwh) (kwh) (kwh) (kwh) (kwh)00003089164 Buildings Fire Fire Hall No.4 1200 20253 72 Avenue 104,280 8226022319460101 Buildings Aldergrove Kinsemen C 1200 26770 29 Avenue 159,840 160,080 183360 199120 18560021382299191 Buildings Parks Walnut Grove Park (Wa 1200 8937 Walnut Grove Drive 25,500 37,860 46080 50940 4596022303409201 Buildings Parks Aldergrove South Park 1200 W OF 27A Avenue 269 Street 16,400 33,040 32960 36000 2968021333500091 Buildings Operations Operations Centre 1200 4700 224 Street 417,614 779,040 843120 861120 78840021343200181 Buildings Fire Fire Hall No.6 1200 22170 50 Avenue 368,520 346080 417000 42252021343249001 Buildings Ops Municipal Hall 1200 4914 221 Street 501,200 295,200 350000 357400 35000021343200821 14-Jun-99 Buildings Operations Municipal Hall 4914 221 Street (RR) 2,609 1,028
15-Feb-95 Buildings Operations Municipal Hall 4914 221 Street 11,24212-Feb-99 Buildings Operations Municipal Hall 4914 221 Street 21,551 4,11315-Mar-95 Buildings Operations Municipal Hall 4914 221 Street 65,040
21343297003 Buildings Rec Center WC Blair Recreation 1200 22200 Fraser Highway 1,688,400 1,386,960 1361040 1,470,480 158832021343299491 Buildings RCMP RCMP 1200 22180 48A Avenue 1,059,840 979,920 1028520 875,160 88272022301331201 Buildings Aldergrove Arena 1201 2882 272 Street 1,044,300 1,007,700 1,007,700 625,800 625,80021382200061 Buildings Rec Center Walnut Grove Recreati 1210 8889 Walnut Grove Drive 598,080 1,286,880 3629280 3199680 341712000000278394 Buildings RCMP RCMP Green HQ 1220 22323 48 Avenue 43,628 55888 75180 22968
1045384 Buildings LEPS Trailer 1220 4700 224 Street Trailer 4339 7869 804400001695144 Buildings Fire Fire Hall No.3 1220 26316 30A Avenue 32640 91680 9648000001715684 Buildings RCMP Aldergrove (Community 1220 26978 Fraser Highway 4384 63503 5647500002590894 Buildings Operations Brookswood Library 1220 20049 40 Avenue 4093 437300002756004 Buildings Parks Williams Park (Shelter) 1220 6595 238 Street Park 218 20500002840464 Buildings Parks Park Washrooms (Den 1220 21900 Old Yale Road 20182 806900003200674 Buildings RCMP RCMP Sub Office 1220 4061 200 Street (109) 20557 2269400003501164 Buildings Operations Murrayville Library 1220 22071 48 Avenue (100) 121560 10572021311300421 Buildings Fire Fire Hall No.5 1220 20355 32 Avenue 75,441 54,043 51566 45184 4417421322171981 Buildings Parks Cemetery (Building) 1220 4393 208 Street 8,248 14,998 15051 11741 1166821330300081 Buildings Parks Old Fire Hall Now Park 1220 4035 200 Street 12,027 33,835 24085 28602 3344700003453204 Buildings Parks South Aldergrove Park 1220 26817 27 Avenue 2546 991321350701171 Buildings Parks Langley Meadows Park 1220 19907 64 Avenue 0 0 0 27 2721352100172 Buildings Parks McCleod Athletic Park 1220 5745 216 Street 7,983 18,127 16480 19,679 2151821381700651 Buildings Parks McClughan Park 1220 9035 206 Street 1,645 1376 0 30822304443401 Buildings Methane Burner 1220 1099 272 Street 10,160 5,691 3910 3,850 371022320330011 Buildings Parks Ball Park 1220 27155 32 Avenue 4,403 8,210 7428 9,492 793922320330611 Buildings Parks Ball Park 1220 27155 32 Avenue 7,560 7,200 10140 11,160 948021343400111 Buildings Airport 1220 5333 216TH Street (Pole) 4,587 24,515 24701 26,723 2831321343400281 Buildings Airport 1220 5385 216 Street 1,078 20,273 18474 21,969 1994221343400381 Buildings Airport 1220 5385 216 Street 1,258 4,849 3812 3,885 339121343400451 Buildings Airport 1220 5225 216 Street (HELI.) 250 742 548 970 93622307350501 Buildings Fire Fire Hall No.7 1220 3876 248 Street 19,558 25,721 25492 21,693 2299121331480031 Buildings Operations Brookswood Library 1220 20045 40 Avenue 28,110 22,756 29042 25,270 3600821332304051 Buildings Parks Murrayville Cemetery ( 1220 21405 44 Avenue 2,257 4,115 5029 5,459 622721343400041 Buildings Airport 1220 5385 216 Street 1,080 30,360 28920 30,720 3144021365135961 Buildings Parks Williams Park (Washro 1220 6595 238 Street (Rest) 58,636 32,656 30678 21,107 1890021372150201 Buildings Parks Willoughby Park (Wash 1220 20542 84 Avenue 42,600 33,900 47820 21,720 3066021373100281 21-May-03 Buildings Fire Fire Hall No.4 (no longe 1220 20409 80 Avenue 27,589 28,293 28,293 13,69921381507031 Buildings West Langley Hall 1220 9400 208 Street 26,018 25729 25746 2512421381507531 Buildings Fire Fire Hall No.8 1220 9580 208 Street 54,834 57330 61381 6517921383203191 Buildings RCMP RCMP Sub Office 1220 8850 Walnut Grove Drive (108) 10,933 19,298 20752 19980 3717521384445091 Buildings Operations Museum 1220 23398 Mavis Avenue 37,021 33,701 34525 37451 3844421384445231 Buildings Operations Museum 1220 23398 Mavis Avenue 51,067 58,606 59383 51913 5192321384451231 Buildings Fire Fire Hall No.2 1220 23191 96 Avenue 27,380 27,870 26641 24674 28071
Updated on: 21JUN2004 A2-1 of A2-7

Table A-2: Township Electricity Consumption (1995, 1999, 2000, 2003 and 2004)
Account Number Acct Closed Date Category Sub-Category Account Description Rate
Code Service Address 1995 1999 2000 2003 2004
(kwh) (kwh) (kwh) (kwh) (kwh)21385235591 Buildings Fort Langley Communi 1220 23055 St. Andrews Avenue 18,781 15,903 17756 19241 2902021385235601 Buildings Cemetery (Building) 1220 23105 St. Andrews Avenue 3,961 5,321 5724 4,463 564622301417903 31-Mar-03 Buildings RCMP Aldergrove RCMP Sub 1220 3085 271 Street 13,843 19,038 19,038 333142104201 Buildings Parks Brown Park (Irrigation) 1401 5022 240 Street 5,126 1,574 1,574 4,558 4,55821331855741 Buildings Civic Centre 1755 20699 42 Avenue 1,803,000 1,304,400 1,304,400 1,490,400 1,490,40021330300063 5-May-02 Buildings RCMP Brookswood RCMP Sub Office 4061 200 Street (112) 24,866 24,86621373100271 19-Jul-02 Buildings Fire Fire Hall No.4 (no longer there) 20409 80 Avenue 20 16 1622301418003 31-Mar-03 Buildings RCMP Aldergrove RCMP Sub Office 3087 271 Street 12,135 5,162 5,16200000756624 30-Sep-01 Buildings LEPS Trailer 4700 224 Street Trailer 88 8800001103404 7-Jan-00 Buildings 7017 202B Street 14,67121343253141 15-May-99 Buildings 4914 222 Street 9,60022320455301 3-Jul-02 Buildings 2900 272 Street 26,958 28,669 28,669
24-Jul-95 Buildings 4061 200T Street (102) 5,14922-Apr-97 Buildings Heritage House 21860 Old Yale Road (B) 1,90625-Sep-98 Buildings 22313 48 Avenue 32,9925-Dec-95 Buildings 21447 51B Avenue 4,63325-Feb-98 Buildings 9580 208 Street 73,469
80635 Buildings 4061 200 Street 29,730 10391827-Nov-95 Buildings 22259 48 Avenue 26,955
21343400091 31-Dec-00 Buildings Airport (Account was closed) 5385 216 Street (U/S) 10,968 15,17900001832124 Streetlights Parks MAP Grandstand (Soft 1200 21485 58 Avenue 75,120 105,84000003491874 Streetlights Parks Mcleoad Athletic Park ( 1200 21400 58 Avenue 53,460 67,32021321283431 Streetlights Parks Noel Booth Park (Wash 1200 20244 36 Avenue 76,800 111,120 107,760 95,280 93,00021345235231 Streetlights Parks Brown Park (Washroom 1200 5022 240 Street 42,400 82,880 91,040 94,480 101,84021352100351 Streetlights Parks McCleod Athletic Park 1220 21541 57A Avenue 17,040 19,200 21,360 140,64021321100191 Streetlights Parks Bell Park (Security Ligh 1220 3800 205A Street 2,784 2,156 2,971 2,788 3,71721361310412 Streetlights Parks Milner Rugby Lights 1220 6860 Glover Road 20,941 23,368 12,974 12,54421372150221 Streetlights Parks Willoughby Park (Secu 1220 20542 84 Avenue (A) 2,443 431 431 1,651 1,65121382200441 Streetlights Parks Walnut Grove Park (So 1220 8937 Walnut Grove Drive 45,660 48,660 49,200 42,660 55,44021382601121 Streetlights Parks James Kennedy Park ( 1220 8995 213 Street 13,448 6,775 15,571 9,22322320330111 Streetlights Parks Aldergrove Park Lights 1220 27155 32 Avenue 23,374 38,057 27,987 26,387 34,23800000329514 Streetlights Traffic Traffic Signals 1220 20002 88 Avenue 12,949 18,000 18,199 18,00000000439754 Streetlights Traffic Traffic Signals 1220 8645 Glover Road 96 1,503 1,710 2,07600000496464 Streetlights Traffic 270 Street Kiosk 1220 Route 1A E/O 270 Street 5,928 5,00300000496494 Streetlights Traffic 273 Street Kiosk 1220 Route 1A at 273 Street 5,392 4,17900000675624 Streetlights Traffic Willoughby PRV Kiosk 1220 20415 82 Avenue 85 744 509 45400001575024 Streetlights Traffic Traffic Signals 1220 20302 64 Avenue 10,728 10,72800003671654 Streetlights Traffic Christmas Lighting 1220 6595 238 Street Kiosk 741 115600003844894 Streetlights Traffic Traffic Signals 1220 1939 264 Street 1,102 162021332101891 Streetlights Traffic Traffic Signals 1220 4400 208 Street 8,760 8,760 8,760 8,76021343250101 Streetlights Traffic 2 Lights 1220 4915 221 Street 2,810 2,179 1,859 1,954 1,47221383200441 Streetlights Traffic Park & Ride 1220 20300 88 Avenue 35,639 28,319 25,690 22,842 18,77321384295911 Streetlights Traffic Wilson Townline Road 1220 23191 96 Avenue 200 480 480 480 48533170021061 Streetlights Overhead Overhead Street Lightin 1701 Overhead Street Lighting 611,207 607,090 601,256 537,287 488,92333170022081 Streetlights Overhead Overhead Street Lightin 1701 Overhead Street Lighting 204,589 209,405 205,698 203,800 204,31033170021051 Streetlights Ornamental Ornamental Street Ligh 1702 Ornamental Street Lighting 1,465,196 1,947,293 2,044,954 1,929,695 2,255,98933170022071 Streetlights Ornamental Ornamental Street Ligh 1702 Ornamental Street Lighting 401,232 549,816 587,902 544,192 656,72400000211684 Streetlights Traffic Traffic Signals 1704 19865 96 Avenue 9,848 9,848 10,417 10,41700000266624 Streetlights Traffic Traffic Signals 1704 9150 200 Street 9,570 9,570 11,484 11,48400000315294 Streetlights Traffic Traffic Signals 1704 20402 96 Avenue 14,103 14,103 4,509 4,50900000329254 Streetlights Traffic Traffic Signals 1704 24000 Fraser Highway 10,739 10,739 11,244 11,244
Updated on: 21JUN2004 A2-2 of A2-7

Table A-2: Township Electricity Consumption (1995, 1999, 2000, 2003 and 2004)
Account Number Acct Closed Date Category Sub-Category Account Description Rate
Code Service Address 1995 1999 2000 2003 2004
(kwh) (kwh) (kwh) (kwh) (kwh)00000329304 Streetlights Traffic Traffic Signals 1704 23200 Fraser Highway 10,660 10,660 11,244 11,24400000329364 Streetlights Traffic Traffic Signals 1704 22200 Fraser Highway 13,859 13,859 15,348 15,34800000329374 Streetlights Traffic Traffic Signals 1704 21600 Fraser Highway 18,187 18,187 15,253 15,25300000329384 Streetlights Traffic Traffic Signals 1704 66 Avenue 200 Street 13,327 13,327 14,424 14,42400000329394 Streetlights Traffic Traffic Signals 1704 200 Street Willowbrook 19,917 19,917 15,768 15,76800000329454 1-Apr-99 Streetlights Traffic Traffic Signals 1704 Route 10 Langley Bypass 2,22700000329474 Streetlights Traffic Traffic Signals 1704 200 Street 64 Avenue 13,386 13,386 17,784 17,78400000329484 Streetlights Traffic Traffic Signals 1704 Glover Road and Jardine Road 383 383 516 51600000329494 Streetlights Traffic Traffic Signals 1704 80 Avenue and 200 Street 14,827 14,827 20,214 20,21400000329504 Streetlights Traffic Traffic Signals 1704 83 Avenue and 200 Street 2,305 2,305 3,142 3,14200000329524 Streetlights Traffic Traffic Signals 1704 68 Avenue and 200 Street 683 683 814 81400000329534 Streetlights Traffic Traffic Signals 1704 70 Avenue and 200 Street 1,366 1,366 1,628 1,62800000329544 Streetlights Traffic Traffic Signals 1704 200 Street and 72 Avenue 13,332 13,332 15,884 15,88400000329574 Streetlights Traffic Traffic Signals 1704 7730 Glover Road 187 187 252 25200000329624 Streetlights Traffic Traffic Signals 1704 Glover Road/88 Avenue 11,453 11,453 12,660 12,66000000330384 Streetlights Traffic Traffic Signals 1704 Route 1A at 276 Street 11,434 11,434 15,360 15,36000000330854 Streetlights Traffic Traffic Signals 1704 Route 1A at 273A Street 5,439 5,439 5,712 5,71200000330894 Streetlights Traffic Traffic Signals 1704 Route 1A at 268 Street 10,413 10,413 6,852 6,85200000330914 Streetlights Traffic Traffic Signals 1704 Route 1A and 248 Street 11,943 11,943 11,244 11,24400000330924 Streetlights Traffic Traffic Signals 1704 24400 Fraser Highway 5,404 5,404 11,952 11,95200000331004 Streetlights Traffic Traffic Signals 1704 Route 1A AT 272 Street 12,393 12,393 15,888 15,88800000333214 Streetlights Traffic Traffic Signals 1704 19600 Fraser Highway 16,025 16,025 21,288 21,28800000412244 Streetlights Traffic Traffic Signals 1704 7202 208 Street 7,592 7,592 12,480 12,48000000429704 Streetlights Traffic Traffic Signals 1704 8002 208 Street 7,626 7,626 12,791 12,79100000589644 Streetlights Traffic Traffic Signals 1704 8999 208 Street 2,387 2,387 4,235 4,23500000666154 Streetlights Traffic Traffic Signals 1704 9155 202 Street 886 886 2,167 2,16700001551514 Streetlights Traffic Traffic Signals 1704 200 Street and 44 Avenue 17,700 17,70000001632684 Streetlights Traffic Traffic Signals 1704 5600 216 Street 19,032 19,03200001940394 Streetlights Traffic Traffic Signals 1704 Fraser Highway E/O 270 Street 4,378 4,37800002007574 Streetlights Traffic Traffic Signals 1704 21099 72 Avenue 600 60000002538424 Streetlights Traffic Traffic Signals 1704 9400 210 Street 3,850 3,85000002818834 Streetlights Traffic Traffic Signals 1704 1600 200 Street 2,319 2,31900002818874 Streetlights Traffic Traffic Signals 1704 1600 208 Street 1,919 1,91900002818894 Streetlights Traffic Traffic Signals 1704 1600 216 Street 1,833 1,83300002818904 Streetlights Traffic Traffic Signals 1704 1600 224 Street 1,833 1,83300002818914 Streetlights Traffic Traffic Signals 1704 1600 232 Street 1,833 1,83300002818924 Streetlights Traffic Traffic Signals 1704 1600 240 Street 1,833 1,83300002840854 Streetlights Traffic Traffic Signals 1704 1600 272 Street 2,364 2,36400002840864 Streetlights Traffic Traffic Signals 1704 1600 256 Street 2,364 2,36400002840874 Streetlights Traffic Traffic Signals 1704 1600 248 Street 2,364 2,36400003051714 Streetlights Traffic Traffic Signals 1704 9475 201 Street 11,308 11,30800003076894 Streetlights Traffic Traffic Signals 1704 20220 64 Avenue 7,260 7,26000003105474 Streetlights Traffic Traffic Signals 1704 27515 Fraser Highway 13,944 13,94400003389814 Streetlights Traffic Pedestrian Signs 1704 3500 200 Street 3,276 3,27600003389834 Streetlights Traffic Pedestrian Signs 1704 20250 36 Avenue 3,276 3,27600003422514 Streetlights Traffic Pedestrian Signal 1704 9010 Glover Road 648 64800003719644 Streetlights Traffic Traffic Signals 1704 88 Avenue / 210 Street 15,183 15,18300003778474 Streetlights Traffic Traffic Signals 1704 6201 204 Street 1,862 1,86200004073984 Streetlights Traffic Traffic Signals 1704 3200 200 Street 604 60400004385464 Streetlights Traffic Traffic Signals 1704 270 Street 32 Avenue 1,788 1,78800004393574 Streetlights Traffic Traffic Signals 1704 19798 Willowbrook Drive 517 517
Updated on: 21JUN2004 A2-3 of A2-7

Table A-2: Township Electricity Consumption (1995, 1999, 2000, 2003 and 2004)
Account Number Acct Closed Date Category Sub-Category Account Description Rate
Code Service Address 1995 1999 2000 2003 2004
(kwh) (kwh) (kwh) (kwh) (kwh)00004404664 Streetlights Traffic Traffic Signals 1704 56 Avenue at 248 Street 28 2821311100081 Streetlights Traffic 4 Way Intersection 1704 2400 200 Street 2,364 2,364 2,364 2,36421312100291 Streetlights Traffic Traffic Signals 1704 3750 208 Street 3,605 8,652 8,652 2,842 2,84221320271121 Streetlights Traffic Traffic Signals 1704 3850 200 Street 3,680 8,832 8,832 10,248 10,24821320401351 Streetlights Traffic Traffic Signals 1704 3600 200 Street 9,305 22,332 22,332 12,348 12,34821322101451 Streetlights Traffic Traffic Signals 1704 4000 208 Street 15,768 15,768 4,418 4,41821330370101 Streetlights Traffic Traffic Signals 1704 4100 200 Street 4,295 10,308 10,308 11,616 11,61621330370611 Streetlights Traffic Traffic Signals 1704 4200 200 Street 4,635 11,124 11,124 11,616 11,61621330371071 Streetlights Traffic Traffic Signals 1704 4000 200 Street 5,015 12,036 12,036 10,920 10,92021350501511 Streetlights Traffic Traffic Signals 1704 19702 64 Avenue 3,130 7,512 7,512 14,136 14,13621350501551 Streetlights Traffic Traffic Signals 1704 19701 Willowbrook Drive 5,596 12,672 12,672 4,112 4,11221361100201 Streetlights Traffic Traffic Signals 1704 20498 64 Avenue 10,512 10,512 10,512 10,51221361100341 Streetlights Traffic Traffic Signals 1704 64 Avenue 200 Street 365 876 876 18,972 18,97221380000381 Streetlights Traffic Traffic Signals 1704 92A Avenue 200 Street 7,090 17,016 17,016 14,424 14,42421380001091 Streetlights Traffic Traffic Signals 1704 9300 Block 200 Street 24,360 24,360 17,364 17,36421380089451 Streetlights Traffic Traffic Signals 1704 96 Avenue 200 Street 5,840 14,016 14,016 10,200 10,20021381100051 Streetlights Traffic Traffic Signals 1704 88 Avenue 204 Street 4,368 13,104 13,104 13,371 13,37121381500061 Streetlights Traffic Traffic Signals 1704 88 Avenue 208 Street 505 1,212 1,212 14,204 14,20421382200021 Streetlights Traffic Traffic Signals 1704 88 Avenue Walnut Grove Drive 6,375 15,300 15,300 12,705 12,70521382200211 Streetlights Traffic Traffic Signals 1704 88 Avenue Walnut Grove Drive 264 528 528 484 48421382200551 Streetlights Traffic Traffic Signals 1704 9055 212 Street 12,264 12,264 3,412 3,41221382600881 Streetlights Traffic Traffic Signals 1704 21479 88 Avenue 438 915 915 915 91521382699131 Streetlights Traffic Traffic Signals 1704 88 Avenue 212 Street 6,515 16,372 16,372 14,803 14,80321382800481 Streetlights Traffic Traffic Signals 1704 8801 216 Street 5,692 17265 17,265 15,653 15,65321391201151 Streetlights Traffic Traffic Signals 1704 20802 96 Avenue 665 15,768 15,768 4,239 4,23921391202441 Streetlights Traffic Traffic Signals 1704 20168 96 Avenue 18,576 18,576 4,905 4,90522314370212 Streetlights Traffic Traffic Signals 1704 Route 1 AT Route 13 10,224 10,224 10,224 10,22422320300021 Streetlights Traffic Traffic Signals 1704 32 Avenue 272 Street 6,288 18,864 18,864 4,755 4,75521372105091 Streetlights Traffic Fire Hall No.4 Outside 1755 20409 80 Avenue 0 0 0 0 702
163404 Water/Sewage Water Aldergrove Water Trea 1200 27540 28 Avenue 338,160 453,840 527,280 643,68000001171074 Water/Sewage ? 1200 5676 272 Street PMP2 25,920 89,640 94,68021311315501 Water/Sewage Water Brookswood Well No.7 1200 20650 32 Avenue 18,560 66,240 132,960 215,200 205,98021312102731 Water/Sewage Water Brookswood Well No.9 1200 20701 32 Avenue 64,200 84,000 169,560 316,680 275,40021320201251 Water/Sewage Water Brookswood Water PR 1200 19620 36 Avenue 48,600 43,080 37,800 54,360 35,64021320203201 Water/Sewage Water Brookswood Water No 1200 19820 36 Avenue 207,040 237,120 236,320 212,800 169,12021320400511 Water/Sewage Water Brookswood Water We 1200 3482 197 Street 87,660 49,902 63,840 5,444 15,58021323280021 Water/Sewage Water Murrayville Well No.1 1200 4451 224 Street 153,985 126,960 214,320 196,560 225,60021335150251 Water/Sewage Water Murrayville Well No.2 1200 22566 Old Yale Road 101,520 144,900 145,620 164,160 203,22021361299011 Water/Sewage Water Water Pump 1200 6795 206 Street 145,620 53,280 3,060 110,520 70,02021371200311 Water/Sewage Water Willoughby Booster Sta 1200 20400 73A Avenue 86,040 72,900 55,620 77,580 68,22021373215001 Water/Sewage Water NWL Well 1200 22709 88 Avenue 797,040 885,600 1,285,920 1,229,400 1,530,00021373400241 Water/Sewage Water NWL Reservoir Station 1200 21212 85 Avenue 336,960 269,760 299,040 313,920 122,64021384451511 Water/Sewage Water Salmon River Pump St 1200 Salmon River West Langley 68,040 256,800 262,560 125,040 141,36021391250181 Water/Sewage Sewage WG Sewer Lift Station 1200 21210 96 Avenue 150,720 233,400 213,360 228,960 277,56021392147611 Water/Sewage Water West Langley Dyke Pu 1200 20461 102B Avenue 61,520 61,200 82,560 62,880 29,28022303303411 Water/Sewage Sewage Aldergrove Sewage Tre 1200 27540 28 Avenue 80,827 257,220 272,700 314,640 333,54022303487652 Water/Sewage Water Aldergrove Water Well 1200 2623 272 Street 293,160 147,360 173,760 221,760 271,92022308353701 Water/Sewage Water Aldergrove Water Rese 1200 3170 262B Street 62,720 51,840 48,000 55,760 48,56022310469502 Water/Sewage Water Water Pump SRU No.1 1200 5800 245A Street 427,320 316,080 59,220 91,260 152,28022315309632 Water/Sewage Water Aldergrove Pump No.7 1200 2520 272 Street 75,840 211,080 154,680 208,560 223,08022315320201 Water/Sewage Water Aldergrove Water Well 1200 27190 25 Avenue 199,980 241,200 174,600 191,520 218,160
Updated on: 21JUN2004 A2-4 of A2-7

Table A-2: Township Electricity Consumption (1995, 1999, 2000, 2003 and 2004)
Account Number Acct Closed Date Category Sub-Category Account Description Rate
Code Service Address 1995 1999 2000 2003 2004
(kwh) (kwh) (kwh) (kwh) (kwh)21312102711 Water/Sewage Water Brookswood Water Res 1220 20771 32 Avenue 13,540 16,576 14,467 15,912 16,40121320400371 Water/Sewage Water Drainage Pump Station 1220 19698 33A Avenue 1,973 12,848 10,290 75 021320449291 Water/Sewage Water Brookswood Water We 1220 3458 200 Street 2,884 3,286 4,595 4,455 6,55721331800011 Water/Sewage Sewage Sewage Lift Station 1220 4353 200A Street 1,855 2,518 2,120 1,618 1,69221335136501 Water/Sewage Sewage Sewage Pump Station 1220 23750 Fraser Highway 228 1,344 1,788 1,597 1,69721342260131 Water/Sewage Sewage Sewer Pump Station 1220 21341 Old Yale Road 193 134 200 192 7421345260401 Water/Sewage Water Acadia Water 1220 4745 242A Street 10,268 11,134 10,732 19,817 21,86621345422452 Water/Sewage Water Tall Timbers Water 1220 23990 58A Avenue 63,140 69,331 29,796 71,535 68,65721352175501 Water/Sewage Sewage West Langley Sewer Li 1220 21200 56 Avenue 107,923 13,549 14,243 13,952 14,04321361100281 Water/Sewage Sewage Sewage Lift Station 1220 20555 62 Avenue 2,467 5,905 3,767 1,249 1,32321361104001 Water/Sewage Sewage Sewer Lift Station 1220 203 Street 62 Avenue 90,720 86,040 83,520 77,040 124,56021361398151 Water/Sewage Sewage Lift Station 1220 6656 Glover Road (Pump) 16,210 19,733 22,989 21,544 20,76921371212251 Water/Sewage Water Willoughby Reservoir W 1220 20450 73A Avenue 4,199 2,513 2,303 1,091 1,00921373200311 Water/Sewage Sewage Lift Station 1220 8395 216 Street 5,704 7,755 7,525 8,477 7,77021381314211 Water/Sewage Sewage Sewer Lift Station 1220 20513 95A Avenue 1,233 1,300 1,510 1,389 1,51121382699231 Water/Sewage Sewage Lift Station 1220 9046 214B Street 6,561 10,071 6,343 13,524 11,32821382800451 Water/Sewage Sewage Lift Station 1220 9001 216 Street 14,940 16,380 12,780 16,740 18,72021384400351 Water/Sewage Sewage Lift Station 1220 23345 Mavis Avenue 29,880 27,480 30,840 29,70021391000131 Water/Sewage Water Valve 1220 19603 96 Avenue 306 230 314 507 50521391000551 Water/Sewage Water Pressure Reducing Val 1220 9620 201 Street 10,026 9,243 5,296 5,124 5,99121392100011 Water/Sewage Sewage Lift Station 1220 9800 208 Street 3,470 2,314 3,945 2,922 2,93621392121002 Water/Sewage Sewage Sewer Lift Station 1220 20452 98 Avenue 16,708 17,873 19,958 18,574 20,45122301313701 Water/Sewage Sewage Sewer Lift Station 1220 27170 28B Avenue 4,811 4,101 6,187 4,893 5,17522301331101 Water/Sewage Water Aldergrove Pump No.3 1220 2800 272 Street 105,704 54,669 110,359 79,662 87,01922310300011 Water/Sewage Water Water Pump SRU No.3 1220 5945 252 Street 18,960 6,960 2,520 1,920 1,20022313428301 Water/Sewage Water Aldergrove Reservoir 1220 Quinton Road W/O 6,946 8,991 8,991 7,384 7,38422314387002 Water/Sewage Sewage Gloucester Sewage Tre 1220 5676 272 Street 291,240 413,880 458,640 14,760 15,00022315309941 Water/Sewage Sewage Sewer Lift Station 1220 26827 24 Avenue 3,944 18,343 16,393 18,215 22,54522315310101 Water/Sewage Sewage Sewer Lift Station 1220 2502 272 Street 2,816 4,106 4,082 4,853 6,19122319454321 Water/Sewage Sewage Sewer Lift Station 1220 26600 28 Avenue 9,208 19,019 15,423 18,588 19,59922320340001 Water/Sewage Water Aldergrove Well Pump 1220 3201 272 Street 20,248 6,915 32,931 87,177 91,285
24-Nov-96 Water/Sewage Sewage North West Langley Sewage Treat 201 Street 102B Avenue NW 2,594,8805-Dec-97 Water/Sewage Sewage Aldergrove Sewage Treatment Pla 27540 28 Avenue 868,80022-Mar-95 Water/Sewage Water West Langley Pump Dyke Station 20461 102B Avenue 18,380
Updated on: 21JUN2004 A2-5 of A2-7

Table A-2: Township Electricity Consumption (1995, 1999, 2000, 2003 and 2004)
Account Number Acct Closed Date Category Sub-Category Account Description Rate
Code Service Address 1995 1999 2000 2003 2004
(kwh) (kwh) (kwh) (kwh) (kwh)
Legend Summary 1995 1999 2000 2003 2004
No data - account wasn't active Consumption by: (kwh) (kwh) (kwh) (kwh) (kwh)Total 18,906,305 17,841,531 20,850,660 20,663,960 21,835,457
Account data not found, previous year data used.Buildings 8,120,468 8,524,630 10,929,889 10,667,128 10,859,940
Direct copy from previous year. Street Lights 2,998,000 4,291,878 4,414,024 4,417,282 4,987,039Water/Sewage 7,787,837 5,025,023 5,506,747 5,579,550 5,988,478
Updated on: 21JUN2004 A2-6 of A2-7
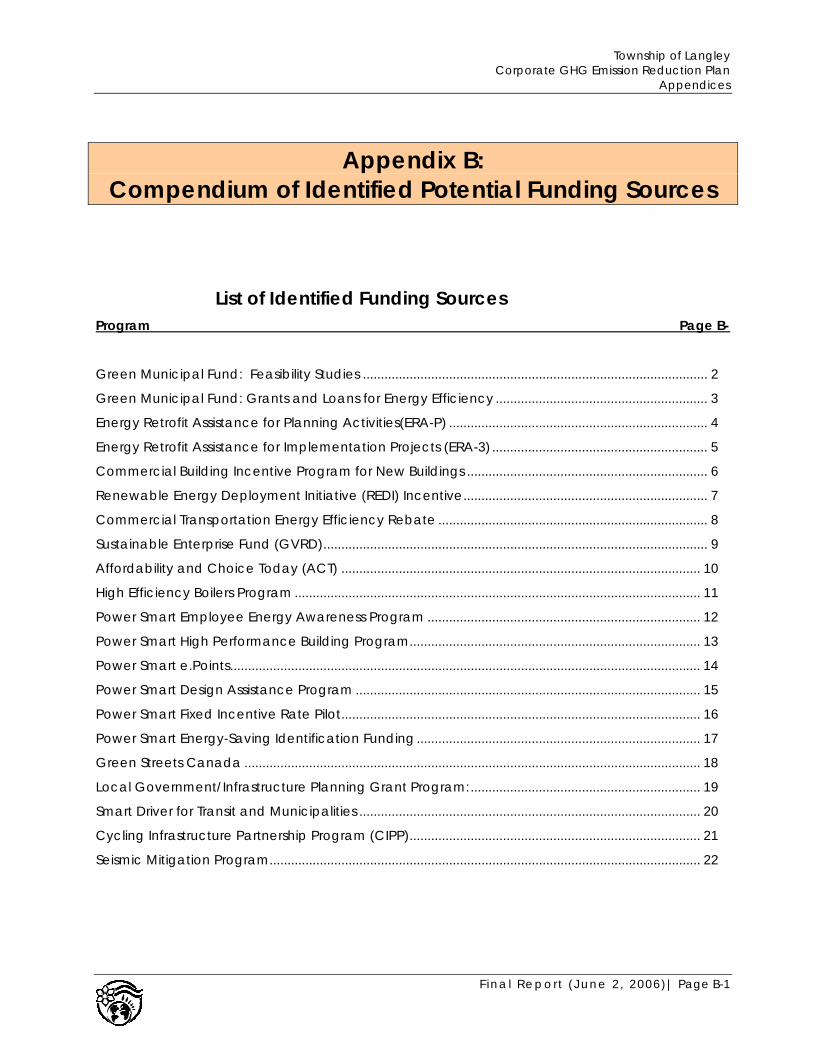
Township of Langley Corporate GHG Emission Reduction Plan
Appendices
Appendix B: Compendium of Identified Potential Funding Sources
List of Identified Funding Sources Program Page B-
Green Municipal Fund: Feasibility Studies ................................................................................................ 2 Green Municipal Fund: Grants and Loans for Energy Efficiency ........................................................... 3 Energy Retrofit Assistance for Planning Activities(ERA-P) ........................................................................ 4 Energy Retrofit Assistance for Implementation Projects (ERA-3) ............................................................ 5 Commercial Building Incentive Program for New Buildings ................................................................... 6 Renewable Energy Deployment Initiative (REDI) Incentive.................................................................... 7 Commercial Transportation Energy Efficiency Rebate ........................................................................... 8 Sustainable Enterprise Fund (GVRD)........................................................................................................... 9 Affordability and Choice Today (ACT) .................................................................................................... 10 High Efficiency Boilers Program ................................................................................................................. 11 Power Smart Employee Energy Awareness Program ............................................................................ 12 Power Smart High Performance Building Program................................................................................. 13 Power Smart e.Points................................................................................................................................... 14 Power Smart Design Assistance Program ................................................................................................ 15 Power Smart Fixed Incentive Rate Pilot.................................................................................................... 16 Power Smart Energy-Saving Identification Funding ............................................................................... 17 Green Streets Canada ............................................................................................................................... 18 Local Government/Infrastructure Planning Grant Program:................................................................ 19 Smart Driver for Transit and Municipalities ............................................................................................... 20 Cycling Infrastructure Partnership Program (CIPP)................................................................................. 21 Seismic Mitigation Program........................................................................................................................ 22
F inal Report (June 2, 2006)| Page B-1

Township of Langley Corporate GHG Emission Reduction Plan
Appendices
Green Municipal Fund: Feasibility Studies
Grants for feasibility studies, field tests, and sustainable community plans: Federation of Canadian Municipalities (FCM) Funding Agency Federation of Canadian Municipalities Description The FCM will accept applications for grants for feasibility studies, field tests, and sustainable community plans in all GMF categories on a continuous basis. The three categories are listed in more detail below: Feasibility Study – An assessment of the technical, environmental, and/or economic feasibility of a capital project. A feasibility study may include reviewing the current system or situation, identifying requirements for a proposed capital project, or studying the effects or financing options associated with implementing a capital project. Field Test – A test of a potential capital project’s performance under the conditions in which it will operate. For example, a field test may assess a small-scale installation of a new system or technology to determine the implications of installing the system or technology on a larger scale. Sustainable Community Plan – An initiative that demonstrates an integrated, systems approach to addressing community-wide energy and environmental management objectives. Plans may include (but are not limited to) integrated planning (land-use, transportation, and energy), community and corporate greenhouse gas reduction plans, watershed management, brownfield redevelopment, and community-scale developments. Funding will be divided into two streams: • Stream A: Energy efficiency retrofits to municipal buildings, or the construction of new energy
efficient municipal buildings • Stream B: New renewable energy supply projects and energy distribution systems. Amount of Funding Available Up to $350 000. The funding option available to applicants for feasibility studies, field tests and sustainable community plans is a grant of up to 50% of the Total Eligible Costs to a maximum of $350,000. Deadline for Application FCM is accepting applications on a continuous basis. Website The Green Municipal Fund website is located at the following address: <http://www.sustainablecommunities.ca/GMF/About/> Contact Information (name, phone number, email address) Simona Birea, Application Co-ordinator, Green Municipal Fund Phone: (613) 241-5221, ext. 238; Fax: (613) 244-1515; email: [email protected]
F inal Report (June 2, 2006)| Page B-2

Township of Langley Corporate GHG Emission Reduction Plan
Appendices
Green Municipal Fund: Grants and Loans for Energy Efficiency
Federation of Canadian Municipalities (FCM) Funding Agency Federation of Canadian Municipalities (FCM) Description The FCM has implemented a long-term, sustainable source of low interest rate loans and grants for municipal governments and their partners to support environmental projects in the following six categories: • Energy • Waste • Water • Sustainable Transportation • Brownfield Remediation, and • Integrated Community Planning. Annual funding caps have been established limiting the number of projects that will be supported each year. The eligibility criteria are available at: http://kn.fcm.ca/ev.php?URL_ID=5817&URL_DO=DO_TOPIC&URL_SECTION=201&reload=1142543179 Amount of Funding Available The amount varies. Through the Energy RFP process, GMF will award funds totalling approximately $20 million in low interest rate loans and $2 million in grants for ready to implement projects. Deadline for Application The application deadline is different for each of the six categories. The following table outlines the 2006 deadlines and total FCM funds available:
RFP Sector RFP Launch Date
Intent to Apply Closure Date
RFP Closure Date
Loan Funds Available
Grant Funds Available
Energy 8-Feb-06 1-Mar-06 12-Apr-06 $20 million $2 million
Waste 5-Apr-06 26-Apr-06 7-Jun-06 $10 million $2.5 million
Brownfields 10-May-06 31-May-06 12-Jul-06 $20 million 0 Water 30-Aug-06 20-Sep-06 1-Nov-06 $10 million $3.5 million
Transportation 30-Aug-06 20-Sep-06 1-Nov-06 $10 million $2 million
Totals $70 million $10 million Website http://www.sustainablecommunities.ca/GMF/GMF_Request_for_Proposals.asp Contact Information (name, phone number, email address) Simona Birea, Application Co-ordinator, Green Municipal Fund Phone: (613) 241-5221, ext. 238; Fax: (613) 244-1515; E-mail: [email protected]
F inal Report (June 2, 2006)| Page B-3

Township of Langley Corporate GHG Emission Reduction Plan
Appendices
Energy Retrofit Assistance for Planning Activities (ERA-P)
EnerGuide for Existing Buildings – Natural Resources Canada
Funding Agency Natural Resources Canada Description NRCan can help with Energy Retrofit Assistance funding for planning projects in commercial and institutional buildings, or ERA (P). Funding can be used to accomplish one or more of the following tasks: • Energy audits that review your consumption and suggest possible savings • Feasibility studies that thoroughly analyze potential savings from specific measures • Energy management plans that set a long-term and measurable path for your entire organization • Other project development and facilitation measures that can lead to energy savings • Technologies and equipment that are innovative or that use renewable energy should be
considered. Amount of Funding Available Maximum of $25,000. If considering an energy retrofit planning project, EEB members could receive up to 50 percent of eligible costs or up to $1 per gigajoule (1 GJ = 277.8 equivalent kilowatt hours) of annual energy consumption in the affected buildings – whichever amount is less – to a maximum of $25,000. Deadline for Application Funding is on a first come, first served basis. Requirements and Additional Information The municipality must become an EEB member and or an EII member to apply for funding. Projects with signed contracts or where work has already started are not eligible for funding. You will require an experienced energy professional for your project. The service provider you choose should be an accredited Certified Engineering Technologist or Professional Engineer (P.Eng.). Website http://oee.nrcan.gc.ca/publications/infosource/pub/ici/eii/pdf/m27-01-1726E.pdf Contact Information (name, phone number, email address) Buildings Division, Office of Energy Efficiency, Natural Resources Canada Phone: 1 877 360-5500, Fax: (613) 947-4121, Email: [email protected]
F inal Report (June 2, 2006)| Page B-4

Township of Langley Corporate GHG Emission Reduction Plan
Appendices
Energy Retrofit Assistance for Implementation Projects (ERA-3)
EnerGuide for Existing Buildings – Natural Resources Canada
Funding Agency Natural Resources Canada Description NRCan can help with your business, institution or other eligible organizations by providing Energy Retrofit Assistance, also known as ERA (3), funding for your project's development, management, materials, labour, monitoring and tracking, staff training, awareness and for other retrofit implementation projects in your existing buildings. Measures for efficient lighting, the building envelope, motors, controls, heating, ventilating, air conditioning and other energy-saving projects may be eligible. Amount of Funding Available Maximum of $250,000. If considering an energy retrofit project, EII members could receive up to $7.50 per gigajoule (1 GJ = 277.8 equivalent kilowatt hours) of annual energy savings or up to 25 percent of eligible costs – whichever amount is less – to a maximum of $250,000. Requirements and Additional Information The municipality must become an EEB member and or a EII member to apply for funding. Most industrial, federal government and new facilities are not eligible. Energy consultants, contractors and utilities cannot receive funding but can work with the EII as allies. Deadline for Application Accepting applications on a continuous basis. Website The Energuide for Existing Buildings website is located at the following address: http://oee.nrcan.gc.ca/publications/infosource/pub/ici/eii/pdf/m27-01-1725E.pdf Contact Information (name, phone number, email address) Buildings Division, Office of Energy Efficiency, Natural Resources Canada Phone: 1 877 360-5500, Fax: (613) 947-4121, Email: [email protected]
F inal Report (June 2, 2006)| Page B-5

Township of Langley Corporate GHG Emission Reduction Plan
Appendices
Commercial Building Incentive Program for New Buildings
Natural Resources Canada
Funding Agency Natural Resources Canada Description Natural Resources Canada's Office of Energy Efficiency encourages the design and construction of new, energy-efficient commercial, institutional and multi-unit residential buildings and facilities. The Commercial Building Incentive Program (CBIP) provides design assistance and funding for eligible organizations based on building energy savings. Amount of Funding Available • $1000 – An expression of interest form is filled out and a letter with a project number is sent to the
building owner and simulator. This project number entitles you to technical support valued at $1,000 • Up to $60 000 - CBIP helps offset the extra cost of designing energy-efficient buildings. The incentive
for a building that meets CBIP criteria is calculated as a one-time financial incentive equal to twice the difference between the estimated annual energy costs if the building were constructed to the MNECB standard, to a maximum of $60,000 or the total design costs, whichever is less.
• Up to $250 000 - The approved funding offers to building owners CBIP funding for up to six projects, or
a maximum of $250,000 (whichever comes first). In cases where a single building design is replicated multiple times, the total amount of funding cannot exceed the total cost of the original design plus any modifications required to adjust the design to different sites.
Requirements and Additional Information A database of CBIP funded projects are located at the following address: http://oee.nrcan.gc.ca/commercial/financial-assistance/new-buildings/recipients.cfm?attr=20 See the BC Hydro Power Smart Design Assistance Program section of this database for assistance on applying for CBIP funding. Deadline for Application Accepting applications on a continuous basis. Website The CBIP website is located at the following address: http://oee.nrcan.gc.ca/commercial/financial-assistance/new-buildings/how-cbip-works.cfm?attr=20 Contact Information (name, phone number, email address)
Buildings Division, Office of Energy Efficiency, Natural Resources Canada Phone: 1 877 360-5500, Fax: (613) 947-4121, Email: [email protected]
F inal Report (June 2, 2006)| Page B-6

Township of Langley Corporate GHG Emission Reduction Plan
Appendices
Renewable Energy Deployment Initiative (REDI) Incentive
Natural Resources Canada Funding Agency Natural Resources Canada Description Under REDI, NRCan encourages the private sector, federal departments and public institutions to gain experience with active solar and efficient biomass combustion systems. REDI is a 9-year, $51 million program designed to stimulate the demand for renewable energy systems for water heating, space heating and industrial process heating. These systems include: • active solar water heating systems; • active solar air heating systems; or • high efficiency/low emissions biomass combustion systems of between 75kW and 2MW capacity. Amount of Funding Available Maximums of $80,000 and $250,000. Corporations are eligible for a refund of 25 percent of the purchase, installation and certain other costs of a qualifying system, to a maximum refund of $80,000 per installation and a maximum of $250,000 per corporate entity. Some incentives are also provided on a pilot project basis. Deadline for Application Accepting applications on a continuous basis. Requirements and Additional Information REDI eligibility criteria are available at: http://www2.nrcan.gc.ca/es/erb/erb/english/View.asp?x=656 Website The REDI website is located at the following address: http://www2.nrcan.gc.ca/es/erb/erb/english/View.asp?x=455 Contact Information (name, phone number, email address) Maureen McCloskey, REDI Coordinator Electricity Resources Branch, Natural Resources Canada Tel: 1-877-722-6600, Fax: (613) 995-0087 Email: [email protected]
F inal Report (June 2, 2006)| Page B-7

Township of Langley Corporate GHG Emission Reduction Plan
Appendices
Commercial Transportation Energy Efficiency Rebate
Fleet Smart - Natural Resources Canada Funding Agency Fleet Smart - Natural Resources Canada Description Rebate for Fuel Efficient Devices. FleetSmart Program helps fleet owners and operators in all sectors to improve energy efficiency and reduce fuel costs. Funds have been allocated to pay a rebate for the installation of pre-qualified equipment that provides truck cab or bus-interior heating and/or cooling. Amount of Funding Available Not listed. Requirements and Additional Information To ensure that a reasonable amount of GHG emissions are eliminated for the expenditure of public money, the rebate is limited to eligible Class 6, 7 and 8 diesel-powered trucks and buses licensed for commercial on-road service in Canada. Deadline for Application Accepting applications on a continuous basis. Website http://oee.nrcan.gc.ca/transportation/pdf/efficiency-rebate.pdf Contact Information (name, phone number, email address) FleetSmart, Natural Resources Canada Madeleine Middleton Tel: (613) 947-8381, Email: [email protected]
F inal Report (June 2, 2006)| Page B-8

Township of Langley Corporate GHG Emission Reduction Plan
Appendices
Sustainable Enterprise Fund (GVRD) Funding Agency Greater Vancouver Regional District Description The Sustainable Enterprise fund offers GVRD member municipalities an opportunity to invest in sustainability projects that require additional incentive to overcome technical or financial risks. The intent of the fund is to complement municipal, provincial and federal funding sources for projects that utilize technology established elsewhere but is new to the region, or adapt best practices to conditions specific to the region. The focus is on improving sustainability in parks, housing, air quality and energy management, drinking water supply and treatment, wastewater conveyance and treatment, storm water management and solid waste management. Amount of Funding Available A maximum contribution guideline of $25,000 covers up to 1/3 of costs for projects that derive regional benefits, and 10% of costs for projects that focus on single municipal sustainability issues. The SEF provides $125,000 annually for innovative municipal projects and is limited to: · projects with regional benefits: up to 1/3 of the total eligible costs with a guideline maximum of $25,000, or · projects that advance sustainability within one municipality, and may not yield results that are applicable across the region: up to 10% of the total eligible costs with a guideline maximum of $10,000. Requirements and Additional Information Open to the public. Canada Post used a similar program that was very successful. Website http://www.ghgactionguide.ca/actions/resources.php?id=221 and go to: http://www.gvrd.bc.ca/board/archive/agendas/gvrd/mayregular/4.1.pdf for a list of 2005 funded projects. Contact Information (name, phone number, email address) Shelley Jackson Office Manager, Corporate Strategies, GVRD T: (604) 436-6856, E: [email protected]
F inal Report (June 2, 2006)| Page B-9

Township of Langley Corporate GHG Emission Reduction Plan
Appendices
Affordability and Choice Today (ACT)
FCM and CMHC Funding Agency Federation of Canadian Municipalities (FCM) and the Canadian Mortgage and Housing Corporation Description Grants are available for regulatory reform projects of relatively short duration, for example from 6 to 12 months. Grants may be used to help initiate or promote regulatory reform in your community. Projects should entail a specific activity or product such as a workshop, forum, open house, survey, background report or promotional material. ACT may award less than the amount requested. ACT grant initiatives can generally be grouped into three categories: 1. Obtain input and direction on regulatory reform initiatives — This can include streamlining approvals. Involves consultations with stakeholders (may include the public), surveys, workshops or other methods, with the deliverable being a strategy document or other report. 2. Facilitate local implementation or uptake of regulatory changes already introduced through information sessions, marketing communication materials or some form of promotional effort. 3. Advance efforts to overcome specific regulatory barriers or NIMBY through workshops, surveys or other means of actively engaging stakeholders. Amount of Funding Available Up to $5,000. Requirements and Additional Information Deadline is April 21, 2006 Website http://www.actprogram.com Contact Information (name, phone number, email address) Sharon Margison, Project Officer ACT, The Federation of Canadian Municipalities Telephone: (613) 241-5221 ext.242, Fax: (613) 244-1515 Email: [email protected]
F inal Report (June 2, 2006)| Page B-10

Township of Langley Corporate GHG Emission Reduction Plan
Appendices
High Efficiency Boilers Program Funding Agency Terasen Gas Description The Power Smart Awareness Program has been designed to help create a successful energy awareness program for a company. Tools that are provided to facilitate the process include posters, tips and sample wording to sell the idea to senior management. A detailed step-by-step "Keys to Success" outline is available as a helpful guide. Amount of Funding Available For all participants, the purchase price incentive applies to the incremental purchase price of a natural gas near-condensing or condensing boiler over the purchase price of a standard-efficiency boiler. Purchase price incentives are based upon space-heating and ventilating load. They will be calculated as follows: near-condensing boilers - $4,000 per boiler plus $2 per MBH plant input condensing boilers - $4,000 per boiler plus $6 per MBH plant input The purchase price of a standard-efficiency boiler will be estimated using $7 per MBH of the input required to meet the space-heating load and ventilating load. In new construction, we will contribute 50 per cent of the engineering fees to a maximum of $1,500 that pertain to estimating the annual gas usage for space heating using a standard-efficiency boiler system versus a higher-efficiency boiler system. Purchase price incentive payments are limited to a maximum of 75 per cent of the purchase price premium over a standard-efficiency boiler. In replacement projects, we will pay your contractor up to a maximum of $400 for performing an estimate of the peak space-heating load. The program will pay 50 per cent of the cost of necessary venting modifications up to a maximum of $2,000. The program will also pay a monitoring incentive of $1,500 during the first year of operation plus $1 per gigajoule of total natural gas saved. Purchase price incentive payments are limited to a maximum of 50 per cent of the purchase price premium over a standard-efficiency boiler. Requirements and Additional Information See the following website for a more detailed list of terms and eligibility criteria: http://www.terasengas.com/NR/rdonlyres/esh54rwls2wjpu4ydqxpmwvdmraaoymeo3oqyfnrqfcsg3v75f574cvajlbkbelims3rdl4xdmea673yikpxevsav6g/ebp_TermsandConditions.pdf Website http://www.terasengas.com/Promotions/Current+Promotions/_EfficientBoilerProgram.htm Contact Information (name, phone number, email address) Gary Way or Greg Morandini (Technical) T: 1-888-477-0777 F: 1-604-576-7122, E: [email protected] Efficient Boiler Program, Commercial Energy Services
F inal Report (June 2, 2006)| Page B-11

Township of Langley Corporate GHG Emission Reduction Plan
Appendices
Power Smart Employee Energy Awareness Program Funding Agency BC Hydro Description The Power Smart Awareness Program has been designed to help create a successful energy awareness program for a company. Tools that are provided to facilitate the process include posters, tips and sample wording to sell the idea to senior management. A detailed step-by-step "Keys to Success" outline is available as a helpful guide. Amount of Funding Available None. Offers awareness and education Requirements and Additional Information Open to the public. Canada Post used a similar program that was very successful. Website http://www.bchydro.bc.ca/business/investigate/investigate882.html Contact Information (name, phone number, email address) Dina Matterson, Key Account Manager for the Township of Langley BC Hydro Power Smart, Business T: (604) 453-6225, E: [email protected]
F inal Report (June 2, 2006)| Page B-12

Township of Langley Corporate GHG Emission Reduction Plan
Appendices
Power Smart High Performance Building Program Funding Agency BC Hydro Description The High Performance Building Program provides financial incentives and tools to help qualified projects: Identify energy saving strategies early in the design process; Evaluate alternative design options and make a business case for the high-performance design; Offset the incremental costs, if any, of the energy-efficient measures in the high-performance design; and Market the project's high-performance design features and benefits. Amount of Funding Available Does not specify. BC Hydro assists through the two phases of the High Performance Building Program: BC Hydro will co-fund an energy study to develop a high-performance design that delivers energy savings compared with a conventional building design. If the energy efficiency measures in the high-performance design involve added costs, then BC Hydro may also provide incentives to help qualified projects implement the improved design, based on the amount of savings the building will achieve. Requirements and Additional Information The High Performance Building Program is for large new projects that are: At least 50,000 square feet; or Electricity-intense facilities such as arenas, refrigerated warehouses or grocery stores. Website http://www.bchydro.com/business/identify/identify24037.html Contact Information (name, phone number, email address) Dina Matterson, Key Account Manager for the Township of Langley BC Hydro Power Smart, Business T: (604) 453-6225, E: [email protected]
F inal Report (June 2, 2006)| Page B-13

Township of Langley Corporate GHG Emission Reduction Plan
Appendices
Power Smart e.Points Funding Agency BC Hydro Description Power Smart Partners have made a commitment to improving the electrical energy efficiency of their organization. Partners who improve their company-wide electrical efficiency by 5% or more can earn e.Points. Amount of Funding Available Every e.Point you earn has a value of one dollar, which can then be redeemed towards a BC Hydro approved electrical energy-saving capital project. Requirements and Additional Information e.Points are available to all Power Smart Partners and there are no fees or charges to enroll. Website http://www.bchydro.com/business/pspartner/pspartner1020.html Contact Information (name, phone number, email address) Dina Matterson, Key Account Manager for the Township of Langley BC Hydro Power Smart, Business T: (604) 453-6225, E: [email protected]
F inal Report (June 2, 2006)| Page B-14

Township of Langley Corporate GHG Emission Reduction Plan
Appendices
Power Smart Design Assistance Program Funding Agency BC Hydro Description BC Hydro's Design Assistance program helps you plan and design a cost effective and energy-efficient building that will result in lower operating and capital costs. We'll work with your design team to explore opportunities to optimize building systems at the very early stages of your building project. We'll also help in the development of higher energy efficiency standards, so you can take advantage of financial incentives, offered by Natural Resources Canada's Commercial Building Incentive Program (CBIP). Design Assistance brings the experience and expertise of our energy experts to work alongside your design team. We'll help your team evaluate your building's energy use and advise on the energy impact of design alternatives. Using our state-of-the-art Building Energy Simulation Tool (BEST), we'll provide instant feedback on the quantifiable benefits and costs of various design options, ensuring a more efficient, comfortable and marketable building. Energy Performance Workshop: First we prepare a base energy simulation model of your design. Then, in a workshop setting, your design team works with the model to determine how your design alternatives will affect: Building performance, Mechanical and electrical equipment sizing, Energy costs, Capital costs, Payback period, eligibility for the Commercial Building Incentive Program (CBIP) from Natural Resources Canada. We'll complete the CBIP application or prepare a summary report that compares the energy cost of the initial design with your design alternatives. Commercial Building Incentive Program Facilitation: If you think your building design is already energy efficient, BC Hydro can help the Township of Langley take advantage of the Commercial Building Incentive Program (CBIP) offered by Natural Resources Canada. CBIP offers a financial incentive to invest in energy-efficient building design and construction. To qualify, building owners and developers must use an energy model to show that they are at least 25% more energy efficient than the Model National Energy Code for Buildings. Amount of Funding Available No direct monetary funding. BC Hydro staff and BEST tool are provided. Website http://www.bchydro.com/business/facilities/facilities1005.html Contact Information (name, phone number, email address) Dina Matterson, Key Account Manager for the Township of Langley BC Hydro Power Smart, Business T: (604) 453-6225, E: [email protected]
F inal Report (June 2, 2006)| Page B-15

Township of Langley Corporate GHG Emission Reduction Plan
Appendices
Power Smart Fixed Incentive Rate Pilot Funding Agency BC Hydro Description Power Smart Partners have access to an Incentive Fund to help them implement energy efficiency projects. This fund can help reduce the pay-back period for energy efficiency projects, enabling Partners to implement energy-saving measures that previously would not have met internal funding requirements. Amount of Funding Available The project incentive awarded by BC Hydro will be based on an evaluation of the total amount of energy savings associated with the project, multiplied by the established fixed incentive rate of 1.7 cents/kWh. Requirements and Additional Information Currently there are no calls for more proposals. The Township of Langley’s key account manager will be able to provide more information on when calls for proposals will be active again. Website http://www.bchydro.com/business/pspartner/pspartner1017.html Contact Information (name, phone number, email address) Dina Matterson, Key Account Manager for the Township of Langley BC Hydro Power Smart, Business T: (604) 453-6225, E: [email protected]
F inal Report (June 2, 2006)| Page B-16

Township of Langley Corporate GHG Emission Reduction Plan
Appendices
Power Smart Energy-Saving Identification Funding
Funding Agency BC Hydro Description Power Smart Partners have access to matching funds to identify electrical energy-saving opportunities. Depending on the type of facility, funds may be used towards: - hiring an energy manager - conducting an electrical energy study - obtaining design assistance for new buildings - building recommissioning for existing buildings - securing an energy performance contract. Amount of Funding Available Unspecified. Depending on the type of facility, funds may be used towards: hiring an energy manager, conducting an electrical energy study, or securing an energy performance contract. Requirements and Additional Information Your organization can become a Power Smart Partner if you have spent at least $50,000 on electricity in the last year, and you are willing to: commit to improving your organization's overall electrical energy efficiency, provide funds that match those provided by BC Hydro to identify energy-saving opportunities (schools, universities, colleges and hospitals do not require matching funds) sign our Power Smart Partner Program agreement outlining your commitment, your targets and the personnel who will be responsible for carrying out the plan. Website http://www.bchydro.com/business/pspartner/pspartner1014.html Contact Information (name, phone number, email address) Dina Matterson, Key Account Manager for the Township of Langley BC Hydro Power Smart, Business T: (604) 453-6225, E: [email protected]
F inal Report (June 2, 2006)| Page B-17
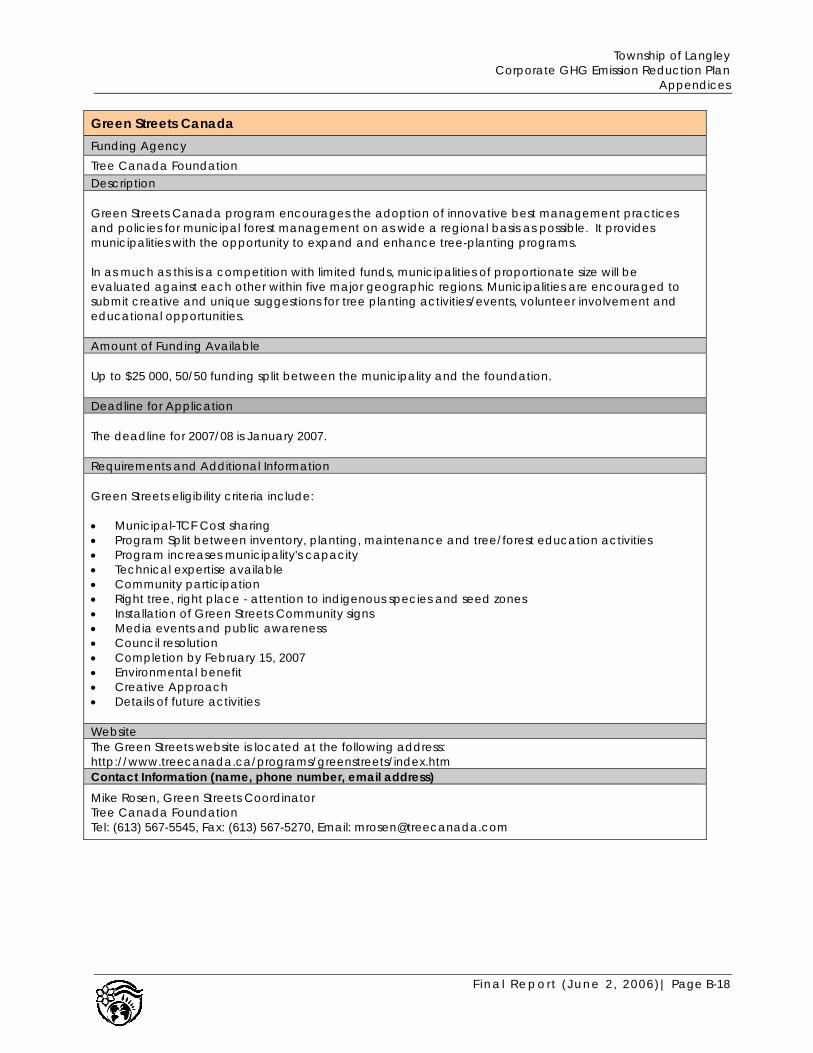
Township of Langley Corporate GHG Emission Reduction Plan
Appendices
Green Streets Canada Funding Agency Tree Canada Foundation Description Green Streets Canada program encourages the adoption of innovative best management practices and policies for municipal forest management on as wide a regional basis as possible. It provides municipalities with the opportunity to expand and enhance tree-planting programs. In as much as this is a competition with limited funds, municipalities of proportionate size will be evaluated against each other within five major geographic regions. Municipalities are encouraged to submit creative and unique suggestions for tree planting activities/events, volunteer involvement and educational opportunities. Amount of Funding Available Up to $25 000, 50/50 funding split between the municipality and the foundation. Deadline for Application The deadline for 2007/08 is January 2007. Requirements and Additional Information Green Streets eligibility criteria include: • Municipal-TCF Cost sharing • Program Split between inventory, planting, maintenance and tree/forest education activities • Program increases municipality's capacity • Technical expertise available • Community participation • Right tree, right place - attention to indigenous species and seed zones • Installation of Green Streets Community signs • Media events and public awareness • Council resolution • Completion by February 15, 2007 • Environmental benefit • Creative Approach • Details of future activities Website The Green Streets website is located at the following address: http://www.treecanada.ca/programs/greenstreets/index.htm Contact Information (name, phone number, email address) Mike Rosen, Green Streets Coordinator Tree Canada Foundation Tel: (613) 567-5545, Fax: (613) 567-5270, Email: [email protected]
F inal Report (June 2, 2006)| Page B-18

Township of Langley Corporate GHG Emission Reduction Plan
Appendices
Local Government/Infrastructure Planning Grant Program: Funding Agency BC Ministry of Community Services Description The Program supports a range of initiatives related to improving water, sewer, drainage and other environmental infrastructure. Eligible projects are those that promote sustainable municipal infrastructure including, but not limited to: Plans: • Capital Asset Management Plans • Liquid Waste Management Plans • Integrated Stormwater Management Plans • Community Energy Plans • Water Conservation Plans • Water Master Plans • Watershed Management Plans • Community Groundwater Management Plans Studies : • Infrastructure assessments to determine system condition • Economic evaluations of universal metering and conservation rate structures • Water audits and development of water demand management strategies • Low impact development technologies and green building design evaluations • Engineering studies of onsite/decentralized wastewater treatment • Innovative pilot projects and capacity building programs • Wastewater reclamation and water reuse studies • Pre-design or feasibility studies to determine the most cost-effective or appropriate way of correcting a specific infrastructure problem Amount of Funding Available Up to $10,000. Requirements and Additional Information Website http://www.mcaws.gov.bc.ca/LGD/pol_research/LGGP06_Guide.pdf Contact Information (name, phone number, email address) Chris Jensen Ministry of Community Services Tel: (250) 356-0700 Email: [email protected]
F inal Report (June 2, 2006)| Page B-19

Township of Langley Corporate GHG Emission Reduction Plan
Appendices
Smart Driver for Transit and Municipalities (SmartDriver by FleetSmart) Funding Agency Natural Resources Canada Description The FleetSmart Program from Natural Resources Canada’s Office of Energy Efficiency has helped fleet operations and owner-operators reduce operating costs through increased energy efficiency. From our modest beginning, we have grown and now reach eight vehicle groups: • highway trucking • forestry trucking • motor coach • transit • school buses • municipalities and utilities • light duty fleets (i.e., passenger car, minivan, pickups, vans, SUVs) • urban trucking Amount of Funding Available Education and Outreach about emission reduction and efficient driving techniques. Requirements and Additional Information The Smart Driver program will be rolling out a municipal program within the year. The program will specifically target municipal fleet vehicles. Website http://oee.nrcan.gc.ca/transportation/fleetsmart.cfm Contact Information (name, phone number, email address) Richard Parfett (Municipal FleetSmart Rep) Office of Energy Efficiency, NRCan Tel: (613) 944-5126, Email: [email protected] or Darin Bagshaw (FleetSmart Program manager) FleetSmart, NRCan Tel: (613) 947-0236, Email: [email protected]
F inal Report (June 2, 2006)| Page B-20
Township of Langley Corporate GHG Emission Reduction Plan
Appendices
Cycling Infrastructure Partnership Program (CIPP) Funding Agency Ministry of Transportation, BC Government Description The CIPP is a cost-shared program where the Government of British Columbia will partner with local governments in the construction of new transportation cycling infrastructure. The goal of the program is to promote transportation cycling (cycling to work, school, or errands) as a means of reducing traffic congestion and green house gas (GHG) emissions. A bicycle network plan is required in which bicycle routes, pathways and other infrastructure are integrated with the municipal and regional roadway network, pathways, park systems and transit services. The bicycle network plan should include: On-street routes, which might include signed routes on local streets, wide curb lanes and bicycle lanes on collector roads and arterial roads and "enhanced" bikeways along local streets paralleling arterial roads; Off-street pathways and trails. Generally these would be multi-use pathways shared with pedestrians, runners, equestrians and in-line skaters; Other bicycle infrastructure, such as access ramps to bridges, underpasses and overpasses, bicycle-only traffic barriers, etc. and; A strategy to minimize conflict between cyclists and motorists, particularly on commuter routes that are heavily congested. The bicycle network plan should accommodate transportation cyclists, who travel by bicycle to work, school and errands. Additionally, the bicycle network plan may accommodate recreational cyclists. The bicycle network should provide direct access for cyclists to major destinations within a municipality or regional district as well as connections to regional and provincial bicycle routes. Examples of major destinations include schools, commercial and office centres, intermodal transportation centres and recreational areas. Amount of Funding Available All British Columbia municipalities and regional districts are eligible to apply for up to $250,000 in CIPP funding. Deadline for Application January 31, 2006. Funding is approved each year. Website http://oee.nrcan.gc.ca/transportation/fleetsmart.cfm Contact Information (name, phone number, email address) Richard Parfett (Municipal FleetSmart Rep) Tel: (613) 944-5126, Email: [email protected] 0R Darin Bagshaw (FleetSmart Program manager) Tel: (613) 947-0236, Email: [email protected]
F inal Report (June 2, 2006)| Page B-21

Township of Langley Corporate GHG Emission Reduction Plan
Appendices
Seismic Mitigation Program Funding Agency Ministry of Education, BC Government Description The Seismic Mitigation Program is administered by the Ministry of Education. It provides incentive funding to promote both the structural and nonstructural seismic upgrade of schools, post-secondary facilities, hospitals and post-disaster facilities in the areas of the province most likely to experience a severe earthquake. Education and Health organizations are requested by the Ministry of Finance to implement seismic upgrades as part of any retrofit/renovation projects. For example, organizations considering a lighting retrofit to reduce energy consumption should consider incorporating into their retrofit project the seismic measure of tying back new or upgraded light fixtures. Langley is currently involved in this program. Amount of Funding Available Does not specify. Deadline for Application Does not specify. Website http://www.bced.gov.bc.ca/capitalplanning/seismic/welcome.htm Contact Information (name, phone number, email address) Email - [email protected]
F inal Report (June 2, 2006)| Page B-22