corporate governance, insider ownership and operating … · 2017-04-13 · tion with an ipo, we...
TRANSCRIPT
Accounting and Finance 44 (2004) 299–328
© AFAANZ, 2004. Published by Blackwell Publishing.
Blackwell Publishing, Ltd.Oxford, UKACFIAccounting and Finance0810-5391AFAANZ, 2004. Published by Blackwell Publishing443Original ArticleM. C. A. Balatbat et al. / Accounting and Finance 44 (2004) 00–00M. C. A. Balatbat et al. / Accounting and Finance 44 (2004) 00–00
Corporate governance, insider ownership and operating performance of Australian initial public offerings
Maria C. A. Balatbat
a
, Stephen L. Taylor
a,c
, Terry S. Walter
b,c
a
School of Accounting and
b
School of Banking and Finance, University of New South Wales, Sydney, 2052, and
c
Capital Markets CRC Ltd, Australia
Abstract
We examine ownership structures and corporate governance attributes of 313Australian initial public offerings (IPOs) between 1976 and 1993 and their rela-tion with up to 5 years of post-listing operating performance, adjusted for sim-ilar (non-IPO) firms. Consistent with prior share price-based evidence, we findthat the operating performance of Australian IPOs typically deteriorates over thefirst 4 post-listing years. Any evidence of a positive association between insiderownership and firm performance is confined to the fourth and fifth years afterthe IPO. Evidence of a positive relation between institutional ownership andperformance is restricted to the latter part of our 5-year post-listing window.Board composition (i.e. outsider versus insider control) is not associated withoperating performance, although there is some evidence that independent boardleadership is associated with better operating performance.
Key words
: Initial public offerings; Operating performance; Corporate governance; Insider ownership
JEL Classification
: G14; G32; G34; M41
Maria Balatbat acknowledges financial support from the R. J. Chambers PhD Scholarshipin Accounting at the University of Sydney. The authors gratefully acknowledge suggestionsby two anonymous referees, as well as comments by Philip Lee, Raymond Da Silva Rosa,David Emanuel and H. Y. Izan, attendees at the 2001 Accounting Association of Australiaand New Zealand Conference, and workshop participants at the following universities:Sydney, New South Wales and Nanyang. We also thank Philip Lee for providing some ofthe data used in the present paper.
Received 8 October 2002; accepted 11 December 2003 by Robert Faff (Editor).

300 M. C. A. Balatbat
et al.
/ Accounting and Finance 44 (2004) 299–328
© AFAANZ, 2004
1. Introduction
We examine ownership and corporate governance attributes of Australian ini-tial public offerings (IPOs) and the extent to which they are related to variationsin the subsequent (i.e. post-listing) operating performance of these firms. FollowingJensen and Meckling (1976), we are interested in the extent to which increasingagency costs brought about by the decline in managerial (i.e. insider) ownershipmay explain the widely documented poor post-listing share price performanceof IPO firms.
1
We are also interested in the extent to which corporate govern-ance attributes such as board composition and leadership can attenuate (or ex-acerbate) any relation between ownership structure and performance. Given thesubstantial changes in ownership and governance that typically occur in conjunc-tion with an IPO, we argue that the results have potentially wider implicationsthan just helping to understand existing share price-based evidence.
The present paper has at least two motivations. First, although there is a con-siderable amount of Australian evidence on post-IPO share returns (Lee
et al.
,1996), there is no systematic evidence of which we are aware that examinesoperating (i.e. accounting-based) performance measures following the IPO.Second, existing US-based evidence is mixed, and has some significant limita-tions that we specifically address in the present study. For example, Jain andKini (1994) suggest that the post-listing decline in operating performance ofUS IPOs that they document is a function of agency problems, but their resultsare based solely on measuring the one-time change in managerial ownershipthat occurs at the time of the IPO. This approach takes no account of furtherchanges in ownership structure in the years following the IPO year. In contrast,Mikkelson
et al.
(1997) measure changes in ownership over a maximum of 10post-listing years, and find no significant association between firm performanceand ownership structure after listing. They suggest that other monitoringdevices such as the board of directors compensate for reduced ownership-basedincentives, but do not attempt to test this explanation for the absence of anyrelation between ownership structure and performance. In contrast, we evaluatethe effect of internal governance mechanisms (i.e. board composition and lead-ership), in addition to ownership structure, on the operating performance ofAustralian IPOs for up to 5 post-listing years.
We show that operating returns of IPO firms appear relatively stable for up to5 years after the IPO, although there is also evidence that these returns are in-creasingly negatively skewed, despite the inherent survivorship bias. When weadjust these operating measures for the performance of non-IPO control firms,we find that IPO firms perform significantly worse than their non-IPO peersonly from the third post-listing year onward. When we compare the listing
1
See Loughran
et al.
(1994) for a summary of international evidence on the poor long-runperformance of IPO firms.

M. C. A. Balatbat
et al.
/ Accounting and Finance 44 (2004) 299–328 301
© AFAANZ, 2004
year performance with each subsequent year, the decline is significant foreach of the second and third post-listing years. Although we do not attempt tomeasure the extent of any earnings management, the evidence is also consistentwith insiders maximizing accounting performance in the periods immediatelyafter the IPO, with surviving firms showing a decline, rather than an improve-ment in performance in future years.
We find that insider ownership declines monotonically over the first 5 post-listing years. However, none of the year-to-year declines are statisticallysignificant, save for the immediate decline at the time of the IPO. When wecontrol for other factors likely to be associated with performance, as well asgovernance attributes, we find that insider ownership is significantly positivelyrelated to operating performance, but only for the fourth and fifth post-listingyears. One interpretation of these results is that the relation between insiderownership and performance only becomes evident after firms with the weakestprospects have already failed. Our results also suggest that institutional owner-ship is weakly positively associated with performance, but there is no evidencethat ownership by outside blockholders has any impact.
Our tests of the relation between post-listing performance and board com-position and leadership yield mixed results. On the one hand, we find noevidence that board composition is associated with variation in operating per-formance. On the other hand, there is evidence that firms with dual leadership(i.e. a separate chief executive officer (CEO) and chairperson) perform betterthan those with a unitary leadership structure, although the results for boardleadership are generally weaker when we control for ownership structure andother factors associated with differences in performance. The contrastingresults for board composition and leadership possibly reflect the peculiarattributes of IPO firms, in that they have far fewer outsider-dominated boardsthan non-IPO firms, but tend to have a dual leadership structure more frequentlythan other firms.
Finally, our results show that firm performance is positively associated withthe length of prior operating history. Although the extent of prior operating his-tory may reflect some degree of conservatism in accounting for start-up entities,it is also consistent with the anecdotal view that established firms that go publicare more likely to be based on a sound business model than start-up firms. Theresult is also consistent with existing share-price based evidence (Lee
et al
.,1996).
The remainder of the present paper proceeds as follows. Section 2 explainsthe data sample and the ownership and corporate governance variables used toanalyse variations in operating performance. A detailed explanation is also pro-vided of the method used to control for expected operating performance byidentifying appropriate, non-IPO control firms. Section 3 provides a summaryof the operating performance, ownership structure and governance attributes forup to 5 years post-listing. Section 4 reports our main findings, while Section 5provides our conclusions.

302 M. C. A. Balatbat
et al.
/ Accounting and Finance 44 (2004) 299–328
© AFAANZ, 2004
2. Data and methods
2.1. Sample IPO firms
Our sample comprises 313 Australian industrial IPOs made between 1 January1976 and 30 June 1993.
2
Figure 1 reports the temporal distribution of our sam-ple IPOs, and demonstrates evidence of clustering, consistent with the idea ofhot and cold issue markets. This has implications for the measurement of post-listing performance, which we discuss in the following section. In additional(unreported) analysis, we find that the industry distribution of these IPOs is con-sistent with the distribution of Australian Stock Exchange (ASX)-listed firms asa whole. Panel A of Table 1 summarizes other characteristics of the offers. Mean(median) market capitalization of IPO firms is $A38m ($A18m), while themean (median) deal size is $A18m ($A7m). Median retained ownership by pre-IPO owners is 55 per cent, which is lower than comparable US studies, despitethe smaller size of Australian IPO firms.
3
On average, Australian IPO firmshave at least 5 years prior operating history. Fewer than one-third of the IPOfirms sampled have little or no prior operating history. Average underpricing forthe sample is 15.5 per cent, similar to the 16.4 per cent reported by Lee
et al.
(1996).
2
The cut-off date allows 5 years of post-listing accounting information at the time of initialdata collection. We exclude IPOs by trusts, partnerships, foreign issuers and the issue ofpreference shares.
3
Comparable figures are reported as 73 per cent by Jain and Kini (1994) and 63 per cent byMikkelson
et al.
(1997).
Figure 1 Sample of 313 industrial Australian Initial Public Offerings (IPOs) between 1 January 1976 and 30 June 1993.

M. C. A. Balatbat
et al.
/ Accounting and Finance 44 (2004) 299–328 303
© AFAANZ, 2004
Table 1Descriptive statistics for 313 Australian industrial IPOs between 1 January 1976 and 30 June 1993
Panel A: Characteristics of the offers
Mean (median)Standard deviation
Maximum (minimum)
Issue price ($A) 1.14 (0.93) 0.82 6.01 (0.20)Value of proceeds ($A’000s) 18,260 (7,454) 38,821 484,440 (496)Market capitalization ($A’000s) 38,183 (18,198) 74,357 881,000 (450)Retained ownership (%) 50.64 (54.80) 24.69 93.50 (0.00)Operating history (years) 4.70 (5.00) 4.00 10.00 (0.00)Underpricing (%) 15.48 (10.00) 32.21 240.00 (
−
50.00)
Panel B: Financial characteristics: Mean (median)
Number of firmsYear 1 313
Year 2 301
Year 3 264
Year 4 236
Year 5 202
Total assets 70,725 80,546 92,371 99,609 103,462(22,154) (28,478) (29,548) (31,411) (31,266)
Assets-in-place 52,028 62,289 72,422 82,699 88,122(18,201) (24,199) (25,004) (27,380) (27,393)
Intangibles 17,424 16,905 18,225 15,185 13,534(1,965) (1,895) (1,511) (1,130) (1,054)
Total debt 32,512 39,784 47,326 57,157 62,386(6,045) (9,961) (10,254) (10,837) (11,212)
Net sales 38,581 58,721 72,926 81,065 84,433(7,203) (13,590) (17,908) (18,359) (19,137)
Operating revenue 40,019 62,244 78,551 86,214 89,722(7,986) (14,171) (19,118) (20,582) (20,777)
Debt-to-total assets(%) 36.76 41.17 57.41 60.10 67.60(32.51) (41.82) (48.07) (49.82) (49.00)
Capital expenditures- 12.64 8.89 9.80 6.55 4.36to-total assets (%) (5.62) (4.12) (3.74) (3.04) (2.29)
Note: Information on characteristics of the offer is taken from the initial public offering (IPO)prospectus. Dollar amounts are expressed in 1993 $A using the Australian Bureau of Statistics’Consumer Price Index. Market capitalization is issue price multiplied by the number of outstandingshares after the IPO. Retained ownership is the proportion of shares held by pre-IPO owners asdisclosed in the prospectus. The number of years operating history has an upper bound of 10 years.Underpricing is ((First-day closing price – Issue price)/Issue price). Financial information is collectedfrom the IPO firms’ financial reports. Financial characteristics are stated in $A’000 s unless otherwiseindicated. Year 1 is the first financial year after the IPO. Assets-in-place is determined by deductingintangible assets from total assets. Operating revenue is the sum of net sales and other operatingincome. Capital expenditures are as reported in the funds flow or the cash flow statement.

304 M. C. A. Balatbat
et al.
/ Accounting and Finance 44 (2004) 299–328
© AFAANZ, 2004
For all of our ensuing tests, we collect up to 5 years of post-listing data,resulting in a sample of 1316 firm-year observations. All information was handcollected from annual reports and company papers kept at the University ofSydney’s Stock Exchange Collection. Of the initial 313 firms, only 202 firmsremained listed 5 years after the offering. Among those that ceased to be pub-licly traded, 38 were taken over, 14 were liquidated, 44 failed to pay listingfees, and the remaining 15 were delisted for various reasons, such as voluntaryliquidation, failure to meet required shareholder spread, appointment of a mort-gagee, or by order of the ASX. For the most part, these outcomes can be char-acterized as failure. Panel B of Table 1 reports measures of size, asset mix, andcapital structure for up to 5 years post-listing. Surviving IPO firms showsignificant growth in assets and sales revenue, although comparison of meanand median figures shows that much of the growth is skewed. Not surprisingly,the use of debt finance increases (relative to equity) as businesses mature andgrow. However, capital expenditure (relative to total assets) appears to decline,which is inconsistent with the evidence reported by Mikkelson
et al.
(1997) forUS IPOs.
2.2. Identification of size- and industry-matched firms
In order to test the relation between IPO performance and changes in eitherownership or governance characteristics, we require a measure of performancethat does not anticipate such effects. For that reason, we use an accounting-based measure of operating performance (profit before interest and tax deflatedby total assets) rather than share prices, as we expect that post-listing perform-ance differences will be (at least to some extent) anticipated in price at the timeof going public.
4
To overcome the possible influence of temporal and industryclustering, we calculate an adjusted measure of IPO firms’ operating perform-ance. Barber and Lyon (1996) argue that tests for abnormal operating perform-ance are better specified when sample firms are matched to control firms ofsimilar performance and industry prior to the event under investigation. How-ever, because there was no existing financial database to identify matched firmsby performance, we use size in lieu of pre-event performance.
5
A comparison ofthe financial characteristics between sample and size- and industry-matchedfirms shows that the matched firms are generally larger and less levered thansample firms but these differences are statistically significant in only four of the
4
We use pre-interest income to avoid inducing a relation between capital structure and per-formance purely as a result of the expensing of interest (i.e. the cost of debt) but not the costof equity. Similarly, we exclude taxes because the tax status of the IPO firm may differ fromthe control firm.
5
A close match is defined to be within plus or minus 20 per cent of the IPO firm’s marketcapitalization in the same two or three digit ASX code.

M. C. A. Balatbat
et al.
/ Accounting and Finance 44 (2004) 299–328 305
© AFAANZ, 2004
ten size deciles.
6
Most importantly (as shown in Table 2), the matching processalso results in similar operating performance for the IPO firms and control firmsin the first (and second) post-listing years. Hence, to a large extent, the type ofmatching described by Barber and Lyon is actually achieved.
Table 2Levels and changes in operating returns for 313 Australian industrial IPOs
Year 1 Year 2 Year 3 Year 4 Year 5
Panel A: Operating return (profit before interest and tax/total assets)
IPO firms:Median 3.40 3.96 3.97 2.93 4.29Trimmed mean 3.58 1.92
−
0.37
−
0.50
−
0.91Standard deviation (8.74) (11.72) (17.67) (13.04) (16.50)Per cent positive 64 62 64 61 64
Control firms:Median 6.46 5.96 5.33 5.38 4.37Trimmed mean 4.96 3.30 3.28 2.48 3.33Standard deviation (8.05) (10.30) (9.92) (10.65) (8.12)Percent positive 77 76 74 70 70
Adjusted:Median
−
0.86
−
0.50
−
1.45
−
2.25 0.15
p
-value(Wilcoxon
Z
) 0.284 0.252 0.090* 0.098* 0.370Trimmed mean
−
0.94
−
1.55
−
3.36
−
2.88
−
4.80
p
-value(Student
t
) 0.183 0.107 0.010*** 0.039** 0.004***Standard deviation (11.79) (14.29) (18.89) (16.83) (22.29)Percent positive 47 48 44 43 50
p
-value (Binomial) 0.309 0.564 0.056 0.044 0.944Number of observations:
full sample313 301 264 236 202
Number of observations:trimmed sample
281 265 238 212 182
Panel B: Changes in adjusted operating return (trimmed sample)
Year 1,2 1,3 1,4 1,5Median
−
0.60
−
0.57
−
1.88
−
1.57
p
-value(Wilcoxon
Z
) 0.268 0.177 0.124 0.169Mean
−
1.50
−
3.55
−
2.87
−
5.61
p
-value(Student
t
) 0.068* 0.010*** 0.033** 0.010***Standard deviation (13.29) (21.03) (19.41) (29.29)
Year 2,3 2,4 2,5Median
−
1.45
−
1.89
−
1.81
p
-value(Wilcoxon
Z
) 0.015** 0.026** 0.047**Mean
−
3.64
−
3.95
−
6.44
p
-value (Student
t
) 0.001*** 0.003*** 0.001***Standard deviation (16.89) (18.97) (26.89)
6
Full details are available from the authors.

306 M. C. A. Balatbat
et al.
/ Accounting and Finance 44 (2004) 299–328
© AFAANZ, 2004
Year 3,4 3,5Median 0.25
−
1.20
p
-value(Wilcoxon
Z
) 0.353 0.656Mean
−
1.45
−
2.63
p
-value(Student
t
) 0.369 0.133Standard deviation (19.64) (23.53)
Year 4,5Median
−
0.33
p
-value (Wilcoxon
Z
) 0.423Mean
−
2.09
p
-value (Student
t
) 0.176Standard deviation (20.74)
Note: Performance indicators are in per cent. Year 1 is the first financial report after initial publicoffering (IPO). Adjusted operating return is operating return of IPO firm less the operating return ofcontrol firm. Change in adjusted operating performance is the difference between the adjustedperformance at the end and the beginning of the interval. ‘Year’ in Panel B indicates the beginning andthe end of the interval. The significance tests are based on Wilcoxon signed rank tests of no differencebetween IPO firm and control firm,
t
-tests that adjusted performance has a mean equal to zero, andnormal approximation to the binomial probability. ***Significant at 1% level, **significant at 5% level,*significant at 10% level. Trimmed mean excludes observations within the 5th and beyond the 95thpercentiles, to remove the effects of extreme outliers. Standard deviation reported is for trimmed sample.
Year 1 Year 2 Year 3 Year 4 Year 5
2.3. Separation of ownership and control
We construct several ownership measures, each of which captures differingaspects of ownership and control. Prior studies have typically used the share-holdings of officers and directors (OAD) as a proxy for managerial ownership(Morck
et al.
, 1988; Craswell
et al.
, 1997; Mikkelson
et al.
, 1997). If highermanagerial ownership lowers agency costs, thereby implying better firm per-formance, then we expect OAD and performance to be positively associated. Asan alternative, we examine ownership by the most significant original share-holders. This is consistent with concerns about how rapidly original ownersdivest further after the IPO, an observation that is difficult to make when theconventional definition of managerial ownership is used.
7
While all originalshareholders are not explicitly disclosed in the prospectus, we expect that themost significant original shareholders (OSH) are frequently appointed as direc-tors at the time of the IPO. Accordingly, the holdings of directors disclosed inthe IPO prospectus are used as a proxy measure for the original shareholders.
7 The difficulty in tracking retained ownership arises when directors not associated with thepre-IPO owners are appointed as directors after the IPO.
Table 2 (cont’d)
M. C. A. Balatbat et al. / Accounting and Finance 44 (2004) 299–328 307
© AFAANZ, 2004
The names of all the directors in the prospectus are obtained and the shareownership of these directors is tracked for up to 5 years after the offering.
Another shareholder class likely to play a role in monitoring and controllingmanagement is large shareholders. We examine two such groups, namely insti-tutional shareholders and independent blockholders. Short and Keasey (1997)summarize the role of institutional shareholders in the corporate governanceprocess.8 They argue that because of the exceedingly complex web of interrela-tionships between various ownership interests, and the problems of accessingrelevant information, the effects of institutional shareholders on firm perform-ance are unclear. Institutional shareholders may be relatively passive becausethe costs of monitoring may outweigh the expected benefits or because of legalimpediments.9 While there is some evidence that institutions improve corporategovernance of US firms, their role in the governance of IPO firms is not wellunderstood. We measure institutional ownership (INST) as the proportion of out-standing capital held by life offices, superannuation funds, unit trusts, investmentcompanies and other financial institutions. Ownership data are obtained fromthe list of 20 largest shareholders reported in the firm’s annual report.
While some studies find a positive and significant relation between block-holder ownership and firm value (Holderness and Sheehan, 1988; Barclay andHolderness, 1991; Mikkelson and Ruback, 1991), blockholders may also utilizetheir influence to extract private benefits. We define blockholders (BLK) asshareholders who are neither directors nor institutions, but have ownership of5 per cent or more of the firm’s outstanding shares. Because shareholders own-ing significant blocks may be able to collaborate to replace poorly performingmanagers, we also identify those firms where the cumulative holding of identifi-able blockholders exceeds 50 per cent of the outstanding shares.
2.4. The role of the board
Fama and Jensen (1983) argue that the board’s oversight role facilitates theseparation of decision management and decision control. However, the effec-tiveness of boards in monitoring and disciplining managers has been the subjectof considerable debate in both academic and business communities, especiallyregarding the relative effectiveness of inside and outside directors. For example,Weisbach (1988) argues that inside directors are less likely to challenge the CEObecause their careers may depend on CEO support, while outside directors havereputational incentives to fire a poorly performing CEO. But a board predominantly
8 See Pound (1988) for a discussion of the incentives for institutional shareholders to inter-vene in corporate monitoring.9 For example, Australian institutions could potentially breach the antitakeover provisionsof the Corporations Law when they act collectively against a firm. Stapledon (1996) pro-vides a detailed discussion of the barriers to institutional monitoring in Australia.

308 M. C. A. Balatbat et al. / Accounting and Finance 44 (2004) 299–328
© AFAANZ, 2004
comprised of outside directors may still be relatively ineffective. Critics arguethat CEOs influence board membership and select members not predisposed tomonitoring management (e.g. Mace, 1986; Shivdasani and Yermack, 1998).10
This is exacerbated by shareholders typically voting for directors endorsed bythe CEO.11 Hermalin and Weisbach (1998) propose a model of board composi-tion where CEO tenure is a primary determinant, and Arthur (2001) providessupporting evidence for Australian boards.
Nevertheless, investment organizations and regulatory bodies typicallysuggest that effective corporate governance includes a board consisting of amajority of outside directors.12 While there are inconsistencies in the pub-lished literature on what constitutes an outside director, the definition we adoptin the present paper is consistent with the Australian Investment Managers’Association’s (AIMA)13 definition; namely, that an outside director is a non-executive and unaffiliated director. Non-executive directors who have substantialrelevant interests in the firm are also considered affiliated. Other affiliations mayresult from association of the director with the firm’s major creditors, profes-sional advisers or suppliers. Directors’ profiles, statement of directors’ relevantinterests, and notes on related party transactions were examined to determinewhether a director is a non-executive unaffiliated director, who is then classifiedas an outside director. All other directors are classified as inside directors.
2.5. Board leadership
Jensen (1993) argues that the board is often ineffective because the chair-person is frequently also the CEO, although evidence on the effect of separating
10 This allegation led to proposals that board members should be appointed through a nom-ination committee. In Australia, the Bosch Committee suggests that all publicly listed firmsshould consider the appointment of a nomination committee composed of at least a majorityof independent non-executive directors. However, only 19 per cent of the top 100 firms hadnomination committees in 1995 (Stapledon and Lawrence, 1997).11 Hermalin and Weisbach (1998) and John and Senbet (1998) suggest that although share-holders legally choose the members of the board, in practice shareholders almost alwaysvote for the slate proposed by management.12 For example, the Californian Public Employees’ Retirement System (CalPERS) has increasedthe pressure on US firms to adopt corporate governance practices that include the majority ofthe board seats being held by outside directors (Smith, 1996). Similarly, the AustralianInvestment Managers’ Association (AIMA) suggests that it is good corporate governancepractice to have a majority of outside directors on the board. The Cadbury report in the UK(Cadbury, 1992) and the Bosch Committee in Australia (Bosch Committee, 1995) both sug-gest reliance on the role of non-executive directors in monitoring management.13 In 1998, AIMA was amalgamated with the Investment Funds Association of Australia andthe Life, Investment and Superannuation Association to form the Investments and FinancialServices Association.

M. C. A. Balatbat et al. / Accounting and Finance 44 (2004) 299–328 309
© AFAANZ, 2004
the CEO and chairperson positions is best described as mixed (Arthur et al.,1993; Pi and Timme, 1993). Brickley et al. (1997) claim that proponents ofthe dual leadership structure base their arguments on a mix of anecdotal evid-ence and an intuitive appeal to common sense.14 They suggest that there areboth costs and benefits in separating the titles, and that it is not theoretically ob-vious which leadership structure is optimal. Moreover, splitting the titles mayalso create a potential for rivalry between the CEO and the chairperson, makingit difficult to pinpoint blame for poor performance, while having two spokes-people may lead to confusion and opportunistic behaviour by outsiders. Brickleyet al. (1997) provide evidence that challenges the claim that good corporategovernance dictates that the position of CEO and chairperson must be separate.Their analysis suggests that most major US companies do not have an inde-pendent chairperson, and where firms have an independent chairperson, it isonly during periods of CEO transition. Despite a lack of convincing evidence,there is still considerable pressure from shareholders and regulators in Australiato designate the positions of CEO and chairperson to separate individuals.15 Wetherefore identify firms that separate the roles of CEO and chairperson (i.e.boards with dual leadership structures) based on information provided in theannual report.
3. Evidence of post-listing performance, ownership structure and governance attributes
3.1. Post-listing operating returns
Panel A of Table 2 summarizes operating returns for Australian IPOs for eachof the first 5 post-listing years.16 We report actual operating return separatelyfor IPO and control firms, as well as the adjusted operating return on which oursubsequent analysis is based. It is evident that IPO firms’ (unadjusted) operating
14 The terminology adopted in the present paper is consistent with that of Brickley et al.(1997). That is, a unitary structure refers to a firm with one leader, while a dual structurerefers to a firm governed by two leaders, the CEO and the chairperson.15 For instance, the Bosch Committee (1995) and AIMA (1995) endorsed the separation ofCEO and chairperson titles.16 Balatbat (2002) provides a detailed examination of the operating performance of Aus-tralian IPOs. She reports that the operating performance of IPO firms is insensitive to thedeflator used (i.e. whether earnings performance is deflated by total assets or by total oper-ating revenue). Moreover, while cash flow-based measures of operating performance arealso reported in Balatbat (2002), Barber and Lyon (1996) argue that cash flow-based oper-ating performance measures are uniformly less powerful than earnings-based performancemeasures. Balatbat’s results are consistent with this finding. Hence, we confine our analysisto adjusted operating return.

310 M. C. A. Balatbat et al. / Accounting and Finance 44 (2004) 299–328
© AFAANZ, 2004
performance is relatively stable from the year of public offering to and throughyear 3, with some evidence of a decline in year 4 followed by an improvementin year 5. In contrast, control firms’ operating performance declines almost mono-tonically over the 5 years. Adjusted operating performance is not significantlydifferent from zero in either of the first 2 post-listing years, consistent with thesize and industry-based matching procedure also achieving performance matching.This increases our confidence that the significantly negative adjusted operatingreturns in latter years are not an experimental artefact. Median (mean) ad-justed operating performance is significantly less than zero only in years 3and 4 (years 3, 4 and 5). The proportion of IPO firms with adjusted perform-ance less than zero is significantly less than chance only in years 3 and 4, withan equal number of positive outcomes by year 5. These results are consistentwith some negative skewness in year 5 adjusted operating performance.
Panel B of Table 2 reports changes in the adjusted operating performance.We report changes on both an annual basis, as well as lagged comparisons.Consistent with the evidence in Panel A, there is a pattern of declining perform-ance where either year 1 or year 2 is used as the benchmark. Comparisonsbased on either year 3 or year 4 show no significant evidence of a decline inadjusted operating performance beyond those periods.17
3.2. Ownership structure
Table 3 reports evidence of changes in managerial ownership (Panel A) andlarge shareholders (Panel B) for up to 5 years following the IPO. For our aggre-gate insider ownership measure (OAD and OSH), we are also able to compareyear 1 figures with the position immediately after the IPO. However, for theCEO measure and other large shareholder measures (Panel B) we are unable tocompare the first post-listing year-end with the position immediately after theIPO because of lack of adequate disclosure in the prospectus.
As expected, OAD declines significantly at the IPO. This decline continues,with the median (mean) OAD falling further to 28 per cent (30 per cent) inyear 5.18 The decline is more severe using our proxy for OSH, where the
17 When we regress earnings on cash flow from operations, we find that the explanatorypower is monotonically increasing over the first 5 post-listing years (i.e. 14 per cent, 21 percent, 25 per cent, 39 per cent and 53 per cent of earnings is explained by cash flows fromoperations in year 1, year 2, year 3, year 4, and year 5, respectively). Whether this is indicativeof earnings management in the years immediately following an IPO, or just greater use ofaccruals in the early stages of a business venture, is beyond the scope of the present paper.18 Craswell et al. (1997) report mean inside ownership for ASX listed firms in 1989 to be7 per cent for large firms and 35 per cent for small firms. Mikkelson et al. (1997) reportthat the collective ownership stake of officers and directors undergoes a large decline atthe offering, falling from 68 per cent to 44 per cent immediately after the offering. This fallsfurther to 29 per cent and 18 per cent, 5 years and 10 years after the offering, respectively.

M. C. A. Balatbat et al. / Accounting and Finance 44 (2004) 299–328 311
© AFAANZ, 2004
Table 3Post-listing ownership structure of 313 Australian industrial IPOs (percentage)
Number of firmsYear 1
313Year 2 301
Year 3 264
Year 4 236
Year 5 202
Panel A: Managerial ownershipOfficers and directors (OAD)
Median 39.04 35.82 34.50 29.59 27.63Mean 36.10 34.62 33.01 31.13 29.95Standard deviation (24.61) (24.38) (25.00) (25.32) (25.31)t-test relative to t − 1 ( p-value) 0.000*** 0.455 0.439 0.405 0.627
Original shareholders (OSH )Median 36.70 32.17 26.12 21.34 17.92Mean 34.30 31.33 28.38 26.63 24.68Standard deviation (24.35) (24.42) (24.85) (25.13) (24.72)t-test relative to t − 1 ( p-value) 0.000*** 0.131 0.156 0.435 0.415
Chief executive officer (CEO)Median 10.15 9.47 7.81 6.55 4.23Mean 19.40 18.60 16.93 16.76 14.52Standard deviation (21.75) (21.30) (20.67) (21.24) (21.15)t-test relative to t − 1 ( p-value) 0.645 0.347 0.927 0.627
Panel B: Large shareholdersTop 20 shareholders (TOP20)
Median 79.30 79.60 80.06 80.59 81.69Mean 76.06 76.73 76.83 76.71 77.09Standard deviation (14.82) (15.36) (16.58) (16.57) (16.55)t-test relative to t − 1 ( p-value) 0.585 0.939 0.933 0.808
Institutions (INST )Median 14.21 14.36 12.99 12.17 12.55Mean 16.70 17.15 16.71 17.16 16.81Standard deviation (13.65) (14.27) (14.43) (18.37) (15.51)t-test relative to t − 1 ( p-value) 0.688 0.718 0.326 0.228
Substantial shareholders (BLK )Median 6.34 7.50 9.32 9.63 11.09Mean 11.90 12.74 13.41 14.76 15.07Standard deviation (15.84) (15.50) (15.77) (16.65) (16.31)t-test relative to t − 1 ( p-value) 0.509 0.611 0.357 0.593Number of firms with large blockholders 12 14 11 12 13
Note: Year 1 is the first financial year after initial public offering (IPO). Ownership represents theproportion of shares that each class of shareholder has beneficial and/or relevant interests to total end-of-period outstanding shares. Officers and directors are those disclosed as such in the annual report.Original shareholders are assumed to be all directors disclosed in the IPO prospectus. Institutionsinclude life offices, superannuation funds, unit trusts, investment companies and other financialinstitutions. Substantial shareholders own 5% or more of total outstanding shares and do not haveboard representation. A large blockholder is present if the sum of shares held by substantialshareholders is 50% or more of total outstanding shares. T-tests refer to equality of mean valuesbetween the current (t) and the preceding period (t – 1). The t-test in year 1 for OAD and OSH variablewas possible only because retained ownership can be used as a proxy, while this is not the case forother ownership variables. ***Significant at 1 per cent level.
312 M. C. A. Balatbat et al. / Accounting and Finance 44 (2004) 299–328
© AFAANZ, 2004
median (mean) declines to 18 per cent (25 per cent). However, for both proxies,the only statistically significant decline is in year 1 (i.e. measured from theposition immediately after the IPO). This suggests that IPO owners intendingto divest do so immediately after the offering.19 It is possible that pre-IPOowners sell their remaining shares quickly to take advantage of investors’ over-optimism immediately after the offering.20 Another explanation is that originalshareholders continue to have portfolio diversification incentives after takingtheir firm public, provided these shares are not subject to escrow restrictions.21
Panel B of Table 3 reports ownership changes for large shareholders. Theproportion of shares owned by the top 20 shareholders remains stable duringthe 5-year period, with a median (mean) of around 80 per cent (76 per cent).These high proportions demonstrate that ownership is concentrated in the handsof relatively few major shareholders. Panel B also documents the ownershipstructure of other large shareholders. The initial median ownership of institu-tions is 14.2 per cent, falling slightly to 12.5 per cent by year 5. These figuresare low relative to a survey reported by the Industry Commission (1991), con-sistent with the expectation that institutional ownership of IPO firms will belower than for ASX-listed firms in general. Panel B of Table 3 also indicatesthat the presence of an independent blockholder with majority ownership isvery rare.
3.3. Board composition and leadership
Panels A and B of Table 4 summarize board composition for the first 5 post-IPO years. During that period, median board size remains unchanged at fivedirectors and the median number of outside directors on the board is constantat two directors. The proportion of outside directors in our sample is similar tothat reported by Stapledon and Lawrence (1997), who examine the 100 largest ASX-listed firms in 1995, and by Arthur (2001) for 135 randomly selected ASX firmsin 1989. This suggests that IPO firms put in place corporate boards that aresufficiently large to accommodate the foreseeable growth in the firm.
However, while the size of IPO boards is similar to most ASX-listed firms,the composition and leadership appears different from most ASX-listed firms.Panel C of Table 4 indicates that only a few IPO firms have boards that are
19 The decline in inside ownership may be overstated when the firm conducts a seasonedequity issue within 5 years after IPO. This is a limitation of the ownership analysis in thepresent paper.20 The assumption here is that if the price run-up continues, pre-IPO owners can earn posi-tive returns by selling their shares right after the offering.21 Escrow restrictions are more frequently applied by the ASX to mining and explorationcompanies, and these firms are excluded in the sample.

M. C. A. Balatbat et al. / Accounting and Finance 44 (2004) 299–328 313
© AFAANZ, 2004
dominated by outside directors, much lower than the proportions reported byStapledon and Lawrence (1997; 40 per cent) and Arthur (2001; 52 per cent).Moreover, Panel D of Table 4 shows that approximately 55 per cent of IPOfirms adopt a dual leadership structure (i.e. separate CEO and chairperson) atthe time of the offering. This proportion increases to 63 per cent by the end ofyear 5. In contrast, Stapledon and Lawrence (1997) report that just fewer thanhalf of the 100 largest ASX-listed firms had an independent chairperson.
Table 4 Board composition and leadership structure of 313 Australian industrial IPOs
Number of firmsYear 1 313
Year 2 301
Year 3 264
Year 4 236
Year 5 202
Panel A: Board size (number)Median 5.00 5.00 5.00 5.00 5.00Mean 5.40 5.30 5.40 5.40 5.30Minimum 3.00 3.00 3.00 3.00 3.00Maximum 12.00 12.00 12.00 12.00 12.00Standard deviation (1.56) (1.61) (1.72) (1.74) (1.72)t-test relative to t − 1 ( p-value) 0.648 0.598 0.922 0.582
Panel B: Outside directors (number)Median 2.00 2.00 2.00 2.00 2.00Mean 2.00 1.97 1.98 2.04 2.02Minimum 0.00 0.00 0.00 0.00 0.00Maximum 8.00 7.00 7.00 6.00 8.00Standard deviation (1.29) (1.26) (1.30) (1.30) (1.36)t-test relative to t − 1 ( p-value) 0.851 0.615 0.503 0.567
Panel C: Outsider-dominated boards (percentage)Outsiders >50% 34.82 32.23 33.33 37.29 34.65t-test relative to t − 1 ( p-value) 0.496 0.780 0.357 0.568Outsiders >60% 12.78 12.62 12.12 16.95 13.37t-test relative to t − 1 ( p-value) 0.954 0.856 0.128 0.297
Panel D: Leadership structure (percentage)Firms with separate CEO and chairperson 55.00 59.47 58.71 56.78 63.37t-test relative to t − 1 ( p-value) 0.294 0.856 0.663 0.161
Panel E: Independent board (percentage)Outside directors >50% and separate CEO 21.09 20.27 18.94 22.88 24.26
and chairpersont-test relative to t − 1 ( p-value) 0.802 0.693 0.279 0.736Outside directors >60% and separate CEO 7.67 8.64 6.82 8.90 7.92
and chairpersont-test relative to t − 1 ( p-value) 0.661 0.422 0.391 0.713
Note: Year 1 is the first financial year after initial public offering (IPO). A board is outsider dominatedwhen the proportion of outside directors is greater than 50% or 60%. A board is independent when itis outsider-dominated and has a separate chief executive officer (CEO) and chairperson. T-tests are theequality of mean values between the current (t) and the preceding period (t − 1).

314 M. C. A. Balatbat et al. / Accounting and Finance 44 (2004) 299–328
© AFAANZ, 2004
When board independence is assessed as a combination of board compositionand leadership, Panel E of Table 4 shows that less than one-quarter of the samplehas an independent board structure (i.e. a board that is outsider-dominated andhas a separate CEO and chairperson). This declines to less than 10 per centwhen an outsider-dominated board is defined as greater than 60 per cent.22
4. Results
4.1. Univariate analysis
Panel A of Table 5 reports annual adjusted operating return partitioned byIPO firm characteristics (i.e. retained ownership, underpricing, length of prioroperating history and the presence of a secondary sale component within theIPO). We compare the adjusted operating return of IPO firms which fall withinthe upper and lower quartiles, or above or below a partitioning basis appropri-ate to the relevant characteristic.23 Several observations are worthy of note.First, the adjusted operating return of IPO firms is not systematically related toretained ownership measured after the IPO. This is inconsistent with thefindings of Jain and Kini (1994), who report that post-IPO retained ownershipis positively related to changes in operating performance. Second, adjustedoperating returns are not significantly related to the extent of underpricing,consistent with share-price based evidence that underpricing does not serve asa signal of future performance (Lee et al., 1996). Third, adjusted operatingreturns are also not significantly related to the presence of secondary shares atthe time of IPO, a result consistent with Mikkelson et al. (1997). However, theattrition rate for IPOs with a secondary component is lower than the attritionrate for IPOs of purely new issues. For the 44 IPOs having secondary shares, 31 IPOfirms survived to 5 years after the public offering, suggesting an attrition rate of30 per cent. This is lower than the attrition rate of 37 per cent for IPO firmswith purely new issues.24
There is some evidence in Panel A of Table 5 that IPO firms with an estab-lished operating history perform better than younger (typically start-up) IPOfirms. However, this difference is statistically significant only in the first 2 years.This may reflect relatively conservative accounting conventions, whereby at leastsome start-up outlays are expensed outright, so that these firms initially appear
22 Brickley et al. (1994) used 50 per cent as the cut-off point, while Byrd and Hickman(1992) defined outsider-dominated boards as boards having more than 60 per cent outsidedirectors in their examination of tender offer bids.23 Quartiles differ in size because of ties.24 Mikkelson et al. (1997) report that slightly more than 50 per cent of US IPOs have asecondary share component, compared to only 14 per cent for our sample.

M. C
. A. B
alatbat et al. / Accounting and F
inance 44 (2004) 299–
328315
© A
FAA
NZ
, 2004
Table 5Adjusted operating return partitioned by IPO firm characteristics, level of ownership, board composition and leadership structurePanel A: IPO firm characteristics
Retained ownership Underpricing Operating historySecondary share component
Lowest quartile
Highestquartile
Z-statisticp-value
Lowest quartile
Highest quartile
Z-statisticp-value Young Established
Z-statisticp-value Absent Present
Z-statisticp-value
Year 1Median −3.03 −0.86 −1.143 0.54 −3.03 −0.775 −5.42 2.49 −4.148 −1.12 2.06 −1.294Trimmed mean −3.51 −0.37 0.253 −0.02 −0.92 0.438 −4.56 2.17 0.000*** −1.31 1.32 0.196Standard deviation (11.98) (12.04) (12.76) (10.91) (12.62) (10.74) (12.08) (10.04)Number of observations 79 77 93 71 152 161 269 44
Year 2Median −5.65 −0.06 −1.458 −4.50 −0.06 −0.542 −6.48 1.94 −3.339 −1.28 0.97 −1.072Trimmed mean −5.47 −1.37 0.145 −2.66 −2.02 0.588 4.77 1.34 0.001*** 2.02 1.15 0.284Standard deviation (13.77) (14.96) (15.07) (16.56) ( 15.54) (13.00) (14.64) (12.02)Number of observations 74 75 90 69 142 159 259 42
Year 3Median −1.29 −1.15 −0.106 −4.94 −1.71 −0.640 −2.08 −0.67 −1.391 −1.43 −3.41 −0.349Trimmed mean 0.98 −1.26 0.916 −12.58 −4.35 0.522 −7.96 −0.64 0.164 −3.52 −2.98 0.727Standard deviation (16.14) (18.67) (18.67) (21.28) (21.59) (17.10) (19.78) (13.37)Number of observations 65 66 71 62 117 147 225 39
Year 4Median −2.20 0.60 −0.636 −3.67 −1.43 −1.002 −3.63 −0.70 −1.017 −1.89 −2.86 −0.666Trimmed mean −1.68 −2.49 0.525 −3.78 −4.76 0.317 −4.05 −2.01 0.309 −2.56 −4.65 0.506Standard deviation (16.01) (16.39) (13.04) (19.18) (17.40) (16.54) (16.90) (16.70)Number of observations 56 62 59 56 101 135 200 36
Year 5Median 1.03 −3.27 −1.508 0.85 −1.73 −0.179 −0.17 0.56 −0.561 0.50 3.23 −1.337Trimmed mean 0.41 −10.20 0.132 −17.19 −3.87 0.858 −12.59 −2.05 0.575 −5.90 0.64 0.181Standard deviation (19.38) (23.92) (25.17) (19.33) (12.08) (10.04) (22.65) (18.65)Number of observations 50 55 50 50 89 113 171 31
316M
. C. A
. Balatbat et al. / A
ccounting and Finance 44 (2004) 299
–328
© A
FAA
NZ
, 2004
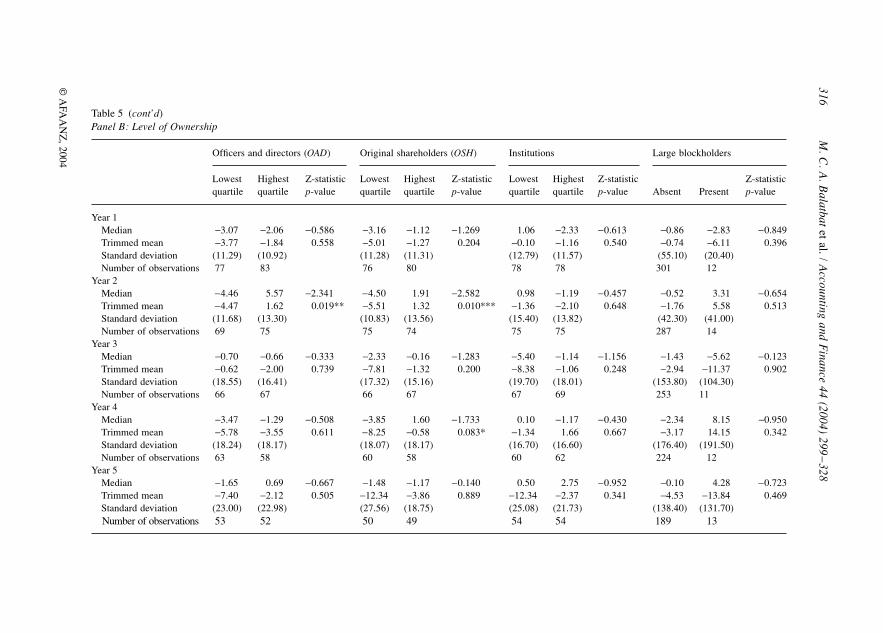
Panel B: Level of Ownership
Officers and directors (OAD) Original shareholders (OSH) Institutions Large blockholders
Lowest quartile
Highest quartile
Z-statisticp-value
Lowest quartile
Highest quartile
Z-statisticp-value
Lowestquartile
Highestquartile
Z-statisticp-value Absent Present
Z-statisticp-value
Year 1Median −3.07 −2.06 −0.586 −3.16 −1.12 −1.269 1.06 −2.33 −0.613 −0.86 −2.83 −0.849Trimmed mean −3.77 −1.84 0.558 −5.01 −1.27 0.204 −0.10 −1.16 0.540 −0.74 −6.11 0.396Standard deviation (11.29) (10.92) (11.28) (11.31) (12.79) (11.57) (55.10) (20.40)Number of observations 77 83 76 80 78 78 301 12
Year 2Median −4.46 5.57 −2.341 −4.50 1.91 −2.582 0.98 −1.19 −0.457 −0.52 3.31 −0.654Trimmed mean −4.47 1.62 0.019** −5.51 1.32 0.010*** −1.36 −2.10 0.648 −1.76 5.58 0.513Standard deviation (11.68) (13.30) (10.83) (13.56) (15.40) (13.82) (42.30) (41.00)Number of observations 69 75 75 74 75 75 287 14
Year 3Median −0.70 −0.66 −0.333 −2.33 −0.16 −1.283 −5.40 −1.14 −1.156 −1.43 −5.62 −0.123Trimmed mean −0.62 −2.00 0.739 −7.81 −1.32 0.200 −8.38 −1.06 0.248 −2.94 −11.37 0.902Standard deviation (18.55) (16.41) (17.32) (15.16) (19.70) (18.01) (153.80) (104.30)Number of observations 66 67 66 67 67 69 253 11
Year 4Median −3.47 −1.29 −0.508 −3.85 1.60 −1.733 0.10 −1.17 −0.430 −2.34 8.15 −0.950Trimmed mean −5.78 −3.55 0.611 −8.25 −0.58 0.083* −1.34 1.66 0.667 −3.17 14.15 0.342Standard deviation (18.24) (18.17) (18.07) (18.17) (16.70) (16.60) (176.40) (191.50)Number of observations 63 58 60 58 60 62 224 12
Year 5Median −1.65 0.69 −0.667 −1.48 −1.17 −0.140 0.50 2.75 −0.952 −0.10 4.28 −0.723Trimmed mean −7.40 −2.12 0.505 −12.34 −3.86 0.889 −12.34 −2.37 0.341 −4.53 −13.84 0.469Standard deviation (23.00) (22.98) (27.56) (18.75) (25.08) (21.73) (138.40) (131.70)Number of observations 53 52 50 49 54 54 189 13
Table 5 (cont’d)

M. C
. A. B
alatbat et al. / Accounting and F
inance 44 (2004) 299–
328317
© A
FAA
NZ
, 2004
Outsider-dominated (end-of-period)
Leadership structure (at IPO)
Leadership structure (end-of-period) Board Independence
50% orless >50%
Z-statisticp-value Unitary Dual
Z-statisticp-value Unitary Dual
Z-statisticp-value
Non-independent independent
Z-statisticp-value
Year 1Median −0.78 −1.45 0.073 −3.11 0.30 −1.982 −4.68 1.04 –3.181 −2.42 2.61 −2.078Trimmed mean −0.94 −0.38 0.941 −3.37 0.60 0.048** −4.17 1.74 0.001*** −2.18 2.00 0.038**Standard deviation (11.91) (11.70) (13.20) (10.75) (12.93) (10.66) (12.13) (10.95)Number of observations 266 47 127 186 140 173 217 96
Year 2Median −0.55 −0.23 −0.458 −2.00 0.30 −2.075 −1.76 0.78 −1.844 −1.28 1.49 −1.653Trimmed mean −1.26 −3.26 0.647 −4.32 0.96 0.038*** −4.45 0.22 0.065* −2.95 1.38 0.098*Standard deviation (15.44) (12.74) (14.69) (14.04) (15.23) (13.65) (15.18) (11.99)Number of observations 258 43 122 179 122 179 209 92
Year 3Median −1.29 −2.13 −1.103 −1.66 −1.25 −0.728 −2.13 −0.46 −1.793 −2.02 2.63 −1.735Trimmed mean −2.45 −8.53 0.270 −4.89 −2.08 0.467 −7.73 −0.77 0.073* −5.02 5.32 0.083*Standard deviation (18.74) (19.14) (19.95) (18.04) (18.94) (18.77) (18.53) (19.60)Number of observations 225 39 107 157 109 155 190 92
Year 4Median −2.48 −1.69 −0.366 −2.59 −1.69 −0.125 −2.95 −1.44 −0.856 −2.55 −0.50 −0.804Trimmed mean −3.44 −1.19 0.714 −1.87 −3.81 0.901 −4.15 −1.96 0.392 −3.12 −2.29 0.422Standard deviation (13.90) (19.37) (16.78) (16.92) (16.93) (17.21) (15.51) (19.75)Number of observations 190 46 94 142 102 134 166 70
Year 5Median 0.56 −2.28 −1.190 0.23 −1.32 −0.114 −3.99 1.41 −2.183 −1.46 2.88 −1.452Trimmed mean −4.30 −7.84 0.234 −7.14 −3.38 0.909 −10.60 −1.87 0.029** −7.87 −0.17 0.147Standard deviation (21.86) (22.79) (25.14) (20.36) (21.84) (22.35) (24.00) (18.43)No. of observations 161 41 81 121 74 128 134 68
Table 5 (cont’d) Panel C: Board composition and leadership structure

318M
. C. A
. Balatbat et al. / A
ccounting and Finance 44 (2004) 299
–328
© A
FAA
NZ
, 2004
Table 5 (cont’d )Note: Adjusted operating return is ORIPO Firm less ORControl Firm. Operating return (OR) is profit before interest and taxes divided by end-of-period total assets.Trimmed mean excludes observations within the 5th and beyond the 95th percentiles to remove the effects of extreme outliers. Standard deviation reported isfor the trimmed sample. Retained ownership is the proportion of the outstanding shares retained by pre-initial public offerings (IPO) owners as disclosed in theprospectus. Underpricing is the first-day return to IPO subscribers determined by (first day closing price less Issue price) divided by issue price]. Youngfirms are IPO firms with 5 years or less operating history prior to IPO, whilst established firms are those with more than 5 years operating history.Secondary shares are present when the public offering includes shares owned by pre-IPO owners and absent when the public offering consists purely of newissues. Ownership of officers and directors refers to the proportion of outstanding shares in which end-of-period directors have beneficial ownership and/orrelevant interests. Ownership of original shareholders is the proportion of outstanding shares in which public offering directors have beneficial ownership and/or relevant interests. Public offering directors are directors at the time of the offering. Ownership of institutions represents the sum of shares owned by lifeoffices, superannuation funds, unit trusts, investment companies and other financial institutions, divided by the number of end-of-period outstanding shares.Large blockholders exist when the sum of ownership held by substantial shareholders with no board representation is greater than 50%. Substantial shareholdersare shareholders owning 5% or more of the total outstanding shares. A board is outsider-dominated when the proportion of outside directors is greater than 50%.Proportion of outside directors refers to the number of non-executive independent directors divided by board size. Dual leadership exists when a firm has aseparate chief executive officer (CEO) and chairperson. An independent board is a board that is outsider-dominated and led by a chairperson who is not the CEOof the firm. p-value is based on Wilcoxon signed rank test, and ***, **, * represent significance at 1%, 5%, 10% level, respectively.
Outsider-dominated (end-of-period)
Leadership structure (at IPO)
Leadership structure (end-of-period) Board Independence
50% orless >50%
Z-statisticp-value Unitary Dual
Z-statisticp-value Unitary Dual
Z-statisticp-value
Non-independent independent
Z-statisticp-value
M. C. A. Balatbat et al. / Accounting and Finance 44 (2004) 299–328 319
© AFAANZ, 2004
to under-perform their established counterparts. Within a few years of goingpublic, the performance of young start-up IPO firms is comparable with estab-lished firms.25
Evidence of the relation between adjusted operating performance and ownershipstructure is reported in Panel B of Table 5. IPO firms with managerial owner-ship in the upper quartile generally outperform IPO firms in the lower quartile,though this result is statistically significant only in year 2 for both measures (OSHand OAD), and in year 4 for the OSH measure. This result is weakly supportiveof the argument that poor performance reflects the agency costs associated withthe separation of ownership and control. The absence of a statistically significantrelation between firm performance and insider ownership subsequent to year 2(save for the year 4 result using OSH) may be the result of IPO firms overcom-ing the transitional phase of a newly organized firm, or the relatively early stagefailure of the most extreme cases. We further investigate this issue below.
There is no support from Panel B of Table 5 that institutional ownership hasa positive influence on firm performance. However, we caution against attach-ing too much significance to these results, as the typically low ownership stakesof institutions in IPO firms may make it impractical for them to recover sub-stantive monitoring costs. Another explanation for the reluctance of institutionsto actively monitor managers may be the risk of breaching the anti-takeoverprovisions in the Corporations Law, or of being suspected of insider trading ifthey act collectively with other investors.26 There is also no evidence in Panel Bof Table 5 of any relation between operating performance and the presence oflarge blockholders.
Panel C of Table 5 compares the adjusted operating returns for firms withinsider and outsider-controlled boards (i.e. 50 per cent or more), as well as forfirms with unitary and dual board leadership. Firms with outsider-dominatedboards do not outperform other firms. However, it is noteworthy that, for the 5-year post-listing period that we examine, the decline in sample size for firmswith outsider-dominated boards is much less (47 declining to 41) than for thosefirms that do not have a majority of outside directors (266 declining to 161).This may be seen as indirect evidence that outsider-dominated boards are asso-ciated with better long-term prospects at the time of listing, although this doesnot show up in year-by-year comparisons of operating performance for firmswith insider and outsider-controlled boards.27
25 Similar results are found when the surviving IPO firms are partitioned between young andestablished firms (i.e. that established firms perform better than young start-up IPO firms).These results are statistically significant in year 1 and year 2.26 Of course, institutional investors may simply not be prepared to invest in most IPOsbecause of the heightened risk.27 Similar results hold when we define outsider board control as being greater than 60 percent of directors comprising outsiders.

320 M. C. A. Balatbat et al. / Accounting and Finance 44 (2004) 299–328
© AFAANZ, 2004
In contrast to the evidence on board composition, Panel C of Table 5 showsthat firms that have a dual leadership structure significantly outperform thosefirms that have a unitary leadership structure. This result is stronger when leader-ship structure is re-measured annually, rather than simply relying on thesituation as it is immediately following listing. When we combine outsider-control of the board with dual leadership, the results are much the same,suggesting that leadership structure may be the more important of the twocharacteristics.
4.2. Multivariate analysis
In order to test the joint effects of insider ownership and corporate govern-ance attributes (i.e. board composition and leadership) on post-listing operatingperformance, we estimate the following regression:
AORit = α + β1OSHit + + β3PROP_ODit + β4DUAL_DUMit
+ β5INSTit + β6BLK_DUMit + β7OP_HISTit + β8P_RETOWNit
+ β9DUM_87it + β10LEVit + β11AIPit + εit (1)
where:AOR = ORIPO firm less ORControl firm
OR = Profit before interest and tax divided by end-of-period total assetsOSH = Share ownership of original shareholders
PROP_OD = Proportion of outside directorsDUAL_DUM = 1 if the IPO firm has separation of CEO and chairperson,
0 otherwise INST = Share ownership of institutional investors
BLK_DUM = 1 if the IPO firm has blockholder presence, 0 otherwiseOP_HIST = Number of years operating history
P_RETOWN = Proportion of retained ownershipDUM_87 = 1 if the financial report is dated between August 1987 to
December 1988, 0 otherwiseLEV = Total liabilities divided by total assets AIP = Proportion of tangible assets to total assets.
Apart from the test variables of interest (i.e. measures of insider and block-holder ownership, board composition and leadership), we include several controlvariables. The additional control variables are the length of each firm’s prioroperating history (OP_HIST), leverage (LEV), a measure of the extent to whichthe firm is comprised of assets-in-place rather than growth options (AIP), pro-portion of retained ownership (P_RETOWN), and a dummy variable denotingwhether the financial year coincides with the period August 1987 through
β22OSHit

M. C. A. Balatbat et al. / Accounting and Finance 44 (2004) 299–328 321
© AFAANZ, 2004
December 1988 (DUM_87). We also include the square of our inside ownershipvariable (OSH2) to capture any non-linearity of the type identified by McConnelland Servaes (1990), and that is shown to occur for some Australian firms byCraswell et al. (1997). We estimate separate regressions for each of the first5 years post-listing, for all available surviving firms to that point.
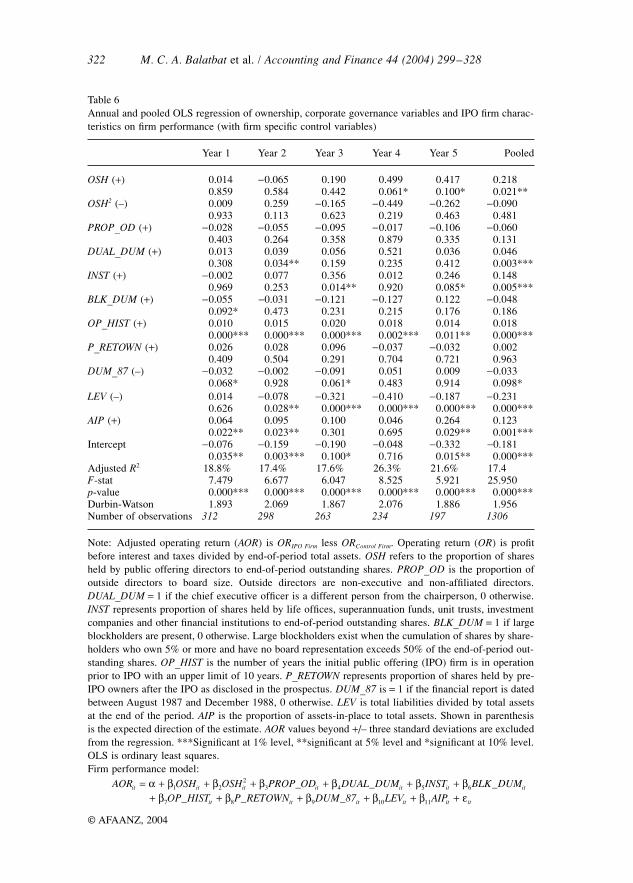
The results reported in Table 6 are consistent with OSH being significantlypositively related to performance, but only in years 4 and 5. There is no evid-ence of a statistically significant relation in the first 3 years post-listing. Hence,to the extent that insider ownership does impact on post-listing performance,it is not immediate. The insignificant coefficient for the square of our insiderownership measure OSH2 suggests there is no support for a curve-linear relationbetween insider ownership and firm performance of the type identified in sub-sets of Australian firms by Craswell et al. (1997).28
The proportion of outside directors (PROP_OD) also lacks significantexplanatory power. However, the lack of variation from year to year in thenumber of outside directors (i.e. many firms are constant at two) suggests thatthere is a need to identify alternative measures for capturing the monitoringskills of outside directors, rather than simply looking at the number and propor-tion of outside directors. For example, one could examine the frequency ofboard meetings and the number of these meetings attended by outside directors,as well as the existence of committees (e.g. audit committee, compensationcommittee) and the role of outside directors in these committees.
Results for our board leadership measure are not as strong as for the univariatetests discussed above. The coefficient on dual leadership structure (DUAL_DUM)is positive and significant only in year 2.29 However, institutional ownership(INST) is significant and in the expected direction in year 3 and year 5. The factthat these variables are significant in explaining the movements in adjustedoperating returns, but in alternate years, may be consistent with some degreeof substitution among ownership and governance attributes. The presenceof blockholders (BLK_DUM) affects firm performance only in year 1, andin the opposite direction to that predicted. Large shareholders may havea negative effect on the overall firm performance, providing some supportfor the contention that independent blockholders gear toward opportunisticbehaviour.
Among the control variables, the length of prior operating history (OP_HIST)appears to be the only robust explanatory variable. IPO firms with an
28 When the model is re-estimated using piecewise regression techniques to capture the non-linearrelationship in the manner suggested by Morck et al. (1988), the results show no improve-ment. This is consistent with results reported for Australian firms by Craswell et al. (1997).29 The results remain unchanged when board independence is included in the model in lieuof proportion of outside directors and leadership structure.
322 M. C. A. Balatbat et al. / Accounting and Finance 44 (2004) 299–328
© AFAANZ, 2004
Table 6Annual and pooled OLS regression of ownership, corporate governance variables and IPO firm charac-teristics on firm performance (with firm specific control variables)
Year 1 Year 2 Year 3 Year 4 Year 5 Pooled
OSH (+) 0.014 −0.065 0.190 0.499 0.417 0.2180.859 0.584 0.442 0.061* 0.100* 0.021**
OSH2 (–) 0.009 0.259 −0.165 −0.449 −0.262 −0.0900.933 0.113 0.623 0.219 0.463 0.481
PROP_OD (+) −0.028 −0.055 −0.095 −0.017 −0.106 −0.0600.403 0.264 0.358 0.879 0.335 0.131
DUAL_DUM (+) 0.013 0.039 0.056 0.521 0.036 0.0460.308 0.034** 0.159 0.235 0.412 0.003***
INST (+) −0.002 0.077 0.356 0.012 0.246 0.1480.969 0.253 0.014** 0.920 0.085* 0.005***
BLK_DUM (+) −0.055 −0.031 −0.121 −0.127 0.122 −0.0480.092* 0.473 0.231 0.215 0.176 0.186
OP_HIST (+) 0.010 0.015 0.020 0.018 0.014 0.0180.000*** 0.000*** 0.000*** 0.002*** 0.011** 0.000***
P_RETOWN (+) 0.026 0.028 0.096 −0.037 −0.032 0.0020.409 0.504 0.291 0.704 0.721 0.963
DUM_87 (–) −0.032 −0.002 −0.091 0.051 0.009 −0.0330.068* 0.928 0.061* 0.483 0.914 0.098*
LEV (–) 0.014 −0.078 −0.321 −0.410 −0.187 −0.2310.626 0.028** 0.000*** 0.000*** 0.000*** 0.000***
AIP (+) 0.064 0.095 0.100 0.046 0.264 0.1230.022** 0.023** 0.301 0.695 0.029** 0.001***
Intercept −0.076 −0.159 −0.190 −0.048 −0.332 −0.1810.035** 0.003*** 0.100* 0.716 0.015** 0.000***
Adjusted R2 18.8% 17.4% 17.6% 26.3% 21.6% 17.4F-stat 7.479 6.677 6.047 8.525 5.921 25.950p-value 0.000*** 0.000*** 0.000*** 0.000*** 0.000*** 0.000***Durbin-Watson 1.893 2.069 1.867 2.076 1.886 1.956Number of observations 312 298 263 234 197 1306
Note: Adjusted operating return (AOR) is ORIPO Firm less ORControl Firm. Operating return (OR) is profitbefore interest and taxes divided by end-of-period total assets. OSH refers to the proportion of sharesheld by public offering directors to end-of-period outstanding shares. PROP_OD is the proportion ofoutside directors to board size. Outside directors are non-executive and non-affiliated directors.DUAL_DUM = 1 if the chief executive officer is a different person from the chairperson, 0 otherwise.INST represents proportion of shares held by life offices, superannuation funds, unit trusts, investmentcompanies and other financial institutions to end-of-period outstanding shares. BLK_DUM = 1 if largeblockholders are present, 0 otherwise. Large blockholders exist when the cumulation of shares by share-holders who own 5% or more and have no board representation exceeds 50% of the end-of-period out-standing shares. OP_HIST is the number of years the initial public offering (IPO) firm is in operationprior to IPO with an upper limit of 10 years. P_RETOWN represents proportion of shares held by pre-IPO owners after the IPO as disclosed in the prospectus. DUM_87 is = 1 if the financial report is datedbetween August 1987 and December 1988, 0 otherwise. LEV is total liabilities divided by total assetsat the end of the period. AIP is the proportion of assets-in-place to total assets. Shown in parenthesisis the expected direction of the estimate. AOR values beyond +/– three standard deviations are excludedfrom the regression. ***Significant at 1% level, **significant at 5% level and *significant at 10% level.OLS is ordinary least squares.Firm performance model:
AOR OSH OSH PROP OD DUAL DUM INST BLK DUMOP HIST P RETOWN DUM LEV AIP
it it it it it it it
it it it it it it
_ _ _ _ _ _
= + + + + + ++ + + + + +α β β β β β β
β β β β β ε1 2
23 4 5 6
7 8 9 10 1187

M. C. A. Balatbat et al. / Accounting and Finance 44 (2004) 299–328 323
© AFAANZ, 2004
established operating history demonstrate better long-run operating performancethan young start-up firms. The DUM_87 variable is negative and significantin year 1 and year 3, implying weak support for the belief that firms performworst after a cold market. Firm-specific control variables such as leverage andassets-in-place have coefficients that are mostly significant and in the expecteddirection. Overall, the model explains 17 per cent to 26 per cent of the variationin our measure of control firm adjusted operating performance. When we poolall available firm years, our conclusions are largely unchanged.30
4.3. Endogenous managerial ownership
One potential explanation for our failure to identify an association betweenfirm performance and insider ownership may be the endogeneity of some vari-ables in the firm performance model. For example, insiders can increase theirownership stakes in an IPO firm by exercising stock options, or by purchasingmore shares when an IPO firm is performing well. Conversely, they can selltheir stakes when the IPO firm is performing poorly.31 Hence, the single equa-tion model reported in Table 6 possibly contains an endogenous explanatoryvariable (i.e. OSH). In such cases, ordinary least squares (OLS) regression isgenerally not the appropriate procedure to estimate the model’s parameters.OLS regression requires independent variables to be uncorrelated with thestandard errors of the model to obtain the best linear unbiased estimates.Proceeding with an OLS regression to estimate the parameters of the model mayresult in biased and inconsistent estimates.32
30 When we re-estimate the model using lagged independent variables, all results (and con-clusions) are qualitatively similar to those reported in Table 6. Adjusted R2 are 20 per cent,23 per cent, 33 per cent and 12 per cent in years 2, 3, 4 and 5, respectively. Moreover, thePearson correlation coefficients are within acceptable levels and collinearity diagnostics aremoderate. Specifically, the condition index of the model is 16.2 and variance inflation fac-tors (VIF) for all variables are less than 10 with the exception of OWN_OSH which has aVIF of 10.06. Gujarati (1995) suggests that a condition index (eigen values) between 10 and30 indicates moderate to strong multicollinearity and variance inflation factors >10 suggeststhat a variable is highly collinear. To further test whether multicollinearity is a concern, weran weighted least squares regressions using total assets as a weighting variable and theresults shown in Table 6 are robust.31 This may be a weak assumption because we use pre-IPO shareholder ownership as aproxy for inside ownership, and it is possible that the decision to go public was influencedby the intention of pre-IPO owners to diversify their investments. Regardless, it is stillreasonable to assume that shareholders are enticed to increase or maintain their shares inbetter performing IPO firms.32 We also recognize the possibility that the proportion of outside directors may be endo-genous (Weisbach, 1988). However, board composition is relatively stable across the first5 post-listing years, reducing concerns about causality between board composition andperformance.
324 M. C. A. Balatbat et al. / Accounting and Finance 44 (2004) 299–328
© AFAANZ, 2004
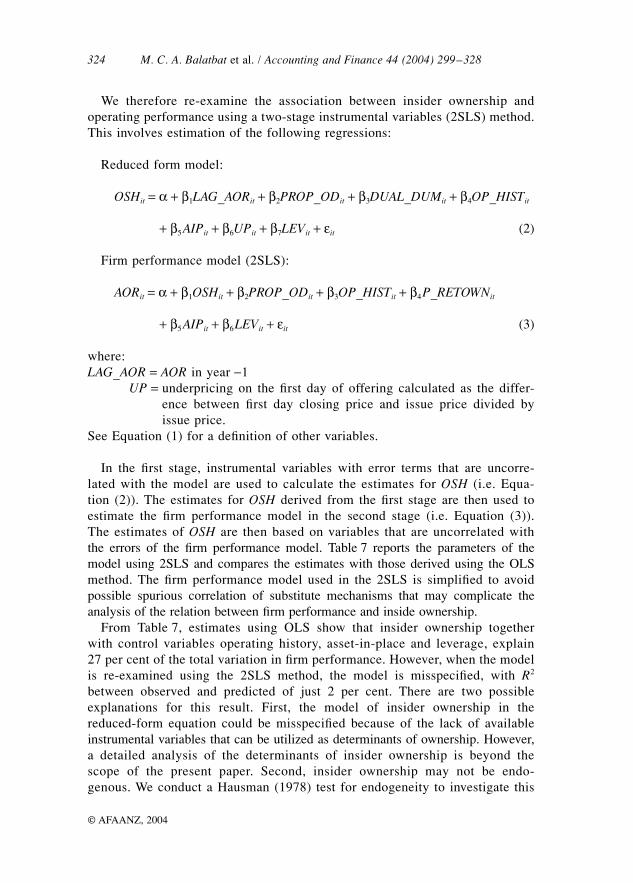
We therefore re-examine the association between insider ownership andoperating performance using a two-stage instrumental variables (2SLS) method.This involves estimation of the following regressions:
Reduced form model:
OSHit = α + β1LAG_AORit + β2PROP_ODit + β3DUAL_DUMit + β4OP_HISTit
+ β5AIPit + β6UPit + β7LEVit + εit (2)
Firm performance model (2SLS):
AORit = α + β1OSHit + β2PROP_ODit + β3OP_HISTit + β4P_RETOWNit
+ β5AIPit + β6LEVit + εit (3)
where:LAG_AOR = AOR in year −1
UP = underpricing on the first day of offering calculated as the differ-ence between first day closing price and issue price divided byissue price.
See Equation (1) for a definition of other variables.
In the first stage, instrumental variables with error terms that are uncorre-lated with the model are used to calculate the estimates for OSH (i.e. Equa-tion (2)). The estimates for OSH derived from the first stage are then used toestimate the firm performance model in the second stage (i.e. Equation (3)).The estimates of OSH are then based on variables that are uncorrelated withthe errors of the firm performance model. Table 7 reports the parameters of themodel using 2SLS and compares the estimates with those derived using the OLSmethod. The firm performance model used in the 2SLS is simplified to avoidpossible spurious correlation of substitute mechanisms that may complicate theanalysis of the relation between firm performance and inside ownership.
From Table 7, estimates using OLS show that insider ownership togetherwith control variables operating history, asset-in-place and leverage, explain27 per cent of the total variation in firm performance. However, when the modelis re-examined using the 2SLS method, the model is misspecified, with R2
between observed and predicted of just 2 per cent. There are two possibleexplanations for this result. First, the model of insider ownership in thereduced-form equation could be misspecified because of the lack of availableinstrumental variables that can be utilized as determinants of ownership. However,a detailed analysis of the determinants of insider ownership is beyond thescope of the present paper. Second, insider ownership may not be endo-genous. We conduct a Hausman (1978) test for endogeneity to investigate this

M. C. A. Balatbat et al. / Accounting and Finance 44 (2004) 299–328 325
© AFAANZ, 2004
Table 7Comparison between OLS and 2SLS regression models
OLS 2SLS
OSH (+) 0.144 −1.6400.000*** 0.038**
PROP_OD (+) −0.034 −0.3450.489 0.032**
OP_HIST (+) 0.020 0.0270.000*** 0.000***
P_RETOWN (+) −0.013 0.5250.749 0.034**
AIP (+) 0.149 0.0020.002*** 0.987
LEV(–) −0.259 −0.2590.000*** 0.000***
Constant −0.155 0.2740.003*** 0.192
Number of observations 994 994Adjusted R2 26.8%R2 between observed and predicted values 2.0%F-statistic 61.714 20.557p-value 0.000*** 0.000***Durbin-watson 1.973 2.137Hausman test (m = test statistic)
(χ2; six degrees of freedom)5.161
Note: Parameters of the two-stage instrumental variables approach (2SLS) regression are determinedin two stages. First, the predicted value for the endogenous variable OSH is determined using thereduced-form equation above. Second, the predicted value for OSH is used in the model to estimate theparameters using ordinary least squares (OLS) regression. Adjusted operating return (AOR) is ORIPO Firm
less ORControl Firm. Operating return (OR) is profit before interest and taxes divided by end-of-period totalassets. OSH represents the cumulated share ownership of initial public offerings (IPO) directors.Outside directors refer to the number of non-executive and non-affiliated directors. PROP_OD isproportion of outside directors to board size. DUAL_DUM = 1 when the chief executive officer and thechairperson are different persons, 0 otherwise. OP_HIST is the number of years in operation prior toIPO with an upper limit of 10 years. P_RETOWN represents the proportion of shares retained byprelisting owners immediately after the offering. AIP is assets-in-place divided by total assets. LEV isend-of-period total liabilities divided by total assets. UP is the first-day return to IPO subscribersdetermined by ((first day closing price less Issue price) divided by issue price]. Shown in parenthesisis the expected direction of the estimate. ***Significant at 1% level and ** significant at 5% level.Reduced form model:
OSHit = α + β1LAG_ORit + β2PROP_ODit + β3DUAL_DUMit + β4OP_HISTit + β5AIPit + β6UPit + β7LEVit + εit
Firm performance model (2SLS): AORit = α + β1OSHit + β2PROP_ODit + β3OP_HISTit + β4P_RETOWNit + β5AIPit + β6LEVit + εit
326 M. C. A. Balatbat et al. / Accounting and Finance 44 (2004) 299–328
© AFAANZ, 2004
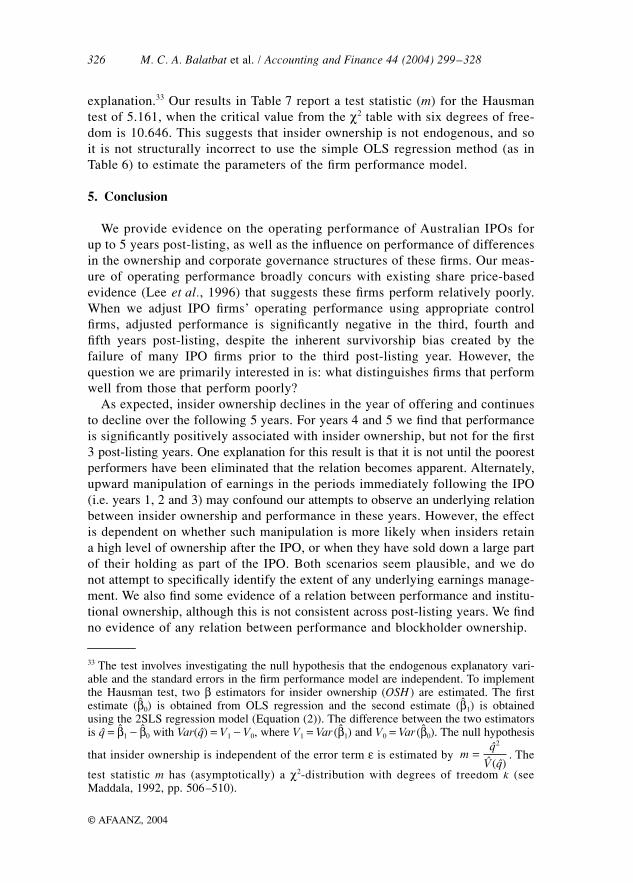
explanation.33 Our results in Table 7 report a test statistic (m) for the Hausmantest of 5.161, when the critical value from the χ2 table with six degrees of free-dom is 10.646. This suggests that insider ownership is not endogenous, and soit is not structurally incorrect to use the simple OLS regression method (as inTable 6) to estimate the parameters of the firm performance model.
5. Conclusion
We provide evidence on the operating performance of Australian IPOs forup to 5 years post-listing, as well as the influence on performance of differencesin the ownership and corporate governance structures of these firms. Our meas-ure of operating performance broadly concurs with existing share price-basedevidence (Lee et al., 1996) that suggests these firms perform relatively poorly.When we adjust IPO firms’ operating performance using appropriate controlfirms, adjusted performance is significantly negative in the third, fourth andfifth years post-listing, despite the inherent survivorship bias created by thefailure of many IPO firms prior to the third post-listing year. However, thequestion we are primarily interested in is: what distinguishes firms that performwell from those that perform poorly?
As expected, insider ownership declines in the year of offering and continuesto decline over the following 5 years. For years 4 and 5 we find that performanceis significantly positively associated with insider ownership, but not for the first3 post-listing years. One explanation for this result is that it is not until the poorestperformers have been eliminated that the relation becomes apparent. Alternately,upward manipulation of earnings in the periods immediately following the IPO(i.e. years 1, 2 and 3) may confound our attempts to observe an underlying relationbetween insider ownership and performance in these years. However, the effectis dependent on whether such manipulation is more likely when insiders retaina high level of ownership after the IPO, or when they have sold down a large partof their holding as part of the IPO. Both scenarios seem plausible, and we donot attempt to specifically identify the extent of any underlying earnings manage-ment. We also find some evidence of a relation between performance and institu-tional ownership, although this is not consistent across post-listing years. We findno evidence of any relation between performance and blockholder ownership.
33 The test involves investigating the null hypothesis that the endogenous explanatory vari-able and the standard errors in the firm performance model are independent. To implementthe Hausman test, two β estimators for insider ownership (OSH) are estimated. The firstestimate (50) is obtained from OLS regression and the second estimate (51) is obtainedusing the 2SLS regression model (Equation (2)). The difference between the two estimatorsis œ = 51 − 50 with Var(œ) = V1 − V0, where V1 = Var(51) and V0 = Var(50). The null hypothesis
that insider ownership is independent of the error term ε is estimated by . The
test statistic m has (asymptotically) a χ2-distribution with degrees of freedom k (seeMaddala, 1992, pp. 506–510).
m ( )
=œ
◊ œ
2

M. C. A. Balatbat et al. / Accounting and Finance 44 (2004) 299–328 327
© AFAANZ, 2004
We also extend prior US-based research to include the effect of corporategovernance attributes; namely, board composition and leadership. Our resultsshow no evidence that board composition impacts IPO firms’ operating per-formance, but there is evidence of dual board leadership (i.e. a separate CEOand chairperson) being positively related to firm performance, although thisevidence is weaker once we control for other factors associated with perform-ance, especially the length of prior operating history and capital structure. Allof our conclusions are robust to allowing for the possibility that insider owner-ship is endogenous, rather being an exogenous explanatory variable in a singleequation model. Indeed, the results suggest that, for IPO firms, insider owner-ship is not endogenous during the first 5 post-listing years.
Although some of our results seemingly support the views expressed by invest-ment bodies and regulatory agencies on issues concerning corporate governance,we caution against extrapolating beyond IPO firms, or indeed, our specific sampleof IPO firms. The circumstances faced by IPO firms may frequently rendermore traditional corporate governance practices irrelevant, especially as theyrelate to monitoring managers who provide highly firm-specific human capitalas a key component of the IPO firm’s value (Taylor and Whittred, 1998). However,it is also evident that there are legitimate grounds to support the view that IPOfirms underperform their non-IPO peers, and our accounting-based evidencesupports extant price-based evidence for Australian IPO firms. The precise causesof this underperformance remain an issue worthy of further investigation.
References
Arthur, N. 2001, Board composition as the outcome of an internal bargaining process:empirical evidence, Journal of Corporate Finance 7, 307–340.
Arthur, N., G. Garvey, P. Swan, and S. Taylor, 1993, Agency theory and ‘managementresearch’: a comment, Australian Journal of Management 18, 93–102.
Australian Investment Managers’ Association (AIMA), 1995, Corporate Governance: A guide forInvestment Managers and a Statement of Recommended Corporate Practice (AIMA, Sydney).
Balatbat, M. C. A., 2002, Operating performance of Australian IPO, its association withshare returns and the effect of delisting bias on operating returns, Working paper (Univer-sity of New South Wales, Sydney, NSW).
Barber, B. M. and J. D. Lyon, 1996, Detecting abnormal operating performance: the empiricalpower and specification of test statistics, Journal of Financial Economics 41, 359–399.
Barclay, M. J. and C. G. Holderness, 1991, Negotiated block trades and corporate control,Journal of Finance 46, 861–878.
Bosch Committee (Working Party of the Australian Institute of Company Directors), 1995,Corporate Practices and Conduct, 3rd edn (FT Pitman Publishing, Melbourne).
Brickley, J. A. and R. L. Terry, 1994, Outside directors and adoption of poison pills, Jour-nal of Financial Economics 35, 371–390.
Brickley, J. A., J. L. Coles and G. Jarrell, 1997, Leadership structure: separating CEO andchairman of the board, Journal of Corporate Finance 3, 189–220.
Byrd, J. W. and K. A. Hickman, 1992, Do outside directors monitor managers? Journal ofFinancial Economics 32, 195–221.
Cadbury, A., 1992, Report of the Committee on the Financial Aspects of Corporate Govern-ance (Gee Publishing, London).

328 M. C. A. Balatbat et al. / Accounting and Finance 44 (2004) 299–328
© AFAANZ, 2004
Craswell, A. T., S. L. Taylor and R. A. Saywell, 1997, Ownership structure and corporateperformance: Australian evidence, Pacific-Basin Finance Journal 5, 301–323.
Fama, E. F. and M. C. Jensen, 1983, Separation of ownership and control, Journal of Lawand Economics 26, 301–325.
Gujarati, D. N., 1995, Basic Econometrics (McGraw-Hill International Edition, New York).Hausman, J. A., 1978, Specification tests in econometrics, Econometrica 46, 1251–1271.Hermalin, B. E. and M. S. Weisbach, 1998, Endogenously chosen boards of directors and
their monitoring of the CEO, American Economic Review 88, 96–118.Holderness, C. G. and D. P. Sheehan, 1988, The role of majority shareholders in publicly
held corporations, Journal of Financial Economics 20, 317–346.Industry Commission, 1991, Availability of Capital (Australian Government Publishing
Service, Canberra).Jain, B. A. and O. Kini, 1994, The post-issue operating performance of IPO Firms, Journal
of Finance 49, 1699–1726.Jensen, M., 1993, The modern industrial revolution, exit, and the failure of internal control
systems, Journal of Finance 48, 831–880.Jensen, M. and W. H. Meckling, 1976, Theory of the firm: managerial behaviour, agency
costs and ownership structure, Journal of Financial Economics 3, 305–360.John, K. and L. W. Senbet, 1998, Corporate governance and board effectiveness, Journal of
Banking and Finance 22, 371–403.Lee, P. J., S. L. Taylor and T. S. Walter, 1996, Australian IPO pricing in the short and long-
run, Journal of Banking and Finance 20, 1189–1210.Loughran, T., J. Ritter and K. Rydqvist, 1994, Initial public offerings: international insights,
Pacific-Basin Finance Journal 2, 165–199.Mace, M. L., 1986, Directors: Myth and Reality (Harvard. Business School Press, Boston).Maddala, G. S., 1992, Introduction to Econometrics, 2nd edn (Prentice Hall, New Jersey).McConnell, J. and H. Servaes, 1990, Additional evidence on equity ownership and corpor-
ate value, Journal of Financial Economics 27, 595–613.Mikkelson, W. H. and R. S. Ruback, 1991, Targeted repurchases and common stock return,
Journal of Economics 22, 544–561.Mikkelson, W. H., M. Partch and K. Shah, 1997, Ownership and operating performance of
companies going public, Journal of Financial Economics 44, 281–307.Morck, R., A. Shleifer and R. W. Vishny, 1988, Management ownership and market valu-
ation: an empirical analysis, Journal of Financial Economics 20, 293–315.Pi, L. and S. G. Timme, 1993, Corporate control and bank efficiency, Journal of Banking
and Finance 17, 515–530.Pound, J., 1988, Proxy contests and the efficiency of shareholder oversight, Journal of
Financial Economics 20, 237–265.Shivdasani, A. and D. Yermack, 1998, CEO involvement in the selection of new board
members: an empirical analysis, Journal of Finance 54, 1829–1853.Short, H. and K., Keasey, 1997, Institutional shareholders and Corporate Governance in the
United Kingdom, in: K. Keasy, S. Thompson and M. Wright, eds., Corporate Govern-ance: Economic and Financial Issues (Oxford University Press, Oxford, 18–53).
Smith, M. P., 1996, Shareholder activism by institutional investors: evidence from CalPERs,Journal of Finance 51, 227–252.
Stapledon, G. P., 1996, Disincentives to activism by institutional investors in listed Austral-ian companies, Sydney Law Review 18, 152–192.
Stapledon, G. P. and J. J. Lawrence, 1997, Board composition, structure and independencein Australia’s largest listed companies, Melbourne University Law Review 21, 150–186.
Taylor, S. L. and G. Whittred, 1998, Security design and the allocation of voting rights:evidence from the Australian IPO market, Journal of Corporate Finance 4, 107–132.
Weisbach, M. S., 1988, Outside directors and CEO turnover, Journal of Financial Econom-ics 20, 431–460.