corporate governance in south africa - tips - · pdf filecorporate structure has changed...
TRANSCRIPT

_________________________________________________________________________________________
__________________________________________________________________________________________ 10-12 September, 2001
2001 Annual Forum at Misty Hills, Muldersdrift
Corporate Governance in South Africa
___________
Stephan Malherbe and Nick Segal
Genesis

Corporate Governance in South Africa
By Stephan Malherbe and Nick Segal
This paper was originally prepared for the OECD Development Centre
2001
Draft

2
Acknowledgements
This study represents the South African component in the research project on “Corporate Governance in Developing Economies and Emerging Economies,” initiated in 1999 by the OECD Development Centre. The other countries in the project are Argentina, Brazil, Chile, China, India and Malaysia.
The authors acknowledge fieldwork and research conducted by Robin Lee and Paul Semark, and assistance and advice especially in the early stages from Philip Armstrong, Ann Bernstein, Jim Leatt and Rias van Wyk.
They also gratefully acknowledge financial support provided by the Anglo American Chairman’s Fund, the Institute of Directors and the Johannesburg Stock Exchange.
The authors thank Charles Oman of the OECD Development Centre and the head of the project. They also thank Andrea Goldstein, Chad Leechor and other participants at a workshop, held in April 2000, at which an earlier version of this study was discussed.
Stephan Malherbe Genesis Analytics
Nick Segal Graduate School of Business, University of Cape Town

3
EXECUTIVE SUMMARY
By the late 1980s, many of South Africa’s corporations were bloated, unfocused and run by entrenched and complacent managers. These firms were sustained and tolerated by a very different environment from that in advanced economies and capital markets. The mainstay of the South African environment was isolation. Tariffs and political isolation shielded firms from foreign product competition, while financial sanctions kept international institutions out of the domestic capital market, and South African firms out of international capital markets. Corporate practices fell behind international norms, as did laws and regulations.
In 2001, little of that comfortable, introverted world remains. With political reform, engagement and change have replaced isolation and stasis. South African corporations, their managers and domestic shareholders have been exposed, in succession, to a new political system, rapid trade liberalisation, demanding international investors, an emerging markets crisis and rapid-fire regulatory reform.
Corporate structure has changed irrevocably. A decade ago, the six mining finance houses − corporate structures peculiar to South Africa, though reminiscent of the Japanese pre-War Zaibatsu, and formed in similar circumstances − dominated the economy. Today the mining finance house no longer exists. Along with the demise of the mining finance house, two of its widely imitated characteristics − diversified holdings and the entrenchment of control through pyramid structures − have fallen from favour. Conglomerates have been unbundled, and elaborate control structures dismantled. At the same time legislation, regulations, listing rules and accounting standards are converging to international norms.
The rapid changes are explained by the development path chosen by South Africa since becoming a democracy. Upon taking power in 1994, the government chose to eschew confiscation of property, and instead to seek growth, which, among other things, could fund expanded social services and more employment. To attain higher growth, South Africa will need to increase mobilisation of both domestic and foreign capital, as well as use that capital more efficiently. Hence the central role of the capital market and private firms in the government’s plans − a surprising policy choice that came at considerable political cost. Seen in this light, corporate governance, by which we mean the quality of corporate monitoring and decision-making, impacts both stability and growth prospects.
Stability. Modest debt-equity ratios and conservative banking practices enabled South African firms to avoid liquidity and solvency problems during the emerging markets crisis. A number of historic factors lie behind these

4
sound balance sheets. But in future, proper disclosure, governance and market oversight will be the most important check on corporate gearing and bank lending. Also, by reducing investor risk, sound governance should increase the use of equity and bond markets as capital-raising alternatives to the highly leveraged balance sheets of banks. The future resilience of South African corporations and banks to macroeconomic shocks is to some extent a governance issue.
Growth. Over the last five years, corporations have mobilised more than three-quarters of South Africa’s domestic savings, allocated and planned 85 percent of all investment, and currently own and manage three-quarters of the country’s capital stock. The better firms are at allocating and managing these resources, the higher the output growth that can be squeezed from South Africa’s modest accretion of capital stock. A knock-on effect of improved performance would be more attractive capital markets, and larger capital inflows. Conversely, misallocating resources to improve returns for control blocs, and shielding poor managements from the market for corporate control, will, if pervasive, reduce growth.
A deep equity culture. More than one-third of the assets of non-financial listed firms in South Africa was funded by the proceeds of equity issues, and more than half of recent asset growth in technology, media and telecommunications companies has been funded by fresh equity issues. However, the robustness of the primary market in equities has declined in the last two years, with new equity issuance virtually drying up, particularly for small and medium firms. Misgivings about the governance and leadership of smaller companies have played a role.
Forces for change. The most important force for corporate governance reform in South Africa has been the market. Market discipline imposed through falling equity prices has led to radical changes in corporate structure and conduct, among others the dismantling of the mining finance houses. Undoubtedly one element of South Africa’s equity culture, widespread executive share compensation, brought home the impact of market disenchantment. But the leading role was played by foreign institutional investors, who robustly criticised corporate structure, governance and performance upon their return to South African markets in 1994.
The government, regulatory agencies, the accountants’ profession and the stock exchange have also been forces for change, motivated largely by the desire to apply international standards in South Africa. New legislation against insider trading led to a palpable change in market attitudes and conduct, while improved listing requirements and accounting standards have eliminated some of the backlog of South African levels of disclosure compared to international practice.

5
Areas of poor performance. Disappointing progress has been made in the areas of director independence, director disclosure and the market for corporate control. A major factor has been opposition from among control blocs and family-owners of mid-sized companies on the Johannesburg bourse. However, in all three areas progress is imminent.
• The need for truly independent directors. While the influential (and voluntary) King code of corporate governance, released in 1994, stipulates that boards include non-executive directors, they are not required to be independent of management or control blocs. In addition, board chairmen are not required to be non-executive. An updated version of the King Code, to be released later this year, is expected to reverse both these genuflections to family-owned companies.
• A robust market for corporate control. The rarity of hostile take-overs in South Africa is a legacy of the clubby world of the mining finance house. Listed companies have used pyramid structures and differential voting shares to entrench the control of founding blocs with a minority stake. While market pressure has led to the dismantling of some of these arrangements, many remain. In an important move, the JSE will henceforth prohibit further listing of low-voting shares and shares of pyramid companies. But, establishing a vibrant market for corporate control will require more action. The regulations and institutions that monitor take-overs have to be strengthened, and boards, particularly independent directors, have to be trained as to their obligations and roles during take-overs.
• Disclosure of director remuneration. The new listing requirements of the JSE require disclosure of remuneration per director. Opposition from listed companies has led to a postponement of the introduction of this requirement until 2002. The strength of opposition has been surprising, and careful monitoring will be needed to ensure that the requirement is not effectively evaded.
Two dynamics that will influence the future shape of corporate structure and conduct, and of capital markets generally, in South Africa need to be mentioned.
• Institutions, tentatively, to the fore. As in other emerging markets, the regulators and business media in South Africa are under-resourced. It is also difficult for retail investors to monitor firms effectively. Institutions will need to take the lead. However, South Africa’s otherwise well-developed and sophisticated domestic institutions have not actively and publicly monitored corporate governance. There are also no collective investor boards such as those in the US and Britain. There may be some obstacles to this, not least of which close relations

6
between the institutions and large corporates. Sound corporate governance is unlikely to take hold in South Africa, and in emerging economies generally, without institutional investors playing the key role. Particularly important is the participation of domestic funds invested in a large number of locally listed firms.
• Whither capital markets on the periphery? Since 1997, South Africa has seen five of its eight largest publicly traded corporations shift their domicile and primary listing to the United Kingdom. The migration has markedly reduced the aggregate market capitalisation of primary-listed JSE firms, but trading volumes have not yet suffered. The moves were motivated by the need to raise large amounts of off-shore capital, and more than $5.1 billion has been raised by these firms since shifting. The objective for government policy-makers and the JSE is to maintain an effective equity market in South Africa for those firms that cannot or do not wish to raise capital in the international markets. At the same time, the advantages of a London listing need to analysed. One difference, certainly, is in the respective levels of corporate governance and take-over regulation and enforcement. From the perspective of the domestic capital market, convergence is now a matter of survival.

7
INTRODUCTION
Within thirty-six months, corporate governance has in South Africa changed from being a ‘soft’ mainly ethical issue to a ‘hard’ issue, recognised as pivotal to the success and revitalisation of the country’s capital markets and, ultimately, the prospects of the corporate economy. These high stakes have produced a succession of measures aimed at transforming corporate governance in the economy.
Why has this happened now? What are the consequences? Are there implications for other developing countries? This paper seeks to answer the first two of these questions directly and, in so doing, to allow the reader to consider the third.
First, some context. Any firm is governed within its particular corporate structure, and participants’ interests and mindset are important factors. In South Africa, these have always reflected the country’s political economy. Consider structure. At the start of the 1990s the economy was dominated by giant, centrally controlled diversified conglomerates with a domestic focus. This, as Section I explains, was a consequence of a tangle of political and economic factors.
Another legacy of South Africa’s development path is a deeply-rooted equity culture (see Section II). Corporates depend heavily on equity finance, and often turn to the comparatively large domestic equity market to raise capital. The Johannesburg Stock Exchange (JSE) provides a dynamic example of how such a market can nurture and cull new firms. ‘New economy’ and smaller ‘emerging’ companies in particular have taken advantage of this funding route. The role of equity finance is reflected in modest debt-to-equity ratios lending stability to the corporate sector.
The equity culture permeates the economy in many ways. For more than a decade share incentive schemes have formed a big part of the compensation of most senior executives. And the bulk of household savings have for a long time been invested mainly in equities. These savings are for the most part intermediated through domestic insurance and private pension fund institutions that are by emerging markets standards very large relative to the size of the economy.
Given the central role of equity financing, three major events since the mid-1990s have provided the impetus for overhauling corporate governance.
First, South Africa re-entered the global economy in the mid-1990s. Sharp falls in equity prices registered both the competitive pressures on firms and the disenchantment of particularly foreign investors with
8
distortionary governance structures and practices (these are described in Section III).
The second focusing event was the emerging markets crisis of 1997-1998. The early consensus is that widespread poor governance had prepared the ground for crisis in the worst-hit countries. If this view is accurate then the negative externalities of poor governance in developing societies are bigger than previously realised, and better governance becomes a prerequisite for long-term macroeconomic stability.
Third, since late 1998 new equity issues in the domestic market have virtually come to a halt, most markedly for small and medium-sized companies (see Section II).
The problems in raising equity capital are, to be sure, partly cyclical, but there are some signs of a structural shift. South Africa’s most active multinationals − in mining, beer, computer networking and retail financial services − have shifted domicile and primary listing to London in search of cheaper funding. A part of the appeal to off-shore investors has been the prospect of improved corporate governance in the new jurisdiction. It is not yet clear how far this trend will go, and how it will affect the health of the domestic market.
What is more, the lack of funding for smaller firms seems to be tied in part to widespread investor perception that they are unable to assess and monitor the managements of these firms. These developments at both ends of the corporate size spectrum − both mirroring trends in some other emerging markets − threaten the health of South Africa’s domestic capital markets.
In the face of these pressures, the practice and regulation of corporate governance in South Africa are in the midst of a wholesale renewal involving various actors and mechanisms (see Section IV):
Capital markets have forced governance changes. Pressure by global providers of capital on the country’s largest corporates, the mining finance houses, has culminated in a radical overhaul of their structure, strategy and governance.
Domestic institutional investors are shifting into a new role concerning the governance of the firms they are invested in. The large institutions have shifted from a controlling (or at least board-represented) interest in their largest investments to a more indirect role in monitoring governance and performance.
The legislator has achieved signal success in the governance field with new legislation against insider trading. There is also renewed emphasis on corporate and director liability.

9
Self-regulation, via the Johannesburg Stock Exchange, has led to proposals for novel and significantly more stringent corporate governance requirements to counteract the detrimental developments of the last few years.
An early exercise in voluntary compliance, the King Code, is being revisited and strengthened.
The story told in these pages has been playing out against a backdrop of dramatic political change in South Africa. The end of apartheid could have occasioned a radical reassessment of the role of private corporations in the South African economy. In the event, the post-1994 government has put markets and private firms at the centre of its economic strategy. Given the scarcity of savings and the need for growth, the government has recognised that a capital market that effectively mobilises and allocates capital is a priority, and much of the government’s corporate governance reform has been aimed at this.
Continued political acceptance of the role of corporations requires that black South Africans make rapid strides as owners, leaders and managers of corporations. This process, known as black empowerment, is discussed in Section V, while the involvement of business in political processes is discussed in Section VI.

10
I WINDFALL AND DISASTER: CORPORATIONS IN SOUTH AFRICA’S POLITICAL ECONOMY
South African history, the historian CW de Kiewiet once observed, tends to proceed by economic windfall and political disaster. The geological windfall of large precious mineral deposits and the extended political disaster of apartheid explain much about how South Africa’s corporate sector developed.
As mining was almost wholly left to private sector corporations, corporate South Africa has, ever since the late 19th century, been central to the country’s investment, output and export performance. State-owned enterprises gained in importance from the 1920s, particularly in the power, telecommunications and transport sectors. Below some broad indicators are used to sketch the economic contribution of the private and state-owned corporations. Unfortunately, due to data unavailability, the respective contributions of foreign-owned subsidiaries, listed companies and unlisted companies cannot be isolated.
In the second part of this section the causal arrow is turned, and the effect of the country’s political economy on the structure, conduct and governance of corporations described.
The economic role of the corporate sector in South Africa Private and state-owned corporations produce the bulk of South Africa’s output and exports, manage most of its capital stock, are central to the allocation of investment and are responsible for virtually all of the country’s savings.
Managing the bulk of the country’s productive capacity. As table 1 shows, three-quarters of South Africa’s productive capacity, or capital stock, is owned by business corporations. Over the last five decades, with limited fluctuations, private corporations have owned half of the country’s capital stock, while state-owned enterprises currently control about one-third. Hence the economic relevance of corporate governance. The corporation is the dominant structure within which the country’s productive assets are managed, and the arrangements, incentives and habits of corporate governance determine how effectively this is done.

11
Table 1. Corporate control over South Africa’s capital stock: 1950-1999 Source: SA Reserve Bank
*Real growth is expressed as compound average annual growth.
While private corporations have for a century controlled a large part of the country’s productive capacity, the role of the SOEs is more recent. At the end of the Second World War, SOEs owned less than 5 percent of total capital stock. During the next thirty-five years the SOE share in capital stock increased rapidly, peaking at 25 percent of the national total in 1990. This was not as a result of nationalisation, but of the National Party’s use of SOEs to effect industrialisation and self-reliance. The high point of the SOE expansion phase occurred in the 1970s, during which the capital stock controlled by SOEs tripled in real terms. Much of this expansion occurred in the energy and transport sectors, with the building of oil-from-coal plants by Sasol (subsequently privatised) and power plants by the electricity utility Eskom.
From the early 1980s, the government became uncomfortable with its managerial role over such a large part of the corporate economy and embarked on a limited privatisation programme. This was halted during the transition to democracy in the early 1990s, as the ANC at that point espoused nationalisation. The recent sale of stakes in certain SOEs to foreign operators and to cede to them operational control means that private sector firms manage some parts of the capital stock officially counted as under SOE control.
Role in the allocation of capital. In South Africa, control over the allocation of capital occurs at many levels. The retail investor exercises a choice of financial intermediary (bank, insurance company or investment house); the intermediary makes usually functionally separate decisions about which instrument (debt, equity or loan) to invest in, as well as which sector; ultimately capital is entrusted to an end-user. The end-user, though constrained by the decisions made by the providers of finance, plays the key role in investing (or consuming) the resources. Therefore the end-user’s incentive structures, monitoring mechanisms and decision-making processes are important to the efficacy of capital allocation in the South African economy.
Private
corporations SOEs Corporate sector
Private corporations SOEs Economy
1950-59 154.1 56.0 5.5 61.5 4.7 7.9 4.9 1960-69 154.1 51.8 6.4 58.3 3.8 7.8 4.7 1970-79 180.9 46.4 11.2 57.6 4.0 12.2 5.4 1980-89 216.2 44.0 16.6 60.6 3.2 0.7 2.4 1990-99 220.8 51.2 23.5 74.7 2.0 0.1 1.0 1990-1994 226.1 49.7 24.4 74.1 1.2 0.5 0.5 1995-1999 215.5 52.8 22.5 75.2 2.1 0.1 1.3
Total capital stock as % of
GDP
% of total capital stock held by Real growth in capital stock (%)*

12
The investment statistics of the SA Reserve Bank show that the corporate sector has always been the main agent of investment in the South African economy, a trend that has increased in recent years as government capital spending fell (Table 2). During the 1990s, corporations were responsible for 83 percent of South Africa’s investment, giving them a critical role in the allocation of capital in the country. Private corporations have increased their share investment, and are now responsible for more than 70 percent of gross domestic investment, has increased. Table 2. The role of corporations in domestic investment: 1950-1999 Source: SA Reserve Bank
*Real growth is expressed as compound average annual growth.
Table 3. Savings behaviour and composition in South Africa: 1950-1999 Source: SA Reserve Bank
Main source of national savings. South Africa is unusual in that the non-financial corporate sector is central to the mobilisation of capital. According to Table 3, during the 1990s the savings of privately-owned corporations amounted to 72 percent of gross domestic savings, and that of SOEs to 33 percent (total corporate savings exceed 100 percent of gross domestic savings, because the rest of the economy (households and government) are, taken together, dissavers). Gross corporate savings is defined as retained earnings plus depreciation written off during the period. During the second half of the 1990s, private corporations increased their contribution to gross domestic savings to 76 percent, as household savings plummeted. The current contribution of private corporate savings is unprecedented, significantly higher than its traditionally contribution of about half of gross domestic savings.
Private corporations
SOEsGeneral
governmentHouseholds
1950-59 20.2 51.9 5.0 25.1 18.01960-69 23.7 40.8 5.1 24.6 29.61970-79 25.2 44.8 11.2 20.2 23.91980-89 24.3 56.8 21.5 8.0 13.71990-99 16.3 72.1 33.1 -14.7 9.5 1990-1994 17.4 68.5 33.6 -15.5 13.4 1995-1999 15.1 76.1 32.5 -13.7 5.1
Composition of gross domestic savings (%)GDS as % of
GDP
Private
corporations SOEs Corporate sector
Private corporations SOEs Economy
1950-59 23.6 63.4 7.5 71.0 1.5 4.8 3.5 1960-69 23.8 59.7 8.7 68.3 6.6 12.4 7.0 1970-79 27.6 51.9 16.1 68.1 0.8 8.4 2.1 1980-89 23.7 57.9 18.1 76.1 -0.7 -5.9 -2.0 1990-99 16.3 70.2 13.3 83.5 0.6 1.7 -0.1 1990-1994 16.2 68.7 12.9 81.5 1.7 -4.5 -0.1 1995-1999 16.4 71.7 13.8 85.5 -1.9 3.3 -0.9
% of total GDI by Real growth in gross investment (%)* GDI as % of GDP

13
South Africa’s savings performance lags that of the developing world, having fallen from 24 percent (roughly the current developing world average) in the 1980s to around 15 percent during the late 1990s. Although the government has sharply reduced its dissaving, household (or personal) savings have collapsed (see Table 4), achieving a level in 1999 less than one-tenth in real terms of the levels of the 1980.1 Table 4. Real growth in savings in South Africa per category: 1950-1999 Source: SA Reserve Bank
The savings picture has two important consequences:
The reliance on corporate savings means that corporations play a critical role not only when capital is transformed into machinery and mortar, but also earlier, when savings are entrusted to the financial system or reinvested internally.
The dismal level of domestic savings creates a need for large-scale portfolio and other inflows to finance investment levels that would be consistent with higher growth. Such flows, heeding the lessons of the Asian crisis, increasingly require proper standards of corporate governance.
Output. The South African authorities do not publish an institutional breakdown of GDP. However a rough estimate of corporate output can be made with the help of the sector breakdown. Of the 11 main sectors, in five virtually all production is in the hands of private sector corporations. These are: mining, manufacturing, construction, wholesale and retail trade, and financial and business services. During the 1990s, these sectors dominated by the private corporate institutional form contributed 61.9 percent of GDP. Two sectors dominated by state-owned corporations − electricity, gas and water, and transport and communications − provided a further 12.5 percent of GDP. Therefore almost three-quarters of South Africa’s GDP is produced within corporate structures. These proportions are not dissimilar to those of 1 World Development Indicators 2000, The World Bank, www.worldbank.org. The high developing world averages reflect, among other things, the strong savings performance in East Asia.
The economy
(GDS)
Private corporations
SOEsGeneral
governmentHouseholds
1950-59 10.4 5.5 9.2 10.8 n/a1960-69 5.6 4.8 8.6 6.5 5.51970-79 6.6 8.2 17.3 -1.8 6.01980-89 -1.2 1.3 -0.1 -11.7 -5.11990-99 -3.0 -1.3 1.6 n/a -24.8 1990-1994 -5.3 -1.3 7.8 n/a -12.0 1995-1999 -0.6 -1.4 -4.2 n/a -35.8
Compound annual growth rate (%) of savings in real terms by

14
the post-War era, during which corporate organisation of output if anything gradually increased in importance.
Exports. South Africa’s exports are not classified according to the institutional form of the exporter or producer. A conservative estimate is that corporate production systems were responsible for between 76 and 80 percent of all exports during the 1990s. Corporate exports are probably dominated by companies that are not state-owned, are listed on the Johannesburg Stock Exchange and for the most part South African owned or owned by South African companies that have recently shifted domicile to the United Kingdom.
How the political economy shaped corporate structure & conduct How did the economic windfall of gold deposits and the political disaster of segregation shape the South African corporation? This section considers how geology and politics placed a particular stamp on corporate structure and conduct for most of the twentieth century, and then describes how internal and external forces caused the rapid unravelling of that model during the last ten years (as evidenced by the fall in growth shown in Table 5).
Table 5. The South African economy: the long view
Source: SA Reserve Bank *Expressed as the compound average annual growth rate
The rise of the mining finance house. By the 1990s the South African economy was epitomised by a small number of giant business groups, of which the most prominent were the mining finance houses. The groups were characterised by diverse operations, an inward focus, intra-group transactions, and control blocs and disempowered minorities. In these firms family control had always been important. Hence a prevalence of pyramid control structures, differential voting shares and cross-holdings, and a correspondingly low incidence of changes in corporate control, with a
Percent Real GDPGrowth*
Capital stock (% of GDP)
GDI (% of GDP)
GDS (% of GDP)
1910-19 5.5 66.9 10.9 n/a1920-29 0.2 81.9 8.4 n/a1930-39 5.4 96.5 11.3 n/a1940-49 3.5 119.9 19.5 n/a1950-59 4.2 154.1 23.6 20.21960-69 5.2 154.1 23.8 23.71970-79 2.7 180.9 27.6 25.21980-89 1.5 216.2 23.7 24.31990-99 1.3 220.8 16.3 16.3

15
virtual absence of hostile takeovers. The houses were notable for their continuity. All seven major houses at the end of World War II still dominated mining, and much else, in 1990 (although two had joined forces, and one had merged with an industrial company). The corporate and industry structure among the houses in 1990 was virtually identical with that of 1946.
While the houses were formed, in the late 19th and early 20th century, to exploit the Johannesburg gold deposits and ultimately financed the national gold mining industry, they eventually ingested the diamond industry, pioneered coal and platinum mining, and funded the country’s manufacturing base. The houses were central to the development of South Africa’s capital and money markets, and at times owned important stakes in South Africa’s largest banks. Little wonder that the financial structures and decision-making habits of the houses ultimately permeated the entire private corporate sector
The mining finance house structure was fashioned according to the needs of the industry. The Witwatersrand gold deposits, though plentiful, were deep below the surface, usually in reefs with relatively low gold content. The exploitation of these deposits required organisations that could mobilise both capital and scarce mining engineering skills on a large scale. Also, the uncertain pay-off of any particular dig encouraged firms to consolidate their holdings into large firms with many properties. While this describes the conditions at the time of the discovery of gold in South Africa, similar considerations of risk, scale and skills also applied to the various subsequent bursts of development of South Africa’s geological base.
So, after making a geological discovery, houses floated the mining development on the Johannesburg Stock Exchange to obtain the development capital required, while maintaining management control. The reputation of the mining finance house was key to obtaining the capital, given the extreme information disadvantage of particularly the foreign investor with respect to the feasibility of the venture to be floated. The only way money could be raised was if a mining house sponsored the mine by putting its reputation and significant equity capital behind the new venture. Note the use of equity capital: in mining lies the root of South Africa’s strong equity culture and market.
In this way, considerations of capital-raising and the optimal use of scarce skills led to the mining finance house structure that dominated for most of the 20th century. Its key features were used in development after development:
Finding new opportunities through exploration or purchase of mining rights.

16
Mobilising capital thorough sponsored listing of mines over which management control is retained. Minorities provide the fresh capital.
Central provision of skills: mining engineering for development of the mine, geology and metallurgy for the on-going running of the mine, accounting, legal and treasury services.
Central purchasing department for material, to benefit from scale economies.
Diversification, which gained speed after 1960.
An integral part of system was the provision of scarce skills and capabilities by the mining finance house to the operating mine. In this way resources were effectively used, but at the same time it built related-party transactions into the structure: the mining finance house was, in current governance parlance, nothing more than a control bloc engaged in an on-going flow of transactions with the operating mine, with the extent and terms of transactions determined by the house. The house-mine transactions ultimately encompassed tied and exclusive provision of services from the house to the mine, as well as various service fees payable to the house, some of which were simply calculated as a proportion of the revenues of the mine, and not linked to the delivery of specific services or to any performance objectives.
Ultimately many of the corporate structures and conduct that had evolved to meet the needs and interests of the mining pioneers would permeate to the rest of the economy. But, powerful as they were, the houses were not a world unto themselves. Around them a political system was being built up.
The apartheid hothouse. How did South Africa’s evolving politics and policy, and particularly segregation, affect corporations? South African racial politics intruded in corporate boardrooms in many ways, not least in determining that corporate ownership and leadership would be overwhelmingly white (this remains true today). Other effects, more subtle and indirect, explain much about the structure, governance and mindset of South African business firms. Firms and their owners often benefited from apartheid measures and, surprisingly, quite often did not.2
The surprise is easily explained. Policy during the founding years of apartheid, 1910-1960, were for the most part a direct expression of white democracy, populism and Afrikaans identity. Only for two comparatively 2 The tabulation of the benefits and costs of apartheid to business firms, and the attitudes of the business sector to the main tenets of apartheid have been subject to much academic investigation: the reader is referred to Lipton’s magisterial work in this area, Capitalism and Apartheid. Business did play an active role in the transition to democracy, being active in negotiation forums with black unions for a long period, lobbying for change from the mid-1980s and providing the secretariat to the transitional talks in the early 1990s.

17
brief periods (1920-24 and during the Second World War) was political power exercised primarily on the part of, respectively, mining capital and urban capital. For most of the founding years, capital was in opposition, and governments depended on the support of white labour and the white agricultural sector 3 Both these groups were predominantly Afrikaans and formed the core constituency of the Afrikaner Nationalism movement. Between 1924 and 1960, then, a framework of policies, of which the kingpin became apartheid, was put in place to protect the interests and values and identity, of white labour and white agriculture. 4 The main apartheid policy elements impinging on business firms were:
• Strengthening the white working class. White workers received strong organisational and other support from government policy. As early as 1924-25, tariff protection and access to government tenders were made conditional on preferential hiring of white workers at high rates of pay. At the same time, legislation provided for white trade unions and gave white workers a key role in determining occupational structure, access to training and determination of industry minimum wages. Whites were also given access to superior schooling.
• The emasculation of black labour: blacks received rudimentary schooling, were forbidden to organise trade unions or engage in collective action; many were forcibly removed to rural areas distant from centres of economic activity, were widely forbidden (if not always successfully) to work in urban centres, and were, in mining operations, proscribed by law from filling skilled and better-paid jobs. The apparent contradictions in these policies are resolved by the insight that they were put in place to reduce competition faced by white workers.
• Protection to extract rents from consumers. The apartheid labour policies raised costs for manufacturers.5 Add to that other costs of sustaining the apartheid state, and it was clear that South African manufacturers could not survive in open competition. Therefore trade protection was sharply increased in 1925-26 as a companion strategy to that of increasing the rents accruing to labour. Both sides of this policy equation, white labour power and protection for industry, would be reinforced in the 1950s, following the coming to power of another white-populist government, that of the National Party.6
• State patronage to advance group interests. The state intervened in the development process as entrepreneur, regulator and owner. The state expanded its activities in the industrial sector in two spurts − the
3 Lipton M, Capitalism and Apartheid, (Wildwood House/David Philip, 1986), 256. 4 Lipton 256. 5 Lipton 242. 6 Davis G A, South African Managed Trade Policy, (Praeger, 1994) 13-15.

18
mid-1920s and the 1950s − correlated with the regaining of power by strongly white-populist governments. By 1960 state-owned companies dominated rail transport, steel, telecommunications, postal services, airlines and air cargo, the ports, pipelines, oil and gas exploration, oil-from-coal extraction and armaments manufacture. Many of these state-owned enterprises were granted statutory monopolies. The parastatal monopolies were aggressively used to provide employment for surplus white (mainly Afrikaans) unskilled workers, and eventually to create an Afrikaans-speaking managerial class. These efforts were effectively funded by rents extracted from the rest of the economy through monopoly pricing and the tax regime.
While the racial social engineering was unique, some of this framework will seem similar to the policies of countries in Latin America and elsewhere at the time. In that respect South Africa was part of the pattern of domestic protection and import replacement strategies in vogue from the 1930s onward.
Apartheid measures were an unambiguous loss to the economy and society. But the success of manufacturing protectionism in establishing a vibrant and diversified base of economic activity and industrial knowledge should not be gainsaid. During 1961-65, real manufacturing output growth averaged 10 percent per year, and during 1966-1970, 7.4 percent. By the 1970s, the area around Johannesburg had become the largest area of industrial activity south of Turin. By 1990, manufacturing produced 25 percent of gross domestic product and services 52 percent, while mining contributed less than ten percent. As this discussion points out, much of this activity occurred in distorted markets, but it established an economy entirely different from any other in sub-Saharan Africa, despite large mineral deposits in a number of other countries.
Corporations in the hothouse economy. For businesses, government policies during the era came down to this: high costs imposed by segregation, compensated for by safe profit margins made possible by strenuous protection against foreign competition. The profound effects of this on corporations and how they were managed and governed are illustrated by the events from 1960 onward. In that year, a violent suppression of a political demonstration in the black township of Sharpeville set off a capital flight. This resulted in the imposition of exchange controls on resident individuals and companies, elements of which are still in force today. 1960 also saw organised international opposition to apartheid, and the country left the British Commonwealth. This was the start of the slow and relentless accumulation of economic sanctions by foreign countries, limiting access to foreign markets and capital. Product market protectionism was now reinforced by strict controls on financial outflows and increasing political

19
isolation. The country was gradually slipping into autarky, and the business environment reflected this.
Corporations focus inward. Consider how the costs of segregation and ubiquitous protection distorted the opportunities faced by managers in manufacturing and services. The costs − and small scale − all but ensured that a business’s core product could not be sold profitably in export markets at world prices. The protection ensured that there were rich opportunities available domestically, often in unrelated markets. The rational response was to diversify domestically, rather than to specialise internationally. Political isolation reinforced these tendencies, which offer a sharp contrast to the export orientation of the economic success stories of Asia.
Weaker capital markets supervision. A similar combination of isolation and distortion operated in the financial sector. The savings flows mobilised by South Africa’s financial institutions were confined to the domestic market, and found a ready outlet in South African firms. These flows were principally intermediated by two life insurers, Old Mutual and Sanlam, both of which were mutually owned by their policy-holders. In practice this meant negligible owner supervision over strong and independent management teams, as voting procedures were dominated by management. A self-perpetuating management elite was created. The insurers built up important stakes in virtually all large listed South African corporates, and assumed directorships on the boards of these companies (the role of the mutually-owned insurance companies and their eventual demutualisation are discussed in a box at the end of the section).
Yet, in the clubby world of South African business, institutional shareholders rarely exercised effective monitoring over their investments, and equally rarely − given their limited options − voted with their feet. The market for corporate control barely existed. In fact, the mining finance house, conglomerate, family control and insurance mutual structures all served to protect incumbent managers. And related-party transactions within mining finance houses and conglomerates were so ubiquitous that they were barely remarked upon by minority shareholders or any-one else.
Mining houses as an instrument of capital allocation. The truncated access of South African firms to international capital markets and investment opportunities precluded the mining finance houses from pursuing the most natural path of expansion: to be a conduit of capital from the international financial centres to mining opportunities in

20
high-risk developing environments. Instead of becoming global mining specialists, the houses became diversified national conglomerates.
By 1960, when the major Free State gold fields had been developed, the capital needs of the gold mines slowed and the surpluses of the industry increased. Now the mining finance house model was turned on its head. Designed to mobilise capital, it now became a source and allocator of capital, not only in mining activities but increasingly in the rest of the economy, as domestic mining proved unable to absorb all the capital it was now generating. Industrial companies, many of whom were expanding behind the country’s high tariff barriers, eagerly absorbed the surpluses generated by mining.
The centralised structures of control that worked well for mobilising capital and skills for mines were less appropriate for allocating capital to unrelated ventures. And the very success of the mining activities allowed managers to become complacent and passive. Together, these trends would lessen capital-market discipline on the houses while at the same time causing their businesses to become more complex.
For the most part, the rest of the non-communist world was practising another model of capitalism, characterised by intermediation through capital markets and the banking system. The powerful and flexible nature of these intermediaries allowed for specialisation and for experiments with variations in control structure, supervision and level of diversification. They more readily financed new entrants into product markets. The South African mining finance house model of industrial investment and control tended to be static and protective of existing commercial interests and alliances.
Figure 1. Annual change in labour productivity (%): 1970-1999 Source: SA Reserve Bank
-4
-3
-2
-1
0
1
2
3
4
5
6
1970 1972 1974 1976 1978 1980 1982 1984 1986 1988 1990 1992 1994 1996 1998
Percent change over past year

21
Distortions and weaknesses Over time, corporate South Africa, and ultimately, the economy, began to display the maladies of autarky: weak competition, falling cost competitiveness and management complacency. One economy-wide indicator of weakness can be gleaned from Figure 1. By the 1970s and 1980s, labour productivity had become essentially stagnant, despite a steadily increasing amount of physical capital per worker. At the corporate level, three consequences of apartheid autarky were particularly damaging:
Market concentration. The South African economy has always been a tiny fraction of the global economy. Isolation from foreign suppliers of goods and services consigned a large number of product markets to one or two domestic producers. These often produced at a sub-optimal scale; also, circumstances were conducive to collusion. The prevalence of so-called import-parity pricing − whereby products are priced no lower than the tariff-inflated import prices − confirmed the lack of domestic competition.
Low levels of market competition did not have a single cause. Factors include production and distribution technology (high fixed cost relative to total market size); conglomerates’ preferential use of in-house providers; the powerful strategic position of cash-rich established firms; and the unwillingness of the capital market to finance newcomers. Whatever the causes, the lack of competition allowed firms to pass on high costs throughout the economy. Managers in protected manufacturing markets could to an extent set their own prices, a situation forgiving of lax cost management.
Falling competitiveness. Apartheid protectionism proved to be devastating for the cost competitiveness of South African firms. The costs of apartheid were reflected in the cost structure of every firm. Low investment in human capital began to take a toll. Given the opportunity to operate profitably in small markets, manufacturers were locked into operations at sub-optimal scale. The lack of competition bred laziness and complacency. The increasing isolation tended to erode what little there was in terms of external market positions.
Further, the protection regime was not the result of a considered approach to industrial development. By the mid-1970s protection rates were a mishmash of contradictory signals, with effective protection rates ranging from –24 to 94 percent (negative effective protection occurs when a processed good has a lower rate of protection than that of its inputs, effectively penalising the processing activity).7
7 Davis 17.

22
A closed and complacent managerial mindset. In the inert commercial environment promoted by the high level of protection, a market position, once achieved, became a franchise: stable, profitable and well protected against rivals. The market position, requiring little further management, became an asset in itself. This resonated with the mining industry, where a good deposit, once secured and the production infrastructure put in place, required little active management. So the South African management mindset was trained on the acquisition of assets in a stable environment, and not the active management of a business in a constantly changing one. As the 20th century drew to a close, global management challenges were the exact opposite.
The brave new world of the 1990s The political transition ushered in in the early 1990s resulted in the country’s first fully democratic election in 1994. The new ANC government, despite a long-standing ideological commitment to socialism, embarked on far-reaching economic reforms. These included a progressive reduction of import tariffs and similarly removal of exchange controls. Underlying these and other macro policies was a recognition that, to augment the country’s low savings, South Africa had to engage with the global economy if it was to attract foreign investment.
Within only a few years, the main building blocks of apartheid autarky had been dismantled. The inefficiencies engendered and tolerated by the traditional corporate structures were starkly revealed. The market response was brutal, not least on the part of foreign portfolio investors, who had become price-setters for the equities of South Africa’s larger companies.
Mining finance houses were down-graded and they traded at a large discount to the value of their holdings.
Diversified industrial companies saw large profit squeezes from tariff reform, and their business portfolios were questioned by the market.
Family-controlled firms, particularly where control was buttressed by share pyramids or differential voting shares, lost the favour of the market.
The mutually-owned insurers, requiring capital to expand their operations internationally, came under pressure to demutualise.
The government was under strong pressure to privatise state-owned enterprises − in telecommunications, postal services, transport, power and other utilities − or to allow more competition in these sectors.
Government and others called for a rapid increase in black ownership of publicly traded companies.

23
A new model of corporate structure and governance was called for. The gradual development of this model is the main theme of Section IV. First, the depth of South Africa’s equity culture, and the effect on how corporate activity is funded, are investigated.

24
South Africa’s Life Insurers: From Mutual to Shareholder Control
Why did the mutual structure entrench management?
South Africa’s mutually-owned insurers were owned and therefore ostensibly controlled by their policy-holders. Upon purchase of a life policy, the purchaser would gain a vote in the company’s proceedings. This resulted in a highly diffuse voting corps, with large voting blocs entirely absent. This situation is reminiscent of the Berle and Means view of the corporation, and led to the same collective-action problem identified by them. No policy-holder had sufficient incentive to justify the burden of aggregating policy-holders’ votes to oppose management. The mutual structure meant that the factors usually behind the aggregation of votes against the status quo − corporate take-over and well-resourced institutional investors with large holdings − were absent. Hence the entrenched position of management.
Other factors may also have played a role. Commonly all employees of a mutual took out a small policy upon being appointed. At general meetings, usually held at the companies main offices, employees, unstintingly loyal to management, were disproportionately represented. Also, the mutual’s performance would have been difficult for policy-holders to assess, given the opacity and complexity of life-policies, an absence of readily available standards of comparison, and the lack of financial knowledge of most policy-holders. Finally, one mutual, Sanlam, was seen by its mostly Afrikaans policy-holders as an instrument of Afrikaans economic empowerment, thus enabling management to justify their actions in non-financial terms.
What has changed under demutualisation?
When demutualisation occurred in the late 1990s (for reasons explained later) policy-holders became shareholders, in a flash creating a shareholder base as diffuse as the voting base had previously been. This initially places management in a strong position, but that is sure to change. Active institutional shareholders are now, increasingly, present, and take-over attempts become a possibility, thus providing two means of aggregating votes in opposition to the status quo.
The two demutualised insurers, Old Mutual and Sanlam, have taken strikingly different paths, which may have an effect on their governance. Old Mutual has shifted its domicile to the United Kingdom, and is now part of the FTSE 100 Index, an important benchmark for UK institutional investors. The heightened scrutiny is a world apart from the comfortable life enjoyed by managers under the mutual structure.
Sanlam remains domiciled in South Africa, and, its institutional shareholder base is mostly South African, which, while flexing its governance muscles, currently provides less scrutiny than UK institutions. Yet, though large by South African standards, Sanlam is vulnerable to take-over, perhaps by a foreign group. The desirability and future stance towards domicile shifts is currently one of the most important and difficult policy issues in South Africa. Going forward, the Old Mutual and Sanlam experiences may shed some light.

25
II SOUTH AFRICA’S EQUITY CULTURE AND THE FUNDING OF
CORPORATIONS Introduction South Africa’s equity markets were a by-product of the development of the mines, the risk profile of which made it unattractive to providers of debt. It is due only to the Witwatersrand gold deposits that the city Johannesburg exists and similarly the Johannesburg Stock Exchange (JSE), one of the oldest stock exchanges outside Europe and North America. Although firm figures are not available, depending on assumptions the proportion of South Africa’s GDP generated by firms listed on the Johannesburg Stock Exchange falls between 36 and 54 percent.
Where does South Africa’s deep equity culture come from? Apart from the legacy of mining finance, other factors also contributed. Strong non-bank financial institutions such as pension funds and life insurance companies developed early on, and channelled a large part of household savings into equity. South Africa’s commercial law and business culture, derived from Britain, contain a predisposition for equity finance. Finally, the equity market provided an avenue for investors to profit directly from South Africa’s mineral bounty as well as from the comfortable industrial profit margins achieved in the hot-house economy. Between 1950 and 1990, the mining finance houses and other prominent companies on the JSE proved to be good long-term investments. Nothing succeeds like success.
Equity has continued to play a central role in new funding of non-financial firms in South Africa. As Figure 2, based on data of the SA Reserve Bank, shows, in 1998, equity capital raised on the JSE exceeded net new loans extended to the non-financial corporate sector by the banking sector. This must be one of the few developing economies where this is the case. 1998 was an unusual year in that it saw a listings boom, but a clear trend is noticeable from 1994 on.
The link between funding structure and the quality of corporate governance is indirect but important. Poor governance scares off external capital, leaving the ambitions of firms limited to that that can be funded by their ‘internal’ source of capital, i.e. retained earnings. The quality of corporate governance may also affect the mix of external capital, with lower quality governance favouring debt capital, which allows banks to compensate for poor general governance by insisting on security (often relied upon in the crisis countries of 1997-98) or by requiring strict loan covenants (contractual obligations placed upon the borrower by the lender).
The exchange value of the rand
26
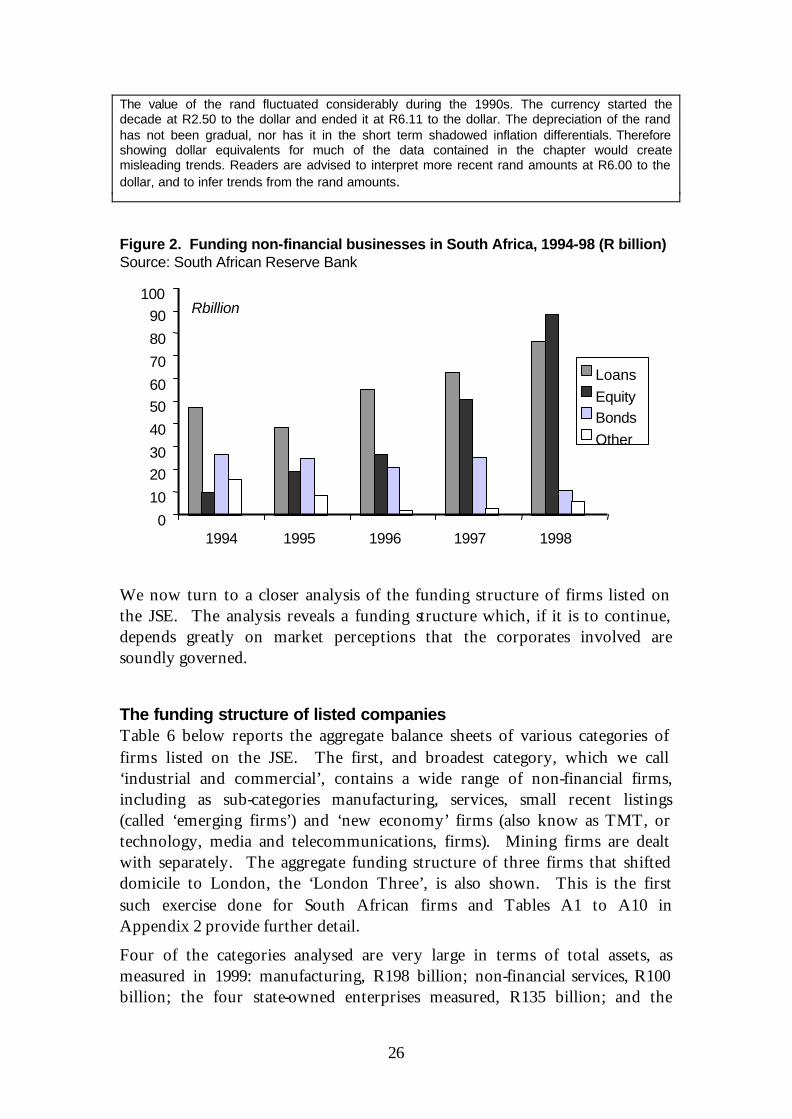
The value of the rand fluctuated considerably during the 1990s. The currency started the decade at R2.50 to the dollar and ended it at R6.11 to the dollar. The depreciation of the rand has not been gradual, nor has it in the short term shadowed inflation differentials. Therefore showing dollar equivalents for much of the data contained in the chapter would create misleading trends. Readers are advised to interpret more recent rand amounts at R6.00 to the dollar, and to infer trends from the rand amounts.
Figure 2. Funding non-financial businesses in South Africa, 1994-98 (R billion) Source: South African Reserve Bank
0
10
20
30
40
50
60
70
80
90
100
Loans
EquityBonds
Other
Rbillion
19951994 1996 1997 1998
We now turn to a closer analysis of the funding structure of firms listed on the JSE. The analysis reveals a funding structure which, if it is to continue, depends greatly on market perceptions that the corporates involved are soundly governed.
The funding structure of listed companies Table 6 below reports the aggregate balance sheets of various categories of firms listed on the JSE. The first, and broadest category, which we call ‘industrial and commercial’, contains a wide range of non-financial firms, including as sub-categories manufacturing, services, small recent listings (called ‘emerging firms’) and ‘new economy’ firms (also know as TMT, or technology, media and telecommunications, firms). Mining firms are dealt with separately. The aggregate funding structure of three firms that shifted domicile to London, the ‘London Three’, is also shown. This is the first such exercise done for South African firms and Tables A1 to A10 in Appendix 2 provide further detail.
Four of the categories analysed are very large in terms of total assets, as measured in 1999: manufacturing, R198 billion; non-financial services, R100 billion; the four state-owned enterprises measured, R135 billion; and the

27
‘London Three’, R117 billion. Two categories are medium-sized: ‘new economy’ firms, R43 billion; non-gold mining, R54 billion. The ‘emerging companies’ category is small in terms of total assets, with only R1 billion in 1999.
In 1999, this broad category of non-financial firms relied on external sources for two-thirds of funds, signifying a financial sector that is active in supplying capital to these firms. What is notable, though, is the heavy reliance on equity financing, constituting more than half of external capital. The preference for equity finance is reflected in the fairly conservative debt-equity ratio of 46 percent. At this broad level, firms have since 1994 gradually increased their use of both external financing of both kinds, with long-term (but not market-traded) debt such as bank and group loans becoming more important. (See Table A1 in the Appendix 4). Table 6. Funds used to finance corporate assets in various sectors (aggregate balance sheets), 1999
Source: Financial accounts, BFA McGregor’s, Genesis
There are interesting variations among the categories. Manufacturing firms display a remarkably stable funding structure over 1994-1999, as Table A2 in Appendix 4 shows. There is a relatively low reliance on equity issues, with a lack of investor interest in the sector in recent years and a correspondingly heavier reliance on retained earnings and debt.
Services firms (which exclude financial services) have over the last six years developed a more aggressive funding structure by increasing their use of external finance, particularly equity, and reducing reliance on retained
Industrial & Commercial
Manu-facturing
ServicesNew
economy (TMT)
Emerging companies
MiningLondonThree
SOEs
Utilisation of external fundingInternal sources 34% 41% 24% 30% 0% 40% 53% 24%External sources 66% 59% 76% 70% 100% 60% 47% 76%
Source
Equity 35% 32% 42% 52% 78% 52% 23% 20%Retained earnings 34% 41% 24% 30% 0% 40% 53% 24%Debt 31% 27% 34% 18% 22% 8% 23% 56%
Long-term 19% 17% 23% 12% 12% 4% 15% 43%Short-term 12% 10% 12% 6% 10% 3% 8% 13%
Total funds 100% 100% 100% 100% 100% 100% 100% 100%Of which traded debt 2% 2% 2% 2% 1% 0% 4% 48%
Risk indicatorsDebt-equity ratio 46% 37% 53% 22% 28% 8% 30% 127%% of debt short-term 39% 37% 34% 34% 47% 46% 34% 23%
Note: 'Industrial & commercial' consists of 'manufacturing', 'services', 'new economy' (TMT) and 'emerging' companies. Banks and other financial services firms are excluded due to hteir intermediary role. All findings are for 1999, other than for the 'new economy' category, where 1998 financial are used to avoid a serious temporary accounting distortion prevalent in the sector in 1999.

28
earnings. In 1999, the sector used external funding for 76 percent of its needs: 42 percent of total funding from equity issues, and 34 percent from debt. This group of firms has the highest debt-equity ratio among listed categories, at 53 percent.
The ‘new economy’ category − made up of technology, media and telecommunications firms − presents a fascinating picture of how a rapidly expanding sector is funded. Analysis of this category is complicated by an accounting distortion that appeared in 1999; therefore we only consider the period 1994-1998.8
During those five years, the assets of the ‘new economy’ sector expanded four-fold. As Table 7 shows, issues of new equity funded no less than 69 percent of the expansion, retained earnings 24 percent and increased debt seven percent. The category’s aggregate debt-equity ratios stayed around the 20 percent level for most of the period, underscoring these firms’ reliance on equity to fund expansion.
Trends for newly listed or emerging companies show an even more pronounced use of equity finance. This sector encompasses the JSE’s two junior boards, sections of the market where listing requirements have been relaxed to allow firms with truncated financial records to raise capital. Although small in terms of assets, this sector has seen many companies list, particularly in technology businesses.
These smaller companies relied in 1999 on external capital for more than 99 percent of their funding needs, up from 69 percent in 1994. Three-quarters of total funds were raised as equity, with the balance a mixture of long and short-term debt. Because of this intensive use of equity, debt-equity ratios are fairly low. The recent capital markets experience of these companies, and the role of corporate governance problems in it, are discussed below.
A contrast with the ‘new economy’ and ‘emerging companies’ sectors is offered by the mining9 category. This sector, with more than R50 billion tied up in capital, has undergone a financial transformation during the last six years, moving to 40 percent reliance on retained earnings in 1999, up from 23 percent in 1994. With a debt-equity ratio below 10 percent in 1999, and a reduced role for equity finance, the sector’s financial structure reflects,
8 In that year firms were allowed to write off goodwill of acquisitions (the excess paid for an acquisition over its book value) against share premium, an element of equity capital raised. The attraction of this was that it was an alternative to the more usual method of writing off goodwill against income over time, which reduced earnings per share. But the downside is, among other things, that it obscures the true sources of funds. ‘New economy’ balance sheets were badly affected, due to (1) the fact that the market value of most IT companies is dramatically higher than book value, resulting in high ‘goodwill’ values upon acquisition and (2) the high rate of merger and acquisition activity in the sector. This accounting manoeuvre, which is no longer allowed, led to distorted reported 1999 balance sheets and ratios in the sector. 9 Includes all forms of mining other than gold mining, due to the unavailability of data on the latter.

29
possibly, reduced new funding needs matched by reduced interest from investors.
With mining the exception, funding of the listed sector displays certain trends for the last six years:
4 A rising reliance on external sources of finance (that is, sources other than retained earnings).
4 A heavy reliance on equity throughout, to a heightened extent in recent years and certain sectors.
4 Rising importance for debt, the mix of which is shifting from short to long term (one year maturity or longer) debt.
4 Negligible use of traded debt markets to raise funds.
Where is the debt? The limited use of debt finance, and particularly long-term debt, by the firms discussed above is striking. In part this reflects the precocious development of a short-term money market, and an under-developed market for long-term corporate debt. Table 7. Funding of new assets in the ‘new economy’ sector: 1994-1998
Source of funds Rand Share of increase
Equity issues + R10,667 million +69%
Retained earnings + R 3,782 million +24%
Long-term debt + R 2,442 million +16%
Short-term debt - R 1,421 million -9%
Total increase in assets + R 15,471 million 100%
The short-term money market was created in the mid-20th century to manage the large positive and negative cash balances generated by mines at different stages of development and production. In contrast, two other sources of debt capital are underdeveloped. South Africa does not have an active market in corporate bonds, despite a highly liquid exchange trade in government bonds (although that may change in the near future). And South Africa’s otherwise well-developed banking sector usually balks at providing long-term fixed interest loans to corporates.
The central role of equity financing would not have been possible without a strong equities market and large domestic financial institutions. We look at each.
The equities market. The depth of South Africa’s domestic equity market is highly unusual among its developing country peers (Figure 3). The market value of the JSE compared to GDP far outstrips the same measure for other developing countries other than Malaysia. Note also the absence of market-

30
traded private debt across the developing world, with the partial exceptions of Korea and Chile.
Figure 3. Development of capital markets: South Africa compared to developing economies* (market value as a % of GDP): 1999 Source: FIBV, Genesis calculations
* Excludes international financial centres.
0%
20%
40%
60%
80%
100%
120%
140%
Poland
Argen
tina
Mex
ico
Thail
and
Korea
Brazil
Chile
Mal
aysi
a
South
Afri
ca
Equity
Public debtPrivate debt
0%
20%
40%
60%
80%
100%
120%
140%
Poland
Argen
tina
Mex
ico
Thail
and
Korea
Brazil
Chile
Mal
aysi
a
South
Afri
ca
Equity
Public debtPrivate debt
0%
20%
40%
60%
80%
100%
120%
140%
Poland
Argen
tina
Mex
ico
Thail
and
Korea
Brazil
Chile
Mal
aysi
a
South
Afri
ca
Equity
Public debtPrivate debt
0%
20%
40%
60%
80%
100%
120%
140%
Poland
Argen
tina
Mex
ico
Thail
and
Korea
Brazil
Chile
Mal
aysi
a
South
Afri
ca
Equity
Public debtPrivate debt

31
Figure 4. Development of capital markets: South Africa compared to advanced economies (market value as a % of GDP):1999 Source: FIBV, Genesis calculations
* Excludes international financial centres.
The JSE is deep relative to the size of the economy even when compared to advanced economies (excluding financial centres), as Figure 4 shows.
How the equities market evolved during the 1990s. Like other traditional exchanges, the Johannesburg Stock Exchange is essentially a member-owned private organisation, consisting of a (self-) regulatory authority, a trading platform and a clearing and settlement system. In all those respects, the 1990s have been a period of rapid change and improvement, with the process not complete at the time of writing.
During the mid-1990s, as foreign investors returned to South Africa, the JSE, under pressure from banks servicing these investors as well as South African corporates, underwent a wholesale renewal. The exchange allowed corporate and foreign membership, awarded stock exchange licenses to all who met a standard list of requirements, closed its trading floor, moved to a transparent electronic trading system, relaxed short-selling rules, modernised its indices to allow for easier cash-futures arbitrage, developed three boards for new companies, raised the listings and disclosure requirements of its main board and started to move towards a dematerialisation of scrip.
Greater competition led to sharply lower trading costs, particularly for institutions. At the same time, foreign institutions have become the price-
0%
20%
40%
60%
80%
100%
120%
140%
160%
Austria
Italy
Germ
any
Denm
ark
Japan
Portugal
France
Austra
lia
Canad
a
Spain
South A
frica
Nether
lands
Private debt Public debt
Equity
0%
20%
40%
60%
80%
100%
120%
140%
160%
Austria
Italy
Germ
any
Denm
ark
Japan
Portugal
France
Austra
lia
Canad
a
Spain
South A
frica
Nether
lands
Private debt Public debt
Equity

32
setters for larger SA stocks, and foreign-owned brokerages now dominate the market, placing more than half of all trades on the JSE.
Overall, the result has been a larger and more effective equities market. Trading volumes rocketed, with a corresponding increase in liquidity. In the early 1990s only 4 percent of the total market capitalisation of the JSE was traded over the course of a year; by the end of the decade that figure had risen to 40 percent.
Although the number of companies (excluding pyramid holding companies) fell slightly during the 1990s from 696 to 610, the market capitalisation of the average company doubled in real terms (in nominal Rand from R526 million to R2.5 billion. Total JSE market capitalisation, again with pyramids stripped out, rose from 152 percent of GDP at the start of the decade to 190 percent at the end of 1999.
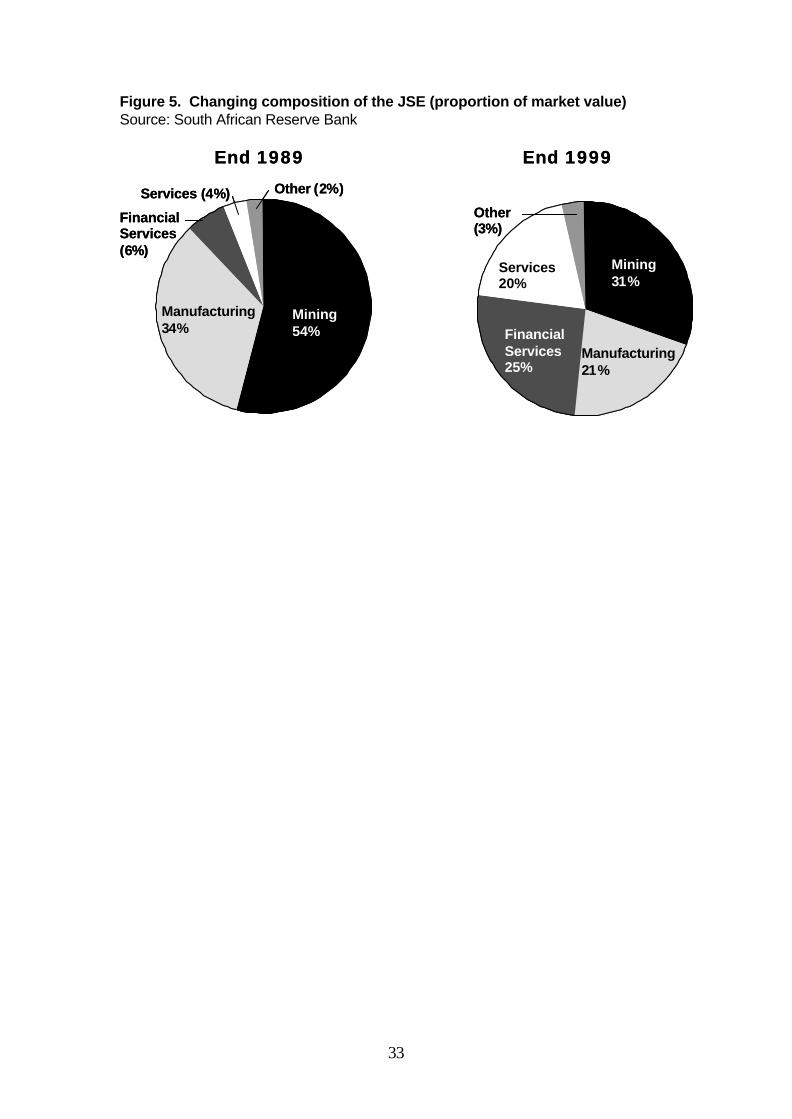
Changing composition. At the same time, the JSE has adjusted to the changing shape of corporate opportunity. As Figure 5 shows, the traditional sectors of the economy, mining and manufacturing, dominated the JSE at end 1989, with almost 90 percent of total market value. By the end of the 1990s, that proportion had shrunk to about half.
The market value proportion of services had increased five-fold, with new economy services (technology, media and telecommunications) accounting for about half, or ten percent of total market value. Financial services now account for a quarter of market value, up from six percent. In part, these changes reflect the listing of two large insurance companies (five percent of market value) and the reorganisation of the mining finance house (see below), but the main contributor has been changes in the real economy to which the JSE has adapted.
The changing composition of the top 20 companies (see Appendix) reflects the shifts in the South African economy, as well as the corporate restructuring in the South African mining industry. In 1989 the top 20 contained 15 resources companies, with the top seven places taken by mining concerns.
33
Figure 5. Changing composition of the JSE (proportion of market value) Source: South African Reserve Bank
Mining54%
FinancialServices(6%)
Services (4%) Other (2%)
Other(3%)
Mining31%
Manufacturing21%
Manufacturing34% Financial
Services25%
Services20%
End 1989 End 1999
Mining54%
FinancialServices(6%)
Services (4%) Other (2%)
Other(3%)
Mining31%
Manufacturing21%
Manufacturing34% Financial
Services25%
Services20%
End 1989 End 1999

34
By 1999, only six resources companies featured in the top 20, albeit taken three of the top four places. Most newcomers were financial services firm, as well as two ‘new economy’ firms in computer networking and cellular telephony.
The role of domestic institutional investors. The growth of large equity and government bond markets has been supported by a financial sector that is unusually old, large and sophisticated for a developing country. South Africa’s private pension funds control monies in excess of R600 billion (slightly less than annual GDP), while the insurance and banking sectors each controls funds close to GDP. The unit trust (mutual fund) industry is about one-fifth the size of the pensions industry, but has grown particularly swiftly in recent years. The data represented on Figure 6 date from the middle of the 1990s, but the point is still valid: South Africa’s institutional sector is large even by advanced country standards.
The appetite of these institutions for equities to invest in has been a critical element in the development of South Africa’s equity market. As competition among various investment services and products increased during the 1990s, the large institutional investors intensified their focus on returns. At a time when structural changes in the economy were rendering the traditional sectors less profitable, the large institutions led a portfolio shift that triggered some of the valuation shifts seen above. At the same time, investor demand for Rand-hedged investments and foreign exchange relaxation led together to a sharp increase in foreign holdings by the institutions, although still below fifteen percent of total assets.
Capital-raising activities on the JSE
When equity issues play such a big role in the funding of business activity, the efficiency of the capital-raising process on the JSE becomes very important.
Of course, not all equity capital is formally raised on the JSE. South Africa has a sizable private equity sector, with an estimated 30 funds, of an average size of perhaps R500 million, providing financing to unlisted firms. But even with private equity funding the most common exit strategy for the fund is a JSE listing after the provision of mezzanine financing. This implies that private equity financing is really a part of the JSE listing process, and depends on the success of the JSE as a primary and secondary market.

35
Figure 6. Assets of various institutional investors compared Source: World Bank, SARB.
10%
20%
30%
40%
50%
60%
70%
80%
Canada France Germany JapanNether-lands
SouthAfrica
United Kingdom
United States
1994
1985
Insurance Company Assets (% of GDP)
10%
20%
30%
40%
50%
60%
70%
80%
90%
CanadaFrance Germany Japan Nether-lands
SouthAfrica
United Kingdom
United States
1994
1985
Pension Fund Assets (% of GDP)
5%
10%
15%
20%
25%
30%
35%
Canada FranceGermanyJapan Nether-lands
SouthAfrica
UnitedKingdom
UnitedStates
1994
1985
Mutual Fund Assets (% of GDP)
5%
10%
15%
20%
25%
30%
35%
Canada FranceGermanyJapan Nether-lands
SouthAfrica
UnitedKingdom
UnitedStates
1994
1985
Mutual Fund Assets (% of GDP)

36
The practice of raising capital in anticipation of or in preparation for a JSE listing occurs in other guises too. For example, firms will often raise the bulk of their capital from a private placement with institutions or other preferred shareholders before listing; these capital raisings are not included in the official data for capital raised, although the funds thus raised may commonly be three to four times as large as the new shares offered to the public (which form the basis of the official data).
For these reasons the data offered below should be read as weathervanes and at most a conservative estimate of total funds raised through the listing process.
Listing and capital-raising activities on the JSE come in three forms:
4 Listings. These are initial public offerings (IPOs): a previously unlisted company is quoted on the JSE following a public offer of newly issued shares. The public offer is commonly used to ensure that the company meets JSE requirements that a certain percentage of the stock be owned by the public. The offer is usually preceded by a private placing where most of the fresh capital is raised. Unfortunately, the JSE does not collect data on the size of private placings, so these are not included in the data.
4 Capital introductions. If a firm already has the required spread of public shareholders, it may decide to eschew the offer to the public, and to list without it. This form of listing is called a capital introduction. In many cases, the firm will at the same time raise capital through a private placing of shares. Again, there is no data on the extent of these private placings. Therefore we use the market value of companies listing every year through capital introductions as an indicator of trends in this market.
4 Rights offers are the only way in which secondary public offerings may be made on the JSE. This is done by issuing pro rata to existing shareholders the rights to subscribe to the new issue of shares. In this case the ‘funds raised’ data are accurate.
Table 8 summarises capital-raising and listing activity during the second half of the 1990s. Note the listings and capital-raising boom of 1998, with both the capital raised (R30 billion, conservatively estimated) and the number of companies involved (143) peaking. The timing of the listings boom is surprising, given that it was still at full speed during the second half of 1998 and fairly strong during the first half of 1999. Why was this? The listings boom reflected the two driving forces, namely large-scale corporate restructuring and ‘new economy’ enterprises. Both these forces were thought at the time to be comparatively unaffected by emerging markets turmoil.

37
The end of the listings boom
The denouement of the listings boom is equally striking. In 1999, capital raised through public offerings on the JSE fell by 75 percent to the lowest level since 1994. But worse was to come in the first half of 2000, with capital raised from the public at an annualised rate of R1.8 billion, 6 percent of the amount raised during 1998. Table 8. Capital raising activity on the JSE, 1995-1H2000 Source: JSE, Genesis
Table 9. Detail of capital introductions on the JSE, 1995-1H2000 Source: JSE, Genesis
The story is told clearly by the ‘capital introductions’ data (see Table 9). Capital introductions, both in terms of number of firms and total market value of firms listed in this way, continued fairly strongly through the third
1995 1996 1997 1998 1999 1H2000
New listings Number of listings 15 20 20 11 10 1 Capital directly raised (Rm) 879 1,379 222 15,877 4,496 300 Capital raised per listing 59 69 11 1,443 450 300
Secondary capital raised Number of secondary offers 45 52 46 42 16 5 Capital raised (Rm) 6,718 9,835 9,671 14,490 2,693 595 Capital raised per offer (Rm) 149 189 210 345 168 119
Totals Number of events 60 72 66 53 26 6 Capital raised (Rm) 7,597 11,215 9,892 30,367 7,189 895 Capital raised per event (Rm) 127 156 150 573 276 149
Capital introductions Number of firms n.a. n.a. 34 90 64 5 Total market cap. (Rm) n.a. n.a. 54,156 35,951 33,317 1,184
By firm market value 1997 1998 1999 1Q99 2Q99 3Q99 4Q99 1H2000 1Q00 2Q00
Up to Rm 600 ($m 100)No. of firms 26 80 56 19 22 8 6 5 3 2 Total Market Value Rm 3,515 9,688 7,981 3,006 2,774 1,396 806 1,184 741 443 Ave. Market Value Rm 135 121 143 158 126 174 134 237 247 222 Ave. Market Cap $m 25 20 22 24 19 27 21 34 35 32
Over Rm 600 ($m 100) No. of firms 8 10 8 2 1 5 nil nil nil nilTotal Market Value Rm 50,641 26,263 25,336 1,692 14,758 8,885 nil nil nil nilAve. Market Value Rm 6,330 2,626 3,167 846 14,758 1,777 n.a. n.a. n.a. n.a.Ave. Market Cap $m 1,151 438 487 130 2,271 273 n.a. n.a. n.a. n.a.
Total No. of firms 34 90 64 21 23 13 6 5 3 2 Total Market Value Rm 54,156 35,951 33,317 4,699 17,532 10,281 806 1,184 741 443 Ave. Market Value Rm 1,593 399 521 224 762 791 134 237 247 222 Ave. Market Cap $m 290 67 80 34 117 122 21 34 35 32

38
quarter of 1999, with a dramatic fall off thereafter. During the subsequent three quarters only 11 firms, with a total market value of R 2 billion, listed in this way. At the peak of the market in 1998, 90 firms had listed with a combined value of R35 billion.
The effect on smaller firms. Smaller firms, preferring to place shares strategically, used the ‘capital introduction’ method extensively. Consider firms with market values of less than R600 million (roughly US$100 million). Over the 1997-1999 period, 162 such firms accessed the JSE using this method, with a total market value (at time of listing) of R21 billion, and at an average market value of R130 million, or just below US$25 million. This has dropped to almost nothing.
Firms of this size are in a particularly vulnerable position. They are mostly ‘new economy’ and ‘emerging’ firms − categories whose balance sheets depend heavily on equity finance. This group is the natural point of entry for non-establishment entrepreneurs and businesses. After offering a congenial source of capital for such smaller firms during most of the 1990s, the JSE has essentially dried up.
The South African corporate giants can, and are, increasingly accessing international capital markets such as the London Stock Exchange and Nasdaq. But the peers of the smaller firms discussed here, with an average market value upon listing of less than $25 million, are far too small to consider these exchanges. They rely on the JSE, and the recent failure of this market to provide capital must be of great concern.
Why the disappearance of the market for smaller stocks? A number of issues are at the bottom of the market’s current disillusionment with smaller stocks. Important factors, though, are the related issues of disclosure, self-dealing, insider trading and corporate governance. A number of smaller stocks have generated controversy in these areas, and the market has evidently concluded that it cannot differentiate between good prospects and bad or to monitor these companies.
Bear in mind the information characteristics of the market for smaller stocks. In South Africa as elsewhere, institutions, needing to invest large sums in liquid instruments, shun smaller companies. Purchasers of smaller stocks are mostly private investors. (‘Emerging company’ mutual funds were starting to emerge, but have effectively been killed off by the poor market performance.) In other words, institutions, the usual solution to the problems of information asymmetry and collective action endemic in investment markets, barely operate in this market
The upshot is that the information asymmetry between the promoters and managements of the smaller firms, on the one hand, and the private investors, on the other, is particularly acute. If so, then the conventional

39
view on small stock or ‘emerging company’ boards, that these must set more relaxed listing and other requirements, is wrong-headed. Regulation may be required to solve the significant market failures that seem to operate in this market segment.
What are the financing alternatives for small companies? While short-term funding is freely available in the form of over-drafts, a bank will limit its exposure to any particular company commensurate with the equity funding it has been able to attract. Over-drafts are call loans, and therefore create significant financial vulnerability. Currently, the only other source of long-term and equity finance for small companies is the private equity market. This market, too, ultimately relies on the listed equities market for valuation benchmarks and for exit.
Conclusion. This brief tour confirms that South African firms rely heavily on securities markets for funding. This, in turn, creates a demand for sound corporate governance. Unlike bank loans, where contracts can be specifically tailored, funding through equities markets relies on generalised rules and adequate and accurate disclosure.
The financing and governance of state-owned enterprises
One legacy of the era of Apartheid autarky are a number of large state-owned enterprises (SOEs). The four largest are power utility Eskom, telecommunications provider Telkom, transportation company Transnet and armaments manufacturer Denel. Another important SOE is Acsa, the operator of South Africa’s major airports.
Until the late 1980s, the SOEs were run as government departments under particular ministries. Political fiat was absolute, and losses were routinely covered by transfers from the fiscus. At that point, the government’s approach started to shift from viewing the organizations as policy tools to preparing them for eventual privatization. The firms were ‘corporatised’, given a corporate legal form, complete with a board appointed by the government as the sole shareholder.
The current funding structure of state-owned enterprises The SOEs have funding structures that differ radically from those of their private-sector counterparts, In Table 10, the funding of Eskom, Telkom and Transnet is shown. Acsa is also included. With more than R66 billion in assets, these firms loom large on South Africa’s utilities and transport landscape.

40
Table 10. The funding structure of state-owned enterprises, 1999 Source: Financial accounts, Genesis Analytics calculations
The SOEs have two major differences in structure compared to the private firms:
There is a far heavier reliance on debt, with an aggregate debt-equity ratio of 127 percent in 1999, compared to the broad listed category of ‘industrial and commercial’ firms’ aggregate ratio of 46 percent. Transnet has the highest debt-equity ratio at 176 percent.
Unlike the listed firms with negligible traded debt, the SOEs rely on traded debt − mostly bonds − to fund 85 percent of debt requirements, almost half of their total funding. Other than the sovereign, Eskom is the most important Rand bond issuer in South Africa and abroad, with its R37 billion rand in bonds trading at a small discount to treasuries.
Corporate governance reform in state-owned enterprises Upon inheriting these entities, the 1994 government had to find its own balance between using the SOEs to effect service delivery to the poor and adopting the internationally prevailing approach of privatization. During 1994-1999 the government emphasized service delivery and the appointment of black management, although there were significant sell-offs of minority stakes in Telkom, South African Airways (a part of Transnet) and another SOE that operates South Africa’s major airports. Each of the incoming shareholders are well-known international operators in the respective industries, and in two cases (telecommunications and airports) they were given management control.
Funds employed by source
All four SOEs Eskom Telkom Transnet Airports
Company Funds employed by source
Equity 19.6% 1.3% 29.1% 42.7% 48.9%Retained earnings 24.4% 42.4% 23.4% -6.6% 50.4%Debt 56.0% 56.3% 47.5% 63.9% 0.7% Long-term 43.2% 41.8% 29.0% 57.6% 0.7% Short-term 12.8% 14.5% 18.5% 6.3% 0.0%Use of external fundingInternal sources 24.4% 42.4% 23.4% -6.6% 50.4%External sources 75.6% 57.6% 76.6% 106.6% 49.6%Debt-equity ratio 127.1% 128.7% 90.5% 176.9% 0.7%Tradable debt % 47.5% 56.3% 29.5% 47.7% 0.0%Debt structure% of debt short-term 22.9% 25.7% 38.9% 9.9% 0.0%
41
In August 2000 the government finally announced a comprehensive privatisation policy for the major SOEs (for political reasons the term ‘restructuring’ is used in the policy document). Certain SOEs are to sell minority stakes to ‘strategic’ investors that have foreign operating experience, and some operations are to be wholly privatized. It is envisaged that Telkom, South African Airways and the airports operator will list on the JSE within the next 18 months.
The new policy is guided by a view that the government is constructing in South Africa a ‘strong democratic developmental state’. As a part of this effort, the government believes, SOEs, whether partially privatized or not, need to extend services to poor South Africans and otherwise assist in economic development. So, while each corporatised SOE will have the trappings of corporate governance, such as a board and sub-committees, its conduct will in fact be determined by a ‘shareholder compact’ with the government. The compact will spell out its future strategies and objectives. It can be expected that, in the case of the wholly-owned SOEs, the government will, through the compact, make most important decisions.
In the case of SOEs that now have a minority ‘strategic’ shareholder, governance arrangements are contained in a shareholders’ agreement negotiated with the strategic shareholder. The shareholders’ agreement usually confers a strong operating role, and often management control, on the strategic shareholder. The agreement also spells out the development role and objectives of the company, to which the strategic shareholder then commits.
Neither of these approaches address the needs of minority shareholders that will come on board once the SOE lists. It is disappointing that the policy announced does not spell out more appropriate transitional governance arrangements for those SOEs that are shortly to go public.

42
III Corporate control structures
Arrangements that magnify the power of a certain group of shareholders − control blocs, dispersed shareholding, control pyramids and differential voting shares − are well-known in the South African corporate sector. All these structures were pioneered by mining finance houses in their efforts to combine management control with limited commitment of own capital, and were subsequently adopted by many other South African firms. In the light of what we saw in the previous section this is not surprising. These techniques complement the use of equity to raise capital, as they counteract the one drawback of raising equity finance: dilution of the founder’s control.
In the 1990s, as foreign investors returned and the country’s capital markets modernised, companies that use these mechanisms were starting to face investor resistance. But support for these mechanisms came from an unexpected source: the new political climate, which stressed the need for rapid black economic empowerment, the process by which black investor groups gain control of listed firms. Among other things, black empowerment status was thought to put a company at an advantage in applying for state tenders or regulatory licenses.
The black investor groups needed mechanisms that would enable them to achieve control despite a modest capital commitment. Back into vogue came n-shares, pyramid structures, and sometimes combinations of the two. These mechanisms were initially accepted by the investment community, and as this became apparent, there was a resurgence in the use of the mechanisms by other, non-empowerment, companies.
The control techniques discussed in this section distort the relationship between share in cash flow and share in voting power, thereby encouraging abuses of corporate governance and weakening the oversight of the capital market. The introductory framework that follows explains why this is so. It starts off by justifying the pivotal role of equity in the theory and life of firms.
How corporate control structures influence governance
Why equity holders have the power. As the residual risk-bearers of the firm, holders of equity have an incentive to ensure that all prior claims − lenders, employees, suppliers and tax authorities − are paid. They also seek to ensure that capital is used efficiently, with a proper balance of risk and return, so that profit remains after other claims have been paid. On this

43
basis rests the claim of securities, and particularly equities, markets to be an important allocator of capital and the economy’s principal check on the corporate use of capital. Bondholders, too, are a check on corporate management, but do not control the board or appoint management.
This schema can break down, and shareholders can be rendered powerless or ignorant while an insider group exploits their privileged position. When exploitation of this sort becomes pervasive, and providers of capital can neither stop being exploited nor identify which firms will exploit them, they withhold capital from entire markets or from certain categories of firms. This may explain what happened in the South African market for small company stocks from 1999 onwards.
Two types of problem. Control structures, and the laws and rules that govern them, have a large effect on the likelihood that insiders will exploit other providers of capital. Broadly speaking, there are two types of control structure problem:
Abuse of the firm by management in the case of a firm with widely dispersed shareholders.
Abuse of the firm by controlling shareholders at the expense of minority shareholders and other providers of capital.
In both cases the insider group exploit their position by engaging in transactions with parties in which they have an interest. But the ways to minimise abuse differ. We look at the two situations in turn:10
Control blocs and related-party transactions
Control blocs are the prevalent control situation in most developing economy firms. When controlling shareholders divert the firm’s wealth to their own pockets, their role in ensuring that the firm makes good on its obligations to other creditors and produces a surplus, is compromised, and the firm is weakened.
Related-party transactions are those between a public company and a group of powerful insiders, whether a bloc of controlling shareholders or management. While not all related-party transactions are harmful, abuse often occurs. The banking industry offers a ready example. The phrase ‘connected lending’ refers to loans extended to banks' owners or managers and their related businesses. If connected lending is rife, the political or personal interests of bank insiders may be allowed to impinge on lending decisions. Various authorities cite connected lending as a key contributor to
10 This taxonomy is derived from Scott, Kenneth E., ‘Corporate Governance and East Asia’, World Bank/Brookings Conference on Preventing Crises in Emerging Markets (mimeo, 1999).
44
banking crises in many countries.11 In the context of the most recent crisis, lending from Korean merchant banks to their controlling chaebol and instances of related-party lending in Indonesia have been reported.
A South African example of the use of control blocs, widespread until the 1990s, was the mining finance house described in Section I. The house would often control a listed operating mine through a fairly small effective shareholding, and through its control monopolise certain lucrative supply services to the mine. In addition, the house would levy so-called management fees. To the extent that these were not commercial, minority shareholders in the operating mines were being disadvantaged to the benefit of the controlling house. While these arrangements have now been dismantled, other control-bloc situations, like family-controlled firms, remain.
There are often attempts by insiders to perpetuate control even when their shareholding falls below 50 percent. This can be achieved through the use of low-voting shares or pyramid structures, both of which have been features of the South African equity market during the 1990s.
These artificially wrought control blocs have, in some cases, led to opportunistic self-dealing. Controlling blocs whose voting rights exceed their cash flow rights by a wide margin have had an incentive to diminish the firm’s profits in order to reap benefit where they have a greater share in the cash flow. It is possible that investments were made that maximise opportunities for ‘creaming off’ rather than maximising returns. They have also effectively shielded many South African firms from the market for corporate control, an important discipline on firms.
While there is no evidence of systematic abuse by South African firms, it is important to remain vigilant. Foreign investors are sensitive to the possibility of such abuses in emerging markets, making it necessary for South Africa to have appropriate measures in place. If not, investors, domestic and foreign, may shy away from the market as a whole, penalising both good and bad firms.
The first line of defence against control bloc abuse is voting rights reform. The aim of that is to minimise the number of control bloc situations, and to expose incumbents with less than a majority stake to the market for corporate control. The second line of defence, particularly important in the face of an entrenched controlling bloc, is legal rules governing conflict of interest. It is ironic that such rules remain underdeveloped in South Africa, given the important role of shareholder blocs in the recent past.
11 Lindgren et al (1996) and Sheng (1996).

45
Dispersed shareholding and management opportunism
Classical corporate governance studies posit that dispersed shareholding may encourage management to act in their own, and not in shareholders’, interests. Because of the historical prevalence of control blocs in South Africa, there has been limited experience with dispersed shareholding situations. However, a number of firms with dispersed shareholding and no control bloc have emerged from the corporate restructuring of the 1990s. These include two of the large banks, the two demutualised life insurance companies, and (more recently) the two largest mining companies.
One consequence may be a revitalisation of the annual general meeting. Voting rights are the principal mechanism of shareholder protection against management abuse. However, dispersed ownership can make concerted action against management difficult, as classic collective action problems occur.
There are ways to address this problem. It is a policy priority in South Africa to ensure that dispersed shareholders can exercise their control over the company effectively. Disclosure requirements, proxy rules, agenda control and voting procedures are important. Most important, dispersed shareholders need some mechanism to aggregate their votes to enable meaningful intervention in the management approach of the firm. As the number of firms in South Africa with dispersed shareholdings increases, the country will have to develop its ‘aggregation mechanisms’ such as the market for corporate control and the role of institutional investors.
Control blocs and dispersed shareholding
Partly due to the influence of the mining finance house, South Africa’s equities market was traditionally dominated by firms that answered to control blocs. Of the 20 largest firms by market capitalisation in 1989 − and accounting for 51 percent of the market’s total capitalisation − 17 were controlled by shareholder blocs. Ten of the top twenty companies fell within one sphere of influence, the Anglo American/De Beers grouping.
In South Africa, the 1990s have seen the deployment of market pressure to reduce actions taken to benefit dominant shareholders at the cost of minorities. This quiet revolution, while it has not eliminated all instances of abuse, has within a few years transformed the structures and strategies of the largest corporations in South Africa (see Section IV). By 1999, after heavy restructuring, only 11 of the top twenty companies were subject to control blocs.
Where controlling blocs remain, minorities have to rely on legal rules governing conflict of interest. These rules were until recently

46
underdeveloped in South Africa, despite the prevalence of the mining finance house and other control blocs.
South Africa has recently seen strong growth in the category of firms with a dispersed shareholding. In 1989, only three of the top 20 listed companies by market capitalisation were widely held; by 1999, nine were. This reflects not only the restructuring of the 1990s, but also the demutualisation of two life insurance companies, Old Mutual and Sanlam. During these listings shares were allocated to more than a million policyholders.
The 700 odd companies below the top 20 have not been analysed in detail. In general the same situation and trends apply to these firms as apply to the 20 largest firms: control blocs continue to predominate − often founding families or groups of founders. The number of widely held companies may also be increasing, particularly among the top 100 firms.
Control distortions: pyramid structures
Mining holding companies were among the first to use pyramids to raise equity capital without losing control of the operating company. In recent years pyramid structures have mainly been used to allow a founding family to retain control despite no longer having a majority of shares. Pyramids effectively inure the controlled company against hostile takeover.
According to the JSE a pyramid company has two characteristics. Firstly, the pyramid company can exercise 50 percent or more of the total voting rights of the equity securities of a listed company. Secondly, the pyramid firm derives 75 percent or more of its total attributable income before tax from the listed controlled company, or the shareholding in the controlled company represents 50 percent or more of its total assets.
The JSE allows the listing of first stage pyramids, but will not list any new second stage pyramid (a pyramid company on top of another pyramid). Existing second stage pyramids have been allowed to continue as listed entities.
Trends in pyramid structures. The number of pyramid companies listed on the JSE decreased drastically between the end of 1989 and the end of 1999. In 1989 seven percent of the companies listed on the JSE, or 53 companies, were pyramid companies. By the end of 1999 only 27, or three percent of the companies listed on the JSE were pyramids. This trend reflects unbundling of conglomerates and the general disenchantment of investors with pyramid structures.

47
In 1989 the market value of companies controlled by pyramids was R44 billion, or nearly 12 percent of the total JSE market value. In 1999 the corresponding figures were R114 billion and 7.5 percent respectively.
Figure 7. Pyramid control structures on the JSE, 1989 and 1999 Source: JSE, Genesis
.
Control distortions: N-shares
N-shares are a special class of share designed to have the same economic characteristics as a normal share, notably the same dividend and payout upon liquidation, but with low or no voting rights. They are listed on the JSE alongside the normal share, with N added on as a suffix.
Until the early 1990s companies refrained from listing N-shares on the JSE, although they were not prohibited. During the early 1990s N-shares gained after being recognised as a black empowerment technique, although the first company to issue shares under the new dispensation was mining house Anglovaal. New Africa Investments Limited (NAIL) was the first black empowerment company to issue N-shares. Subsequently many companies that are not black empowerment firms have used N-shares to entrench their power.
The number of N-shares currently listed on the Johannesburg Stock Exchange is 24, compared to 26 at the end of 1996. However, market sentiment has turned against low-voting shares. Among the high-profile companies that have in response to shareholder pressure announced plans to convert N-shares into full voting stock are pioneers Anglovaal and NAIL.
53
20
40
60
1989 1999
3%
6%
9%
12%
1989 1999
12%
27
7.5%
Number of pyramid firms % of market value subject to pyramid control
53
20
40
60
1989 1999
3%
6%
9%
12%
1989 1999
12%
27
7.5%
Number of pyramid firms % of market value subject to pyramid control

48
The n-share discount. N-shares usually trade at a discount to the price of the ordinary share. This reflects the lower voting power as well as uncertainty as to whether N-shares enjoy the same minority protection status as ordinary shares in take-over situations. Surprisingly, given market antipathy to N-shares structures, the average N-share discount has reduced over time, from 16 percent in December 1996 to ten percent in March 2000 (see the appendix). This may reflect recent market expectations that many of the N-shares will be converted to ordinary shares. Another interesting view is that the market depresses the value of both ordinary and n-shares of companies with differential voting shares. There is anecdotal evidence to this effect, as well as a plausible rationale: that such companies have taken themselves out of the market for corporate control and, further, that the protection against take-over breeds management complacency.
Given how widespread control blocs, pyramids and differential-voting shares are in South Africa, and the array of business heavyweights that represent companies with these distortions, it was unlikely that remedies would be put in place any time soon. Surprisingly, that is what has happened in the past months, a story told in the following section.

49
IV Mechanisms to improve corporate governance
Along with the dramatic political developments of the 1990s came a brace of other changes that transformed the commercial environment, resulting in poor performances by the corporate stalwarts:
In 1996, South Africa entered the World Trade Organisation, and the subsequent tariff reform hit profits in hitherto protected industries.
The new political dispensation encouraged the entry of foreign players into markets with historically fat margins, increasing the level of competition.
The 1990s saw an intensification of the long-run down-trend in commodity prices, hurting the traditional mining sector. In particular, the gold industry was caught in a vice of rising costs and falling gold prices as the metal lost its status as a financial store of value: during the 1990s the gold sector’s proportion of the value of the JSE declined from 17 to 4 percent.
Due to a range of factors, the most attractive growth and margins were found in the non-traded services sector, with media, financial and information technology services sectors achieving impressive returns and a strong investor following.
As corporate performance waned, market and institutional forces alike sharpened focus on the management and governance of listed companies. The result: during the latter part of the 1990s has a spate of measures to improve corporate governance. Important events include:
Perhaps most forcefully, market pressures, brought to bear on the mining finance houses in particular);
a new role for institutional investors;
an experiment in voluntary compliance (the King Code);
tighter listings requirements by the JSE as the self-regulator of the equities market;
an important innovation in disclosure aimed at exposing conflicts of interest; and
successful legal reform (the Insider Trading Act).

50
Intriguing about this list is the diversity of actors, and the complementary nature of many of the contributions. We consider them in turn.

51
Market pressure: the end of the mining finance house
Once foreign financial institutions had returned to South African markets, they did not like what they saw. The lack of specialisation, the complex and opaque shareholding structures, the conflicts of interest inherent in control blocs, the poor systems of governance − factors such as these meant they were soon openly critical of the returns and management practices of the mining finance houses.
At the same time, local institutions were shifting portfolios to the technology sector and to foreign bourses. These investors demanded a sharp improvement in corporate structures and governance. The institutions, foreign and domestic, became the buyers and sellers at the margin on the Johannesburg Stock Exchange, and so exerted considerable influence on price levels. Mining finance houses, families and other control blocs having a large part of their wealth in equity − were sensitive to falling share-prices. This was also true of senior managers who by the early 1990s were widely incentivised through share-option schemes.
The pressure for change from shareholders focused on two related issues: poor returns on capital invested, and the mining finance house discount.
Poor returns on capital invested. Senior mining executives acknowledge that poor corporate governance and management played a role. A top executive in the industry points out that
Capital was appallingly misapplied. Real returns of seven percent were considered acceptable, while the norm abroad was 15 percent or higher, depending on the riskiness of the project. Risks were perceived to be low, but in fact they were not.
Another industry leader points to the lack of capital markets discipline in the capital-rich houses:
There was little sense of key measures of capital efficiency such as return on assets and return on equity. The companies were technically strong, but financially and commercially in the stone age.
The mining finance house discount. The most direct cause of restructuring was the discount of the value of mining finance houses relative to the market value of the underlying assets (in the mining house model, many of the assets of the mining house are also listed, and hence given a transparent market value). By the early 1990s the valuation of mining finance houses implied a significant discount, usually between 5 and 20 percent and therefore in the billions of rand, relative to the value of assets.
This was a simple and compelling indictment: it implied that investors considered that the house would not wisely invest the dividend flows and/or capital values of their assets. The discount also gave investors an easy rationale for encouraging restructuring: unbundling of the underlying assets,

52
for example, would at once release the amount of the discount to investors. By removing the house as a control bloc, governance problems such as related-party transactions would also be eliminated from the firms being unbundled.
Also, now that structural changes in the economy had reduced the appeal of many conglomerate holdings, international and focused expansion became a more compelling strategy. Unbundling tallied with this change in approach.
The mining finance house restructures
As the 1990s unfolded, South Africa’s mining sector restructured. No traditional mining finance house remains. The industry is now home to diverse types of firms with diverse strategies: small mines dedicated to high productivity exploitation of marginal ore, single commodity companies mining long-life high-yielding deposits, mining venture capitalists and global mining concerns. Mining services and supplies, once internally provided by the mining finance house, are now commonly outsourced to a wide range of independent firms.
Usually these were the elements of the restructuring:
Unbundling. Mining houses reduced − in some cases sharply − the diversity of their investments. The discount at which many of the conglomerates were trading meant that shareholders would receive an immediate increase in value upon distribution of shares in the underlying holdings. Billiton, then known as Gencor, divested itself of its paper, oil and consumer interests through an unbundling process.
The most recent mining house unbundling, of Anglovaal, is an interesting example of market pressure at work. The market threatened to withdraw support for the company until the founding families, ensconced in an elaborate control structure, relinquished control. This has duly been announced, and the mining, consumer good and engineering divisions unbundled into three focused listed entities.
Full ownership of operating companies. The traditional mining houses turned into holding companies − Billiton, Anglo American, Gold Fields − with 100 percent ownership of their operating entities. As a result, the number of listed mining companies on the JSE fell from 45 in 1992 to 14 in 1999. The buying out of minority interests eliminated the discount, avoided the usual ‘control bloc’ conflicts of interest and made it easier to direct cash to new opportunities without incurring company tax.
Outsourcing and lean corporate organisation. A combination of outsourcing and decentralisation slashed head office functions and staff of these holding companies. Billiton, for example, spun off its technical division.

53
Down-sizing and portfolio shifts. Operations, particularly in gold, down-sized, following the realisation that the price levels seen in the 1980s were not going to reappear. The large mining groups closed unprofitable shafts and sold off marginal shafts better operated by smaller companies. Within many operations, a high-grading strategy was followed, with mines refraining from mining unprofitable areas.
The pioneer of mining house restructuring, Gencor/Billiton, provides the classic example these processes. It is discussed in the box on the next page.

54
Six steps in transforming a traditional mining house
The mining group Billiton, known previously as Gencor, pioneered the restructuring of the mining finance house in the early 1990s.
First: The unbundling of Gencor
Management concluded that the centre ‘provided no value enhancement’ to a number of industrial and commercial holdings. These holdings were in activities removed from the core of mining and metals processing activities. For the non-core activities supervision by the centre was ‘just another hurdle’. These interests were unbundled in 1992, the first process of its kind in South Africa. Companies unbundled included paper company Sappi and industrial holding company Malbak.
Second: Deciding on the core holdings
The remaining assets were grouped into five business areas. This begged another round of consideration about distinctive capabilities. Should a mining company be multi-commodity or single-commodity? They chose a multi-commodity base metals and coal strategy, and decided to exclude precious metals. This would provide the company with critical mass. Skills were transferable and similar across the commodities chosen. The company also decided that forward integration would be limited to smelting.
Third: Accessing global capital markets
Gencor, like other mining companies, needed to go where the deposits are; that is, to operate globally. South Africa’s exchange controls made foreign acquisitions difficult to finance. In 1997 Gencor changed its name to Billiton, shifted its primary listing to London, joined the FTSE index and raised $3 billion. This provided Billiton with a strong offshore balance sheet and good access to global capital markets.
Fourth: Consolidating holdings
As a mining house, Gencor/Billiton ‘looked like a unit trust’, with large stakes in listed companies with minorities. Cash was trapped in various operating companies. So, during the bottom of the cycle, the company took full control of coal and other interests.
Fifth: Enhancing the portfolio
The company now pursues large opportunities around the globe. For an acquisition to make a difference to Billiton it must make $50-100 million per year in profits. Otherwise the transaction costs are too high. The important attributes in a metal are: scale, growth and the right opportunity.
Sixth: Splitting precious metals from the rest
Precious metals producers are rated differently from other mining companies. Therefore, it made sense for gold and platinum activities to be housed in a separate company, which was subsequently merger with the South African gold producer Gold Fields of SA.

55
Institutional investors assume a more active governance role
South Africa’s insurance, pension fund and mutual fund sectors are, relative to the size of the economy, among the largest in the developing world. Such institutions exist, among other reasons, to exploit the enormous economies of scale of the investment process, including the analysis, selection and monitoring of investments. Institutions are a neat solution to the collective action problem that undermine the monitoring of companies by individual investors. It makes sense for institutions to play a leading role in monitoring corporate structure and governance as well.
However, it is only in recent years that institutional investors have become more vocal and organized in their posture towards corporate governance in the United States and Britain. And it is only since the emerging markets crisis of 1997-8 that large institutions in the advanced economies have started to engage emerging markets companies on governance.
Institutional involvement in corporate governance has been slow to come to the fore in South Africa, and in some quarters there is antipathy to the idea. For example, the King committee adopted a surprisingly sceptical stance to the role of institutional investors, pointing to possible insider trading problems and suggesting that institutions may be reluctant to cooperate with one another. The committee concluded that institutions would have to approach any role in this respect ‘with the agility of a trapeze artist’.
Institutions, too, have been reticent. This may in part reflect an unwillingness on their part to be seen to assume a powerful role in South African corporate life. Such a profile may bring with it government attention and possible obligations, in a country where the notion of prescribing investments for institutions remains popular with some politicians. Hence the unwillingness among South African institutions thus far to form an investor protection council of the kind now operating in the United States and Britain.
The sceptics’ views may be based on a misunderstanding, and may profit from investigating the role of large institutional investors and the investment councils abroad. Their model is not to become controlling shareholders, directing the affairs of the company from a privileged position on a board. The idea is not for the institutions to become directly involved in the governance of the firms they have invested in, it is for institutions to monitor and assess the governance of the company, and to enforce good governance with the mechanisms shareholders have at their disposal.
There are signs of a tentative shift to this model in South Africa. One sign is the views of the JSE, as expressed in their proposed new principles of governance, three of which deal with the role of institutions:

56
Companies should be ready, where practicable, to enter into a dialogue with institutional shareholders based on the mutual understanding of objectives.
Institutional shareholders have responsibility to make considered use of their votes.
When evaluating a company’s governance arrangements, particularly those relating to board structure and composition, institutional shareholders should give due weight to all relevant factors drawn to their attention and to eliminate unnecessary variations in criteria which each applies to the corporate governance arrangements and performance of the companies in which they invest.
The three principles read like an invitation to the institutions to assume the more activist role of their counterparts in the US and Britain.
Institutions as guardians of good corporate governance: the NAIL affair
The so-called NAIL affair is a recent and important example where shareholder pressure, fanned by the institutions, succeeded in scuttling a breach of good corporate governance. Buried in the agenda for the 1999 annual general meeting of New Africa Investments Ltd (NAIL) was a resolution that would have transferred, at no cost, assets with an estimated current value of R100 million to four executive directors.
The campaign against the measure was an intricate dance in which the law played a role by virtue of requiring shareholder permission in the first place, institutions provided information and exerted pressure on the company, and the media played an important part by bringing the issue to the public’s attention. Ultimately the proposed resolution was withdrawn, and two of the four directors resigned.
These events provide a powerful example of how institutions (and the media) can be a force for good governance. This precedent is likely to be followed when similar issues arise in future.
Voluntary standards: the King Code on Corporate Governance
The main effort in South Africa at using voluntary compliance with a publicly defined standard of good corporate governance has been the King code of corporate governance, one of the earliest such efforts in an emerging economy. The Code, released in November 1994, was the product of a committee convened by the Institute of Directors following the publication of the Cadbury Report in Britain. The committee was chaired by Mervyn King, a lawyer and businessman. The Committee and its work subsequently gained the support of a number of business associations, as well as the Johannesburg Stock Exchange.
The committee was given an almost impossibly wide brief, but its key output was to be a Code of Corporate Practices and Conduct. The committee was instructed to ‘have regard to the special circumstances existing in South

57
Africa, more particularly the entrance into the business community of members of disadvantaged communities.’ It also assigned a task group to consider ‘stakeholders and stakeholder communications’.
The ‘director’ task group considered ‘the responsibilities of executive and non-executive directors, and the frequency, substance and form of information to shareholders’. The task group focused on disclosure, ‘in recognition of the fact that by and large South Africa’s philosophy of regulation of companies, in keeping with that of the Anglo-American tradition, is by means of disclosure’. This philosophy is reflected throughout the report, and is encapsulated in the following statement:
While it is of the utmost importance that companies operate from a base of integrity, we believe that the focus must be on a participative entrepreneurial approach rather than a dominant one. Likewise, the participation process must not become so dominant that it stifles or obstructs the notion of business risk for reward in a free enterprise system.
Use of the Cadbury Code and ‘special circumstances’. The committee extensively used the Cadbury Report as a guide for its work, using the same structure for its report. The approach seems to have been as follows. A task group would consider what the governance ideal was, mostly with reference to the Cadbury Code. Then it would, as instructed, consider whether there were ‘special circumstances prevailing in South Africa’ that necessitated a deviation from this approach. For example, the report agrees with Cadbury that the splitting of the roles of chief executive and chairman ‘is undoubtedly correct in principle’, but then goes on to say that
There are, however, many circumstances in South Africa where the positions of chair and chief executive are combined in the same individual, due to force of circumstances. There are, for example, “family companies” in South Africa, many of which are listed on the Johannesburg Stock Exchange.
Another example arises with the issue of ensuring the independence of non-executive directors. Cadbury recommends that there be a minimum of three independent non-executive directors ‘of sufficient calibre to bring independent judgment to bear’. This is again supported in principle, after which the report notes:
In South Africa the question arises as to whether there is a sufficient pool of trained and experienced people available to serve as independent non-executive directors. Also as a result of this limited pool of skilled people, conflicts of interest often arise.
There are large conglomerates in South Africa with diverse investments and it is sometimes in the interests of shareholders that senior directors of major subsidiaries should serve on the main board of the holding company. The skills shortage has also resulted in retired executive directors continuing to serve on boards as non-executive directors.
58
Focus on the shareholder/management divide. The Cadbury code aimed at ensuring proper oversight by dispersed shareholders over the management of the company, focusing on disclosure to shareholders and the functioning of the board. In contrast, in the past, and to a large extent still today, the corporate governance problems in South Africa arise within control bloc situations. The conduct of mining finance houses is one example. As in other emerging markets, it is a priority in South Africa to ensure that control blocs do not abuse their positions, ultimately to the detriment of other providers of capital, such as minority shareholders. Here disclosure, conflict of interest rules and the certain aspects of shareholders meetings are more important. The board has a less important, but not negligible, role.
In following the Cadbury approach so closely, the King committee neglected the control situations that predominate in South Africa, and the governance concerns that arise from them. The Code is silent on the conflicts that arise in a control situation, and is likewise silent on conflict of interest rules. The committee’s decision not to insist on truly independent non-executive directors is, in this context, a blow. As a consequence, there has regrettably been little public debate about the benefit of corporate governance solutions for these situations. One exception to this, in the area of accounting standards and dealing with related-party transactions, is discussed in a following section.
Focus on the board information and operation. The King report successfully focused attention on the need for proper board composition, information provision, monitoring and participation in decision-making. The report and its appendices contain useful discussions on the role and functioning of the board, and in particular the audit and remuneration committees. These sections of the report have been influential, and the committee performed a valuable service in drawing attention to these issues. The Code requires that audit and remuneration committees be established, and specifies a prominent (but not necessarily majority) role for non-executive directors on these committees.
The appointment and independence of non-executive directors. However, the Code’s good work on the role of specialist committees is not matched by an equivalent rigour with respect to the appointment and independence of the non-executive directors who play a key role in these pivotal areas. The two major deviations from the Cadbury Code are here: the requirement that non-executive directors be independent of management is abandoned, and the requirement that the chairman be non-executive is watered down. In addition, there is no mention in the Code of the nomination process for new directors, or the need for or the procedure of a nominating committee. This brings into question those board functions where independence from management is important.

59
In conclusion, the King committee’s approach has not been powerful enough to address problems in either the management supervision or the control bloc contexts.
The effect of the Code. The Code has been remarkably successful in raising public consciousness about corporate governance. It is not clear that it has been widely implemented in practice. While, there has not been a study of the extent of implementation, the market impression is that, even among listed companies, full compliance remains the exception. The slow adoption of the Code in practice may have been the result of its extensive non-governance content, which consists of a series of wide-ranging but somewhat vague stipulations on communication to stakeholders, worker participation, affirmative action, and a code of ethics.
The authors of the Code may have envisaged a dynamic whereby institutional investors, individual investor advocates, the media and stakeholder groups such as trade unions would rally around the Code, effectively making its adoption by companies a prerequisite for public support. This would create an attractive dynamic, but has not yet happened. The lack of use of the Code by financial institutions in day-to-day interaction with the companies invested in is perhaps the most surprising.
The Code remains essentially voluntary, even for companies listed on the JSE. Listed companies are requested to state in their annual reports the extent of compliance with the King Code, but neither this disclosure nor actual compliance have hitherto been required.
In August 2000 developments aimed at strengthening and updating the Code were announced. As part of its new listings requirements, the JSE will henceforth require that auditors of listed companies disclose the extent of non-compliance with the Code. The Code itself remains voluntary. The custodians of the Code, the Institute of Directors, also recently announced that the code is to be updated by a committee again chaired by Mr. King.
Stock exchange regulation: the new JSE listing requirements
The JSE has reacted swiftly to the twin blows of the departure of the primary listings of South Africa’s largest companies to London and the collapse of the initial public offering market sketched in Section II. It has published extensive proposed changes to the requirements for listing. Corporate governance receives much attention in the proposed changes. The powerful position of the Exchange as a gateway to listing, and its interest in the integrity of its market, have been confirmed. Changes that deal with governance are summarized below. The proposals falls into four parts.

60
Structures that distort voting power no longer accepted. Pyramid companies and companies with differential voting shares will no longer be allowed to list on the JSE. However, pyramid companies and low voting shares that are already listed will be allowed to retain their listing.
Move to more stringent accounting standards compatible with IAS. First, listed companies will henceforth be required to adhere to Generally Accepted Accounting Practice as defined by the South African Institute of Chartered Accountants, which amounts to, or exceeds, the International Accounting Standards*. Previously, firms only had to adhere to what was generally practised, a lower and more slowly changing accounting standard.
Governance disclosure requirements. Secondly, improvements have been made to disclosure on corporate governance. Disclosure of the following will be required:
Information pertaining to directors’ qualifications and probity. Prior to listing, companies will be required to submit a declaration by each director, which is designed to evaluate the qualifications, experience and integrity of the directors. The information required is extensive, including other directorships, any liquidations or special creditor arrangements with any of these companies, convictions in relation to indictable offenses, public rebukes of the person by regulatory or professional bodies, and whether the person has ever been disqualified by a court from acting as a director. In addition, companies will be required to update and disclose similar information on a regular basis.
A summary of the directors’ powers and responsibilities with respect to self-dealing. Specifically, the company has to disclose the rules governing the ability of directors to vote on proposals or arrangements in which they are materially interested, including (but not limited to) remuneration, credit extension to directors and retirement arrangements for directors.
A statement of all interests per director, direct and indirect, in the share capital of the company. The disclosure will distinguish between beneficial and non-beneficial interests.
A statement, per director, of all forms of remuneration. This needs to be disclosed in detail annually, specifying all material benefits received from the company, including fees, salary, bonuses, expense allowances, pension contributions, commission or profit-share and share-options.
* Firms may also elect to adhere directly to IAS.

61
All dealings by directors in the securities of the company. The purpose of this provision is to limit insider trading, and to make the dealings of directors in the securities of companies in of which they are directors more transparent.
A directors’ statement on the extent of compliance with the King Code. Directors will be required to issue a statement commenting on the extent of the company’s compliance with the King Code. Compliance with the Code remains voluntary.
Substantive governance recommendations. The further innovation in the new JSE listing requirements is a further set of corporate governance principles for all listed companies. This new set of principles goes beyond the recommendations of the King Code and seems likely to become more important in practice. Yet, like the King Code, it is not compulsory, and firms are required only to disclose their level of compliance. But the value of the new principles lies in their emphasis on aspects not adequately covered in the King Code, including for the first time, a requirement concerning the independence of non-executive directors.
Important innovations are:
The board should have a formal schedule of matters specifically reserved to it for decision, and should record its conclusions in discharging its duties and responsibilities.
Directors should receive appropriate training upon joining the board.
Directors should receive further briefing from time to time particularly on relevant new laws and regulations and changing commercial risks.
The majority of non-executive directors should be independent of management and free from any business or other relationship which could materially interfere with the exercise of their independent judgment.
Directors should have unrestricted access to all company information, records, documents and property.
Remuneration of executive directors, both at the level of policy and individual packages, should be set by a remuneration committee comprising a majority of non-executive directors.
No director should be involved in fixing his or her own remuneration.
The directors should, at least annually, conduct a review of the effectiveness of the group’s system of internal control and should report their findings to shareholders.

62
A mandatory audit committee made up of a majority of non-executive directors and chaired by one of them, with written terms of reference.
The main elements and guidelines of the new JSE set of governance principles are in Appendix 1. The definition of independent directors merits further discussion. The principles insist that the majority of non-executive directors be independent of management and, more vaguely, of other business relationships which could materially interfere with the exercise of their independent judgment. To be truly independent, these directors − a minority on the board − also need to be independent of the controlling shareholders or control bloc. Such a requirement is not spelt out, and if it were, would elicit resistance from the many family and founder-controlled firms on the JSE. Given the concerns about control bloc abuse, it is necessary that at least a minority of directors be independent both of management and the controlling shareholders.
Accounting standards: a breakthrough with related-party transactions
Related-party transactions are a common feature of business. Enterprises often carry on different parts of their business through separate subsidiaries, which may sometimes have different shareholders as is the case in joint ventures. Related-party transactions are less innocuous when they are transactions of substantially different entities (with different shareholder profiles) and they are transactions that would not have been entered into between unrelated parties or would have been entered into at a different price. These are cases of self-dealing, the most important corporate governance problem where shareholder blocs exercise effective control.
The major South African instruments dealing with governance − the Companies Act, the King Code on corporate governance and the new listings requirements of the JSE − neglect the problems caused by related-party transactions other than those where directors are involved.
The SA Institute of Chartered Accountants − the guardian of what constitutes Generally Accepted Accounting Practice in South Africa − has addressed the issue in 1999 by issuing a new addition to GAAP, Accounting Statement 126, that will require disclosure of related-party transactions.
The essence of the rule is to require disclosure of transactions, including amounts and descriptions of the transaction, that have occurred between related parties. Parties are related where
One party has the ability to control the other party or exercise significant influence over the other party in making financial and operational decisions.

63
The definition of related parties is further expanded to include individuals who have significant influence over either enterprise, their close family members and interests, as well as key management personnel, their close families and interests.
In addition, the Accounting Statement requires that related-party relationships where control exists should be disclosed irrespective of whether or not there has been a transaction.
Even with the new listings requirements of the JSE in place, the statement potentially provides the strongest weapon against the abuse of control bloc situations in South Africa. There are some concerns about implementation:
Firstly, auditors are struggling to define and monitor related-party transactions, particularly in complex groups. As the statement is new, its application and effects still remain untested. In some firms management information systems will need to be upgraded to produce the data required to comply with the statement.
Secondly, disclosure is after the fact.
One way to buttress this arrangement is to provide a role for the board or a board committee to assess large-scale related-party transactions before they are finalized. While such a requirement falls outside of the scope of the accounting profession, it can conceivably form part of the JSE listing requirements or, alternatively, of companies legislation.
The accounting statement is based on International Accounting Standard (IAS) 24, and attests to the persuasive power within professional communities of international norms. The South African version has been expanded beyond IAS 24 to include related-party transactions with jointly controlled entities, and to include related-party transactions where both parties are controlled by the state.

64
The role of legislation: the Insider Trading Act
When insider trading is committed by a director, senior executive or bloc shareholder with privileged access to non-public, price-sensitive information it falls within the realm of corporate governance. It is a (admittedly peculiar) type of related-party transaction in which shareholders are disadvantaged to the private benefit of the insider. The media and other market observers have long considered insider trading to occur regularly on emerging markets exchanges such as the JSE. There is little direct evidence for this, but run-ups in share-prices ahead of announcements have occurred on the JSE, particularly in smaller equities. High perceived levels of insider trading in a market or a corporation is often taken to be a sign of other, perhaps hidden problems, such as related-party transactions generally, abuse of minorities, and perhaps even share-price manipulation. On the JSE minority investors have periodically withdrawn from companies − and categories of companies − where insider trading is reputed to be rife.
In recent years the number of jurisdictions with laws in place to combat insider trading has surged, to 87 in 1998 compared to 34 in 1990. But developed and emerging markets alike have struggled to use the legal weapons. By 1998, only 24 percent of emerging markets with legislation in place had achieved even one prosecution (and even fewer a conviction); overall less than half of all jurisdictions have reached the prosecution stage.
Based on preliminary results, South Africa’s Insider Trading Act (passed in 1998) is an example of successful insider trading legislation despite limited prosecutorial resources. In the first six months of operation the Insider Trading Directorate achieved six settlements (‘settlements’ play an important role; see below), and in the following three months it proceeded with two further civil suits and one criminal prosecution.
The market reaction has been striking. In six cases the identity of the person involved was disclosed, and extensive media coverage followed. In the cases where the person involved was a senior executive, company share prices fell by 8-20 percent within a week. In one case a company was forced by its falling share price had to abandon its takeover strategy and was ultimately acquired by another company. In another case the managing director was implicated and ultimately dismissed.
Why the strong market reaction? An insider trading settlement or prosecution involving a senior executive is probably taken to be a signal of poor corporate governance by investors. The companies involved in these actions have been small or medium caps, and the adverse investor response seems to have affected this part of the market more broadly. Along with the market reaction has come a palpable change in sentiment: previously many investors did not consider insider trading as odious; now not only

65
institutional investors, but also retail investors and corporate managers, consider it unacceptable to traded on inside information.
Why these early signs of success? Insider trading legislation around the world is fairly standard, and in many respects the South African law is in line with that of its peers. But the legislation does contain three innovations:
• The Act provides, beside the usual criminal liability for insider trading offenses, for civil liability, which has a lower burden of proof. The criminal burden of proof has often proven almost insuperable.
• Possible offenses are investigated by the Insider Trading Directorate which can offer to withdraw further litigation in return for a payment. These ‘settlements’ are announced in the media, usually naming both the company and individual involved. These settlements have had a dramatic effect on the share-prices of firms involved and reportedly also on market attitudes to insider trading. In the absence of a settlement the Directorate can pursue either a criminal prosecution or a civil suit, depending on the facts and evidence of the case.
• Settlements and other damages are deposits in a fund to be distributed to shareholders who had traded in the share during the period of the offense and had suffered losses as a result of it.
The role of legislation: expanding directors’ liability
Business corporations in South Africa have legal personality and are bound by criminal and civil law, including a common law duty of care towards employees. Corporations are held criminally liable for crimes committed by their employees or agents on corporate instructions or with corporate permission. In other words, shareholders indirectly suffer financial loss when the firm has incurred either a civil or criminal liability.
But this situation is not fully satisfactory, because neither shareholders nor their directors suffer direct financial damage and, unless they were personally involved, they cannot go to jail. When the critical conversations or instructions have not been recorded, it is difficult to prove the direct involvement of key individuals.
Corporate accountability in health, safety and the environment. In recent years South African legislation has attempted to sharpen corporate accountability for corporate actions by declaring certain corporate or workplace misconduct or negligence to be criminal offenses. Important examples are in mining safety (in the Mine Health and Safety Act of 1996) and environmental degradation (in the National Environmental Management Act of 1998). Either responsible officials (the Acts require that all corporations nominate these) or the company itself can be found guilty of a

66
crime. Responsible officials − who are employees and can be, but do not have to be, directors − face a fine or a prison sentence; if the company is found guilty of a crime, it can be fined. While these provisions have caused little litigation, they have had, reportedly, a major effect on the attitudes of corporate leadership to health and safety issues.
Director criminal liability for corporate crimes. Until recently, when a company was found guilty of an offense, its directors were also deemed guilty of the offense as individuals. Directors in this position were personally liable for punishment unless they could prove that they did not take part in the contravention and could not have prevented it. This is a difficult onus, and in 1997 South Africa’s Constitutional Court declared the section (which had become law in 1977) invalid, as it violated the constitutional right to presumption of innocence. More recently, the National Environmental Management Act used a similar provision to create criminal liability for directors in the case of the company having been guilty of environmental degradations declared to be criminal in the Act. This provision has not yet been tested for constitutionality. While these types of provisions are potentially important, they have rarely, if ever − not even while there was no cloud of unconstitutionality hanging over them − been used.
Director civil liability for reckless corporate trading. When a company has traded recklessly or fraudulently, a court may declare that a director (or any other person) who was knowingly a party to these activities is personally liable for all or any debts or liabilities of the company as the court decides. Unlike the two other instances, this provision has a number of times been the subject of litigation.

67
V Black empowerment and corporate governance
Following democracy in 1994, it has been an objective of society to shift the racial distribution of income, wealth and economic power in South Africa. Labour, licensing, procurement and civil service policies all reflect this objective. ‘Black economic empowerment’ (BEE) has been an important element of this effort. The notion refers mainly to transactions that increase black ownership and control of private businesses. In this section we discuss the experience of empowerment during the first six years of democracy, and the implications of the process for the management and governance of the corporations concerned.
It should be noted that these efforts at economic redress occurred against a backdrop of the government having accepted market economics and much else besides, including the role of the established ‘white’ companies, property ownership, shares and other financial claims and contractual rights generally.
Government’s embrace of capitalism created a political imperative for black capitalists and black corporate success. And, for a dazzling period in the mid-1990s, the market delivered rapid and significant increases in black corporate ownership and control. Within 52 months, companies which blacks ‘control or have significant influence over’ went from one percent of JSE market capitalisation to 16.3 percent. Landmark deals − involving two medium-sized life insurers, large English and Afrikaans language media houses, a large IT concern, the number two national mobile telephony firm and a venerable mining house − created a slew of leading black-controlled companies and resulted in the emergence of a small number of senior black business leaders.
The deals were driven by two forces. The first was financial engineering techniques that enabled black organisations and investors to take strategic and often controlling stakes in listed entities without supplying any of their own funds. These techniques are explained in the following section. The second force was the need for many established firms to position themselves favourably in the eyes of government. South African direct government expenditure exceeds a quarter of GDP; state-owned enterprises control an asset base of more than 12 percent of GDP; and government regulation and licensing are pivotal to commercial success in numerous industries, including finance, telecommunications, broadcast media, mining, fishing and beverages.
The early successes, though remarkable, fell far short of South Africa’s demography. It did, however, enable observers, in and out of government, to postulate further rapid increases in black economic power. But this did not happen. In fact, black control of the JSE fell in 1999 and has not recovered. This reversal is due in large part to the vulnerability of the

68
techniques used in the face of the prolonged market downturn of the late 1990s. The techniques have also had important consequences for corporate governance. We next probe the financing structures used, and tease out the governance implications.
The financial engineering behind black empowerment
The main challenge of empowerment has often been described as creating capitalists without capital. Figure 8 illustrates the approach most often used.
The financing stratagem. The process would start with a listed company, whose parent or itself would identify a strategic need to do the transaction. A black empowerment group, consisting of prominent individuals or groups (such as unions), would be identified to make a strategic or controlling investment, and the shares would be offered at a discount of 10-20 percent to market value. The discount was critical to the financing structure. In the conventional and early incarnation, the empowerment group would not put up any money or assume any risk or debt. The funds would be provided by a financial institution such as a bank or an insurer as a portfolio investment. The funder would lend the funds to a company created by the empowerment group to house its investment (the loan would usually be in the form of variable rate ‘interest’-bearing preference shares, repayable after 3-5 years, for tax reasons). The funder would also take some non-voting equity in this ‘vehicle company’. Much of the equity, and all voting equity, would be issued to the empowerment group at no cost.
Figure 8 The conventional approach to black empowerment Source: Genesis Analytics
20-55 % of listed shares
Vehicle Co.
AssetsLiabilities
Interest in Listed Co.
[Equity price risk]
Residual:
Equity
Preferential Debt[Interest rate risk]
Funds to buy listed shares
Equity & control for nil
Listed Company
Funder
Black Investors
Denotes flow of cash funds
20-55 % of listed shares
Vehicle Co.
AssetsLiabilities
Interest in Listed Co.
[Equity price risk]
Residual:
Equity
Preferential Debt[Interest rate risk]
Funds to buy listed shares
Equity & control for nil
Listed Company
Funder
Black Investors
Denotes flow of cash funds

69
The economic effect of this transaction was quite simple. If, as was invariably assumed, the shares of the listed company increased in value beyond some threshold, the increase in value would be shared by the black empowerment group and the funder, often on a roughly fifty-fifty basis. In other words, the black empowerment group, which had no capital at stake or repayment risk, received the equivalent of a free option in the shares of the listed company. The funder, on the other hand, faced real credit risk, with no recourse to the empowerment group, if the shares in the listed company did not perform as anticipated.
Listed empowerment vehicles. The most prominent empowerment companies went on to a second stage, during which either the black investor group (shown as a black square in the graphic) or the investment vehicle was listed on the JSE. This enabled the now listed empowerment firm to raise capital, enabling it to also do deals to which it had to commit its own capital. To retain the profile of an empowerment company, the empowerment vehicles had to ensure that the original black investors retained control upon listing, despite the dilution of their shareholding. This was often effected by issuing no-voting shares to the public or by putting in place a pyramid structure, or both.
The effect of the emerging markets turmoil on empowerment. The vulnerability of this structure to financial stress was duly revealed by the market turmoil of 1998. All the action happened in the balance sheet of the investment vehicle as shown in the graphic. During that year, as the emerging markets crisis spread to South Africa, prices of the shares of listed companies plummeted, and have in many cases never fully recovered. At the same time, short-term interest rates shot to the highest levels since World War II as the South African Reserve Bank tried to stabilise the currency.
This combination, by increasing the debt liabilities of the investment vehicle while simultaneously decimating the value of its only asset, reduced the equity value of the investment vehicle to zero, often pushing it to the brink of bankruptcy. In many cases the empowerment groupings were left unscathed, but with no upside. And the funders were faced with an invidious choice: either be seen to undermine and unravel empowerment efforts, or to continue to fund an investment that made no commercial sense. Most of the agreements stipulated that upon default by the vehicle company, the shares in the company originally invested in would be transferred to the funder to allow it to recoup it losses, but also removing the original empowerment effect.
Not all the empowerment transactions have failed. Notably one black media and telecommunications group, Johnnic, has succeeded on the back of the strong share performance of its mobile telephone unit. But the pace has slowed. Overall, fewer empowerment transactions are now done than in the

70
mid-1990s, black control of JSE market capitalisation has not increased beyond it previous peak, and the objectives and techniques of empowerment are being reassessed.

71
Empowerment structures and corporate governance
A factor that has contributed to market disenchantment with BEE Mark I has been the ambiguous and sometimes negative effect of these structures on the quality of corporate governance. It is important that this should be seen in the context of a long history of weak governance among South African corporates. Black empowerment companies happened to come along at the time that the market was becoming more sensitive to governance abuse generally. But the conventional empowerment structures did pose some particular problems that are discussed here.
As the graphic above shows, there are usually four economic entities involved in an empowerment transaction: the black investment group (often not incorporated), the financial institutions providing the funding, the vehicle company and the established company, with real business operations, in which the investment is made. Although corporate governance is important in all of these, the focus of the market has been on the effect of empowerment transactions on the governance and management of the operating company ultimately invested in. That company tends to be by far the largest, has business operations and an asset base that need to be actively managed, and is usually listed, with a large institutional minority shareholder base. Another focus has been on the governance of those empowerment groupings that have themselves listed. Three governance issues have come to the fore in empowerment, and are discussed in turn.
The financing mechanism leads to a separation of risk and control
One criticism of the conventional structure, as described above, is that control is captured by a group, the empowerment investors, with skewed incentives: the group shares in the upside above has a given threshold, but has no risk on the downside. This may make it rational for the group to undertake very risky ventures in those cases where the investment’s value has fallen below the threshold, and therefore has a zero value for them. Shareholder democracy is intended to work differently, and to lead to a risk-adjusted maximisation of the value of the firm.
Compelling as this concern is in theory, it is not clear that it has been a problem in practice. One very high-profile case, involving a mining house, may be construed as such a gamble for redemption. But in may cases the empowerment bloc did not gain control; and where they did, their behaviour may have been circumscribed by funders, who are aware of the problem created by skewed incentives. Generally, as the next

72
point shows, empowerment blocs have been too little involved in corporate decisions, rather than too much.
Empowerment groupings have an incentive to diversify holdings and relinquish focus
Consider the incentives of the empowerment group. The group is not investing its own capital. Each investment is in effect a free option on the shares of an operating company. It is perfectly rational for the group to collect as many of these free options, in as diverse a set of industries as possible, in the hope that a number will come off.
This trend led to a loss of focus by many empowerment groups, and it reduced their ability to contribute to corporate decision-making in any particular investment, or to monitor effectively the managements of the operations they had invested in. Ironically, the broader-based, and therefore more attractive, the empowerment group, the less likely they were to participate actively in the governance of the operating company.
Empowerment has contributed to the revival of n-share and pyramid control structures
As empowerment firms graduated from the no-capital approach and listed on the JSE to raise their own capital, they were caught in a dilemma. In order for the original empowerment bloc to retain control, and therefore the all-important moniker of a ‘black’ company, it raised capital by issuing no-voting shares (n-shares) or retained control through a pyramid structure. These abnegations of shareholder power were fixtures of the JSE in the past (see Section III), and the tide, driven by international investor sentiment, was turning against them. According to folk wisdom, in the mid-1990s the Exchange was about to outlaw new n-share issues when their adoption by empowerment groups buried the issue. As empowerment deals gave pyramids and n-shares new-found respectability, their use among non-empowerment groups picked up markedly.
The road ahead for empowerment acceleration
Political power, the transformation of the civil service, improved education and a more equal commercial playing field will drive black advancement in society and in corporations. But the pace so far has been slow, and political and other pressures will seek to accelerate this process. Chief among these may be the role of pension funds. In terms of South African pensions law, 50 percent of pension fund trustees represent employee (or member) interests. These trustees, particularly those in the public sector, increasingly include empowerment as a consideration in their choice of asset managers. By this they mean the identity of the asset managers and, more importantly,

73
the investment of funds in ventures that promote black empowerment. According to one estimate, government pension fund and other empowerment-influenced money will account for around 70 percent of total growth in industry assets under management in the next two years.
What is attractive about this dynamic is that it is self-correcting. Trustees will always seek to ensure that returns on their members’ investments are satisfactory, particularly as most of the empowerment-sensitive funds are defined contribution funds. That will impart a market discipline on empowerment investment.
A second trend, like this trend, is a rethink on the reliance on debt that characterised the empowerment deals of the 1990s. The limitations of debt finance for empowerment purposes arise from the fact that the critical factor for corporate growth is to generate and reinvest free cash-flow. Acquiring a company by what is effectively a leveraged buy-out diverts that cash flow to service debt, rather than to build the company. Black empowerment will in future, like community empowerment processes around the world, in future rely more than before on group savings and the leveraging of operational skills.
Both of these trends − the increasing involvement of institutional money and commitment of own capital and skills − will contribute to healthy governance of empowerment corporations.

74
VI Business and political processes
The discussion up to now has been within the framework − established intellectually by economists and in legislative terms by public authorities − in which listed companies are governed and managed. It has been about the accountability of a company, represented by its board of directors, to its owners (shareholders), about the accountability of executive management to the board and about the company’s access to new capital.
This model, which originated in the UK and the USA, and which has been widely spread by the globalisation of capital markets, is wholly valid. But, as elsewhere in the world, this view also turned out to be insufficient for the demands faced by South African companies from the 1970s onwards.
Until the 1970s, South African companies and their managers adhered to a narrow view of their role in which they were primarily accountable to the controlling shareholders, whether a mining finance house or a founding family. Political and social involvement was rare, and where it was present, would be animated by the world-view of an enlightened founder, rather than be part of the ordinary conduct of the company.
As black activism increased throughout the 1970s, large South African companies realised they could no longer − despite their best efforts − focus solely on commerce, while remaining oblivious to the disruptive events, realpolitik and moral imperatives (roughly in that order) emanating from South Africa’s political system. Three events in particular sounded the alarm:
• The Soweto riots of 1976 shattered the complacency of the white elites in politics and business. The riots highlighted the appalling conditions under which the urban blacks, also those employed by large firms, lived, travelled to work and were educated. Most of all, the riots undermined the government’s confidence in the effectiveness of its apartheid policy, and the confidence of the business sector in the country’s political stability.
• The organisation of African labour unions in the 1970s brought the political struggle to the factories and mines of the large firms. For decades business had lived comfortably with a prohibition on African workers organising or joining unions, participating in the collective bargaining process designed for white workers, or striking. Mine riots and strikes by African workers at Durban factories in 1973 signalled the end of this era.

75
• The 1970s also saw the start of South Africa’s international isolation, a process that accelerated in the 1980s, and ultimately had direct commercial consequences for those very large firms, such as Anglo American and South African Breweries, that had international ambitions.
In the reaction of the large business firms to the events of the 1970s one can see the seed of conception of the social roles and responsibilities of corporations broader than that envisaged by either the Anglo-Saxon model or South African practice until that time. These traditional approaches did not incorporate the wider social roles played by companies, or allow for the fact that there are always a variety of interested parties beyond the owners, directors and managers in any company. Unless these parties are satisfied with conduct of the business − as an entity, but also as part of the business sector − they can adversely affect its performance. These considerations abruptly became a reality in the 1970s.
The broader conception of the role of a corporation and how it is governed took hold fitfully and partially among South Africa’s large businesses from the late 1970s on. A small number of highly influential companies led the process, and it is chiefly their efforts that are described below. But over the next two decades even the most recalcitrant of the large firms shifted towards a broader sense of their responsibilities. Virtually all large South African firms would by 1990 have subscribed, at least in principle, to this view of corporate obligations:
It is essential that the board, as custodian of the integrity of the enterprise, ensure that the interested parties are identified, their interests understood and relationships with them established so that opportunities for mutual benefit are realised and the chances of hostile behaviour are minimised. The board can be said to be accountable to shareholders and, in the company’s own long-term self-interest, to have obligations to other stakeholders.
What did this mean in practice? Has it changed its form under a democratic government? And does it imply real change in the governance of companies, whether in terms of structure or conduct?
The social role of corporations in practice From 1976 onwards, large businesses and the organisations in which they were represented adopted, for the first time, an active political and policy role. A critical mass of firms at least accepted that some reform was required. Corporate efforts were aimed at accelerating reform, starting with the proximate causes of the actions in Soweto and at companies, namely urban conditions and the labour rights of African workers.

76
Urban issues. In 1976 the Urban Foundation (UF) was founded by large businesses to address the problems of housing, infrastructure provision and education in the country’s cities. The Foundation lobbied the government to relax its policies on the rights of Africans to live in ‘white’ cities as well as to scrap policies that forbade the free movement of Africans around the country. Large firms also directed corporate responsibility funds to urban and education projects.
Labour reform. In the mid-1970s, a number of influential business executives called for a commission of enquiry into collective bargaining rights for African workers. Following the Wiehahn commission’s report in 1979, African unions were legalised. By 1982 all the major employer bodies had recognised the major African unions in their industries, and from 1984 African employees had the same employee rights as white employees. Many businesses opposed these measures; a few others, such as mining house Anglo American, had actively lobbied for the changes and allowed the new African and non-racial unions access to its workers for recruitment. By the late 1980s, all big firms with mining and manufacturing interests were engaged annually with the new unions in bargaining processes which often involved strikes and other forms of collective action. The unions won large improvements in wages and conditions of employment for African workers and, more subtly, undermined the traditional authoritarian management style and forced a more consultative approach.
From the mid-1980s, as political repression intensified and international isolation grew, some large firms directed their efforts to encourage changes to the political process. Executives were involved in early talks with the then-banned African national Congress, and a business body, the Consultative Business Movement provide the secretariat to the 1992-94 negotiations that led to the democratic elections in 1994.
Has corporate political and social involvement changed in the 1990s? In the uncertain political environment of the early 1990s, large businesses intensified their non-commercial participation in political processes and society. These took two forms: participation in tri-partite policy bodies and social investment.
Tripartite participation. The 1994 government formalised in legislation an informal tripartite structure for policy consultation and negotiation that had formed during the transitional period of the early 1990s. The statutory body, called the National Economic, Labour and Development Council (or Nedlac), provides for representation from government, labour unions and business organisations, as well as, to a more limited extent, from non-governmental organisations. These representatives meet in four chambers dealing with labour legislation, macro-economics, trade and industrial policy,

77
and development issues (the work programme of this chamber was not as clearly defined as the others). Its activities are a mixture of negotiation and consultation. The government is committed by law to negotiate labour legislation in Nedlac with the business and labour representatives; only if agreement is not reached may the government move ahead with its own legislation. The other chambers are consulting forums, although important policy frameworks − such as those dealing with competition policy and trade reform − have effectively been negotiated there.
Business representation at Nedlac is chiefly organised through an umbrella body of sectoral bodies and chambers of commerce called Business South Africa. Business South Africa proceedings are ultimately dominated, although indirectly, by large companies and their interests, as these are the only entities with the resources and stamina to participate in the sector bodies, Business South Africa meetings and Nedlac sessions.
As the African National Congress has gained experience in government and having confirmed a large popular mandate in the 1999 elections, the importance of Nedlac as a policy-making body has diminished, and its role as a consultative forum used to inform governments departments of the views of prominent interest groups such as businesses and labour unions has come to the fore.
Business social programmes in the 1990s. In 1992 the Joint Education Trust, a body aimed at improving the black education system, was founded, financed by the business sector but directed by business, political, labour and community leaders. In 1995 Business Against Crime was founded to provide resources and research for the state’s efforts to combat crime. In the late 1990s, the Business Trust was formed: listed companies have agreed to contribute one percent of their market capitalisation to the Trust, which will ultimately invest several billion rand in tourism and education and training. The Trust’s governance structure provides for the involvement of the national president and senior cabinet ministers.
Did the governance of companies change in terms of structure or conduct? The South African companies that pursued a wider social agenda during the 1980s and 1990s did so within their traditional structures of governance. While some mining houses did study the concept of worker directors during the early 1990s, no such structural changes occurred (in 1999 one mining company, Anglogold, did appoint a union leader as an ‘ordinary’ director). Ironically, the companies that were socially progressive were not also pioneers in improved corporate governance in terms of the role of the board, disclosure of director remuneration or splitting of the roles of chief executive and chairman.

78
The South African companies that were the socially most active were control bloc companies. Perhaps, under propitious circumstances, such companies can more easily act in ways that are novel, unpopular and that cut against the accepted grain. However, the role of particular individuals, both owners and managers, was, in all cases, critical. And the times were unusual. One cannot tell from this experience whether a particular structure would make a company more responsive to social needs than would others.

79
Concluding remarks
I Corporate governance and South Africa’s growth path
Upon assuming power in 1994, the African National Congress, hitherto a socialist movement, gingerly embraced capitalism, which the party embedded in a latter-day social democratic programme. The programme combined strengthened labour rights and expanded social services with conservative fiscal and monetary policy, reserving a central role for capital markets in the allocation of resources and for private firms in production.
Government taxation and spending have redistributed resources to the poor, but it is recognised that government action alone cannot achieve the advances sought by black South Africans. Instead, the government has gambled that the orthodox capitalist part of its programme will deliver GDP growth, resulting in employment gains and higher living standards. The name of the government’s 1996 economic stabilisation package − the Growth, Employment and Redistribution policy, or GEAR − encapsulates this approach.
Upon these policy foundations is built South Africa’s post-1994 modus vivendi. Blacks enjoy political power and increased social services and expect, through growth, better prospects. Whites have been spared confiscation of their assets, and are able to continue to work and invest in a capitalist economy. But it is a reluctant consensus, with sniping from both left and right.
What has been missing is the growth. South Africa’s economic performance has been better in almost every respect in the period since 1994 than in the preceding five years. But growth has disappointed, averaging 2 percent, with higher unemployment and growing numbers of South Africans in poverty. Were growth to remain this low, the tentative consensus on which post-1994 South Africa is based could be in danger.
Various explanations are given for the poor growth performance, ranging from the Emerging Markets crisis of 1997-1998 to a poor skills base to numerous micro-economic inefficiencies. Many observers agree that a proximate cause of the low growth lies in the country’s low investment rate, which has hovered barely above the replacement rate of capital stock. And, given the country’s poor savings performance during the late 1990s (as detailed in section II), limited capital inflows have further constrained investment.
These constraints mean that a high premium is placed on South Africa’s capital markets and private corporate sector (1) succeeding in attracting

80
savings, particularly foreign inflows; and (2) ensuring that capital is allocated and managed as efficiently as possible. Upon these factors rest the importance of corporate governance for South Africa’s future development. As this paper has illustrated, South Africa’s private corporations play a dominant role in the management of capital stock, in control over savings, in the allocation of investment and in the generation of output and exports. How these corporations are governed and monitored, and how decisions are made within them, have an impact on international and local participation in South Africa’s capital markets, and in the efficiency with which capital is deployed. Difficulties in monitoring companies, self-serving decisions by control blocs, insider trading and rent-capturing by complacent managements harm not only the company, but also − if these abuses are widespread − South Africa’s capital markets, and ultimately its economy.
The pivotal role of corporate governance and management has now been recognised in South Africa. This is evident from the spectrum of instruments that have effected improvements in governance, ranging from market discipline, to voluntary compliance, to legislation. What remains for future research is the efficacy of these measures. A future research agenda would define techniques to measure the efficiency of corporate governance and capital markets allocation and monitoring in South Africa, and trace the effects of the various interventions discussed.
That said, it would be unwise to succumb to a kind of capital markets fundamentalism. While corporate governance and capital markets are important, they are not a developmental silver bullet. Ultimately, well-functioning capital markets light up the true costs and opportunities in an economy society, and direct resources accordingly. Foundational conditions for growth become, if anything, more critical under effective capital markets. These growth foundations include high savings rates, a sound general education system, well-functioning labour and product markets, and good public administration. While efficient capital markets reflect the growth prospects of a country, the direct feedback from capital market signals to these critical policy areas is often weak and indirect. Healthy capital markets and sound corporate governance need to be complemented by brave political government.
81
II Corporate governance and the Emerging Markets Crisis of 1997-8
The emerging markets crisis of 1997-98 drew attention to the nexus between sound corporate governance and effectively functioning capital markets. While the crisis was set off by currency, interest rate and asset price volatility, it was perpetuated by vulnerable corporate and banking balance sheets unable to absorb the volatility. The vulnerable balance sheets, in turn, raised questions about how corporations were governed.
Balance sheets in the modern economy are linked: one firm’s liabilities is another’s assets. The value of those obligations is very sensitive to financial volatility when firms are highly geared, as was the case to an extraordinary extent in crisis countries. Balance sheets were weak in other ways too. Looking back, currency, maturity and interest rate risks carried by both financial sector and real economy firms were excessive and not well understood. Asset quality was revealed to be a further problem: subsequent analysis shows that new investments by listed corporates in the crisis countries were destroying value throughout much of the 1990s (investment returns were systematically lower than the cost of funds). Investments and loans were often made for the benefit only of special (connected) interests; and too much faith was placed in the feverish market values of equity holdings during the boom times.
Such is the perfection of hindsight! With the benefit of that perspective, though, the corporate pathologies at the heart of the crisis − connected lending, politically inspired investment and excessive risk-taking − point towards deficiencies in corporate decision-making and governance.
The severity of the crisis, moreover, showed that poor corporate governance can have massive negative externalities, providing grounds for possible policy intervention. For most advocates such intervention would be to strengthen, rather than weaken, the role and functioning of capital markets: financial opacity, a lack of protection for minorities and entrenched control in a corporate economy can lead to low availability of funding even for exemplary firms.
That explanation raises many questions. Why did capital markets in the crisis countries not require sound governance as a precondition for providing capital? This is not well understood. In the crisis narrative, to paraphrase Sherlock Holmes, capital markets were the dog that did not bark in the night. Markets (including banks) showered capital on firms with poor governance and conduct − and then, as the crisis intensified, withdrew capital precipitously and indiscriminately. Under what circumstances are capital

82
markets better at the ‘meta’ level of insisting on sound governance structures? How can this role be strengthened?
South Africa’s experience. South Africa’s experiences during the 1990s, and the many fronts along which reforms are taking place, may throw some light on these questions. Within a fairly short period, corporate structures that had been in place for many decades were thrown asunder, replaced by more rational and internationally acceptable approaches. One clear lesson is that capital markets discipline can, at least in some cases, enforce sound corporate governance. It would be valuable to analyse the factors that contribute to market forces playing such a sentinel role, as well as to discuss the limits to what the market can do on its own. In the South African case non-market devices, such as sound legislation, a vigilant regulator and the setting of voluntary industry standards will be essential.
The importance of being modest. In the South African debate, the protection of shareholders, and the long-term maximisation of the value of a firm, have been the main driving forces behind governance reform. In the country there has been less emphasis than elsewhere on the potential role of better governance in forestalling future crises of the Asian type. Perhaps that is just as well. The current emphasis on corporate governance in the crisis aftermath, while very welcome, calls for some caution. Clearly, if more companies in the crisis countries had stuck to prudent funding practices, financial turmoil would have been less.
But, while helpful, sound corporate governance principles alone will not inoculate economies against the systemic build-up of dangerous imbalances in corporate and banking balance sheets. The prudence exercised by corporate governors tends to be relative in approach: is our firm out of line with our peer firms?
It would be difficult for anybody in the corporate governance chain − whether manager, board member or brokerage analyst − to assess an economy wide trend, for example increased use of short-term foreign-currency funding. No doubt again one day circumstances will be such as to persuasively rationalise generalised imprudence, irrespective of how sound the governance. As past Federal Reserve chairmen Paul Volcker once said: as long as greed and fear remain part of the human genetic make-up financial crises will happen. Sound corporate governance will often not stand in the way of system-wide build-ups of risk.
However, sound corporate governance has benefits for developing countries that are more pervasive, if less dramatic. In the case of South Africa, as the first conclusion shows, sound governance is required to bolster the flow of foreign and domestic savings, to ensure the most economically effective

83
allocation of limited capital resources, to promote stable capital markets, and to contribute to a sense of fairness in the corporate sector.
Hence the need for corporate governance reform, at individual company level, at market level, and at a national legislation and supervision level. While it is not yet clear what the optimal capital markets arrangement is for developing countries, one thing is certain: whatever the eventual shape of a developing country’s financial markets, widespread sound governance will a prerequisite for effective capital markets and, increasingly, a precondition for market access by individual companies.

84
Appendix 1
Principles of corporate governance issued by the JSE
A Directors
A1 The board Every listed company should be headed by an effective board which should lead and control the company.
A2 Chairman and chief executive officer There are two key tasks at the top of every public company − the running of the board and executive responsibility for the running of the company’s business. There should be a clear division of responsibilities at the head of the company which will ensure a balance of power and authority, such that no one individual has unfettered powers of decision.
A decision to combine the posts of chairman and chief executive officer in one person should be publicly justified. Whether the posts are held by different people or by the same person, there should be a strong and independent non-executive element on the board.
A3 Board balance The board should include a balance of executive and non-executive directors such that no individual or small group of individuals can dominate the board’s decision taking.
A4 Supply of information The board should be supplied in a timely manner with information in a form and of a quality appropriate to enable it to discharge its duties.
A5 Delegation of duties
There should be a formal procedure for certain functions of the board to be delegated, describing the extent of such delegation.
A6 Appointments to the board
There should be a formal and transparent procedure for the appointment of new directors to the board.

85
Procedures for appointments to the board should be formal and transparent, and a matter for the board as a whole, although in practice nominating will usually emanate from the chairman or chief executive officer.
B Directors’ remuneration
B1 The level and make-up of remuneration Levels of remuneration should be sufficient to attract and retain the directors needed to run the company successfully, but companies should avoid paying more than is necessary for this purpose.
B2 Procedure for determination
Companies should establish a formal and transparent procedure for developing policy on executive remuneration and for fixing the remuneration packages of individual directors. No director should be involved in deciding his or her own remuneration.
C Accountability and audit
C1 Financial reporting
The board should present a balanced and understandable assessment of the company’s position and prospects.
C2 Internal control
The board should maintain a sound system of internal control to safeguard shareholders’ investment and for maintaining the appropriate relationship with the company’s auditors.
C3 Audit committee and auditors
The board should establish formal and transparent arrangements for considering how they should apply the financial reporting and internal control principles and for maintaining an appropriate relationship with the company’s auditors.
D Relations with shareholders
D1 Dialogue with institutional shareholders
86
Companies should be ready, where practicable, to enter into a dialogue with institutional shareholders based on the mutual understanding of objectives.
D2 Shareholder voting
Institutional shareholders have responsibility to make considered use of their votes.
D3 Evaluation of governance disclosures
When evaluating a company’s governance arrangements, particularly those relating to board structure and composition, institutional shareholders should give due weight to all relevant factors drawn to there attention and to eliminate unnecessary variations in criteria which each applies to the corporate governance arrangements and performance of the companies in which they invest.
E Restricted periods
Every listed company should practice the imposition of a restricted period in dealings in its securities by directors, officers and other selected employees preceding the announcement of its financial results or in any other period considered sensitive.
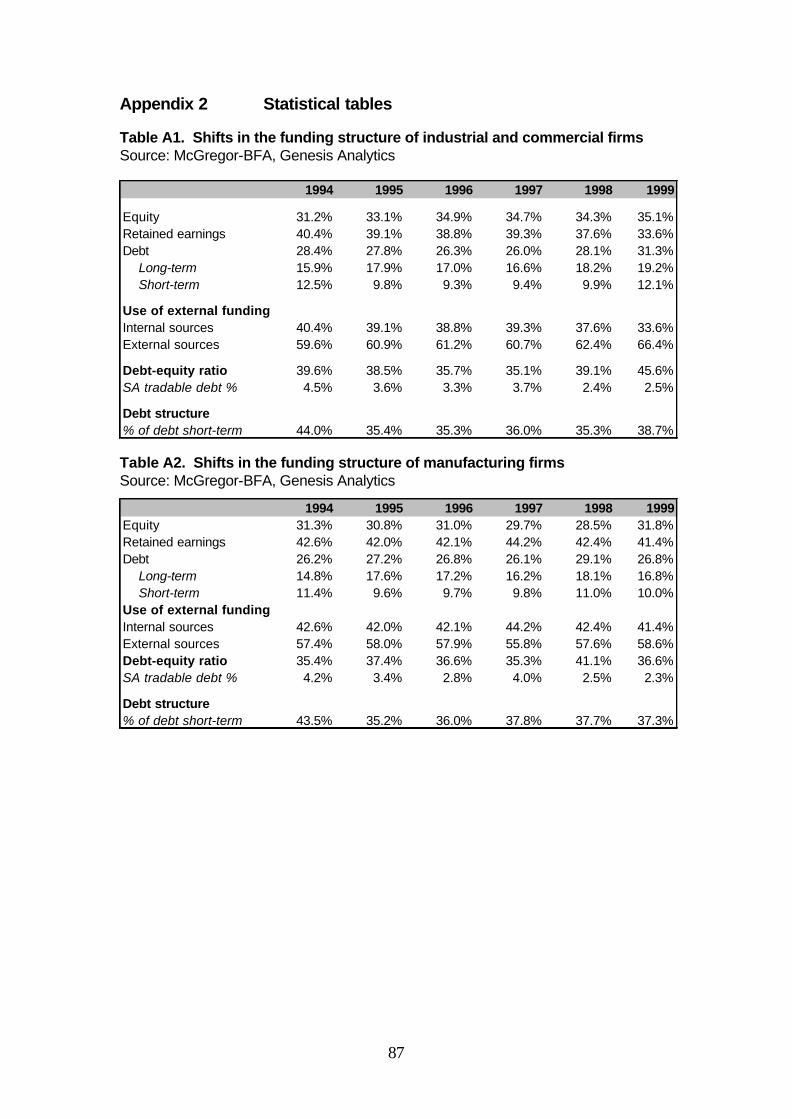
87
Appendix 2 Statistical tables
Table A1. Shifts in the funding structure of industrial and commercial firms Source: McGregor-BFA, Genesis Analytics
Table A2. Shifts in the funding structure of manufacturing firms Source: McGregor-BFA, Genesis Analytics
1994 1995 1996 1997 1998 1999
Equity 31.2% 33.1% 34.9% 34.7% 34.3% 35.1%Retained earnings 40.4% 39.1% 38.8% 39.3% 37.6% 33.6%Debt 28.4% 27.8% 26.3% 26.0% 28.1% 31.3% Long-term 15.9% 17.9% 17.0% 16.6% 18.2% 19.2% Short-term 12.5% 9.8% 9.3% 9.4% 9.9% 12.1%
Use of external fundingInternal sources 40.4% 39.1% 38.8% 39.3% 37.6% 33.6%External sources 59.6% 60.9% 61.2% 60.7% 62.4% 66.4%
Debt-equity ratio 39.6% 38.5% 35.7% 35.1% 39.1% 45.6%SA tradable debt % 4.5% 3.6% 3.3% 3.7% 2.4% 2.5%
Debt structure% of debt short-term 44.0% 35.4% 35.3% 36.0% 35.3% 38.7%
1994 1995 1996 1997 1998 1999Equity 31.3% 30.8% 31.0% 29.7% 28.5% 31.8%Retained earnings 42.6% 42.0% 42.1% 44.2% 42.4% 41.4%Debt 26.2% 27.2% 26.8% 26.1% 29.1% 26.8% Long-term 14.8% 17.6% 17.2% 16.2% 18.1% 16.8% Short-term 11.4% 9.6% 9.7% 9.8% 11.0% 10.0%Use of external fundingInternal sources 42.6% 42.0% 42.1% 44.2% 42.4% 41.4%External sources 57.4% 58.0% 57.9% 55.8% 57.6% 58.6%Debt-equity ratio 35.4% 37.4% 36.6% 35.3% 41.1% 36.6%SA tradable debt % 4.2% 3.4% 2.8% 4.0% 2.5% 2.3%
Debt structure% of debt short-term 43.5% 35.2% 36.0% 37.8% 37.7% 37.3%

88
Table A3. Shifts in the funding structure of services firms Source: McGregor-BFA, Genesis Analytics
Table A4. Shifts in the funding structure of ‘new economy’ (technology, media and telecommunications) firms Source: McGregor-BFA, Genesis Analytics
1994 1995 1996 1997 1998Equity 25.9% 48.8% 52.4% 51.2% 52.0%Retained earnings 38.4% 37.6% 31.7% 31.8% 29.9%Debt 35.7% 13.7% 15.9% 17.0% 18.1% Long-term 5.9% 8.1% 5.3% 11.4% 11.9% Short-term 29.9% 5.5% 10.5% 5.7% 6.2%
Use of external fundingInternal sources 38.4% 37.6% 31.7% 31.8% 29.9%External sources 61.6% 62.4% 68.3% 68.2% 70.1%
Debt-equity ratio 55.6% 15.8% 18.8% 20.5% 22.1%SA tradable debt % 2.8% 1.9% 1.6% 1.9% 1.6%
Debt structure% of debt short-term 83.6% 40.6% 66.3% 33.3% 34.3%
1994 1995 1996 1997 1998 1999Equity 32.8% 39.1% 46.4% 47.1% 45.7% 41.8%Retained earnings 30.6% 24.3% 25.2% 23.6% 24.8% 23.8%Debt 36.6% 36.6% 28.4% 29.3% 29.6% 34.5% Long-term 26.8% 23.7% 21.4% 20.4% 21.5% 22.7% Short-term 9.9% 12.9% 7.0% 9.0% 8.1% 11.8%
Use of external fundingInternal sources 30.6% 24.3% 25.2% 23.6% 24.8% 23.8%External sources 69.4% 75.7% 74.8% 76.4% 75.2% 76.2%
Debt-equity ratio 57.8% 57.7% 39.6% 41.5% 42.0% 52.6%SA tradable debt % 7.0% 5.3% 6.7% 3.3% 2.6% 2.5%
Debt structure% of debt short-term 26.9% 35.2% 24.5% 30.6% 27.2% 34.2%

89
Table A5. Shifts in the funding structure of ‘emerging’ firms (new and small firms, mostly in ‘new economy’ areas) Source: McGregor-BFA, Genesis Analytics
Table A6. Trends in debt-equity ratios Source: McGregor-BFA, Genesis Analytics
Table A7. Trends in use of external finance (% of total funding) Source: McGregor-BFA, Genesis Analytics
1994 1995 1996 1997 1998 1999Equity 55.2% 55.7% 48.6% 51.4% 74.6% 77.8%Retained earnings 30.6% 30.4% 38.4% 35.2% 0.7% 0.2%Debt 14.2% 13.9% 13.0% 13.4% 24.6% 21.9% Long-term 7.3% 6.1% 3.7% 4.3% 8.1% 11.5% Short-term 6.9% 7.8% 9.3% 9.1% 16.5% 10.4%
Use of external fundingInternal sources 30.6% 30.4% 38.4% 35.2% 0.7% 0.2%External sources 69.4% 69.6% 61.6% 64.8% 99.3% 99.8%
Debt-equity ratio 16.6% 16.2% 15.0% 15.4% 32.7% 28.1%SA tradable debt % 0.2% 0.1% 0.4% 1.0% 1.1% 1.0%
Debt structure% of debt short-term 48.6% 56.2% 71.3% 68.2% 67.0% 47.5%
1994 1995 1996 1997 1998 1999
Industrial & commercial firms 39.6% 38.5% 35.7% 35.1% 39.1% 45.6%
Manufacturing 35.4% 37.4% 36.6% 35.3% 41.1% 36.6%
Mining 14.2% 12.0% 16.2% 21.9% 9.2% 8.1%
Services 57.8% 57.7% 39.6% 41.5% 42.0% 52.6%
New Economy 55.6% 15.8% 18.8% 20.5% 22.1%
Emerging companies 16.6% 16.2% 15.0% 15.4% 32.7% 28.1%
1994 1995 1996 1997 1998 1999
Industrial & commercial firms 59.6% 60.9% 61.2% 60.7% 62.4% 66.4%
Manufacturing 57.4% 58.0% 57.9% 55.8% 57.6% 58.6%
Mining 77.1% 73.9% 70.2% 69.3% 62.6% 59.9%
Services 69.4% 75.7% 74.8% 76.4% 75.2% 76.2%
New Economy 61.6% 62.4% 68.3% 68.2% 70.1% na
Emerging companies 69.4% 69.6% 61.6% 64.8% 99.3% 99.8%

90
Table A8. Short-term debt (as a % of total debt) Source: McGregor-BFA, Genesis Analytics
Table A9. The financial structure of SA state-owned enterprises Source: Genesis Analytics
Table A10. The financial structure of three non-financial firms that shifted domicile to London
Source: McGregor-BFA, Genesis Analytics
1994 1995 1996 1997 1998 1999Industrial & commercial firms 44.0% 35.4% 35.3% 36.0% 35.3% 38.7%
Manufacturing 43.5% 35.2% 36.0% 37.8% 37.7% 37.3%
Mining 81.8% 70.8% 40.5% 23.1% 32.7% 46.0%
Services 26.9% 35.2% 24.5% 30.6% 27.2% 34.2%
New Economy 83.6% 40.6% 66.3% 33.3% 34.3% 46.4%
Emerging companies 48.6% 56.2% 71.3% 68.2% 67.0% 47.5%
Funds employed by source
All four SOEs Eskom Telkom Transnet Airports
Company Funds employed by source
Equity 19.6% 1.3% 29.1% 42.7% 48.9%Retained earnings 24.4% 42.4% 23.4% -6.6% 50.4%Debt 56.0% 56.3% 47.5% 63.9% 0.7% Long-term 43.2% 41.8% 29.0% 57.6% 0.7% Short-term 12.8% 14.5% 18.5% 6.3% 0.0%Use of external fundingInternal sources 24.4% 42.4% 23.4% -6.6% 50.4%External sources 75.6% 57.6% 76.6% 106.6% 49.6%Debt-equity ratio 127.1% 128.7% 90.5% 176.9% 0.7%Tradable debt % 47.5% 56.3% 29.5% 47.7% 0.0%Debt structure% of debt short-term 22.9% 25.7% 38.9% 9.9% 0.0%
Funds employed by source
LondonThree
Anglo American
Billiton SA Breweries
Equity 23.4% 22.6% 14.1% 52.4%Retained earnings 53.3% 59.8% 52.5% 9.7%Debt 23.3% 17.6% 33.4% 37.9%
Long-term 15.4% 12.9% 17.7% 27.8%Short-term 7.8% 4.7% 15.8% 10.1%
Use of external fundingInternal sources 53.3% 59.8% 52.5% 9.7%External sources 46.7% 40.2% 47.5% 90.3%Debt-equity ratio 30.3% 21.4% 50.2% 61.1%SA tradable debt % 3.5% 0.0% 5.5% 24.0%Debt structure% of debt short-term 33.7% 26.6% 47.2% 26.7%

91
Table A11. Sectors on the JSE, 31 December 1989 Source: McGregor-BFA
SectorMarket Capitalisation in
rands (end Dec 1989)
Sector mkt Cap as a % of JSE
mkt cap
Industrial holdings 49,269,618,850 13.471%Bev Hotel and Leisure 18,078,063,300 4.943%Building and Construction 3,246,091,770 0.887%Chemicals and Oil 11,321,892,480 3.095%Clothing 2,216,209,470 0.606%Fisheries 311,488,500 0.085%F o o d 10,258,768,900 2.805%Electronics 5,870,432,130 1.605%Furniture and household 1,033,610,610 0.283%Engineering 3,980,067,280 1.088%Motor 1,612,186,100 0.441%Printing and publishing 7,652,299,100 2.092%Pharmacy and medical 1,741,963,830 0.476%Media 596,248,200 0.163%Stores 8,434,451,820 2.306%Sugar 1,566,986,000 0.428%Steel and allied 2,015,928,300 0.551%Tobacco and Match 7,205,445,000 1.970%Transportation 915,653,480 0.250%Mining holding 24,600,315,400 6.726%Property 1,588,381,950 0.434%Mining houses 51,546,234,000 14.093%Investment trusts 3,507,543,420 0.959%Property trust 3,273,201,480 0.895%Development capital 322,258,130 0.088%Insurance 11,322,699,690 3.096%Banks and financial services 10,810,522,410 2.956%Gold Rand others 4,982,282,610 1.362%Gold Evander 2,645,450,000 0.723%Gold Klerksdorp 17,261,082,000 4.719%G o l d O F S 17,146,822,750 4.688%Gold West Wits 27,754,356,800 7.588%Mining coal 3,123,498,000 0.854%Mining diamonds 22,455,622,350 6.139%Mining copper 1,780,683,250 0.487%Mining manganese 3,587,318,500 0.981%Mining platinum 18,427,568,000 5.038%Mining tin 18,283,750 0.005%Mining other 996,177,400 0.272%Curtail operations 223060000 0.061%Mining exploration 1,045,295,140 0.286%Venture capital 11,453,400 0.003%
Total JSE market capitalisation 365,757,515,550

92
Table A12. Sectors on the JSE, 31 December 1999 Source: McGregor-BFA
SectorMarket Capitalisation in
rands (end Dec 1999)
Sector mkt Cap as a % of
JSE mkt cap
Venture capital 2,812,993,319 0.186%Development capital 1,406,799,717 0.093%Cash companies 56,969,031 0.004%Transport 30,023,171,832 1.982%Retail 69,343,350,276 4.577%Steel 7,952,800,507 0.525%Healthcare 6,674,323,231 0.441%Paper 14,535,571,034 0.959%Packaging and printing 13,710,718,272 0.905%Media 35,361,751,790 2.334%Furniture and appliances 5,499,606,641 0.363%Education and staffing 4,090,967,756 0.270%Food 46,282,259,355 3.055%Telecommunications 3,266,300,632 0.216%Information technology 79,914,010,260 5.275%Electronics and electrical 8,222,171,132 0.543%Development Stage 30,653,119,816 2.023%Clothing and Textile 911,300,432 0.060%Chemicals, oils and plastics 39,937,011,679 2.636%Building, construction and engineering 10,622,648,285 0.701%Hotels and Leisure 7,112,381,619 0.469%Beverages 58,390,836,060 3.854%Service 23,158,638,125 1.529%Diversified Industrial 121,488,704,599 8.019%Property Loan Stock 2,186,572,129 0.144%Property Unit Trusts 4,633,950,693 0.306%Property 15,984,589,388 1.055%Redevelopment 3,255,632,097 0.215%Investment Trusts 16,699,777,446 1.102%Short term insurance 13,659,361,208 0.902%Life assurance 124,463,479,762 8.216%Financial services 53,656,582,978 3.542%Banks 194,111,379,036 12.813%Private Equity funds 3,008,469,259 0.199%Mining exploration 943,166,644 0.062%Mining holding and houses 267,593,710,657 17.664%Metals and minerals 4,356,890,935 0.288%Platinum 59,484,710,312 3.927%Curtailed operations 24,001,935 0.002%Gold 54,068,830,721 3.569%Diamonds 72,697,606,604 4.799%Coal 2,667,704,101 0.176%
Total JSE market capitalisation 1,514,924,821,305
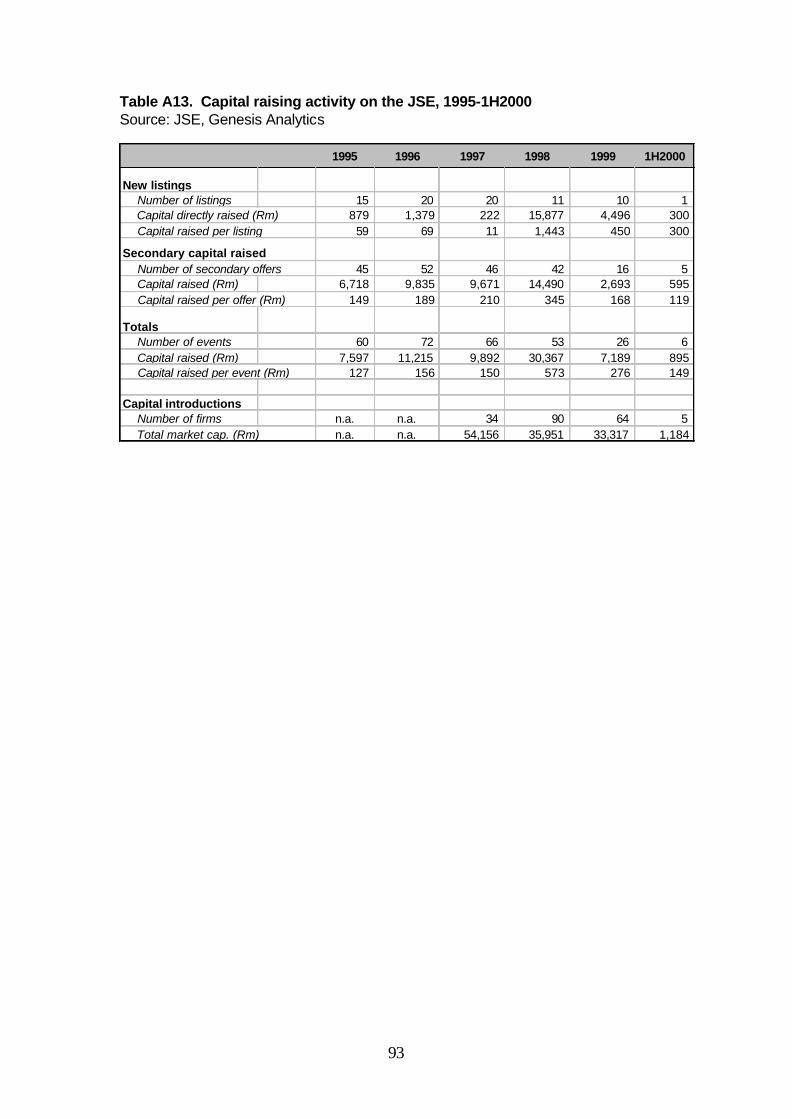
93
Table A13. Capital raising activity on the JSE, 1995-1H2000 Source: JSE, Genesis Analytics
1995 1996 1997 1998 1999 1H2000
New listings Number of listings 15 20 20 11 10 1 Capital directly raised (Rm) 879 1,379 222 15,877 4,496 300 Capital raised per listing 59 69 11 1,443 450 300
Secondary capital raised Number of secondary offers 45 52 46 42 16 5 Capital raised (Rm) 6,718 9,835 9,671 14,490 2,693 595 Capital raised per offer (Rm) 149 189 210 345 168 119
Totals Number of events 60 72 66 53 26 6 Capital raised (Rm) 7,597 11,215 9,892 30,367 7,189 895 Capital raised per event (Rm) 127 156 150 573 276 149
Capital introductions Number of firms n.a. n.a. 34 90 64 5 Total market cap. (Rm) n.a. n.a. 54,156 35,951 33,317 1,184

94
Table A14. Capital introduction on the JSE, 1997-1H2000 Source: JSE, Genesis Analytics
($, R in millions) 1997 1998 1999 1Q99 2Q99 3Q99 4Q99 1H2000 1Q00 2Q00
AllNumber 34 90 64 21 23 13 6 5 3 2 Total Market Cap Rm 54,156 35,951 33,317 4,699 17,532 10,281 806 1,184 741 443 Average Market Cap Rm 1,593 399 521 224 762 791 134 237 247 222 Average Market Cap $m 290 67 80 34 117 122 21 34 35 32
< Rm 150 ($m 25)Number 19 56 35 10 16 5 3 2 1 1 Total Market Cap Rm 1,351 3,190 2,483 666 1,117 485 216 144 100 44 Average Market Cap Rm 71 57 71 67 70 97 72 72 100 44 Average Market Cap $m 13 9 11 10 11 15 11 10 14 6
Rm 150-300 ($m 25-50) Number 4 16 13 6 2 2 3 1 1 nilTotal Market Cap Rm 737 3,360 2,691 1,231 343 528 590 200 200 nilAverage Market Cap Rm 184 210 207 205 171 264 197 200 200 n.a.Average Market Cap $m 34 35 32 32 26 41 30 29 29 n.a.
Rm 300-600 ($m 50-100) Number 3 8 8 3 4 1 nil 2 1 1 Total Market Cap Rm 1,427 3,137 2,807 1,110 1,315 383 nil 840 441 399 Average Market Cap Rm 476 392 351 370 329 383 n.a. 420 441 399 Average Market Cap $m 87 65 54 57 51 59 n.a. 60 63 57
> Rm 600 ($m 100) Number 8 10 8 2 1 5 nil nil nil nilTotal Market Cap Rm 50,641 26,263 25,336 1,692 14,758 8,885 nil nil nil nilAverage Market Cap Rm 6,330 2,626 3,167 846 14,758 1,777 n.a. n.a. n.a. n.a.Average Market Cap $m 1,151 438 487 130 2,271 273 n.a. n.a. n.a. n.a.
Rm 0-600 / $m 0-100Number 26 80 56 19 22 8 6 5 3 2 Total Market Cap Rm 3,515 9,688 7,981 3,006 2,774 1,396 806 1,184 741 443 Average Market Cap Rm 135 121 143 158 126 174 134 237 247 222 Average Market Cap $m 25 20 22 24 19 27 21 34 35 32

95
Table A15. trends in N-share discounts
Source: McGregor-BFA, Genesis Analytics
Share name N-share discount Share name N-share discount20 March 2000 31 December 1996
ADVANCED TECH SYST -N- 13.01% ADCOCK INGRAM LTD -N- 2.09%
ADVSOURCE HLDGS LTD -N- 59.09% ADVANCED TECH SYST -N- 14.17%
AFRICAN & OVERSEAS -N- 10.00% AFRICAN & OVERSEAS -N- 5.00%
ALLIANCE PHARMACEUTL -N- 14.29% ALLIANCE PHARMACEUTL -N- 2.50%
BOWLER METCALF LTD -N- -4.55% ANGLOVAAL LTD -N- 0.72%
BRIMSTONE INVESTMENT -N- 5.77% BOE CORPORATION -N- ORD 15.71%
CORONATION HLDGS LTD -N- 0.00% BOWLER METCALF LTD -N- 54.72%
FRALEX LIMITED -N- 50.00% CORONATION HLDGS LTD -N- 8.68%
GRINDROD UNICORN GRP -N- 7.41% FRALEX LIMITED -N- 0.00%
GROUP FIVE LTD -N- 16.45% GRINDROD UNICORN GRP -N- 42.22%
LA RETAIL STORES LTD -N- 1.67% GROUP FIVE LTD -N- 34.38%
MARSHALLS CONTROLLNG -N- -3.23% LEWIS FOSCHINI INV -N- 7.73%
MOBILE INDUSTRIES LD -N- 0.00% LOGTEK HOLDINGS LTD -N- 22.09%
MOLOPE GROUP LTD -N- 3.66% NASPERS LTD -N-
NASPERS LTD -N- - NEW AFRICA INVESTMNT -N- 5.52%
NEW AFRICA INVESTMNT -N- 0.72% PEPGRO LTD -N- 22.22%
PEPGRO LTD -N- -10.65% PICK N PAY HLDGS LTD -N- 11.11%
PRIMEDIA LTD -N- 7.22% PICK N PAY STORES -N- 9.30%
REX TRUEFORM CL CO -N- 6.84% PRIMEDIA LTD -N- 10.00%
SABVEST LTD -N- 14.29% REX TRUEFORM CL CO -N- 31.68%
SEARDEL INVST CORP -N- 29.31% SABVEST LTD -N- 33.75%
SPECIALTY STORES LTD-N- 11.11% SAMGRO INV HLDGS LTD -N- 60.00%
STORECO LTD -N- -2.54% SEARDEL INVST CORP -N- 6.49%
WOOLTRU LTD-N- 1.69% SPECIALTY STORES LTD-N- 4.41%
STORECO LTD -N- 0.00%
WOOLTRU LTD-N- 5.59%Average discount 10.06% Average discount 16.40%

96
Table A16. The top 20 companies on the JSE (excl pyramids) 1989 and 1999 Source: McGregor-BFA and Genesis Analytics staff calculations
Top 20 Mkt cap/JSE Mkt cap Top 20 Mkt cap/JSE Mkt cap1989 1999
ANGLO AM 6.78% ANGLO 10.68%DE BEERS 6.06% RICHEMONT 5.24%DRIES 2.90% BILLITON 4.99%RUSPLAT 2.85% DEBEERS 4.72%LONRHO 2.79% OLDMUTUAL 3.67%MINORCO 2.65% SABPLC 3.20%GFSA 2.65% FIRSTRAND 3.16%RICHEMONT 2.53% AMPLATS 2.66%BARLOWS 2.25% SBIC 2.32%SA BREWS 2.20% NEDCOR 2.14%JOHNNIES 2.18% ANGOLD 2.05%AMGOLD 2.14% SASOL 2.05%VAAL REEF 2.08% REMGRO 2.02%SASOL 1.99% M-CELL 1.84%REMGRO 1.91% DIDATA 1.82%FREGOLD 1.56% SANLAM 1.51%KLOOF 1.49% INVSTEC 1.45%AMIC 1.45% LIBERTY 1.27%WSTN DEEP 1.36% ABSA 1.17%SOUTHVAAL 1.18% BIDVEST 1.15%

97
Table A17. Size of capital markets by market value (% of GDP) Source: FIBV and Genesis Analytics staff calculations
Domestic, Domestic, Foreignprivate debt public debt debt
ADVANCED ECONOMIES
Australia 0.3% 18.2% 0.0% 92.7%Austria 15.6% 37.7% 2.4% 16.2%Canada 12.0% 0.1% 3.9% 94.0%Denmark 112.3% 59.8% 4.6% 54.0%France 10.5% 47.9% 0.0% 64.9%Germany * 64.2% 33.3% 12.4% 48.5%Italy * 4.2% 9.4% 0.0% 46.0%Japan 3.1% 47.6% 0.2% 55.9%Netherlands 42.0% 53.5% 0.2% 151.9%Portugal 8.9% 34.7% 0.7% 56.2%Spain 3.4% 3.4% 0.2% 127.8%
EMERGING MARKETS
Argentina 2.0% 17.7% 0.0% 15.2%Brazil n.a. n.a. n.a. 43.4%Chile 16.8% 22.1% 0.0% 73.1%Korea 26.8% 48.0% 0.1% 30.9%Malaysia 1.7% 0.0% 0.0% 127.4%Mexico 1.5% 1.5% 0.0% 24.1%Poland 0.0% 10.4% 0.0% 14.4%South Africa 0.9% 43.4% 0.0% 132.7%Thailand 0.0% 0.3% 0.0% 27.2%
% of GDP Equity