corporate governance in african banks: the role of
TRANSCRIPT

Corporate Governance in African Banks: The Roleof Institutions and Corporate Governance Code
Samuel Mutarindwa∗ Dorothea Schafer† Andreas Stephan‡
January 2018
Abstract
We investigate how corporate governance reforms (herewith called codes), countryinstitutional development and legal families of origin shape bank-level practices andultimate bank performance in a sample of 216 commercial banks drawn from 44African countries over the period 2005-2015. Using a difference-in-difference ap-proach for identification of effects, we find that bank governance (board characteris-tics and disclosures) respond to the publication of a corporate governance code moreoften in common-law countries that are characterized by strong institutional devel-opment than those from civil law traditions with weak institutions. The findings alsoreveal that that best performing banks are those with dispersed ownership structures;with institutional shareholders as the block holder and foreign banks given prevail-ing favorable country institutional environment. We contribute to the comparativecorporate governance literature by investigating the interactive relationship amongstdifferent governance frameworks at both country and firm-level and how this rela-tionship explains banks’ performance and stability in developing countries’ context.
Key Words: Corporate governance, ownership, codes, banks, institutions, performanceJEL codes: G21,G28,G30,G32,G38
∗Corresponding author: [email protected]†[email protected]‡[email protected]

1 IntroductionBanks perform major important roles in economies through their intermediation functionsof accepting deposits and giving loans, which serve as the main source of financing forbusinesses in all economics. Well managed banks can contribute decisively to the devel-opment of financial systems locally and globally and ultimately to the economic growthand development of nations (Caprio, Laeven, & Levine, 2007; King & Levine, 1993). Atthe same time, banking failures/crises could destabilize the entire economies of nationsas well as the global financial system as witnessed in the 2007-09 global fiscal crisis andearlier bank scandals. The banking system is particularly crucial in economies where fi-nancial markets are less developed. This is the case in most African countries. Banksare usually the major suppliers of financing (loans) to firms and private individuals. Bankperformance and stability is thus particularly important for African economies. Negativeexternalities of bank crises have pushed national jurisdictions and international bodies(e.g. BIS-BCBS) to require corporate governance reforms from banks (through rules,regulations, codes recommendations) to enhance investor protection, transparency, and tofacilitate more efficient bank monitoring.
In support for strengthening corporate governance of banks, the academic literatureargues that banks have idiosyncratic features different from other industries (e.g. opaque-ness of bank operations and stringent regulations) and thus, banks may require additionalgovernance reforms to their existing governance structures which might not be the casefor non-financial firms (Arun & Turner, 2004; Levine, 2004; Macey & O’Hara, 2003).Accordingly, there is a growing stream of literature mostly from advanced countries ofUS and Europe that study bank specific governance such as board of directors and own-ership and the implications they bear on bank behavior around the world (Adams & Fer-reira, 2007; Adams & Mehran, 2012; Bonin, Hasan, & Wachtel, 2005; Borisova, Brock-man, Salas, & Zagorchev, 2012; Micco, Panizza, & Yanez, 2007; Nielsen & Huse, 2010;Titova, 2016). However, the majority of these studies produce mixed and inconclusiveresults (see surveys by de Haan & Vlahu, 2016; John, Masi, & Paci, 2016). These stud-ies pay little attention on what explains differences in the bank-level governance andhow these differences could explain bank behavior in different countries. Yet, there isevidence that corporate governance reforms (codes, regulations, and rules) bearing pre-scriptions for firm governance especially on the composition and activities of the board,the separation of CEO from chairman’s what information should be disclosed (Thomsen,2006) and the protection of shareholders (LaPorta, de Silanes, Shleifer, & Vishny, 1998)enhance corporate value. In addition, studies also show that countries differ in their cor-porate governance reforms resulting from heterogeneity in their legal origins (Filatotchev,Jackson, & Nakajima, 2013; LaPorta et al., 1998), their legal frameworks and corporateownership (Millar, 2014); differences in national institutions and levels of economic de-velopment (Fang, Hasan, & Fang, 2014) observed in different countries.However, non-financial firms dominate these studies and little scholarly evidence paid attention to in-terdependencies between country and firm governance in bank and financial institutions.However, non-financial firms dominate these studies and little scholarly evidence paid at-tention to interdependencies between country and firm governance in bank and financialinstitutions (Busta, Sinani, & Thomsen, 2014; Caprio et al., 2007; Chen, 2015; Erkens,Hung, & Matos, 2012; Fang et al., 2014) studies are non-existent on African banks. We
1

contribute to closing this empirical gap by assessing the effect of a combination of coun-try institutions, reforms, legal families of origin on bank governance and ultimate bankperformance. We reveal that, country institutions and legal families matter for bank gover-nance and performance. Taken together, banks from African countries with higher qualityinstitutions; coming from common law legal traditions that have at the same time imple-mented corporate governance reforms (code of corporate governance) have better bankgovernance and show superior performance compared to those from civil law traditionswith poor institutional quality. We also contribute to the comparative corporate gover-nance research by assessing in relative terms compared to other parts of the world, thestatus of bank-level governance in Africa. We use a large sample of banks (216) frommany African countries (44) in a longitudinal perspective (11 years) which has been miss-ing in previous studies on African banks. A few studies available from Africa used singlecountry samples (Okike, 2007; Okpara, 2011; Wanyama, Burton, & Helliar, 2009) andfocused on generic firms Munisi and Randøy (2013). Those studies that had banks intheir samples only focused on bank level governance (Bokpin, 2013). With a large sam-ple drawn from many African countries, we comparatively show that African banks havesmaller boards that are less independent and less diverse than bank boards from both de-veloped and emerging economies identified in previous studies. The majority of the banksare very closely held; and disclose relatively little information in their annual report com-pared to banks from other parts of the developed and emerging countries. We provideexplanations for these observed differences. Specifically we explore the role of differ-ences in country institutions, legal families of origin and the implementation of corporategovernance codes. The reminder of this work is organized as follows. Section 2 reviewsthe previous literature on international corporate governance and derives testable hypothe-ses, paying special attention to the determinants of bank level practices and the impactsof interactions among country-level and bank level corporate governance on bank perfor-mance and stability. Section 3 presents the methodology and data including data sourcesand operationalization of variables. Section 4 analyzes and discusses the results of thestudy. The concluding section 5 highlights the study’s contribution, and provides areasfor future studies.
2 Literature review and hypotheses development
2.1 Codes of corporate governance and bank governanceWith the financial crisis and recent corporate scandals worldwide, transnational organi-zations, countries and firms have undertaken and continue pursuing initiatives aimed atimproving their corporate governance systems, structures, and processes. Such initiativesamong others include codes of corporate governance practices. Codes touch fundamentalgovernance issues such as fairness to all shareholders, clear accountability by directorsand managers, transparency in financial and non-financial reporting, the composition andstructure of boards, the responsibility for stakeholders’ interests, and for complying withthe law. Since their inception in the US (1978) and in the UK (1992), there have beenrapid creation of and diffusion of codes of corporate governance practices all around theworld (Aguilera & Cuervo-Cazurra, 2009). By 2015, 91 countries issued a code and a to-tal of 345 codes (91 first codes and 254 revisions) have been developed around the world
2

(Cuomo, Mallin, & Zattoni, 2016). Although codes of corporate governance codes aredesigned and enforced by countries and regulatory authorities (e.g. central banks in caseof banks), actual implementation is done at firm level. Studies have attempted to establishwhether firm adoption and implementation of codes of corporate governance have on in-ternal firm governance. v. Werder, Talaulicar, and Kolat (2005) suggest that they improvethe effectiveness of corporate governance system not performed by internal firm. Codesalso improve the functioning of boards of directors (Enrione, Mazza, & Zerboni, 2006)and are positively associated with improved board supervision and more outside experi-enced board members (Dahyaa & McConnell, 2005; Stiles & Taylor, 1993). Regardingfirm level outcomes, the majority of the studies focus on non-financial firms but resultsfrom those studies show that firms which adopted and complied with the Cadbury recom-mendations also had superior performance improvements compared to those that did notin different countries. Positive relationships between codes of corporate governance andfirm performance are reported in several studies in the US (Li, Pincus, & Rego, 2008);in Portugual (Alves & Mendes, 2004); in Mexico (Price, Roma, & Rountree, 2011) andin Germany (Goncharov, Werner, & Zimmermann, 2006). In Africa, there is very limitedand mixed evidence on the relationships between the code of corporate governance andfirm governance and performance (Munisi & Randøy, 2013). Okpara (2011) shows that,while developed countries design and implement effectively the codes, developing coun-tries especially those from Africa tend to mimic standards from developed countries byadopting them but firm compliance is limited due to weak legal systems. Okike (2007)and Wanyama et al. (2009) show in their study that effective implementation of corpo-rate governance standards in Africa have been hindered by higher levels of corruption;weak financial and regulatory structures which makes it very difficult for countries toenforce codes compliance. Aguilera and Cuervo-Cazurra (2009) note in their review ofcodes literature that institutional development is very important in the development andcodes. They also argue that codes compliance is low in developing countries’ contextswith weaker strong markets and weak legal institutions, compliance. In line with theabove studies, we suggest a non-linear relationship between corporate governance codesand bank governance. We thus postulate that:
Hypothesis 1 The relationship between codes of corporate governance and bank gover-nance is moderated by the strengths of legal systems and institutional development.
2.2 Legal families of origin, institutions and bank governanceAcross the world, governments and sovereigns have been either designed corporate gov-ernance reforms and in other cases adopted international standards on corporate gover-nance (Cuervo, 2002). However, the impacts of such reforms differ not only from onecountry to another, but also from firms to others (Essen, Engelen, & Carney, 2013) result-ing from heterogeneity in the legal families of origin (Filatotchev et al., 2013; LaPorta etal., 1998); colonial ties (Osemeke & Adegbite, 2016); differences in national institutionalenvironment and levels of economic development (Aguilera & Cuervo-Cazurra, 2009).LaPorta et al. (1998) uses the legal families of origin perspective to explain the develop-ment of certain corporate models existing in different countries around the world. Thelegal families of origin result into shared legal history, legal thinking and rules amongcountries belonging the same tradition (common/civil) and explain the development of
3

certain stable political, legal, and economic institutions in those countries over time.These institutional differences that emerge from the legal families result into differentforms of firm governance structures. They found compared to civil law countries, com-mon law countries had better investor protection laws resulting into improved financialdevelopment, better access to finance and diffuse ownership structures; had lighter gov-ernment ownership and regulation associated with less corruption, better functioning oflabor markets and small unofficial economies; and less formalized independent judicialsystems with more secure property rights and better contract enforcement. Subsequentcross-country studies find that common law countries are associated with low levels ofclosely-held firms (Claessens, Demirguc-Kunt, & Huizinga, 2001) and lower incidencesof government ownership (La Porta, Lopez-De-Silanes, & Shleifer, 2002). Bank gover-nance studies propose that common law countries have more widely held firms than civillaw countries (e.g. Azofra & Valentın Azofra a, 2011; Barth, Jr, & Levine, 2004; Beck,Demirguc-Kunt, & Maksimovic, 2004; Busta et al., 2014; Caprio et al., 2007; Cornett,Guo, Khaksari, & Tehranian, 2010; El-Chaarani, 2015; Laeven & Levine, 2009). Legalfamilies’ traditions and country institutions have been identified as additional influen-tial determinants of bank-level governance practices. The evidence shows that countrieswith weak legal systems of investor protection resulting from different legal heritages thatprotect shareholders will induce firms to restructure the composition and functioning ofbank boards more often than those that do not (Adams & Mehran, 2012; Chen, 2015; deAndres, Romero-Merino, Santamarıa, & Vallelado, 2012; Spamann, 2009). From thesestudies, we hypothesize that:
Hypothesis 2 Country institutions and legal families of origin improve bank-level gover-nance.
There is also empirical evidence that national institutions such as legal systems, regu-lations and investor protection rights are significantly associated with bank performance(Chortareas, Girardone, & Ventouri, 2012; Haselmann & Wachtel, 2010; Lensink, Meesters,& Naaborg, 2008). Strong institutions have also been associated with bank soundness incountries with strong laws, contract enforcement and legal environment (Klapper & Love,2004; Klomp & de Haan, 2015). Fang et al. (2014) study bank risks and stability resultingfrom institutional reforms in transitional economies and find that bank stability increasesafter countries reform their legal institutions, liberalize banking, and restructures theircorporate governance. We thus posit from the above studies that:
Hypothesis 3 Legal families and countries’ institutional quality are positively associatedbank performance.
2.3 Bank ownership, corporate governance and bank behavior2.3.1 Ownership concentration
The separation of ownership and management (Jensen & Meckling, 1976) results intoagency problems which can be severe in widely held firms (Fama & Jensen, 1983) asit becomes difficult for them to monitor the activities of managers than it could be thesituation in closely-held firms. Shleifer and Vishny (1997) suggest that having higherstakes in a firm creates incentives to monitor actively and very closely the activities of
4

managers which may also benefit minority shareholders. There is empirical evidence tosupport this claim. Desender, Aguilera, Crespi-Cladera, and Garcia-Cestona (2011) as-sess independence of the board and audit committees in closely held and widely held firmsand find that, board independence and audit committees are complementary in dispersedfirms and is the opposite for closely-held ones. Evidence shows that banks across theworld are closely held although there are varying regional country differences with US,Canada having the least and developing countries having the highest (Caprio et al., 2007)which poses a governance challenge. For instance, given the levels of opacity, informa-tion asymmetries and complexity of bank activities, diffuse and minority shareholders areexpropriated by the dominant shareholders such as investing in risky activities that maynot benefit minority investors (Levine, 2004). In an international study on banks by deAndres et al. (2012), lower levels of ownership concentration are associated with higherratios of independent directors in banks. Based on the evidence from the studies above,we suggest that:
Hypothesis 4 Closely held banks are associated with poor bank governance.
Some studies on banks examine the influence of ownership concentration on performanceof banks although the evidence remain mixed. In a European bank study, Busta et al.(2014) report negative correlation of ownership concentration and firm value (proxiedby Tobin Q) and argue that the impact is moderated by institutional environment. Inan international comparative study of East Asian and West European banks, Haw, Ho,Hu, and Wu (2010) find that that banks with concentrated control exhibit poorer perfor-mance, lower cost efficiency, greater return volatility, and higher insolvency risk relativeto widely held ones. Contrary, Caprio et al. (2007) report in their international study thatlarger shareholding boosts bank valuation conditioned by shareholder protection laws.Shehzad, De Haan, and Scholtens (2010) also find bank ownership concentration reducesnon-performing loans and improves capital adequacy but conditional supervisory con-trol and shareholder protection laws. Saghi-Zedek and Tarazi (2015) study the impact ofshareholders excess control rights on bank profitability in European commercial banksand find that excess shareholding is associated with lower profitability, higher earningsvolatility, and higher default risk before the financial crisis but the they find the oppo-site during the crisis period. In line with the above arguments, we suggest the followinghypothesis:
Hypothesis 5 The relationship between ownership concentration and bank performanceis non-linear conditional on the country’s institutional quality.
2.4 State-owned banks and governanceState owned banks increase agency conflicts especially in countries with weak and reg-ulatory institutions especially in developing countries (Borisova et al., 2012; Haw et al.,2010).There is also growing evidence on bank behaviour and state ownership. one strandof literature looks at how state ownership is related to financial development of countriesthey operate in. La Porta et al. (2002) report that government ownership was importantin many countries and was dominant in developing countries which are associated withper capita income; less developed financial, regulatory, and legal systems; and countries
5

with poor property rights. Andrews (2008) report similar findings for developing coun-tries. Outcome studies show pervasive effects of state owned banks especially those fromdeveloping countries. State owned banks in developing countries are associated with poorbank performance (Barth et al., 2004; Beck et al., 2004; Caprio et al., 2007; Cornett et al.,2010; La Porta et al., 2002); are less efficient than privately owned banks Berger, Clarke,Cull, Klapper, and Udell (2005); X. Lin and Zhang (2009); Micco et al. (2007); and havehigher non-performing loans (Micco et al., 2007). State owned banks are also associatedwith connected lending in some studies. Some studies report that State owned banks lendmore to un trustworthy and politically connected borrowers (which is detriment of otherfirms) especially in years leading to elections to further their political agendas (Dinc,2005; Firth, Lin, Liu, & Wong, 2009; Khwaja & Mian, 2005). We thus postulate from theabove studies that:
Hypothesis 6 State ownership is negatively correlated with bank governance and perfor-mance conditional on weak institutions and poor legal environment
2.5 Managerial ownershipRegarding managerial ownership, banks globally are associated with low levels of man-agerial ownership because of regulations in different country settings and investmentstrategies which affect CEO and directors’ incentive structures (Adams & Mehran, 2003;Booth, Cornett, & Tehranian, 2002). The intervention of states to reduce managerialownership imply that, such ownership type may adversely affect other firm governance.For instance, studies on non-financial firms show that this situation could enable CEOscontrolling the composition of the board and lessening its monitoring role (Hermalin &Weisbach, 1998; Jensen, 1993). In the banking sector, Grove, Patelli, Victoravich, andXu (2011) found that, with the opaqueness and complexity of banks, there is a higherchance that inside owners will use information asymmetries with outside investors toexploit them, worsening agency problems in banks and ultimately reduces firm value. K.-L. Lin and Chang (2016) examine the determinants of bank boards. They report that CEOshareholding is associated with higher independent directors’ ratio. On the contrary, Sal-loum, Jabbour, Digout, and Gebrayel (2015) find that although central bank’ regulationsrequired Lebanese banks to have audit committees in banks, the presence of equity man-agers in some banks impaired the effectiveness of audit committees. Some impact studiesfind that managerial ownership has implications for bank behaviour. evidence shows thatmanagers substantial shareholdings take less risks since bank losses and bankruptcy mayaffect their investments (Aebi, Sabato, & Schmid, 2012; Barry, Lepetit, & Tarazi, 2011;Bouwens & Verriest, 2014; Laeven & Levine, 2009) ; were associated with bank stabilityduring the global financial crisis (Berger, Imbierowicz, & Rauch, 2012). Studies also re-port positive results with performance (Westman, 2011) and market valuations (Belkhir,2009) . Following the evidence above, we expect a negative relationship between man-agerial ownership and bank governance and a non-linear relationship between managerialownership and bank performance these papers suggest that managerial ownership is asso-ciated with poor bank governance. We therefore make the following predictions:
Hypothesis 7 There is a negative relationship between managerial ownership and bankgovernance and a positive relationship between managerial ownership and bank perfor-mance
6
2.6 Institutional ownershipApart from equity owners as block holders, institutional ownership’s role in corporategovernance of firms has also been proposed in several theoretical and empirical studies.Shleifer and Vishny (1986) earlier postulated that institutional investors reduce agencycosts of managers by actively monitoring the activities of managers in firms if they ownsubstantial number of stakes. Bjuggren, Eklund, and Wiberg (2007) suggest that insti-tutional investors have abilities to process information compared to individual investorswhich gives them better ability to monitor managers of the companies they invest in. Ag-garwal, Erel, Ferreira, and Matos (2011) examine the role of institutional investors in 23countries and find that changes in institutional investors over time positively lead to pos-itive firm level governance. Institutional investors not only affect corporate governancebut also bank performance outcomes. In an international study, Erkens et al. (2012) studythe influence of corporate governance (institutional ownership and independent boards)on financial performance of 296 financial firms in 30 countries during the crisis and re-port worst stock returns for those firms that were owned by institutional investors andwhose boards were dominated by independent directors. They conclude that, prior to thecrisis, those firms took more risks which led to shareholder losses during the crisis andwealth transfer from block holders to debtholders. Barry et al. (2011) examine risk tak-ing and ownership structure of European commercial banks. When institutional investorsown higher stakes compared to individuals and families, they are likely to impose riski-est strategies and may ultimately increase bank risk. In line with the evidence above,we expect that institutional investors to improve bank governance and reduce but may bedetrimental to bank stability. we posit that:
Hypothesis 8 Higher stakes by institutional investors improve bank governance but re-duce bank performance and stability.
2.7 Origin of owners and bank governanceAnother emerging line of research on ownership is foreign and domestic ownership ofbanks. Although the literature is very small, available evidence shows that foreign in-vestors tend to help their fellow domestic investors to constrain tunneling by controllingshareholders. Sakawa, Ubukata, and Watanabel (2014) find that contrary to domesticowners, foreign owners tend to lower information asymmetries between them and man-agers of banks and are thus effective monitors and corporate governance. Hasan and Xie(2013) find in their study of Chinese banks and foreign ownership that foreign involve-ment in management of local Chinese banks improved corporate governance of Chinesebanks from a control based model to a more market oriented model. Regarding bankbehaviour, there is substantial evidence that foreign banks tend to outperform domesticones. For instance, in terms of efficiency and profitability, foreign banks perform betterthan domestic banks especially in developing and emerging economies than developedcountries Bonin et al. (2005); Fang et al. (2014); Focarelli and Pozzolo (2006); Lensinket al. (2008); Micco et al. (2007) but it is the opposite for developed countries Claessens,Djankov, and Lang (2000). Contrary, Lensink et al. (2008) study 2095 foreign banks in105 countries and find that bank foreign ownership is negatively correlated with bankefficiency, but this relationship is reduced by home and host country similarity in institu-
7
tional quality. The above discussion suggests that, foreign banks in developing countries(with higher domination of foreign banks compared to developed countries) will exertstrong governance, and will exert competitive and exert pressures on domestic banks tobecome competitive and efficient. It is also evident from these studies that their effects ondomestic markets depend in most cases on country effects. In line with the arguments pre-sented above, we expect the relationship between foreign ownership and bank behaviourto be positive and in addition, we expect the relationship to be moderated by institutionalquality of host countries. We thus propose that:
Hypothesis 9 Foreign owned banks are associated with superior bank governance andperformance compared to domestically owned banks.
3 Empirical Approach and Data
3.1 Identification StrategyIn order to identify how the introduction of corporate governance code in the variouscountries has impacted on banks’ corporate governance practices and on banks’ perfor-mance, we use a difference-in-difference approach (Angrist & Pischke, 2009). With thisapproach we can analyze how the introduction of the code has had an impact on variousvariables by comparing outcomes before and after the introduction. A diff-in-diff modelis equivalent to a fixed effects model where the introduction of the code is modeled as atreatment by defining a dummy variable that takes the value of 0 before the introductionand the value of 1 in the year of introduction and after introduction.
One could nevertheless argue that in this context of institutions and banks the intro-duction of the code is not an exogenous event but itself dependent on a number of country-specific institutional characteristics, and also dependent on the economic development ina certain countries. To take these factors into consideration, we use a two-equation modelwhere the first equation is a a fixed effects model and with year effects that describes cer-tain outcomes at the bank-level depending on a number of bank-specific controls and theintroduction of corporate governance code, modeled by the dummy variable CGcode:
bank-level outcomeit = f(µi, λt, bank-level controlsit,CGcodekt) + εit (1)CGcodekt = f(γt, country-level controlskt) + εkt (2)
where µi are bank-specific fixed effects, λt and γt are year effects, εit and εkt are the errorterms of equations (1) and (2) which are allowed to be correlated.
As equations (1) and (2) constitute a recursive system we estimate those two equationssimultaneous by utilizing Roodman (2009)’s cmp procedure, which handle equations withdifferently scaled dependent variables. While the dependent variable of equation (2) isbinary and is therefore described by a probit model, depending on the outcome that oneuses in equation (1) we other either OLS (fixed effects) or Tobit specifications for censoredvariables-
3.2 Data sources and variablesBank data is composed of individual bank data from BankScope database of Bureau vanDijk as well as country data from the World bank. BankScope provides bank-level char-
8

acteristics and indicators for bank performance, stability, and governance. In addition,we did hand search in the annual reports of companies for the years 2005 and 2015 andmatched it with (Claessens & vanHoren, 2015) dataset on bank ownership which runs upto 2013. We also did hand search for the countries that had a specific corporate governancefor banks in Africa. Data from the World bank pertains to country-level institutional de-velopment namely the world governance indicators; protection of investors and creditorsrights; and macro-economic variables (Worldank, 2015; Worldbank, 2015a, 2015b).
Bank data and country data were matched to investigate the relationship between in-stitutions, corporate governance, and bank performance. The final panel sample includes2375 bank years’ observations for 216 commercial banks across 44 countries from 2005up to 2015. We restrict the analysis to banks with comparable corporate governance struc-tures, and therefore exclude co-operative, savings, private and Islamic banks. The paneldata is unbalanced with some countries only represented by a few banks, while othershave a much higher sample share.
3.3 Dependent variablesIn our study, we perform a two-step measurements for dependent variables. First, we takebank-level corporate governance as dependent variables and in the second step, we takebank performance and stability as dependent variables.
Bank level governance We follow Bai, Liu, Lua, Song, and Zhang (2004); Barth,Caprio, and Levine (2006); Gompers, Ishii, and Metrick (2003); Song and Lei (2008);Zhang (2007) on measurements of bank-level corporate governance. The board of direc-tors’ variables are measured as follows: Board size is defined by the number of boardmembers in each bank. Non-executive directors’ or independent directors‘ ratio is usedas a proxy for board independence, where independent directors are those that do nothold an executive position in the company and do not have a stake in the bank. It equalsthe proportion of non-executive directors in each bank and is calculated by dividing boardsize less the number of board directors which are also executives in the company by boardsize.
No CEO/Chairman duality is a dummy variable that takes the value of 1 if the CEOof a bank is at the same time the chairperson of the board of directors of the same bankand 0 otherwise. Board committee variable is the number of board committees. Womenon board means the number of women sitting on the board of each bank and finally boardmeeting variable measures the average number of board meetings held annually in eachbank.
Disclosure and transparency were measured using the proxies previously used in (Baiet al., 2004; Barth et al., 2006; Gompers et al., 2003; Song & Lei, 2008; Zhang, 2007).The Big Four as auditors is a dummy variable taking the value of 1 if a bank is au-dited by Deloitte,Touche, KPMG, Ernest, Young and Price waters cooper house) and 0otherwise. Disclosure executive pay is dummy variable taking the value of 1 if a bankdiscloses director compensation and pay in its annual reports and 0 otherwise. Disclosureof shareholding is a dummy variable taking the value of 1 if a bank discloses directorcompensation and pay in its annual reports and 0 otherwise.
9

Bank performance and stability To measure bank performance, three ratios are used.The first one is Return on average assets (ROAA) (Adams & Mehran, 2003; De Andres,2008). This indicator equals after tax net income (profits) divided by average total assetsof bank. The ratio reflects the ability of a bank’s management to generate profits from thebank’s assets. The second proxy variable used in this study is Return on Average Equity(ROAE) which is a measure of how effectively shareholder’s funds are being used by themanagement of the company. ROE is a net income available to common stockholdersdivided by common equity. The third proxy variable is Non-performing loans. Nonper-forming loans (NPLs) are loans that are outstanding both in its principal and interest for along period contrary to the terms and conditions under the loan contract. Any loan facilitythat is not up to date in terms of payment of principal and interest contrary to the termsof the loan agreement is NPLs. Thus, the amount of nonperforming loan represents thequality of bank assets. We also measure bank stability and risk using Z-scores. We followprevious studies which use Z-score (Klomp & de Haan, 2015; Laeven & Levine, 2009) asan appropriate measure of bank stability. Z-score uses bank level data and measures thedistance to default of a given bank. It is computed as:
Z-score =ROA+ capital ratio
σ(ROA)(3)
where ROA= return on assets, capital ratio= Equity/Total assets and σ(ROA) is the stan-dard deviation of ROA. The measure indicates the distance of a bank from insolvencyproportional to the probability of default. A higher Z-score indicates that the bank ismore stable and probability of bankruptcy is low. We use BankScope bank-level data tocompute the Z-scores for African banks over the period 2005 to 2015.
3.4 Independent variablesBank ownership We follow Bai et al. (2004); Barth et al. (2006); Gompers et al. (2003);Song and Lei (2008); Zhang (2007) in in measuring bank ownership structures. Owner-ship concentration is measured as a dummy variable which takes the value of 1 if thebiggest shareholder has more than or equal to 10% of total ownership and 0 otherwise.The other ownership variable is the identity of the block holders. Government ownershipis a dummy variable which takes the value of 1 if the state is the biggest shareholder withmore than or equal to 10% of total shareholding. Institutional ownership is a dummy vari-able taking the value of 1 is the institutional investors are the biggest shareholders withmore than or equal to 10% of total shareholdings. Equity ownership is a dummy variablethat takes the value of 1 bank directors are the biggest shareholders with more than orequal to 10% of total shareholdings. Finally, the origin of the shareholders is anotherdummy variable taking the value of 1 if the biggest owner(s) are foreign shareholders and0 if they are domestic shareholders.
Legal families of origin The legal families of origin are measured following LaPorta etal. (1998) and Shleifer and Vishny (1997). In African countries only two legal origin arepresent: Civil law legal family and Common-law tradition. A dummy variable equalizing1 indicates that the banks are located in a Civil law country and 0 that it belongs to aCommon-law country.
10

Country corporate governance reforms and Institutional development We use (Kauf-mann & Kraay, 2008) to measure the level of institutional development. Six indicators areused in this respect; that is control of corruption (CoC), rule of law(RoL), political stabil-ity and absence of violence (PS), governance effectiveness (GE), regulatory quality (RQ)and voice and accountability. All the institutional variables are measured from a rangeof -2.5 (weak) to +2.5 (strong governance performance). We also include other measuresof institutional development specifically those related to the protection of shareholdersand credits rights in each country. We use the indicators used in the world bank doingbusiness reports and some that were previously used in (LaPorta et al., 1998). Protectinginvestors is measured by the strength of minority investor protection index (0-10); extentof conflict of interest regulation index (0-10); extent of disclosure index (0-10); extentof director liability index (0-10); ease of shareholder suits index (0-10); extent of share-holder governance index (0-10); Extent of corporate transparency index (0-10); strengthof legal rights index (0-12) and quality of judicial processes index (0-18). We use code ofcorporate governance as a proxy for country corporate governance reform. This indicateswhether a country has specific banking corporate governance code (s). It is measured as adummy variable that takes that value of 1 if a country in a year had a corporate governancespecific regulation and 0 otherwise.
Other control variables We first control for the firm size using the natural logarithm ofbanks’ total assets at the end of each fiscal year from 2005 to 2015. We also control formacro-economic factors including inflation, economic growth because they (adversely)increase the instability of the financial system. We also include GDP per capita to controlfor differences in economic development (see Table 1).
[Table 1 here]
4 Results
4.1 Descriptive resultsTable 2 shows descriptive statistics of bank and country characteristics and governancefor a sample of 216 banks drawn from 44 African countries over the period 2005-2015.The average board size for the banks is 9.46 ranging between a minimum of 3 and amaximum of 23 members. There has been very little variation in the board size over theperiod 2005-2015. Overall, the average board size in our study is lower than bank boardsize reported in previous international studies. For instance, de Andres et al. (2012) reporta mean of 16 board members in their study on banks from OECD countries; the averagesize for banks in the US range between 14 and 18. Adams and Mehran (2008) and deHaan and Vlahu (2016) report 15 board members on average for the European Union.
[Table 2 here]
Table 2 also reports the mean values for independent directors for the banks studied.We find that the average size of independent non-executive directors is 4.96 equivalentto 52% of the average board size for the banks in the sample with the minimum value of0 and the maximum value of 18. Like board size, we find that banks tend to have less
11

independent board members compared to those reported in studies from other parts of theworld. US studies found that mean values for independent non-executive directors’ rangebetween 70 and 85 percent in domestic banks (Adams & Mehran, 2003, 2012; Belkhir,2009); mean values for independent directors of banks in the OECD countries are re-ported to be 80 percent in banks from the OECD countries (De Andres, 2008), and Table4 shows country differences in terms of average board size differs as well across the sam-ple countries. The average board size for banks from most of the African countries rangebetween 5 and 10 members except a few countries such as Nigeria, South Africa, Tunisia,and Zimbabwe, Morocco, and Mozambique with average board sizes ranging between10 and 14.5. Table 2 shows that about 95% of the sampled banks had the positions ofthe chairperson/chairman of the board of directors and the CEO held by different persons(not chairman) except for a few banks in Egypt, Tunisia, Morocco, Libya, and BurkinaFaso. Regarding board diversity, we find that the average number of women on boardfor the sampled banks is 1.05 with a minimum of 0 and a maximum of 8 members (seeTable 2). Proportionally, 11% seats of the entire board seats are held by women with thenumbers increasing from 2011 to 2015. We also notice that South Africa has the high-est proportion of female directors followed by Nigeria and Zimbabwe. However, bankboards in Burkina Faso, Djibouti, Liberia, Libya, Gabon, South Sudan have no womenrepresentations on their boards (see Table 4). Regarding disclosures, the majority of thebanks (75%) use either Deloitte and Touche, Ernest and Young, KPMG and PriceWatersCooperHouse as their auditors and the reporting of this information in the banks’ annualreports has improved Over the years since 2007 more and more banks report this informa-tion in the annual reports although this number varies across different countries. while Inmost observed countries, banks tend to use the Big Four auduting firms mentioned aboveas their auditors, in some countries like Burkina Faso, Ethiopia, Liberia and Niger, banksdo not use them.The disclosure of executive pay Only Common law countries disclosethis kind of information5. However, the majority of the banks do disclose informationrelated to ownership structures in their annual reports (about 99% of the sampled banks).Our sample indicates that around 68% of the observations relate to banks controlled byat least one largest block holder. Table 4 reports the average representation of ownershipconcentration in each country. We observe that the percentage of firms with a controllingshareholder is the highest in Tunisia, Gabon, Liberia, SieraLeone and Swaziland (about100%). We also analyze the type of ownership across different countries. Majority banksin the sample are owned by owned by institutional investors (80%) across countries. Only9% of the banks are government owned except in for banks from However, Libya (57%);Morroco (56); Ethiopia (44%) and Democratic republic of Congo (36%) with higher havehigher representations of government ownership. We also observe that the mean of theequity ownership was the least in our sample. Lastly, in terms of the extent of foreignshareholding, we observe in Table 4 that Algeria, Burkina Faso, Rwanda, and Ugandahave the highest respresentation of foreign banks in their domestic markets compared toother African countries. Regarding performance measures, the accounting return rate ofthe banks sampled has a positive but very low value (1.90%) over the period studied. theaverage profitability ratio (ROE) is 15% and Non-performing loan ratio stands at 7.6%on average which is above international standards of 5The majority of countries belongto the civil law families of origin (61%) and the remaining countries belong to the com-mon tradition. 24 out of 44 countries have developed and implemented a bank corporate
12

governance code over the study period and 20 countries In terms of institutional quality,many countries in the sample have higher levels of corruption.Only a few countries suchas Botswana, Cape Verde, Rwanda, Mauritius, and South Africa report are associatedwith low values on corruption. The average values for rule of law is -0,50 with Botswana,Mauritius, and South Africa with the highest positive scores of rule of law. Overall gov-ernance effectiveness for most countries is negative throughout the study period exceptfor only south Africa, Botswana, and Mauritius (see Table 4). Table 4 also shows thatBotswana and Mauritius have higher positive values for political stability compared toother African countries. Most countries have negative values for voice and accountabilitythroughout the study period. On investor protection,
[Table 3 here]
[Table 4 here]
Table 5 shows descriptive statistics for bank governance and ownership in civil and com-mon law countries. The statistics reveal that banks from both common and civil lawtraditions are closely held with majority owners contributing more than 65% of share-holders. However, state and equity ownership are more frequently observed in civil lawcountries than in common-law banks. Institutional ownership of banks is more prevalentin civil law traditions than in common-law ones. Banks from common-law traditions havelarger boards with more independent and female directors compared to banks from civillaw countries. Common law banks also separate the positions of CEO and chairmen moreoften compared to the civil law banks. Common law banks tend to disclose more infor-mation on executive compensation and shareholding and use big4 auditors more than thebanks from civil traditions do. On the other hand, civil law banks perform better, are moreprofitable, are more stable and are bigger in size compared to those in the common-lawtraditions. However, the size of non-performing loans is higher in the civil law traditions.
[Table 5 here]
Lastly, at the country level, Table 5 shows that countries from common law originare less corrupt; respect more the rule of law; are more politically stable; govern better;possess more often quality regulations; and give more often voice to citizens compared tothe peers from the civil law tradition.
Univariate results We performed a pairwise correlation of the variables (Table 6 toestablish the strength of association between the variables and to avoid the problem ofmulticollinearity. Table 6 presents the Pearson product-moment correlation coefficientsamong country institutions, country governance, bank governance and governance andbank-specific variables.
[Table 6 here]
Table 6 show that although many of the pairwise correlation coefficients are statisti-cally significant, the correlation magnitudes are generally low and as such the problem ofmulticollinearity may not persist.
13

4.2 Multivariate regression resultsThis study employs two equations 1 and 2 using OLS and probit estimation techniquesin a longitudinal manner (panel data) to determine whether independent variables signifi-cantly influence the quality of bank-level governance characteristics. Finally, we analyzethe implications of both bank-level, country-level governance and institutions and legalfamilies of origin on bank performance. We present three sets of results. The first set ofresults describe how country institutions, code of corporate governance, ownership andother bank characteristics affect the level of bank governance, see Table 7. The secondset of results (see Table 9) measures the impact of all the above factors jointly with banklevel governance as additional explanatory variables on bank performance and stability.Note that equation (1) is specified as a fixed effects model with bank-specific effects.
The third set of results describe how the institutions and legal origin in the countryaffect the likelihood that the corporate governance code is introduced. These results referto equation (2). Note that both equations are jointly estimated and that we allow forcorrelation of error terms.
[Table 7 here]
4.3 Determinants of bank governance-resultsWe estimate Equation (1) using the panel model with fixed bank and year effects andEquation 2 using probit and tobit models with random effects. Tables 7 and Tables 8 re-port regression results for the whole banks sample (216 banks) from 44 African countriesover the period 2005-2015 where the dependent variable is the bank level governance(board characteristics as well as disclosure and transparency). When board characteris-tics are dependent variables, we find that the publication of a corporate governance codepositively affects board characteristics ( Table 7)). Results from the fixed effects modelreveal that the coefficients are significant on board independence (0.193, p-value< 0.01)and on the number women board members (0,0549, p-value< 0.01). The coefficients onboard size are negative although significant thus failing to support our expectation basedon prior literature. We concur with de Andres et al. (2012) that code of corporate gover-nance publication induces bank boards to reduce bank size and increase independence.
[Table 8 here]
We also estimate a random effects probit model (panel 2 in Table 8) instead of fixed effectsas it is not suitable in the context of binary dependent variable which is the introductionof corporate governance code at country level.1 Table 8 presents the results. We findsignificant negative relationship between corporate governance code publication and CEOduality. The publication of a corporate governance code encouraged banks to use big 4as auditors. Banks also do publish information relating to the disclosure of the directors’remuneration. Both model results show that that country’s institutions and legal family oforigin condition the influence of code of governance and is consistent with prior literatureand our study hypothesis 1.
1Note that if country-level fixed effects would be specified, most of the variables cannot be identified asthey do not possess variation at the country level.
14

[Table 9 here]
Tables 7 and 8 present both fixed effects (panel) and random effects(probit) regressionresults on the effects of legal families of origin on bank governance respectively. Resultsshow that the legal family of origin is significant and positive for board independence,board size, women on board, CEO leadership and disclosure of information in bank an-nual reports consistent with our study hypothesis 2(p-value< 0.01). Our findings concurwith previous findings on the relationships between legal families and corporate gover-nance (Busta, 2008) that legal families explain differences in the functioning of boards,and patterns of ownership structures across companies. Results also show that in bothEquations show that country institutional matter more for bank-level governance. Resultsfrom Equation 1 show that the proportion of independent board members in bank boardsare higher in those countries that have quality governance i.e. instances where govern-ments provide high quality public service, public policy, and where governments havehigh credibility of policy formulation and improvements (1.104, p-value< 0.01); coun-tries that are politically stable (0.280***, p-value< 0.01). Similar results are reportedon board size and on the proportion of women board members in Columns 2 and 3 ofTble 7 as well as on CEO duality in Table 8 column 3. Of unexpected sign are resultson the effects of regulatory quality and the effects of voice and accountability. Resultsshow that board independence, women on board and board size and is negatively relatedto the quality of state regulations and on voice and accountability scores (p-value< 0.01).Results in Table 8 from probit estimation Equation (2) also reveal similar relationships be-tween country institutions and bank information disclosures and transparency. At highersignificance levels (p-value< 0.01), higher levels of governess effectiveness and politi-cal stability increase the probability of using big 4 as auditors and influence positivelythe tendency of banks to report executive remuneration in their annual reports. In bothEquations (1) and (2), we find no significant relationship between protection of minorityshareholders and board size. We only find correlations on board independence (extentof transparency and extent of conflict of interest regulation indices). The extent of di-rector liability index also positively correlates with the increase in the number of womenon board. Many of the shareholder protection proxies are significantly related with CEOduality implying that, at higher levels of shareholders’ protection, tendencies of combin-ing the roles of CEO and that chairman in banks are low.We thus find strong support forour study hypothesis(H2) that most indicators of country institutional development shapebank governance in both Equations of our models.
4.4 Determinants of bank governance-extensionsOur results also reveal that ownership concentration is negatively and significantly relatedto board governance (independence, size, and women on board) implying that, at banksthat are closely-held have small boards; less independent boards and less diverse in termsof gender. Higher levels of ownership concentration are also adversely related to dis-closure of executive remuneration the banks (Table 8). From these results, we find strongsupport for our study hypothesis (H4). In terms of the identity of owners, results for Equa-tion (1) (Table 7) show that banks with more institutional investors have more and moreindependent directors (p-value< 0.01) and have larger boards (p-value< 0.01). Resultsalso in Table 8 suggest that the presence of a dual leadership structure is negatively as-
15

sociated with institutional ownership (p-value 0.01) implying that institutional investorshave more interest in corporate governance since they require the roles of chairpersonsand CEOs to be separated. Furthermore, in banks whose block holders are institutionalinvestors, there is a tendency for the banks to use big 4 as auditing firms and banks tend todisclosure executive pay information in their annual reports(table (1). n all equations, wefind strong support for our hypothesis (H8). The relationships between state ownership,managerial ownership on bank governance (board characteristics and information disclo-sures are insignificant thus, we fail to find strong support for our study hypotheses (H6and H7). The results for Equation (1) also suggest that board size increase significantlywith the increase in foreign ownership (p-value< 0.01).We find positive but insignificantrelationships between foreign bank shareholding and the proportion of both women andindependent bank board members. We thus find little support for our study hypothesis(H9).
For our control variables, we find that big banks have proxied by the log (total assets)insignificant for Board size, independence, and the proportion of female board members.The results are consistent across all the OLS regressions. We also find that big banks aresignificantly and positively associated with low levels of CEO dualities; disclose moreinformation concerning executive pay and use more often big four auditing firms com-pared to small banks. In other control variables we find significant positive relationshipsbetween bank governance and business cycle(economic growth rate). The coefficients arepositive and significant for board size, independence and women on board in the fixed ef-fects model.Similar findings are obtained in the probit model in table 8). Lastly, Tables 8and 9 also show that with the combined effects of both country institutions and bank-levelcharacteristics, bank governance has been significantly increasing over the years duringthe study period.
4.5 Performance and stability implicationsWe also assess the implications of both country and bank-level variables on bank perfor-mance and stability (proxied by ROA, ROE, NPL and Z-Score). The publication of codeof corporate governance significantly decreases bank return on assets and insignificantlyaffects return on assets (Table 9). In contract, it significantly reduces the growth of non-performing loans and increases bank stability over the study period. and Non-performingloans ratios.We however in support of our study hypothesis (HI) find that, the relation-ship between the publication of a code of corporate governance and bank performance ismoderated by institutional development and legal origins traditions.
We also find in Table 9 that bank performance and stability increase in those coun-tries that are politically stable; with high quality governance and where governments areaccountable to the citizens. Our results also suggest legal tradition can explain the prob-ability of bank performance. English common law enters the probit model as a randomparameter. Banks from this environment have greater probability of being a best perform-ing and stable bank and lower probability of being a worst performing bank thus sup-porting our hypothesis (H3). The regression results (Table 9) also show that ownershipstructure is an importance determinant of bank performance and stability among Africanbanks. For instance, closely held banks are associated with higher operating performance(ROA); profitability (ROE); stability (Z-score) are also associated with lower levels of
16

non-performing loans. Our results also suggest that state ownership of banks lead to bankinstability and increases probabilities of non-performing loans even when it is not no-ticeably hurting their profitability (measured by ROA or ROE). We also find that, foreignbanks are associated with poor bank performance (ROE, ROA); are less stable while thesize of their Non-performing loans have increased highly (21.06, p-value< 0.01)
Table 9 also shows that, ROA and ROE have lowest values when the bank has a major-ity institutional ownership but at the same time, these banks are significantly associatedwith lower levels of non-performing loans and have lower risks (are stable). e find strongsupport for our study hypothesis (H8). Both state and managerial ownership show in-significant relationships with bank performance and stability thus not rendering supportto our hypotheses (H6 and H7) respectively. our results also show that foreign banks aresignificantly associated with lower levels of non-performing loans and are more stablethan domestic banks but not best performers (in terms of ROA and ROE) than domesticbanks. Results also show that larger banks (proxied by log of assets) in Table 9 are associ-ated with superior performance, profitability compared to small banks. At the same time,there are associated with higher levels of non-performing loans are not stable. Severalcountry variables in Table 9 are significant in the probit model for best performing andstable banks (ROA, ROE, NPL) and stable (z-score).
4.6 Robustness checksThere are often questions raised regarding potential endogeneity in the governance-per-formance relationship in most studies rendering interpretation of results not valid. Toaddress this endogeneity issue, most studies use instrumental variables. However, it isoften difficult to find reliable instrumental estimates. Our approach to check for robust-ness is to allow for correlation between CG code introduction equation and the bank-levelgovernance equation. Two sets of country level variables are used separately; one set thatcombines institutions and macro variables to explain CG code introduction; and country-level indicators that explain bank level governance and performance. in our equations,country level governance is not affected by bank level governance and performance whichmay result into reverse causality and we also include fixed effects in the outcome equationto take care of omitted time invariant variables. we find that our results remain significantand robust with the inclusion of country-level institutional development control.
This study is not without limitations. The number of observations in our sample arerelatively small with a significant number of banks having missing observations on severalimportant corporate governance and other variables. This might mean that our sample isnot representative for African banks but mainly represents banks with better corporategovernance practices. It can be noted that for many banks the annual reports do notprovide sufficiently information on important characteristics that describe the corporategovernance practices at the bank.
5 ConclusionsWe examine corporate governance practices using a large sample of African banks be-tween 2005-2015. Consistent with the emerging literature on bundles of governance andcomparative corporate governance. We document systematic differences in the levels of
17

bank governance across African countries compared to banks from developed and emerg-ing economies reported in previous studies. We find that country institutions and legalorigins traditions shape countries’ governance reforms (i.e. development and publicationof codes of corporate governance) and jointly influence bank governance. Taken together,we find that African countries with strong institutions (rule of law, regulatory quality,political stability, control of corruption and voice and accountability) from the commonlaw traditions are associated with better governed banks than those from countries withweak institutions coming from the civil law traditions. Our findings also reveal the perva-sive role of ownership concentration and bank governance. Closely-held banks are poorlygoverned compared to those that are widely held. Institutional and foreign shareholdingare also associated with better bank governance but conditional on the quality of coun-try institutions and legal families. All these variables jointly improve bank performanceand stability. Thus, our main conclusion is that strong institutional quality and develop-ment as well as the path dependence stemming from legal families of origin cannot bedisregarded in strengthening bank governance and bank performance. This study makesboth an academic and a policy contribution. It contributes to the corporate governancebundles literature in a comparative perspective by investigating the interactive relation-ship amongst different governance frameworks at both country and firm-level bank gov-ernance and how this relationship ultimately explains banks’ performance and stability inan African context.
We also contribute to the policy discussion. From the last three decades, Africancountries have been implementing economic and financial reforms aimed at promotingeconomic growth and responding to globalization pressures which among others includedcorporate governance reforms. However, despite reforms on corporate governance, mostAfrican countries do not have strong institutions to foster corporate governance. Thesecountry institutions may imply varying differences in terms of bank corporate governanceas observed in our findings section. We therefore recommend strong improvement in theinstitutional development that would enhance reforms and bank governance.
18

ReferencesAdams, R. B., & Ferreira, D. (2007). A theory of friendly boards. The Journal of Finance,
62(1), 217–250. Retrieved from http://dx.doi.org/10.1111/j.1540-6261.2007.01206.x doi: 10.1111/j.1540-6261.2007.01206.x
Adams, R. B., & Mehran, H. (2003, April). Is corporate governance different for bankholding companies?. Economic Policy Review, 9(1), 20. Retrieved from https://www.newyorkfed.org/medialibrary/media/research/epr/03v09n1/0304adam.html
Adams, R. B., & Mehran, H. (2008, June). Corporate performance, board structure,and their determinants in the banking industry (Tech. Rep. No. no. 330). FederalReserve Bank of New York: Federal Reserve Bank of New York. Retrieved fromhttp://ssrn.com/abstract=1150266
Adams, R. B., & Mehran, H. (2012). Bank board structure and performance: Evidence forlarge bank holding companies. Journal of Financial Intermediation, 21, 243-267.doi: doi:10.1016/j.jfi.2011.09.002
Aebi, V., Sabato, G., & Schmid, M. (2012, December). Risk management, corporategovernance, and bank performance in the financial crisis. Journal of Banking & Fi-nance, 36(12), 3213-3226. Retrieved from http://www.sciencedirect.com/science/article/pii/S0378426611003104 doi: https://doi.org/10.1016/j.jbankfin.2011.10.020
Aggarwal, R., Erel, I., Ferreira, M., & Matos, P. (2011). Does governance travel aroundthe world? evidence from institutional investors. Journal of Financial Economics,100(1), 154-181. Retrieved from http://www.sciencedirect.com/science/article/pii/S0304-405X(10)00254-0 doi: https://doi.org/10.1016/j.jfineco.2010.10.018
Aguilera, R. V., & Cuervo-Cazurra, A. (2009). Codes of good governance. CorporateGovernance: An International Review, 17(3), 376–387. doi: doi:10.1111/j.1467-8683.2009.00737
Alves, C., & Mendes, V. (2004). Corporate governance policy and company performance:the portuguese case. Corporate Governance: An International Review, 12(3), 290–301. Retrieved from http://dx.doi.org/10.1111/j.1467-8683.2004.00370.x doi: 10.1111/j.1467-8683.2004.00370.x
Andrews, A. M. (2008, January). State-owned banks, stability, privatization, and growthpractical policy decisions in a world without empirical proof. (Tech. Rep. No.No.05/10). Retrieved from https://ssrn.com/abstract=874231
Angrist, J. D., & Pischke, J.-S. (2009). Mostly Harmless Econometrics: An Empiricist’sCompanion (No. 8769). Princeton University Press. Retrieved from https://ideas.repec.org/b/pup/pbooks/8769.html
Arun, T. G., & Turner, J. D. (2004, July). Corporate governance of banks in developingeconomies: Concepts and issues. Corporate Governance: An International Review,12(3), 371-377.
Azofra, V., & Valentın Azofra a, M. S. (2011). Ownership, control, and pyramids inSpanish commercial banks. Journal of Banking & Finance, 35 (2011), 1464–1476.doi: doi:10.1016/j.jbankfin.2010.10.029
Bai, C.-E., Liu, Q., Lua, J., Song, F. M., & Zhang, J. (2004). Corporate governance andmarket valuation in china. Journal of Comparative Economics, 32(2004), 599-616.doi: doi:10.1016/j.jce.2004.07.002
19

Barry, T. A., Lepetit, L., & Tarazi, A. (2011). Ownership structure and risk in pub-licly held and privately owned banks. Journal of Banking & Finance, 35(5), 1327-1340. Retrieved from https://EconPapers.repec.org/RePEc:eee:jbfina:v:35:y:2011:i:5:p:1327-1340
Barth, J. R., Caprio, G., & Levine, R. (2006). Rethinking bank regulation till angelsgovern (C. U. Press, Ed.). Cambridge University Press.
Barth, J. R., Jr, G. C., & Levine, R. (2004). Bank regulation and supervision: Whatworks best? Journal of Financial Intermediation, 13, 205–248. doi: doi:10.1016/j.jfi.2003.06.002
Beck, T., Demirguc-Kunt, A., & Maksimovic, V. (2004, June). Bank competition andaccess to finance: International evidence. Journal of Money, Credit and Banking,36(3), 627-648. Retrieved from http://www.jstor.org/stable/3838958
Belkhir, M. (2009). Board of directors’ size and performance in the banking in-dustry. International Journal of Managerial Finance, 5(2), 201-221. Retrievedfrom https://doi.org/10.1108/17439130910947903 doi: https://doi.org/10.1108/17439130910947903
Berger, A. N., Clarke, G. R., Cull, R., Klapper, L., & Udell, G. F. (2005). Corporategovernance and bank performance: A joint analysis of the static, selection, anddynamic effects of domestic, foreign, and state ownership. Journal of Banking &Finance, 29(8), 2179-2221. Retrieved from http://www.sciencedirect.com/science/article/pii/S0378-4266(05)00053-1
Berger, A. N., Imbierowicz, B., & Rauch, C. (2012). The roles of corporate gover-nance in bank failures during the recent financial crisis. Journal of Money, Creditand Banking, 48(4), 729-770. Retrieved from http://onlinelibrary.wiley.com/doi/10.1111/jmcb.12316/full doi: 10.1111/jmcb.12316
Bjuggren, P. O., Eklund, J. E., & Wiberg, D. (2007). Institutional owners and firmperformance: The impact of ownership categories on investments (Tech. Rep.).Jonkoping University. Retrieved from http://www.ratio.se/pdf/wp/wp pob je dwownership.pdf(application/pdf)
Bokpin, G. A. (2013, April). Ownership structure, corporate governance and bankefficiency: An empirical analysis of panel data from the banking industry inGhana. Corporate Governance: The international journal of business in soci-ety, 13(3), 274-287. Retrieved from https://doi.org/10.1108/CG-05-2010-004 doi:https://doi.org/10.1108/CG-05-2010-004
Bonin, J. P., Hasan, I., & Wachtel, P. (2005). Bank performance, efficiency and ownershipin transition countries. Journal of Banking & Finance, 29 (2005), 31–53. doi:doi:10.1016/j.jbankfin.2004.06.015
Booth, J. R., Cornett, M. M., & Tehranian, H. (2002). Boards of directors, ownership,and regulation. Journal of Banking & Finance,, 26(10), 1973-1996. Retrieved fromhttp://www.sciencedirect.com/science/article/pii/S0378-4266(01)00181-9
Borisova, G., Brockman, P., Salas, J. M., & Zagorchev, A. (2012). Government ownershipand corporate governance: Evidence from the EU. Journal of Banking & Finance,36, 2917-2934. doi: doi:10.1016/j.jbankfin.2012.01.008
Bouwens, J., & Verriest, A. (2014). Putting skin in the game: Managerial ownership andbank risk-taking (Tech. Rep.). Harvard Business School.
Busta, I. (2008). Corporate governance in banking a european study (Doctoral disserta-
20

tion, CBS / Copenhagen Business School). Retrieved from http://openarchive.cbs.dk/bitstream/handle/10398/7683/illduara busta.pdf?sequence=1
Busta, I., Sinani, E., & Thomsen, S. (2014). Ownership concentration and market valueof European banks. J Manag Gov, 18, 159–183. doi: DOI10.1007/s10997-012-9223-8
Caprio, G., Laeven, L., & Levine, R. (2007). Governance and bank valuation. J. Finan.Intermediation, 16, 584–617. doi: doi:10.1016/j.jfi.2006.10.003
Chen, T. (2015). Institutions, board structure, and corporate performance: Evidencefrom Chinese firms. Journal of Corporate Finance, 32, 217–237. Retrieved fromhttp://dx.doi.org/10.1016/j.jcorpfin.2014.10.009 doi: http://dx.doi.org/10.1016/j.jcorpfin.2014.10.009
Chortareas, G., Girardone, C., & Ventouri, A. (2012). Bank supervision, regulation,and efficiency: Evidence from the european union. Journal of Financial Stability,8(4), 292– 302. Retrieved from https://EconPapers.repec.org/RePEc:eee:finsta:v:8:y:2012:i:4:p:292-30 doi: doi:10.1016/j.jfs.2011.12.001
Claessens, S., Demirguc-Kunt, A., & Huizinga, H. (2001). How does foreignentry affect domestic banking markets? Journal of Banking & Finance,25(5), 891 - 911. Retrieved from http://www.sciencedirect.com/science/article/pii/S0378426600001023 doi: https://doi.org/10.1016/S0378-4266(00)00102-3
Claessens, S., Djankov, S., & Lang, L. H. (2000). The separation of ownership andcontrol in east asian corporations. Journal of Financial Economics, 58, 81-112.
Claessens, S., & vanHoren, N. (2015). The impact of the global financial crisis on bankingglobalization. IMF Economic Review (forthcoming)..
Cornett, M. M., Guo, L., Khaksari, S., & Tehranian, H. (2010). The impact ofstate ownership on performance differences in privately-owned versus state-ownedbanks: An international comparison. J. Finan. Intermediation, 19, 74–94. doi:doi:10.1016/j.jfi.2008.09.005
Cuervo, A. (2002). Corporate governance mechanisms: A plea for less code of goodgovernance and more market control. Corporate Governance: An InternationalReview, 10(2), 84-93.
Cuomo, F., Mallin, C., & Zattoni, A. (2016). Corporate governance codes: A review andresearch agenda. Corporate Governance: An International Review, 24(3), 222–241.doi: doi:10.1111/corg.12148
Dahyaa, J., & McConnell, J. J. (2005). Outside directors and corporate board decisions.Journal of Corporate Finance, 11, 37– 60. doi: doi:10.1016/j.jcorpfin.2003.10.001
De Andres, E., P.and Vallelado. (2008). Corporate governance in banking: The roleof the board of directors. Journal of Banking & Finance, 32(12), 2570-2580.Retrieved from https://EconPapers.repec.org/RePEc:eee:jbfina:v:32:y:2008:i:12:p:2570-2580
de Andres, P., Romero-Merino, M. E., Santamarıa, M., & Vallelado, E. (2012). Boarddeterminants in banking industry. an international perspective. Managerial andDecision Economics, 33(3), 147–158. Retrieved from http://dx.doi.org/10.1002/mde.2541 doi: 10.1002/mde.2541
de Haan, J., & Vlahu, R. (2016). Corporate governance of banks: a survey. Journal ofEconomic Surveys, 30(2), 228-277. doi: doi:10.1111/joes.12101
Desender, K., Aguilera, R. V., Crespi-Cladera, R., & Garcia-Cestona, M. A. (2011).
21

Board characteristics and audit fees: When does ownership matter. working paper.Dinc, I. S. (2005). Politicians and banks: Political influences on government-owned
banks in emerging markets. Journal of Financial Economics, 77(2), 453-479. doi:doi:10.1016/j.jfineco.2004.06.011
El-Chaarani, H. (2015). The impact of financial and legal structures on the performanceof european listed firms. International Journal of Business and Finance Research,9(2), 39-52.
Enrione, A., Mazza, C., & Zerboni, F. (2006, March). Institutionalizing codes ofgovernance. American Behavioral Scientist, 49(7), 961-973. doi: 10.1177/0002764205285175
Erkens, D. H., Hung, M., & Matos, P. (2012). Corporate governance in the 2007–2008financial crisis: Evidence from financial institutions worldwide:. Journal of Corpo-rate Finance, 18, 389-411. doi: doi:10.1016/j.jcorpfin.2012.01.005
Essen, M., Engelen, P. J., & Carney, M. (2013, May). Does “good” gorporate gover-nance help in a crisis? The impact of country- and firm-level governance mecha-nisms in the European financial crisis. Corporate Governance: An InternationalReview, 21(3), 201-224. Retrieved from http://dx.doi.org/10.1111/corg.12010 doi:10.1111/corg.12010
Fama, E. F., & Jensen, M. C. (1983, June). Separation of ownership and control. TheJournal of Law & Economics, 301-325. Retrieved from http://www.jstor.org/stable/725104
Fang, Y., Hasan, I., & Fang, Y. (2014). Institutional development and bank stability:Evidence from transition countries. Journal of Banking & Finance, 39, 160-175.Retrieved from http://dx.doi.org/10.1016/j.jbankfin.2013.11.003 doi: http://dx.doi.org/10.1016/j.jbankfin.2013.11.003
Filatotchev, I., Jackson, G., & Nakajima, C. (2013). Corporate governance and nationalinstitutions: A review and emerging research agenda. Asia Pac J Manag, 30, 965-986.
Firth, M., Lin, C., Liu, P., & Wong, S. M. (2009). Inside the black box: Bank creditallocation in China’s private sector:. Journal of Banking & Finance, 33, 1144-1155.doi: doi:10.1016/j.jbankfin.2008.12.008
Focarelli, D., & Pozzolo, A. F. (2006, January). Where do banks expand abroad? Anempirical analysis. Journal of Business, 78(6), 2435-2464. Retrieved from https://ssrn.com/abstract=639189
Gompers, P., Ishii, J., & Metrick, A. (2003). Corporate governance and equity prices.The Quarterly Journal of Economics, 118(1), 107-156.
Goncharov, I., Werner, J. R., & Zimmermann, J. (2006). Does compliance with thegerman corporate governance code have an impact on stock valuation? an em-pirical analysis. Corporate Governance: An International Review, 14(5), 432-445. Retrieved from http://www.blackwell-synergy.com/doi/abs/10.1111/j.1467-8683.2006.00516.x doi: 10.1111/j.1467-8683.2006.00516.x
Grove, H., Patelli, L., Victoravich, L. M., & Xu, P. T. (2011). Corporate governanceand performance in the wake of the financial crisis: Evidence from us commercialbanks. Corporate Governance: An International Review,, 19(5,), 418-436. doi:https://doi.org/10.1111/j.1467-8683.2011.00882.x
Hasan, I., & Xie, R. (2013). Foreign bank entry and bank corporate governance in china.
22

Emerging Markets Finance and Trade,, 49(2), 4-18. Retrieved from http://www.tandfonline.com/doi/abs/10.2753/REE1540-496X490201 doi: https://doi.org/10.2753/REE1540-496X490201
Haselmann, R., & Wachtel, P. (2010, August). Institutions and bank behavior: Legalenvironment, legal perception, and the composition of bank lending. Journal ofMoney, Credit and Banking, 42(5).
Haw, I. M., Ho, S. S., Hu, B., & Wu, D. (2010). Concentrated control, institutions,and banking sector: An international study. Journal of Banking & Finance, 34(3,),485-497. Retrieved from http://www.sciencedirect.com/science/article/pii/S0378-4266(09)00205-2
Hermalin, B. E., & Weisbach, M. S. (1998). Endogenously chosen boards of directorsand their monitoring of the ceo. American Economic Review, 96-118. Retrievedfrom http://econwpa.repec.org/eps/mic/papers/9602/9602001.pdf
Jensen, M. C. (1993). The modern industrial revolution, exit, and the failure of in-ternal control systems. Journal of Finance, 48(3), 831-880. Retrieved fromhttp://onlinelibrary.wiley.com/doi/10.1111/j.1540-6261.1993.tb04022.x/full doi:10.1111/j.1540-6261.1993.tb04022.x
Jensen, M. C., & Meckling, W. H. (1976). Theory of the firm: managerial behaviour,agency costs and ownership structure. Journal of Financial Economics, 3, 305-360.
John, K., Masi, S. D., & Paci, A. (2016). Corporate governance in banks. Corporate Gov-ernance: An International Review, 24(3), 303-321. doi: doi:10.1111/corg.12161
Kaufmann, D., & Kraay, A. (2008, January). Governance indicators: Where are we,where should we be going? Oxford University Press, 23, 1-30. doi: doi;10.1093/wbro/lkm012
Khwaja, A. I., & Mian, A. (2005). Do lenders favor politically connected firms?rent provision in an emerging financial market. The Quarterly Journal ofEconomics, 120(4), 1371-1411. Retrieved from http://hdl.handle.net/10.1162/003355305775097524
King, R. G., & Levine, R. (1993). Finance, entrepreneurship, and growth theory andevidence. Journal of Monetary Economics, 32, 513-542.
Klapper, L. F., & Love, I. (2004). Corporate governance, investor protection, and per-formance in emerging markets. Journal of Corporate Finance, 10, 703-728. doi:doi:10.1016/S0929-1199(03)00046-4
Klomp, J., & de Haan, J. (2015). Bank regulation and financial fragility in developingcountries: Does bankstructure matter? Review of Development Finance, 5, 82–90.doi: http://dx.doi.org/10.1016/j.rdf.2015.11.001
Laeven, L., & Levine, R. (2009). Bank governance, regulation and risktaking. Journal ofFinancial Economics, 93, 259–275. doi: doi:10.1016/j.jfineco.2008.09.003
LaPorta, R., de Silanes, F. L., Shleifer, A., & Vishny, R. W. (1998). Law and finance.Journal of Political Economy, 106(2), 1113-1155.
La Porta, R., Lopez-De-Silanes, F., & Shleifer, A. (2002). Government ownership ofbanks. The Journal of Finance, 57(1), 265–301. Retrieved from http://dx.doi.org/10.1111/1540-6261.00422 doi: 10.1111/1540-6261.00422
Lensink, R., Meesters, A., & Naaborg, I. (2008). Bank efficiency and foreign ownership:Do good institutions matter? Journal of Banking & Finance, 32, 834–844. doi:doi:10.1016/j.jbankfin.2007.06.001
23
Levine, R. (2004, September). The corporate governance of banks: A concise discussionof concepts and evidence. World Bank, 3404.
Li, H., Pincus, M., & Rego, S. O. (2008, November). Market reaction to events surround-ing the Sarbanes-Oxley act of 2002 and earnings management. The Journal of Lawand Economics, 51(1), 111-134. Retrieved from https://doi.org/10.1086/588597doi: https://doi.org/10.1086/588597
Lin, K.-L., & Chang, Y. (2016). Corporate governance reform, board structure, andits determinants in the banking industry: Evidence from taiwan. Emerging Mar-kets Finance and Trade, 52(9), 2001-2017. Retrieved from https://doi.org/10.1080/1540496X.2015.1098052 doi: 10.1080/1540496X.2015.1098052
Lin, X., & Zhang, Y. (2009). Bank ownership reform and bank performance in [c]hina.Journal of Banking & Finance, 33 (2009), 20–29. doi: doi:10.1016/j.jbankfin.2006.11.022
Macey, J. R., & O’Hara, M. (2003, April). The corporate governance of banks. FRBNYEconomic Policy Review.
Micco, A., Panizza, U., & Yanez, M. (2007). Bank ownership and performance. Doespolitics matter? Journal of Banking & Finance, 31, 219–241. doi: doi:10.1016/j.jbankfin.2006.02.007
Millar, C. C. (2014). To be or not to be: The existential issue for national governancebundles. Corporate Governance: An International Review, 22(3), 194–198. doi:doi:10.1111/corg.12066
Munisi, G., & Randøy, T. (2013). Corporate governance and company performance acrosssub-saharanafrican countries. Journal of Economics and Business, 70, 92-110. doi:http://dx.doi.org/10.1016/j.jeconbus.2013.08.003
Nielsen, S., & Huse, M. (2010). The contribution of women on boards of directors:Going beyond the surface. Corporate Governance: An International Review, 18(2),136–148. doi: doi:10.1111/j.1467-8683.2010.00784.x
Okike, E. N. M. (2007). Corporate governance in nigeria: The status quo. CorporateGovernance: An International Review, 15, 173-193.
Okpara, J. O. (2011). Corporate governance in a developing economy: barriers, issues,and implications for firms. corporate governance:. The international journal ofbusiness in society,, 11(2), 184-199.
Osemeke, L., & Adegbite, E. (2016). Regulatory multiplicity and conflict: Towards acombined code on corporate governance in Nigeria. Journal of Business Ethics,133, 431–451. doi: DOI10.1007/s10551-014-2405-3
Price, R., Roma, F. J., & Rountree, B. (2011). The impact of governance reform onperformance and transparency. Journal of Financial Economics, 99, 76-96. doi:doi10.1016/j.jfineco.2010.08.005
Saghi-Zedek, N., & Tarazi, A. (2015). Excess control rights, financial crisis and bankprofitability and risk. Journal of Banking & Finance, 55, 361-379. Retrieved fromhttp://www.sciencedirect.com/science/article/pii/S0378426614003422
Sakawa, H., Ubukata, M., & Watanabel, N. (2014). Market liquidity and bank-dominatedcorporate governance: Evidence from Japan. International Review of Economicsand Finance, 31, 1-11. Retrieved from http://dx.doi.org/10.1016/j.iref.2013.11.005doi: http://dx.doi.org/10.1016/j.iref.2013.11.005
Salloum, C., Jabbour, G., Digout, J., & Gebrayel, E. (2015). Managerial dominance over
24

the board and audit committee independence in financial institutions. InvestmentManagement and Financial Innovations, 12(4), 33-42. Retrieved from https://hal.archives-ouvertes.fr/
Shehzad, C. T., De Haan, J., & Scholtens, B. (2010). The impact of bank ownership con-centration on impaired loans and capital adequacy. Journal of Banking & Finance,34(2), 399-408. Retrieved from http://www.sciencedirect.com/science/article/pii/S0378-4266(09)00200-3 doi: https://doi.org/10.1016/j.jbankfin.2009.08.007
Shleifer, A., & Vishny, R. W. (1986, jun). Large shareholders and corporate control. TheJournal of Political Economy, 94(3), 461-488.
Shleifer, A., & Vishny, R. W. (1997). A survey of corporate governance. The Journalof Finance, 52(2), 737–783. Retrieved from http://dx.doi.org/10.1111/j.1540-6261.1997.tb04820.x doi: 10.1111/j.1540-6261.1997.tb04820.x
Song, F. M., & Lei, A. C. (2008). Corporate governance, family ownership, and firmvaluations in emerging markets: evidence from Hong Kong panel data. Retrievedfrom http://ssrn.com/abstract=1100710
Spamann, H. (2009). Legal origin, civil procedure, and the quality of contract enforce-ment. Harvard Law School - Public Law and Legal Theory Working Paper Series,No. 09-51. Retrieved from http://ssrn.com/abstract=1452744
Stiles, P., & Taylor, B. (1993). Benchmarking corporate governance: The impact of theCadbury code. Long Range Planning, 26(5), 61-71.
Thomsen, S. (2006). The hidden meaning of codes: Corporate governance and in-vestor rent seeking. European Business Organization Law Review, 7, 845-861.doi: DOI10.1017/S1566752906008457
Titova, Y. (2016). Are board characteristics relevant for banking efficiency? Evidencefrom the US. Corporate Governance, 16(4), 655-679. Retrieved from https://doi.org/10.1108/CG-09-2015-0124 doi: https://doi.org/10.1108/CG-09-2015-0124
v. Werder, A., Talaulicar, T., & Kolat, G. L. (2005). Compliance with the German cor-porate governance code: An empirical analysis of the compliance statements byGerman listed companies. Corporate Governance: An International Review, 13(2),178-187. Retrieved from http://dx.doi.org/10.1111/j.1467-8683.2005.00416.x doi:10.1111/j.1467-8683.2005.00416.x
Wanyama, S., Burton, B., & Helliar, C. (2009). Frameworks underpinning corporategovernance: Evidence on Ugandan perceptions. Corporate Governance: An Inter-national Review, 17(2), 159–175. doi: doi:10.1111/j.1467-8683.2009.00730.x
Westman, H. (2011). The impact of management and board ownership on profitability inbanks with different strategies. Journal of Banking & Finance, 35(12), 3300-3318.doi: https://doi.org/10.1016/j.jbankfin.2011.05.013
Worldank. (2015). World governance indicators 2005-2015 (Tech. Rep.). The Worldbank.Retrieved from http://www.worldbank.org/
Worldbank. (2015a). Doing business report (Tech. Rep.). The worldbank. Retrievedfrom http://www.doingbusiness.org/
Worldbank. (2015b). World development indicators 2005-2015. (Tech. Rep.). The World-bank. Retrieved from http://www.worldbank.org/
Zhang, I. X. (2007). Economic consequences of the Sarbanes–Oxley act of 2002. Journalof Accounting and Economics, 44, 74-115. doi: doi:10.1016/j.jacceco.2007.02.002
25
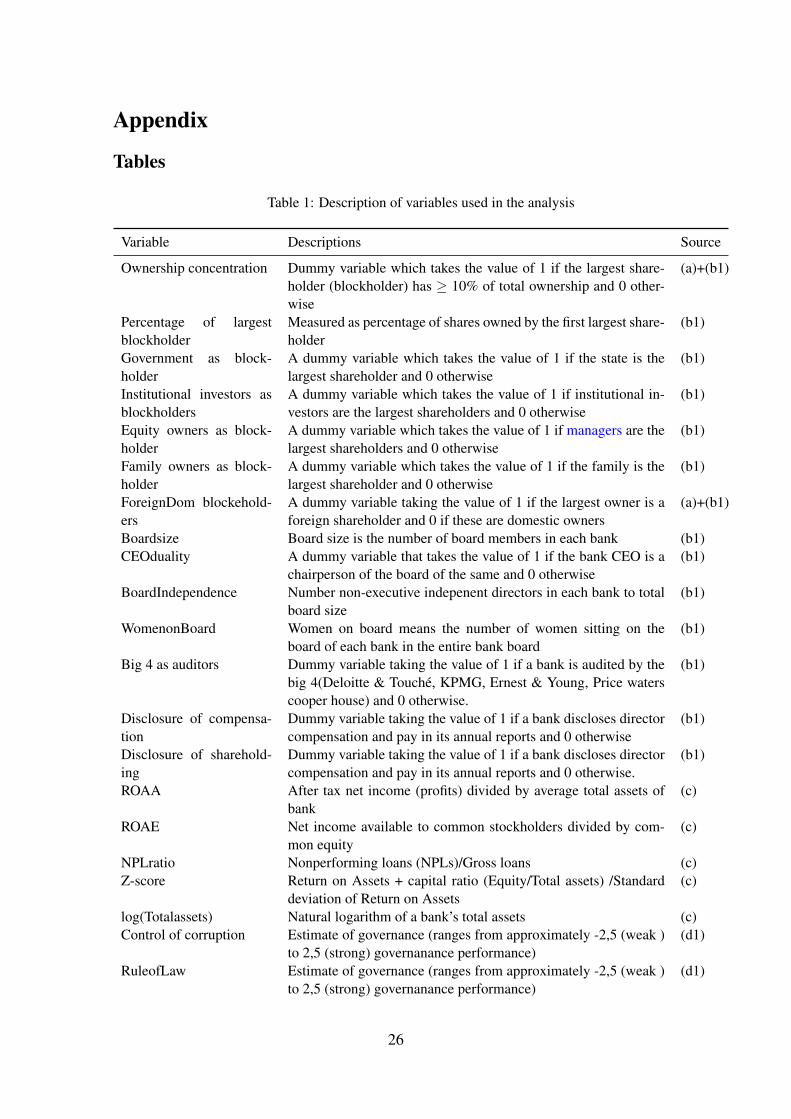
Appendix
Tables
Table 1: Description of variables used in the analysis
Variable Descriptions Source
Ownership concentration Dummy variable which takes the value of 1 if the largest share-holder (blockholder) has ≥ 10% of total ownership and 0 other-wise
(a)+(b1)
Percentage of largestblockholder
Measured as percentage of shares owned by the first largest share-holder
(b1)
Government as block-holder
A dummy variable which takes the value of 1 if the state is thelargest shareholder and 0 otherwise
(b1)
Institutional investors asblockholders
A dummy variable which takes the value of 1 if institutional in-vestors are the largest shareholders and 0 otherwise
(b1)
Equity owners as block-holder
A dummy variable which takes the value of 1 if managers are thelargest shareholders and 0 otherwise
(b1)
Family owners as block-holder
A dummy variable which takes the value of 1 if the family is thelargest shareholder and 0 otherwise
(b1)
ForeignDom blockehold-ers
A dummy variable taking the value of 1 if the largest owner is aforeign shareholder and 0 if these are domestic owners
(a)+(b1)
Boardsize Board size is the number of board members in each bank (b1)CEOduality A dummy variable that takes the value of 1 if the bank CEO is a
chairperson of the board of the same and 0 otherwise(b1)
BoardIndependence Number non-executive indepenent directors in each bank to totalboard size
(b1)
WomenonBoard Women on board means the number of women sitting on theboard of each bank in the entire bank board
(b1)
Big 4 as auditors Dummy variable taking the value of 1 if a bank is audited by thebig 4(Deloitte & Touche, KPMG, Ernest & Young, Price waterscooper house) and 0 otherwise.
(b1)
Disclosure of compensa-tion
Dummy variable taking the value of 1 if a bank discloses directorcompensation and pay in its annual reports and 0 otherwise
(b1)
Disclosure of sharehold-ing
Dummy variable taking the value of 1 if a bank discloses directorcompensation and pay in its annual reports and 0 otherwise.
(b1)
ROAA After tax net income (profits) divided by average total assets ofbank
(c)
ROAE Net income available to common stockholders divided by com-mon equity
(c)
NPLratio Nonperforming loans (NPLs)/Gross loans (c)Z-score Return on Assets + capital ratio (Equity/Total assets) /Standard
deviation of Return on Assets(c)
log(Totalassets) Natural logarithm of a bank’s total assets (c)Control of corruption Estimate of governance (ranges from approximately -2,5 (weak )
to 2,5 (strong) governanance performance)(d1)
RuleofLaw Estimate of governance (ranges from approximately -2,5 (weak )to 2,5 (strong) governanance performance)
(d1)
26

. . . continued
Variable Descriptions SourceRequlatory quality Estimate of governance (ranges from approximately -2,5 (weak )
to 2,5 (strong) governanance performance)(d1)
Governanance effective-ness
Estimate of governance (ranges from approximately -2,5 (weak )to 2,5 (strong) governanance performance)
(d1)
Political stability Estimate of governance (ranges from approximately -2,5 (weak )to 2,5 (strong) governanance performance)
(d1)
Voice and accountability Estimate of governance (ranges from approximately -2,5 (weak )to 2,5 (strong) governanance performance)
(d1)
Legalfamily of origin Dummy variable that equals 1if banks belong to civil law legalcountries y and 2 for banks thatbelong to common law countries
(b2)
Corporate governancecode
Dummy variable that 1 if a country in a particular year had a bankspecific corporate governance code and 0 otherwise
(b3)
GrossDomestic product Value expressed in US Dollars (d2)Economic growth rate Expressed in percentage terms (d2)Inflation Expressed in percentage terms (d2)Minority investor protec-tion index
Measured from 0-10 for which 0 represents low minority investorprotection and 10 the highest
(d3)
Extent of conflict of inter-est regulation index
Measured from 0-10 for which 0 less conflict of interest regula-tion quality and 10 the highest
(d3)
Extent of disclosure index Measured from 0-10 for which 0 represents low disclosures ofinformation and 10 highest.
(d3)
Ease of shareholder suitsindex
Measured from 0-10 for which 0 represents lower shareholdersuits and 10 the highest
(d3)
Extent of shareholdergovernance index
Measured from 0-10 for which 0 represents low shareholder gov-ernance and 10 the highest
(d3)
Extent of corporate trans-parency index
Measured on a scale of 0-10 for which 0 represents lowest corpo-rate transparency and 10 the highest
(d3)
Strength of legal rights in-dex
Measured on a scale of 0-12 for which 0 represents weakest legalrights and 12 the strongest
(d3)
Quality of judicial pro-cesses index (0-18)
Measured on a scale of 0-18 for which 0 represents poor qualityof judicial process and 18 the highest
(d3)
Extent of director liabilityindex
Measured on a scale of 0-10 for 0 represents low director liabilityand 10 the highest
(d3)
Notes: Sources (a)-Stijn Claessens and Neeltje van Horen (2014) Ownership database; (b1)-Hand collectedin the Banks’ annual reports;(d3)-World Bank-Doing Business report, (b2)-Web search on legal origins;(b3)-Hand search from Country central banks; c-BvD Bankscope; (d1)-World Bank Governance Indicators(WGI); (d2) World bank Development Indicators (WDI); (d3)-World Bank-Doing Business report
==========================================
27

Table 2: Descriptive statistics at bank-levelVariable Obs Mean Std.Dev. Min Max
Ownership concentration 1313 0.960 0.195 0 1Percentage of largest blockholder 1297 68.02 31.59 1 100Government as blockholder 1313 0.092 0.290 0 1Institutional investors as blockholders 1313 0.800 0.400 0 1Equity owners as blockholder 1313 0.008 0.091 0 1Family owners as blockholder 1313 0.002 0.048 0 1Private owners as blockholder 1287 0.092 0.290 0 1Foreign blockholders 1313 0.577 0.494 0 1Board size 1313 9.47 3.49 3 23CEO duality 1291 0.048 0.214 0 1Board independence 1224 4.97 2.91 0 18Women in board 1139 1.06 1.11 0 8ROAA 1305 1.91 3.95 -34.8 41.3ROAE 1302 15.54 22.03 -209.0 101.1NPL ratio 932 7.60 9.43 0 93.1logTotalAssets 1312 13.20 2.05 2.28 18.67Corporate governance codea 2341 0.429 0.495 0 1Notes: a at country level
Table 3: Institutional and economic variables at country-levelVariable Obs Mean Std.Dev. Min Max
Rule of Law 478 -0.617 0.697 -1.842 7Requlatory Quality 478 -0.591 0.574 -2.237 1.1234Governanance effectiveness 478 -0.687 0.594 -2.171 1.0360Political stability 478 -0.518 0.848 -2.687 1.1827Voiceand and accountability 478 -0.594 0.680 -1.936 0.9704Legal family of origin 478 1.379 0.486 1 2Corporate governance code 467 0.409 0.491 0 1GrossDomestic product/capita 474 2160 2543 205 11934Rate of inflation 474 4.576 5.771 -62.08 22.59Strength of minority investor protection index 453 0.052 2.180 -1 7Extent of conflict of interest regulation index 453 0.105 2.312 -1 8Extent of disclosure index 453 4.444 2.390 -1 8Extent of director liability index 453 2.954 2.747 -1 9Ease of shareholder suits index 453 0.203 2.569 -1 9Extent of shareholder governance index 453 -0.002 2.072 -1 6.3Extent of corporate transparency index 453 0.042 2.256 -1 9Strength of legal rights index 453 0.113 2.436 -1 10Quality of Judicial process index 455 -0.937 0.543 -1 4
28

Table 4: Bank-level variable means by countryCountry name (1) (2) (3) (4) (5) (6) (7) (8) (9) (10) (11) (12) (13) (14)
Algeria 6 1 58.3 6.8 0 3.25 0.30 0.8 0 2.99 14.72 3.06 7.65 12.97Angola 11 0.84 46.6 6.2 0 2.41 1.17 0.62 0 1.88 13.23 6.47 2.55 13.14Benin 3 1 72.9 9.3 0 5.83 0.33 0.42 0 1.39 17.06 10.67 1.69 13.19Botswana 5 1 72.9 8.3 0 5.82 1.32 1 0.36 6.66 34.28 3.65 5.99 13.18Burkinafaso 4 1 72.0 7.6 0.17 3.89 0.61 0 0 2.20 27.16 5.93 2.36 12.70Burundi 3 1 51.4 9.5 0 6.00 1.56 0.27 0 2.90 27.99 10.94 2.63 10.65Cameroon 4 1 70.7 8.2 0 5.12 0.62 0.58 0 1.45 19.31 8.59 2.15 13.34Capeverde 4 1 56.4 5.8 0 1.19 0.56 0.76 0.24 -0.44 6.00 9.65 1.24 11.97Central African 1 1 75.0 5.0 0 1.00 1.00 1 0 4.97 55.07 — 1.98 11.17Chad 1 1 73.4 6.5 0 3.83 0.67 0.33 0 2.52 32.50 3.61 0.98 12.09Congo-Brazaville 1 1 89.2 6.0 0 5.00 1.00 1 0 0.57 1.95 — 0.66 12.01Cote d’Ivoire 3 1 84.9 8.6 0 5.15 0.93 1 0 1.93 24.39 4.76 1.79 12.91DRC 4 1 63.1 8.5 0 5.16 0.26 0.68 0 -0.03 5.30 3.20 2.05 12.12Djibouti 2 1 60.3 6.3 0 3.00 0.00 0.67 0 1.12 19.12 14.81 1.78 12.82Egypt 8 1 91.9 9.4 0.38 4.25 0.55 0.83 0 1.84 15.02 6.72 4.33 15.02Ethiopia 5 0.56 48.5 9.4 0 3.50 0.69 0 0 3.01 35.14 7.72 1.91 12.77Gabon 1 1 100.0 7.2 0 6.20 0.00 1 0 0.26 3.79 5.74 0.95 12.01Gambia 2 1 68.5 7.0 0 5.50 1.25 0.5 0 2.30 22.36 3.49 0.33 11.26Ghana 11 1 68.1 8.6 0 4.90 0.82 0.84 0 2.91 16.38 10.11 2.24 11.94Guinea 1 1 100.0 5.5 0 3.20 0.20 1 0 3.54 38.39 8.69 2.74 11.74Kenya 17 1 44.1 9.4 0 5.61 1.06 0.95 0.28 2.60 17.08 6.33 2.72 13.03Liberia 1 1 100.0 7.5 0 6.17 0.00 0 0 1.83 19.69 13.58 1.02 11.99Libya 2 0.57 57.8 9.3 0.57 6.86 0.00 0.57 0 0.89 12.06 — 2.32 15.48Madagascar 1 1 77.3 7.9 0 1.00 1.00 1 0 2.97 18.11 7.50 4.43 11.01Malawi 3 1 59.3 9.6 0 6.81 0.81 1 0.19 5.43 30.95 3.29 2.76 10.97Mali 2 1 74.9 9.6 0 3.80 2.00 0 0 1.54 19.56 10.87 2.25 12.64Mauritius 4 1 44.7 9.6 0 4.57 0.73 0.4 0.27 1.11 11.45 7.49 0.99 13.44Morocco 4 1 45.9 11.5 0.65 5.77 0.72 1 0.25 1.08 12.64 6.70 1.82 16.21Mozambique 4 1 58.1 11.1 0 9.57 1.00 0.94 0 -2.89 -1.76 8.10 1.57 12.70Namibia 6 1 77.5 8.6 0 5.11 1.39 1 0.17 2.37 19.46 1.26 5.06 13.57Niger 2 1 72.5 7.0 0 3.91 0.55 0 0 1.66 21.69 4.86 1.94 11.91Nigeria 12 0.46 20.4 14.5 0 2.78 2.48 0.94 0.33 1.45 5.55 5.81 2.15 15.32Rwanda 5 1 81.1 7.8 0 5.81 0.75 1 0 1.13 2.56 12.07 1.91 11.89Senegal 4 1 80.5 8.5 0 5.03 0.76 0.66 0 1.57 20.02 9.50 2.11 12.74Sieraleone 2 1 100.0 8.5 0 5.58 0.50 1 0 2.41 13.11 42.46 3.18 10.25South Africa 21 1 69.4 13.4 0 7.41 2.30 1 0.65 2.55 15.19 5.72 4.50 14.97South Sudan 2 1 96.4 7.2 0 6.20 0.00 0.6 0 6.21 32.62 1.24 1.25 10.09Swaziland 1 1 100.0 9.0 0 7.00 2.50 1 1 1.68 6.38 12.82 8.21 11.93Tanzania 9 1 76.8 8.0 0 5.71 0.98 0.71 0.15 -0.17 9.04 3.30 2.13 11.80Togo 3 1 70.0 8.4 0 4.39 1.11 0.37 0 1.98 22.68 7.03 2.80 14.07Tunisia 9 1 75.7 10.6 0.13 2.36 0.54 0.51 0 1.14 7.48 19.16 3.38 14.18Uganda 7 1 74.1 9.7 0 6.91 0.97 1 0.31 0.55 1.66 5.74 2.83 11.78Zambia 8 1 92.5 6.8 0 4.00 1.24 1 0 -0.87 5.26 8.27 1.96 12.08Zimbabwe 7 1 89.2 10.1 0 6.13 1.05 0.84 0 1.40 10.94 12.25 2.16 11.55
Total 216 0.96 68.0 9.5 0.05 4.97 1.06 0.75 0.16 1.91 15.5 7.6 2.87 13.2Notes: (1) Number of banks (2) Concentrated ownership (3) Percentage of first largestshareholder (4) Board size (5) CEO duality (6) Board independence (7) Women onboard (8) Using Big 4 as Auditors (9) Disclosure executive pay (10) ROAA (11) ROAE(12) NPL ratio (13) zscore (14) log Total assets
29
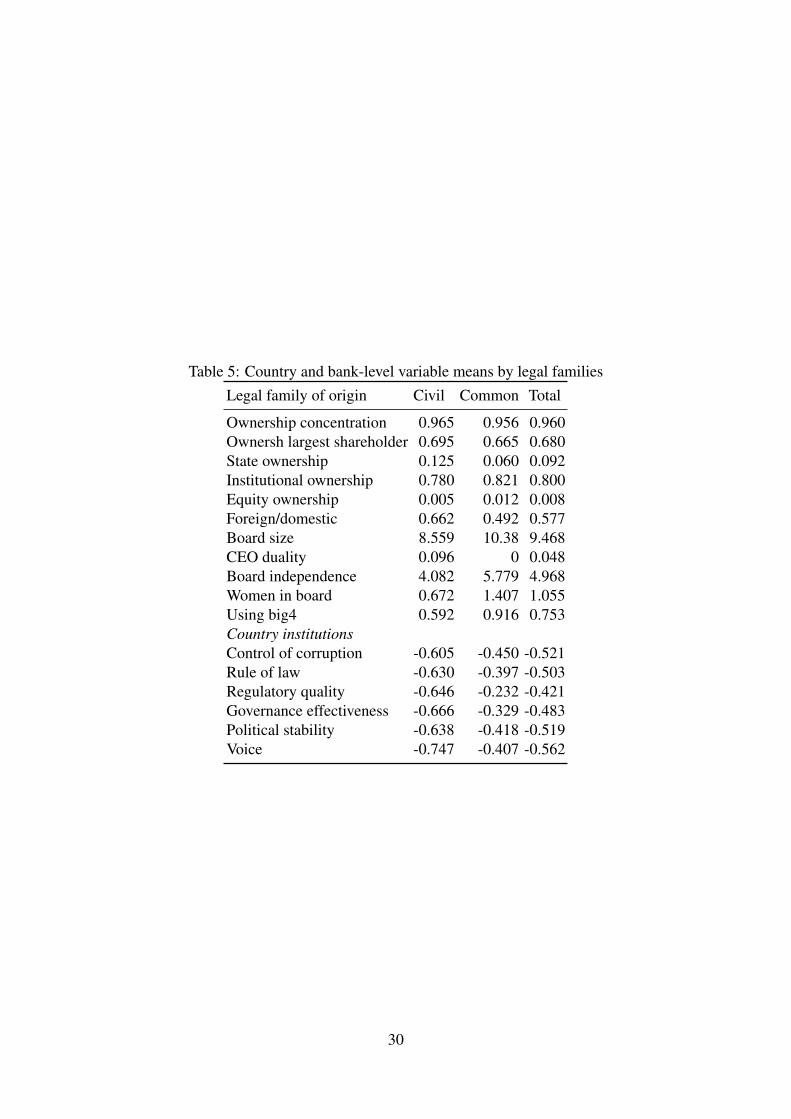
Table 5: Country and bank-level variable means by legal familiesLegal family of origin Civil Common Total
Ownership concentration 0.965 0.956 0.960Ownersh largest shareholder 0.695 0.665 0.680State ownership 0.125 0.060 0.092Institutional ownership 0.780 0.821 0.800Equity ownership 0.005 0.012 0.008Foreign/domestic 0.662 0.492 0.577Board size 8.559 10.38 9.468CEO duality 0.096 0 0.048Board independence 4.082 5.779 4.968Women in board 0.672 1.407 1.055Using big4 0.592 0.916 0.753Country institutionsControl of corruption -0.605 -0.450 -0.521Rule of law -0.630 -0.397 -0.503Regulatory quality -0.646 -0.232 -0.421Governance effectiveness -0.666 -0.329 -0.483Political stability -0.638 -0.418 -0.519Voice -0.747 -0.407 -0.562
30

Table 6: Correlation matrix
(1) (2) (3) (4) (5) (6) (7) (8) (9) (10) (11) (12) (13) (14) (15) (16)
(1) 1.000(2) 0.344 1.000(3) 0.044 -0.063 1.000(4) 0.450 0.276 -0.631 1.000(5) 0.017 0.099 -0.025 -0.251 1.000(6) 0.009 -0.081 -0.013 -0.134 -0.005 1.000(7) 0.161 0.406 -0.209 0.396 -0.127 -0.068 1.000(8) -0.210 -0.329 0.058 -0.107 -0.089 -0.054 -0.192 1.000(9) 0.035 -0.021 0.388 -0.222 -0.019 -0.010 -0.027 0.074 1.000
(10) 0.243 0.246 0.070 0.145 -0.017 0.062 -0.005 -0.119 -0.081 1.000(11) -0.072 0.086 0.030 0.003 -0.084 0.024 -0.083 0.132 -0.073 0.038 1.000(12) -0.019 -0.029 0.084 -0.108 0.046 0.024 -0.169 0.129 0.053 0.011 0.073 1.000(13) -0.017 -0.140 -0.044 0.045 -0.048 -0.025 -0.133 0.312 -0.039 0.064 0.086 0.224 1.000(14) 0.044 -0.159 0.030 0.017 0.006 -0.024 -0.167 0.016 -0.019 -0.010 0.058 -0.009 0.079 1.000(15) 0.161 -0.027 -0.017 0.110 0.006 -0.031 -0.042 -0.024 0.007 0.021 0.118 -0.080 0.100 0.806 1.000(16) 0.013 0.139 0.091 -0.051 -0.020 0.129 0.042 -0.044 -0.034 0.005 -0.137 -0.110 -0.158 -0.173 -0.226 1.000(17) -0.117 -0.081 0.124 -0.193 -0.013 0.020 -0.200 0.033 -0.041 -0.055 0.053 0.117 0.027 0.292 0.034 0.104(18) -0.150 -0.214 0.019 -0.076 -0.031 -0.095 -0.200 0.666 0.263 -0.149 0.219 0.101 0.313 0.110 0.169 -0.148(19) 0.202 0.169 0.050 0.176 -0.034 -0.043 -0.047 0.049 0.007 0.042 0.111 0.189 0.227 0.071 0.086 -0.021(20) 0.151 -0.020 -0.005 0.169 -0.016 -0.002 -0.144 0.218 -0.018 0.077 0.144 0.194 0.382 0.093 0.067 -0.070(21) 0.348 0.231 0.010 0.259 0.034 -0.053 0.058 -0.107 -0.106 0.232 0.104 0.026 0.121 0.058 0.104 -0.001(22) 0.046 -0.010 -0.053 0.081 0.044 0.023 0.000 -0.289 -0.114 0.033 0.019 -0.035 -0.139 0.104 0.065 -0.061(23) -0.138 -0.162 -0.075 -0.055 0.077 0.041 -0.278 0.281 -0.252 0.128 0.165 0.329 0.346 0.077 -0.059 -0.131(24) -0.002 -0.002 0.124 -0.149 0.083 0.044 -0.065 -0.034 0.076 0.030 -0.025 0.217 -0.060 -0.045 -0.155 0.060(25) 0.020 -0.008 -0.007 0.059 -0.076 -0.034 -0.236 0.374 0.008 -0.056 0.165 0.237 0.435 0.036 0.035 -0.078(26) -0.087 -0.072 -0.068 -0.022 0.058 0.002 -0.126 0.011 -0.021 0.010 -0.027 0.203 0.023 0.138 0.024 -0.069(27) -0.009 -0.063 0.071 -0.072 0.077 0.020 0.039 -0.166 -0.074 0.075 -0.033 -0.064 -0.140 -0.118 -0.134 -0.016(28) -0.285 -0.138 -0.011 -0.225 -0.025 0.059 -0.135 0.114 -0.017 -0.140 0.130 0.079 0.017 0.017 -0.091 -0.041(29) 0.103 0.185 0.069 0.092 -0.152 -0.056 0.012 0.195 0.019 0.080 0.112 -0.053 0.113 0.105 0.135 0.035(30) -0.161 -0.060 0.020 -0.117 0.054 -0.047 -0.219 0.298 -0.114 -0.121 0.193 0.328 0.280 0.011 -0.101 -0.042(31) -0.248 -0.121 -0.028 -0.177 -0.021 0.090 -0.095 0.067 -0.074 -0.076 0.104 0.054 -0.011 0.026 -0.069 -0.036(32) 0.027 -0.002 -0.038 0.061 -0.015 -0.008 0.000 -0.073 -0.030 0.028 -0.011 0.021 0.025 -0.009 -0.018 -0.002
31

Table 6: Correlation matrix (cont)
toprule (17) (18) (19) (20) (21) (22) (23) (24) (25) (26) (27) (28) (29) (30) (31)
(18) -0.047 1.000(19) 0.013 0.164 1.000(20) 0.068 0.296 0.779 1.000(21) -0.034 -0.028 0.731 0.570 1.000(22) -0.123 -0.253 0.419 0.345 0.431 1.000(23) 0.135 0.050 0.071 0.308 0.129 0.138 1.000(24) 0.005 -0.061 -0.135 -0.114 -0.138 0.022 0.247 1.000(25) 0.184 0.473 0.609 0.652 0.465 -0.090 0.312 -0.086 1.000(26) 0.059 -0.138 -0.115 -0.025 -0.173 0.093 0.324 0.163 -0.106 1.000(27) -0.123 -0.279 -0.112 -0.100 -0.035 0.203 0.065 0.082 -0.320 -0.009 1.000(28) 0.124 0.155 -0.122 -0.112 -0.241 0.053 0.171 0.277 0.047 -0.017 -0.118 1.000(29) 0.126 0.233 0.307 0.174 0.303 -0.173 -0.055 -0.098 0.378 -0.229 -0.151 -0.021 1.000(30) 0.205 0.177 0.490 0.484 0.270 0.096 0.426 0.180 0.567 0.220 -0.131 0.194 0.259 1.000(31) 0.084 0.076 -0.121 -0.098 -0.224 0.137 0.183 0.269 -0.073 -0.032 -0.029 0.932 -0.051 0.117 1.000(32) -0.026 -0.037 0.089 0.114 0.156 0.175 0.120 0.130 0.100 -0.006 -0.040 0.226 -0.034 0.127 0.246
Notes: (1) Ownership concentration (2) Percentage of first largest shareholder (3) Government ownership (4) Institutional ownership(5) Equity ownership (6) Family ownership (7) Foreign/Domestic (8) Boardsize (9) CEOduality (10) Indepent (11) Sharewomen (12)Using Big4 as auditors (13) Disclosure of executive pay (14) ROAA (15) ROAE (16) NPLratio (17) zscore (18) logTotal assets (19)Control of corruption (20) Requlatory quality (21) Political stability (22) Voice and accountability (23) Legal families of origin (24)Corporate governance code (25) GrossDomestic product /capita (26) Economic growth rate (27) Rate of inflation (28) Strength ofminority investor protection index (29) Extent of disclosure index (30) Extent of director liability index (31) Strength of legal rightsindex (32) Quality of Judicial process index
32

Table 7: CG quality: CMP estimation of equations (1) and (2)
(1) (2) (3)Indepent Sharewomen logBoardsize
Bank-level: FE modelCorporategovernancecode 0.193∗∗∗ 0.0549∗∗∗ -0.567∗∗∗
(3.63) (2.59) (-3.25)ForeignDomestic -0.112 0.00270 0.987∗∗∗
(-1.48) (0.20) (3.96)Ownershipconcentration -0.166∗∗∗ -0.0859∗∗∗ -1.232∗∗∗
(-8.16) (-7.81) (-10.06)Governmentownership 0.200∗ -0.0911 -0.548
(1.95) (-0.99) (-1.14)Institutionalownership 0.184∗∗∗ -0.00191 -1.692∗∗∗
(3.92) (-0.05) (-15.20)log Totalassets -0.00135 -0.00128 -0.0432
(-0.09) (-0.15) (-0.58)year=2006 0.0637 0.000279 -0.452
(1.43) (0.01) (-1.43)year=2007 0.0668 0.0134 -0.0832
(1.62) (0.57) (-0.38)year=2008 0.0854∗∗ 0.0106 0.0110
(2.13) (0.50) (0.05)year=2009 0.0975∗∗∗ -0.000431 -0.208
(2.93) (-0.02) (-1.21)year=2010 0.0882∗∗∗ -0.00897 -0.138
(2.74) (-0.48) (-0.89)year=2011 0.0598∗∗ -0.0157 -0.0842
(2.17) (-1.04) (-0.59)year=2012 0.0423∗ -0.00631 0.0174
(1.76) (-0.45) (0.14)year=2013 0.0103 -0.00799 -0.0974
(0.58) (-0.79) (-0.86)year=2014 0.0208 -0.00354 -0.00647
(1.49) (-0.45) (-0.08)year=2015 0.0111 0.00514 -0.0623
(0.95) (1.00) (-0.84)cons 0.464∗∗ 0.166 3.888∗∗∗
(2.26) (1.13) (4.17)Country-level: prob(Corporategovernancecode = 1), probit equationGovernance 1.104∗∗∗ 1.258∗∗∗ 1.279∗∗∗
effectiveness (3.07) (3.51) (3.64)Requlatoryquality -1.189∗∗∗ -1.283∗∗∗ -1.289∗∗∗
(-4.35) (-4.54) (-4.64)Politicalstability 0.280∗∗∗ 0.311∗∗∗ 0.316∗∗∗
(2.85) (2.87) (2.96)Voiceandaccountability -0.162 -0.222∗∗ -0.242∗∗
(-1.51) (-2.06) (-2.24)Legalfamilyoforigin= 0.882∗∗∗ 0.948∗∗∗ 0.940∗∗∗
33
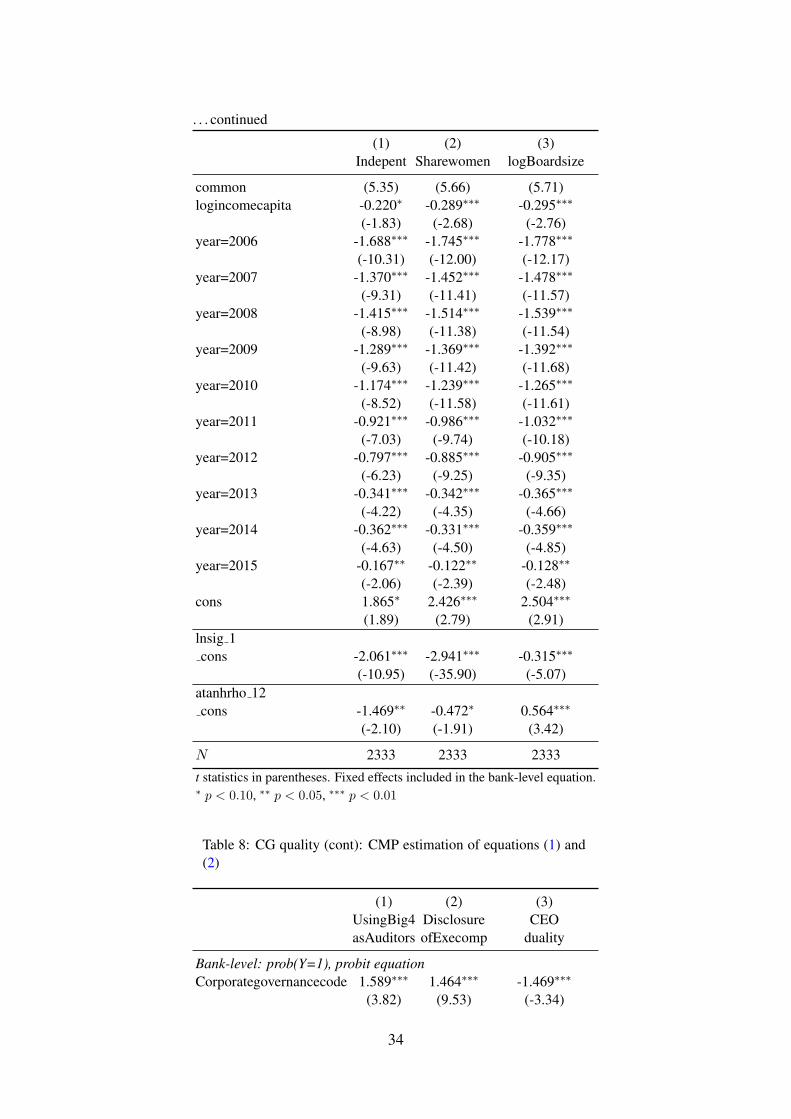
. . . continued
(1) (2) (3)Indepent Sharewomen logBoardsize
common (5.35) (5.66) (5.71)logincomecapita -0.220∗ -0.289∗∗∗ -0.295∗∗∗
(-1.83) (-2.68) (-2.76)year=2006 -1.688∗∗∗ -1.745∗∗∗ -1.778∗∗∗
(-10.31) (-12.00) (-12.17)year=2007 -1.370∗∗∗ -1.452∗∗∗ -1.478∗∗∗
(-9.31) (-11.41) (-11.57)year=2008 -1.415∗∗∗ -1.514∗∗∗ -1.539∗∗∗
(-8.98) (-11.38) (-11.54)year=2009 -1.289∗∗∗ -1.369∗∗∗ -1.392∗∗∗
(-9.63) (-11.42) (-11.68)year=2010 -1.174∗∗∗ -1.239∗∗∗ -1.265∗∗∗
(-8.52) (-11.58) (-11.61)year=2011 -0.921∗∗∗ -0.986∗∗∗ -1.032∗∗∗
(-7.03) (-9.74) (-10.18)year=2012 -0.797∗∗∗ -0.885∗∗∗ -0.905∗∗∗
(-6.23) (-9.25) (-9.35)year=2013 -0.341∗∗∗ -0.342∗∗∗ -0.365∗∗∗
(-4.22) (-4.35) (-4.66)year=2014 -0.362∗∗∗ -0.331∗∗∗ -0.359∗∗∗
(-4.63) (-4.50) (-4.85)year=2015 -0.167∗∗ -0.122∗∗ -0.128∗∗
(-2.06) (-2.39) (-2.48)cons 1.865∗ 2.426∗∗∗ 2.504∗∗∗
(1.89) (2.79) (2.91)lnsig 1cons -2.061∗∗∗ -2.941∗∗∗ -0.315∗∗∗
(-10.95) (-35.90) (-5.07)atanhrho 12cons -1.469∗∗ -0.472∗ 0.564∗∗∗
(-2.10) (-1.91) (3.42)
N 2333 2333 2333
t statistics in parentheses. Fixed effects included in the bank-level equation.∗ p < 0.10, ∗∗ p < 0.05, ∗∗∗ p < 0.01
Table 8: CG quality (cont): CMP estimation of equations (1) and(2)
(1) (2) (3)UsingBig4 Disclosure CEOasAuditors ofExecomp duality
Bank-level: prob(Y=1), probit equationCorporategovernancecode 1.589∗∗∗ 1.464∗∗∗ -1.469∗∗∗
(3.82) (9.53) (-3.34)
34

. . . continued
(1) (2) (3)UsingBig4 Disclosure CEOasauditors ofexecomp duality
ForeignDomestic -0.0820 -0.235 0.326(-0.37) (-1.50) (0.96)
Ownershipconcentration 0.505 -0.184 —(1.13) (-0.54) —
Governmentownership -0.269 0.00347 0.350(-0.55) (0.01) (0.70)
Institutionalownership 0.253 0.220 -0.765∗
(0.61) (0.76) (-1.86)log Totalassets 0.0839∗∗ 0.152∗∗∗ 0.228∗∗∗
(2.01) (3.62) (3.59)year=2006 0.585∗ 1.069∗∗∗ —
(1.69) (5.05) —year=2007 0.470 0.727∗∗∗ -0.715
(1.60) (3.94) (-1.13)year=2008 0.452 0.700∗∗∗ -0.552
(1.57) (4.00) (-0.97)year=2009 0.583∗∗ 0.669∗∗∗ -0.458
(2.32) (3.82) (-0.82)year=2010 0.489∗∗ 0.642∗∗∗ -0.457
(2.04) (4.59) (-0.86)year=2011 0.436∗∗ 0.562∗∗∗ -0.376
(2.16) (3.74) (-0.78)year=2012 0.452∗∗∗ 0.497∗∗∗ -0.372
(2.78) (3.58) (-0.83)year=2013 0.237∗∗ 0.196∗∗ -0.142
(2.53) (2.30) (-0.38)year=2014 0.250∗∗∗ 0.250∗∗∗ -0.185
(3.03) (4.17) (-0.51)year=2015 0.0803∗ 0.117∗∗∗ -0.0218
(1.85) (3.68) (-0.10)cons -2.160∗∗∗ -3.753∗∗∗ -3.216∗
(-3.05) (-5.32) (-1.83)
Country-level: prob(Corporategovernancecode = 1), probit equationGovernanceffectiveness 1.075∗∗ 1.152∗∗∗ 1.313∗∗∗
(2.53) (3.98) (3.80)Requlatoryquality -1.135∗∗∗ -0.985∗∗∗ -1.398∗∗∗
(-3.51) (-3.66) (-5.12)Politicalstability 0.247∗∗ 0.260∗∗∗ 0.333∗∗∗
(2.18) (2.66) (3.30)Voiceandaccountability -0.185∗ -0.318∗∗∗ -0.234∗∗
(-1.71) (-3.51) (-2.34)Legalfamilyoforigin= 1.026∗∗∗ 1.012∗∗∗ 1.044∗∗∗
common (6.29) (6.96) (6.51)logincomecapita -0.194 -0.273∗∗∗ -0.285∗∗∗
35

. . . continued
(1) (2) (3)UsingBig4 Disclosure CEOasauditors ofexecomp duality
(-1.40) (-3.06) (-2.67)year=2006 -1.685∗∗∗ -1.742∗∗∗ -1.721∗∗∗
(-9.95) (-12.40) (-10.46)year=2007 -1.393∗∗∗ -1.467∗∗∗ -1.421∗∗∗
(-9.14) (-11.86) (-9.24)year=2008 -1.450∗∗∗ -1.519∗∗∗ -1.487∗∗∗
(-8.97) (-11.62) (-9.26)year=2009 -1.321∗∗∗ -1.391∗∗∗ -1.335∗∗∗
(-9.17) (-11.76) (-9.27)year=2010 -1.184∗∗∗ -1.273∗∗∗ -1.192∗∗∗
(-9.08) (-11.87) (-8.99)year=2011 -0.961∗∗∗ -1.003∗∗∗ -0.961∗∗∗
(-8.27) (-9.81) (-7.75)year=2012 -0.851∗∗∗ -0.883∗∗∗ -0.844∗∗∗
(-7.72) (-9.12) (-6.63)year=2013 -0.342∗∗∗ -0.352∗∗∗ -0.319∗∗∗
(-4.29) (-4.79) (-2.77)year=2014 -0.343∗∗∗ -0.331∗∗∗ -0.315∗∗∗
(-4.59) (-4.85) (-2.90)year=2015 -0.121∗∗ -0.107∗∗ -0.0960
(-2.55) (-2.36) (-1.44)cons 1.618 2.290∗∗∗ 2.304∗∗
(1.40) (3.20) (2.55)atanhrho 12cons -0.870 -2.221∗∗∗ 2.066
(-1.46) (-3.77) (1.62)N 2333 2333 2333t statistics in parentheses∗ p < 0.10, ∗∗ p < 0.05, ∗∗∗ p < 0.01
Table 9: Performance indicators: CMP estimation of equa-tions (1) and (2)
ROAA ROAE NPLratio zscore
Bank-level: FE modelCorporategovernancecode -2.844∗∗∗ -6.547 -5.212∗ 3.205∗∗∗
(-2.86) (-0.37) (-1.74) (5.37)ForeignDomestic -0.979 -15.65 21.06∗∗∗ -0.643∗∗
(-0.88) (-1.01) (16.60) (-2.00)Ownershipconcentration 1.460∗∗∗ 10.09∗∗∗ -1.832∗∗∗ 1.129∗∗∗
(5.26) (3.47) (-2.93) (4.77)Governmentownership 12.64∗∗∗ 67.78∗∗∗ 7.946 -8.558∗∗
(2.70) (6.21) (0.87) (-2.33)
36

. . . continued
(1) (2) (3) (4)ROAA ROAE NPLratio zscore
Institutionalownership -0.820∗∗∗ -0.383 -3.028∗∗∗ 0.332(-2.79) (-0.23) (-2.66) (1.00)
log Totalassets 1.686∗∗ 9.226∗∗∗ 0.0348 -1.455∗∗
(2.37) (5.36) (0.03) (-2.37)year=2006 -0.0642 1.857 -1.171 -0.752
(-0.06) (0.17) (-0.33) (-0.95)year=2007 1.003 10.77 2.075 0.443
(1.05) (1.15) (0.63) (0.61)year=2008 0.742 6.064 -1.210 0.916
(0.88) (0.63) (-0.41) (1.42)year=2009 0.713 8.566 -0.795 0.770
(1.00) (1.00) (-0.25) (1.22)year=2010 0.543 9.424 -1.513 1.265∗∗
(0.90) (1.21) (-0.60) (2.17)year=2011 -0.370 3.425 -0.629 -0.0978
(-0.77) (0.50) (-0.28) (-0.21)year=2012 -0.221 -0.180 -0.895 -0.792∗∗
(-0.43) (-0.03) (-0.48) (-2.09)year=2013 -0.278 -0.681 -1.415 0.250
(-0.77) (-0.16) (-1.09) (0.89)year=2014 -0.146 1.252 -1.068 0.614∗∗∗
(-0.57) (0.42) (-1.00) (2.77)year=2015 -0.137 -0.473 -0.640 0.806∗∗∗
(-0.88) (-0.31) (-1.00) (5.32)cons -19.29∗∗ -113.9∗∗∗ 14.48 15.00∗∗
(-2.27) (-3.80) (0.88) (2.04)Country-level: prob(Corporategovernancecode = 1), probit equationGovernance 1.165∗∗∗ 1.258∗∗∗ 1.270∗∗∗ 0.999∗∗∗
effectiveness (3.27) (3.49) (3.56) (3.05)Requlatoryquality -1.241∗∗∗ -1.277∗∗∗ -1.306∗∗∗ -1.070∗∗∗
(-4.52) (-4.47) (-4.63) (-4.13)Politicalstability 0.332∗∗∗ 0.313∗∗∗ 0.298∗∗∗ 0.297∗∗∗
(3.04) (2.64) (2.74) (3.10)Voiceandaccountability -0.210∗∗ -0.221∗∗ -0.189∗ -0.162
(-2.02) (-1.99) (-1.72) (-1.58)Legalfamilyoforigin= 0.923∗∗∗ 0.933∗∗∗ 0.921∗∗∗ 0.784∗∗∗
common (5.67) (5.49) (5.50) (4.54)logincomecapita -0.290∗∗∗ -0.293∗∗∗ -0.291∗∗∗ -0.292∗∗∗
(-2.79) (-2.68) (-2.68) (-3.11)year=2015 -1.755∗∗∗ -1.764∗∗∗ -1.732∗∗∗ -1.568∗∗∗
(-11.93) (-11.55) (-11.90) (-10.44)year=2015 -1.459∗∗∗ -1.472∗∗∗ -1.452∗∗∗ -1.283∗∗∗
(-11.01) (-11.34) (-11.44) (-9.64)
37
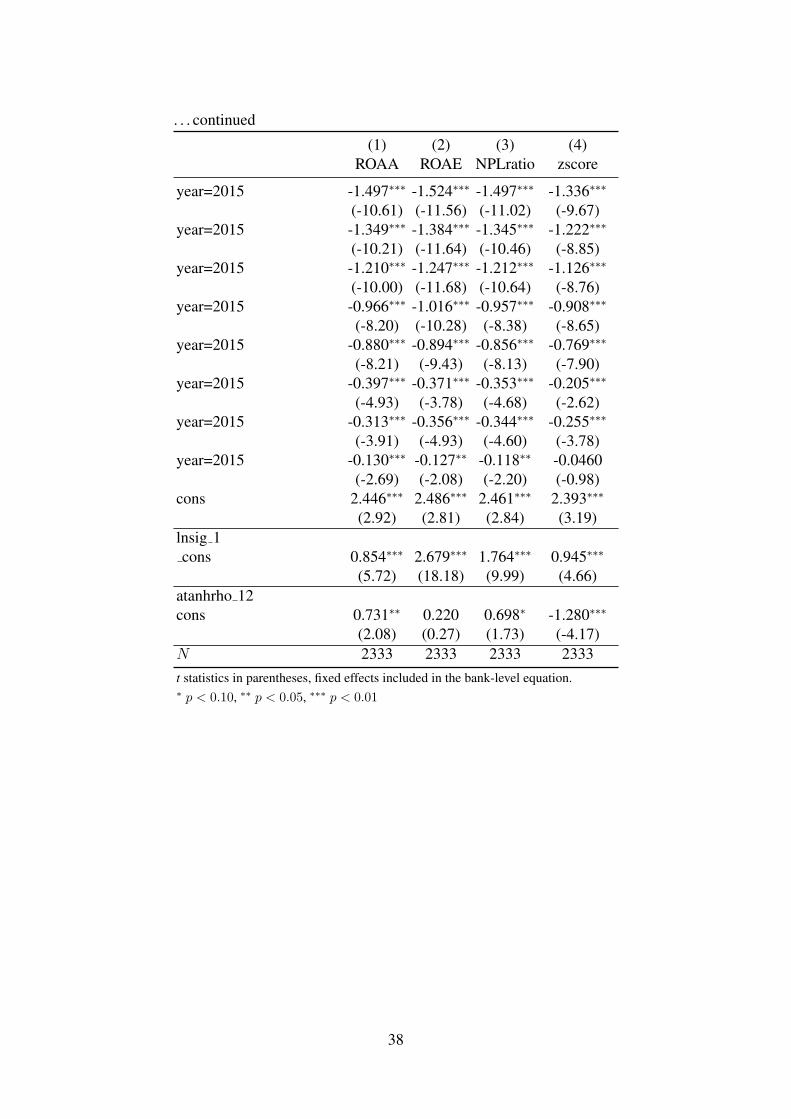
. . . continued
(1) (2) (3) (4)ROAA ROAE NPLratio zscore
year=2015 -1.497∗∗∗ -1.524∗∗∗ -1.497∗∗∗ -1.336∗∗∗
(-10.61) (-11.56) (-11.02) (-9.67)year=2015 -1.349∗∗∗ -1.384∗∗∗ -1.345∗∗∗ -1.222∗∗∗
(-10.21) (-11.64) (-10.46) (-8.85)year=2015 -1.210∗∗∗ -1.247∗∗∗ -1.212∗∗∗ -1.126∗∗∗
(-10.00) (-11.68) (-10.64) (-8.76)year=2015 -0.966∗∗∗ -1.016∗∗∗ -0.957∗∗∗ -0.908∗∗∗
(-8.20) (-10.28) (-8.38) (-8.65)year=2015 -0.880∗∗∗ -0.894∗∗∗ -0.856∗∗∗ -0.769∗∗∗
(-8.21) (-9.43) (-8.13) (-7.90)year=2015 -0.397∗∗∗ -0.371∗∗∗ -0.353∗∗∗ -0.205∗∗∗
(-4.93) (-3.78) (-4.68) (-2.62)year=2015 -0.313∗∗∗ -0.356∗∗∗ -0.344∗∗∗ -0.255∗∗∗
(-3.91) (-4.93) (-4.60) (-3.78)year=2015 -0.130∗∗∗ -0.127∗∗ -0.118∗∗ -0.0460
(-2.69) (-2.08) (-2.20) (-0.98)cons 2.446∗∗∗ 2.486∗∗∗ 2.461∗∗∗ 2.393∗∗∗
(2.92) (2.81) (2.84) (3.19)lnsig 1cons 0.854∗∗∗ 2.679∗∗∗ 1.764∗∗∗ 0.945∗∗∗
(5.72) (18.18) (9.99) (4.66)atanhrho 12cons 0.731∗∗ 0.220 0.698∗ -1.280∗∗∗
(2.08) (0.27) (1.73) (-4.17)N 2333 2333 2333 2333t statistics in parentheses, fixed effects included in the bank-level equation.∗ p < 0.10, ∗∗ p < 0.05, ∗∗∗ p < 0.01
38