corporate governance and credit rating services inc. teb ... · credit rating services inc. january...
TRANSCRIPT

1
Corporate Governance and Credit Rating Services Inc. January 6, 2015 Credit Rating Rating (National): Long Term
(TR) A Outlook: Positive Rating (National): Short Term
(TR) A1 Outlook: Positive Contact: S.Suhan Seçkin [email protected] Ali Perşembe [email protected] Oğuzhan Güner [email protected] Teb Finansman A.Ş. Gayrettepe Mahallesi Yener Sokak No:1 Kat:3-4 34349 Beşiktaş / İstanbul Tel: (0212) 355 20 00 (0212) 636 39 00 www.tebcetelem.com.tr
TTEEBB FFİİNNAANNSSMMAANN AA..ŞŞ.. Rating Summary
TEB Finansman A.Ş. (TEB Cetelem) is a consumer finance company operating in Turkey since 1995. The company is a joint partnership of BNP Paribas Personal Finance and TEB Holding A.Ş. The company's main activity is vehicle loans and provides consumer financing for various automotive brands. Following our comparative analysis of the sector and examination of financial/operational risks carried by the company, as well as the company's domestic market position and analysis of the financial and automotive sectors, TEB FİNANSMAN A.Ş. received a (National) short term rating of (TR) A1 and the long term rating of (TR) A. Strengths and Risks
Strengths
With its knowledge achieved by its experience in the sector, the
company strategically focuses on vehicle financing which is its core business.
Company benefits from the experience and technical knowledge of
its global partner BNP Paribas Personal Finance and its local partner Teb Holding A.Ş.
The company’s past performance is strong.
Its level of institutionalization and management is high.
Risks
Performance of the company is parallel to the performance of the highly volatile automotive industry.
The sector of vehicle financing, the core business of the company, is highly competitive and tends to increase.

2
Outlook
In the aftermath of the global crisis in 2009, TEB Finansman A.Ş. has recorded a regular and considerable growth performance increase with a rate of 631%. Despite the contraction of the automotive market in 2012 the company increased its revenue items and at the same time managed to strengthen its capital structure. TEB Finansman increased its revenue and maintained its profit despite the negative impact of regulatory arrangements in 2013. In addition, financial structure of the company who has no foreign currency assets or liabilities which creates a position and utilizes fixed-rate loans might continue its stable trend despite the possible exchange and interest rate increases/decreases which could lead to changes in the sector. In addition, new contracts signed in 2014 added to the diversity of the automotive brands and it is expected to make an impact in the coming period to an income increase.
Sector Analysis
Despite the improvement in the US economy, ongoing effects of the global crisis in developing countries and in the EU countries are slowing the recovery trend in the global economy. While a tighter monetary policy is in the agenda for US, the EU opts for easing. Political developments that took place in Turkey's immediate geography are emerging as geopolitical risks. Although the world economy shows a gradual but uneven recovery, the low-growth process continues. The growth rate in developed economies gradually improved but performance of growth in emerging economies has been weakening. On the other hand, the global development which will have a positive impact on the coming period, particularly to the automotive industry, is the radical decline in oil prices. Sluggish demand caused by global growth failure in the short term and widespread use of alternative energy sources in the long term on one hand, rapidly increasing oil supply with the introduction of new methods, especially by the US, on the other, is indicating a trend that could spread to the long-term creating a downward sudden break in oil prices. Measures taken to balance domestic and foreign demand in Turkey has slowed the growth rate in 2012, but gained momentum again in 2013 as a result of increasing domestic demand and stood at 4.1%. As far as production is concerned, value added increases of 3.4% in the industry sector, 5.6% in the services sector and an increase of 3.5% in the agricultural sector are recorded. A growth rate of 3.3% in 2014 and 4% in 2015 is targeted as per the revised Medium-Term Program (MTP). Additionally; increasing uncertainty in the global economy caused volatility in capital flows to other developing countries and Turkey since May 2013. The Central Bank of Turkey (CBT) retaliated by means of primary tools in the first stage to the negative impact of the said fluctuations on the domestic financial markets. Steps have been taken in this context to increase the cost of the liquidity available to the market and the foreign currency liquidity. The Bank maintained its tight stance provided by primary tools until the end of 2013. However the volatility experienced in the financial markets began to increase due to domestic political developments and risks for the global economy towards the end of 2013. The negative impact of these fluctuations caused deviations from the inflation outlook and expectations stated in the MTP. As a result, in January 2014 the Central Bank increased the 1-week repo rate by 550 basis points to 10%. From May of 2014, after the improvement in domestic financial markets, the Bank has realized measured rate reductions without compromising its strict stance against inflationary risks. It is expected that the weighted average inflation rate of 2014 will be around 9% and decline in oil prices will reduce the risk of cost-push inflation in the coming period.
Nonbank Financial Sector Turkish nonbank financial sectors with emphasis on diversification, development and deepening of financial services is in the development stage, yet its’ share in the financial system has been increasing daily. In particular, innovations introduced by the "Financial Leasing, Factoring and Financing Companies Act" which entered into force on December 13, 2012 are important for the future of these sectors. The Financial Leasing, Factoring and Financing Companies Association was established in 25 July 2013. It is expected to contribute to the development of the institutional structure of the sector and to increase standardization and transparency.

3
As in previous periods, the non-banking financial sector continues to grow. When viewed on a sectorial basis, total assets of the financial leasing sector as of December 2013 are about TL 28 billion. The volume of transactions registered a growth of 40% reaching TL 14 billion compared to TL 10 billion in 2012. Total assets of the factoring sector grew by 23% as of December 2013, reaching TL 22 billion and trading volume has reached a turnover of TL 94 billion, creating a cash resource of TL 20 billion for the real sector. However, although the share of finance companies is lacking behind the companies in financial leasing and factoring sectors, it has been increasing over the years. The finance sector has reached total assets of TL 16 billion as of the end of 2013. On the basis of transaction volume, as of 2013 it has reached TL 9,3 billion in size according to data from the Association of Financial Companies.
Financing Sector Growth showed by 13 companies of the sector in recent years is given in the table below. (‘000’)
YEAR ASSET SIZE FINANCING LOANS RECENTLY ESTABLISHED LOANS EQUITY NET
PROFIT
VEHICLE HOUSING OTHER TOTAL PASSENGER COMMERCIAL
2009 4,532,130 3,830,550 1,197,814 1,326,421 109,355 109,329 2,742,919 411,142 10,701 2010 6,048,086 5,389,356 2,471,741 1,874,568 160,861 84,235 4,591,406 460,242 39,374 2011 8,958,595 8,385,227 3,273,279 2,290,555 186,356 107,027 5,857,217 699,786 96,838 2012 11,708,615 10,780,647 3,862,694 2,385,583 289,594 113,443 6,651,313 904,429 147,236 2013 15,952,912 14,536,891 5,824,941 2,950,120 365,264 114,523 9,254,847 1,216,345 163,880
Source: Association of Financial Institutions The total assets of the finance sector showed a growth of 36% compared to 2013 reaching TL 15,952,912,000. Financing receivables has reached to TL 14,536,891,000 with a growth rate of 35%. Sector's total equity increased by 34% over the same period reaching TL 1,216,345,000 and net profit increased by 11% to TL 163,880,000.
On the other hand, banks’ portfolio of car loans increased by 4.3% and that of financing companies grew by 37.3%. The share of financing companies in total automobile loans is in an increasing trend. Banking Regulation and Supervision Agency (BRSA) and CBT introduced additional regulations upon the progress witnessed in the sector;
4
The decree of the Central Bank dated 4 October 2013 brought the reserve requirements of financing companies within the scope of the current rate of the banks. (as of 21 October 2014 the Central Bank has declared that it will pay 500-700 basis points less than the average cost of funding for TL denominated reserve requirements)
Following BRSA regulations change of 24 December 2013 individual automobile loans are subject to the
general reserve liabilities.
Following BRSA regulations change of 24 December 2013 prepayment rate and maturity restrictions were brought in vehicle loans.
In line with BRSA regulations dated 3 October 2014 a new arrangement on fees and commissions to be
received from financial consumer has entered into force. As of first 9 months of 2014 these regulations caused a negative impact on the profitability of the companies in the sector, but it is a positive development in terms of capital adequacy and protection against risks.
Company Overview
TEB Finansman A.Ş. (TEB Cetelem) is a consumer finance company operating in Turkey since 1995. The company is a joint partnership of BNP Paribas Personal Finance and TEB Holding A.Ş.
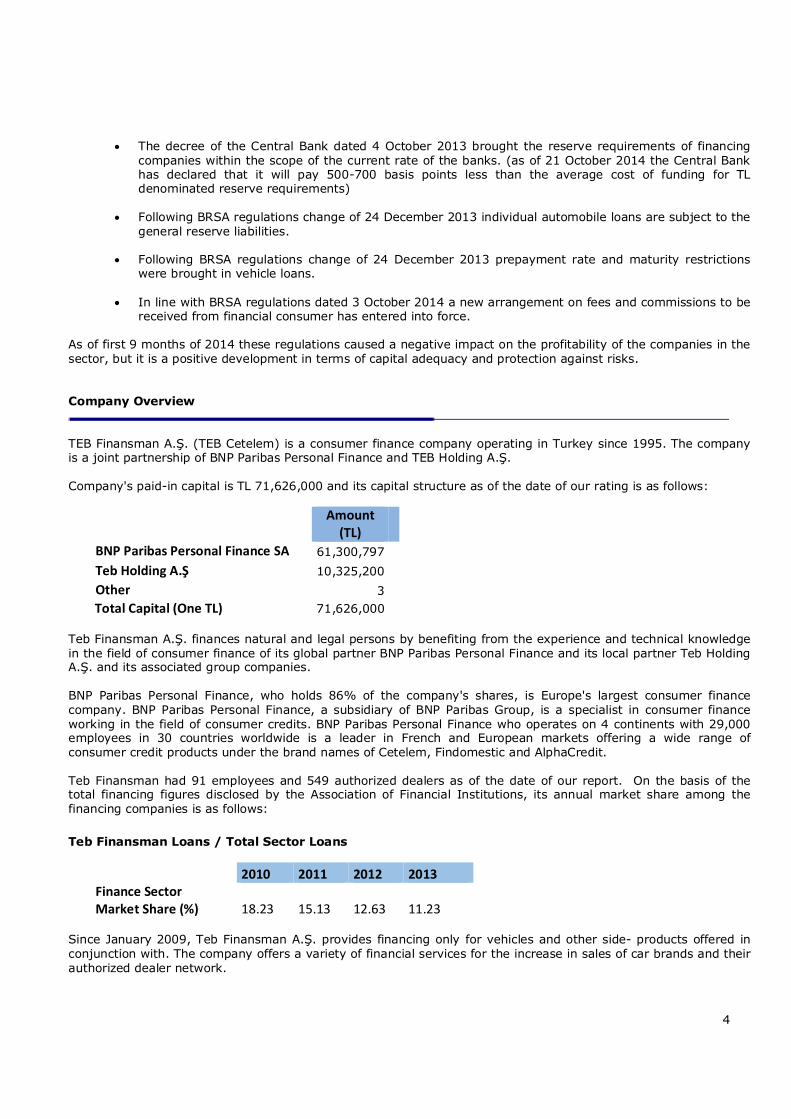
Company's paid-in capital is TL 71,626,000 and its capital structure as of the date of our rating is as follows:
Amount (TL)
BNP Paribas Personal Finance SA 61,300,797 Teb Holding A.Ş 10,325,200 Other 3
Total Capital (One TL) 71,626,000 Teb Finansman A.Ş. finances natural and legal persons by benefiting from the experience and technical knowledge in the field of consumer finance of its global partner BNP Paribas Personal Finance and its local partner Teb Holding A.Ş. and its associated group companies. BNP Paribas Personal Finance, who holds 86% of the company's shares, is Europe's largest consumer finance company. BNP Paribas Personal Finance, a subsidiary of BNP Paribas Group, is a specialist in consumer finance working in the field of consumer credits. BNP Paribas Personal Finance who operates on 4 continents with 29,000 employees in 30 countries worldwide is a leader in French and European markets offering a wide range of consumer credit products under the brand names of Cetelem, Findomestic and AlphaCredit. Teb Finansman had 91 employees and 549 authorized dealers as of the date of our report. On the basis of the total financing figures disclosed by the Association of Financial Institutions, its annual market share among the financing companies is as follows: Teb Finansman Loans / Total Sector Loans
2010 2011 2012 2013
Finance Sector Market Share (%) 18.23 15.13 12.63 11.23
Since January 2009, Teb Finansman A.Ş. provides financing only for vehicles and other side- products offered in conjunction with. The company offers a variety of financial services for the increase in sales of car brands and their authorized dealer network.

5
Teb Finasman’s yearly automotive (new vehicles) market share is as follows: Teb Finansman Number of New Loans Provided / Total Vehicles Sold in the Automotive Sector
2010 2011 2012 2013
Automotive Sector Market Share (%) 5.94 4.10 3.98 4.25 Condensed Balance Sheet and Income Statement
Teb Finansman A.Ş. Comparative Balance Sheets (‘000’):
ASSETS 31 Dec. 2011 31 Dec. 2012 31 Dec. 2013
1. CASH ASSETS
12,140
2. ACTUAL VALUE DIFFERENCE FV REFLECTED TO P/L (Net)
3. BANKS 33,620 32,315 79,010
4. RECEIVABLES FROM REVERSE REPURCHASE AGREEMENTS
5. AVAILABLE-FOR-SALE FINANCIAL ASSETS (Net)
6. FACTORING RECEIVABLES
7. FINANCING LOANS 1,268,516 1,361,750 1,632,690
8. LEASING OPERATIONS
9. OTHER RECEIVABLES
10. NON-PERFORMING LOANS 7,894 15,466 24,355
11. HEDGING DERIVATIVE FINANCIAL ASSETS 27,768 1,855
12. INVESTMENTS HELD-TO-MATURITY (Net)
13. SUBSIDIARIES (Net)
14. AFFILIATES (Net)
15. JOINT VENTURES (Net)
16. TANGIBLE FIXED ASSETS (Net) 360 300 236
17. INTANGIBLE FIXED ASSETS (Net) 1,678 1,327 1,427
18. PREPAID EXPENSES 14,894 16,256
19. CURRENT TAX ASSETS
20. DEFERRED TAX ASSETS
4,131 6,074
21. OTHER ASSETS 17,826 1,541 3,573
22. ASSETS HELD FOR SALE AND DISCONTINUED OPERATIONS (Net)
TOTAL ASSETS 1,357,662 1,433,579 1,775,761

6
Teb Finansman A.Ş.’s Comparative Statements of Income (‘000’):
INCOME STATEMENT 31 Dec. 2011 31 Dec. 2012 31 Dec. 2013
1. OPERATING INCOME 144,418 184,151 199,598
2. FINANCING EXPENSES (115,601) (140,094) (141,268)
3. GROSS P/L 28,817 44,057 58,330
4. OPERATING EXPENSE (17,987) (21,285) (28,942)
5. GROSS OPERATING P/L 10,830 22,772 29,388
6. OTHER OPERATING INCOME 94,765 128,403 23,200
7. PROVISIONS FOR NON-PERFORMING LOANS (1,220) (2,594) (4,430)
8. OTHER OPERATING EXPENSE (86,873) (108,231) (7,455)
9. NET OPERATING P/L 17,502 40,350 40,703
10. POST-MERGER SURPLUS INCOME
11. NET MONETARY P/L
12. BEFORE TAX INCOME / LOSS ON CONTINUED OPERATIONS 17,502 40,350 40,703
13. TAX PROVISION FOR CONTINUING OPERATIONS (3,531) (6,628) (7,988)
14. CONTINUING OPERATIONS NET P/L 13,971 33,722 32,715
15. INCOME FROM DISCONTINUED OPERATIONS
16. LOSS FROM DISCONTINUED OPERATIONS
17. DISCONTINUED OPERATIONS BEFORE TAXES P/L 18. TAX PROVISION FOR DISCONTINUED OPERATIONS
19. DISCONTINUED OPERATIONS NET P/L
NET PROFIT/LOSS 13,971 33,722 32,715
LIABILITIES 31 Dec. 2011 31 Dec. 2012 31 Dec. 2013
1. DERIVATIVE FINANCIAL LIABILITIES HELD FOR TRADING
2. LOANS RECEIVED 1,241,753 1,284,067 1,530,235
3. FACTORING DEBTS
4. LEASING DEBTS
5. SECURITIES ISSUED (Net)
50,785
6. OTHER DEBT 2,084 583 802
7. OTHER EXTERNAL SOURCES 30,448 3,944 4,647
8. HEDGING DERIVATIVE FINANCIAL LIABILITIES 391 141
9. TAXES AND LIABILITIES 2,538 3,052 4,205
10. LIABILITY AND EXPENSE PROVISIONS 12,513 9,997 15,844
11. DEFERRED INCOME
30,379 34,625
12. CURRENT TAX LIABILITY 1,631 2,101
13. DEFERRED TAX LIABILITY 475
14. SUBORDINATED LOANS 15. FIXED ASSET LIABILITIES ON ASSETS HELD FOR SALE AND DISCONTINUED OPERATIONS
16. EQUITY 67,460 99,785 132,517
TOTAL LIABILITIES 1,357,662 1,433,579 1,775,761

7
The company's total assets showed an increase of 24% at the end of 2013 compared to the previous year, to TL 1,775,761,000. 92% of its total assets consist of financial loans. When the structure of the companies which provide vehicle financing as their main activity is analyzed, presence of companies with dependence to distributor / brand name is observed mainly due to the equity partnership relations. Teb Finansman’s operations however are free of a captive structure. It differentiated from the sector in general by providing funding to various brands. Diversification prevents the company from exposing to risks of captive companies arising from the parent company. New agreements signed at the beginning of 2014 helped the company to increase the number of automotive brands to be financed. When the loans provided are analyzed; a slight decrease was recorded in 2012 due to the shrinkage in the sector, but an increase of 36% was realized at the end of 2013 compared to year ago. The company recorded a growth of 631% in total funding between 2009 and 2013, a considerable performance compared to other companies in the sector. The course of the company’s financial loans is as follows:
The maturity structure of financing are as follows (‘000’):
31 Dec. 13 31 Dec. 12
Short-Term Financing Loans (< 1 year) 678,123 597,703 Long-Term Financing Loans (> 1 year) 954,567 764,047 Total Financing Loans 1,632,690 1,361,750
The company funds its credit portfolio by loans received from domestic and international banks and by securities issued (bonds) in capital markets. Credit limits at the banks show the company is capable of borrowing from local and international markets. Company officials declared that most of the loans are unsecured. As of the date of our report, unused credit limits of the company meet liabilities arising from bond issuance. In addition to the loans received from domestic and international banks, the company issues bonds in capital markets to meet its funding needs. For the first time it realized a bond issue of TL 50,000,000 on 17 April 2013 with a maturity date of 16 October 2014. Company officials identify diversification in sources of funding is one of the key objectives. All of the loans in the company’s assets and related funding used have fixed interest rates. Other than foreign currency denominated statutory reserves held at the Central Bank and the loans used funding these reserves, the company did not have any foreign currency assets or liabilities as of the date of our report, therefore did

8
not carry a currency risk. On the other hand, exposure to a liquidity risk is managed through the balancing of assets and liabilities, and followed up by reports prepared on interest rate risk. Profit for the period was kept within the company and as of 31 December 2013 its total equity was TL 132,517,000 with a 33% increase compared to the previous year. Looking at the yearly total equity progress, we can see that a cash capital increase was realized in 2010 and 2011 in parallel with the company's growth needs and no dividend distribution was executed during the last 3 years. The increasing trend of Teb Finansman’s equity capital is as follows:
The operating revenue was realized as TL 199,598,000 as of 31 December 2013, an increase of 8% which is close to the sector average. Net operating income and net profit are in the previous year's levels. It is possible to say that legislative changes which took place in 2013 caused negative impact on profitability. Progress of the company's operating revenue, operating profit and net income items are shown below. Try Mn.

9
Liquidity: 2013 liquidity ratios showed a limited decline compared to 2012. Liquidity performance of the company in comparison with the sector performance is indicated as follows:
Liquidity Ratios 2012 2013 (Liquid Assets + Short-term Receivables) / Current Liabilities 0.90 0.84 Short Term Receivables / Total Receivables 0.44 0.42 (Current Assets - Current Liabilities) / Total Assets -0.05 -0.08
Capital Adequacy and Leverage Ratios: The company's use of leverage is close to the sector average. However, the debt / capital ratio remained slightly below the sector average. In accordance with Article 12 titled Standard Ratio on Regulations on the Establishment and Operation Principles of Financial Leasing, Factoring and Financing Companies published in the Official Gazette number 28627 on 24 April 2013, ratio of the company’s equity to total assets (standart rate) should be minimum 3% and maintained at that level. As per the report provided to BRSA’s Non-Bank Financial Institutions Surveillance System company’s ratio of equity to total assets is realised as 7.09% as of 31 December 2013. The company also complies with the regulation "the total amount of loans extended by finance companies does not exceed 30 times the equity" which is included in Article 23 of Regulations on the Establishment and Operation Principles of Financial Leasing, Factoring and Financing Companies. A rate of 15.85 was realized as of 31 December 2012, and as of the balace sheet date credits granted were not 30 times the total equity.
Capital Adequacy and Leverage Ratios 2012 2013 Total Debt / Equity 12.96 12.02 Total Debt / Equity + Special Provisions 12.19 11.29 Short-Term Debt / Capital 9.83 12.77 Long-Term Debt / Capital 8.10 9.30 Total Debt / Capital 18.06 22.24

10
Profitability: Some profitability ratios of Teb Finansman A.Ş. are shown below. Profitability of the company has showed a decline compared to previous year due to the regulations introduced. However, it is still above the market average.
Profitability Ratios 2012 2013 Return on Assets 0.024 0.018 Return on Equity 0.338 0.247 Financial Income / Net Receivables 0.033 0.036 Net Profit / Loans 0.025 0.020

11
Volatility: The company’s business volume indicates high volatility. High volatility of the automotive sector in general, both domestic and abroad, seems to be the main factor. The trend of the rapid increase in the past few years could be followed by a decrease at a similar pace in line with the global economic outlook and changes in demand in the automotive sector. According to the data of The Association of Automotive Distributors total EU (27) and EFTA countries automotive market shrank by 1.4% in 2013 to 14,092,093 units. This figure was 14,298,213 in 2012. Turkey occupied the 4th place in European auto sales ranking in December 2013 and 5th place as of end 2013. Domestic cars and light commercial vehicle market shrank by 14% in the first 11 months 2014. Figures for total retail market in Turkey over the years are as follows.
Source: The Association of Automotive Distributors
Asset Quality: Rate of Non-Performing Loans / Credit Receivables and Special Provisions / Credit Receivables are below the sector average, but the company’s asset quality are performing above the average level. In addition, company officials declared that the monthly realization rate of the collection of receivables is around 97.5%.
Asset Quality 2012 2013 Non-performing Loans / Credit Receivables 0.016 0.020 Special Provisions / Credit Receivables 0.005 0.005

12
Corporate Governance
Since Teb Finansman A.Ş.’s shares are not publicly traded, the company is not subject to Capital Markets Board’s (CMB) provisions of Communiqué on the Determination and Implementation of Corporate Governance Principles. However our studies with respect to corporate governance practices shows that the company has provided certain compliance with the CMB’s Corporate Governance Principles and has implemented some of the necessary policies and measures. The rights of shareholders and stakeholders are respected fairly. Even though the company does not have any free float shares, it is subject to CMB and BIST (Borsa İstanbul) rules and regulations due to the bond issuance and discloses its financial reports and material disclosures regularly on the Public Disclosure Platform (KAP). Public disclosure and transparency is at high levels and the structure and operation of the board of directors is built on sound basis.

13
Methodology
SAHA's credit rating methodology is composed of quantitative and qualitative sections to affect the final note with specific weights. Quantitative analysis components consist of company’s distance from the point of default, its performance compared to the sector, analysis of the financial risks, and the assessment of cash flow projections in conjunction with the related financial instrument. Default point analysis measures the distance from the point of default and it is based on relevant sector firms’ past financial performances, ratios derived from a distinctive default statistics, and statistically derived coefficients. This analysis is based on genuine statistical study of SAHA, covering consumer finance, factoring and leasing companies in Turkey. Comparative performance analysis of the sector determines the position of the company concerned in comparison with the sector firms’ recent financial performances. Financial risk analysis covers the evaluation of the company's financial ratios on the basis of objective criteria. Liquidity, leverage, asset quality, profitability, volatility and concentration are treated as sub-headings in this analysis. Finally, scenario analysis tackles the company’s future base and stress scenario projections subject to scrutiny in the context of the firm's financing tool and assesses the risks of fulfillment of obligations. Qualitative analysis covers operational issues such as sector and company risks as well as administrative risks in the context of corporate governance practices. Sector analysis evaluates the nature and rate of growth of the sector, its competitive structure, structural analysis of customers and creditors, and sensitivity of the sector to risks at home and abroad. Company analysis discusses market share and efficiency, growth trend, cost structure, service quality, organizational stability, access to domestic and foreign funding sources, off-balance sheet liabilities, accounting practices, and parent / subsidiary company relationships. Corporate governance plays an important role in our methodology. The importance of corporate governance and transparency outshines once again in the current global financial crisis we witness. Our methodology consist of four main sections; shareholders, public disclosure and transparency, stakeholders, and board of directors. The corporate governance methodology of SAHA can be accessed at www,saharating,com.
14
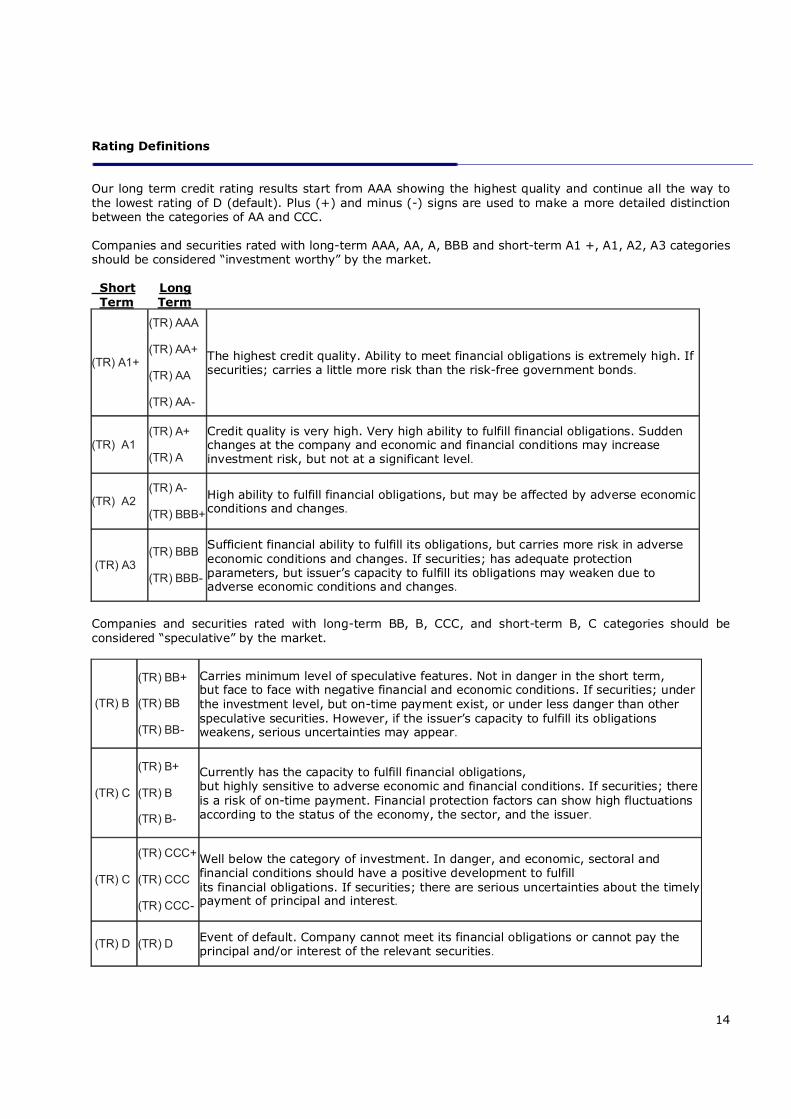
Rating Definitions
Our long term credit rating results start from AAA showing the highest quality and continue all the way to the lowest rating of D (default). Plus (+) and minus (-) signs are used to make a more detailed distinction between the categories of AA and CCC. Companies and securities rated with long-term AAA, AA, A, BBB and short-term A1 +, A1, A2, A3 categories should be considered “investment worthy” by the market. Short Long Term Term
(TR) A1+
(TR) AAA
(TR) AA+
(TR) AA
(TR) AA-
The highest credit quality. Ability to meet financial obligations is extremely high. If securities; carries a little more risk than the risk-free government bonds.
(TR) A1 (TR) A+
(TR) A
Credit quality is very high. Very high ability to fulfill financial obligations. Sudden changes at the company and economic and financial conditions may increase investment risk, but not at a significant level.
(TR) A2 (TR) A-
(TR) BBB+ High ability to fulfill financial obligations, but may be affected by adverse economic conditions and changes.
(TR) A3 (TR) BBB
(TR) BBB-
Sufficient financial ability to fulfill its obligations, but carries more risk in adverse economic conditions and changes. If securities; has adequate protection parameters, but issuer’s capacity to fulfill its obligations may weaken due to adverse economic conditions and changes.
Companies and securities rated with long-term BB, B, CCC, and short-term B, C categories should be considered “speculative” by the market.
(TR) B
(TR) BB+
(TR) BB
(TR) BB-
Carries minimum level of speculative features. Not in danger in the short term, but face to face with negative financial and economic conditions. If securities; under the investment level, but on-time payment exist, or under less danger than other speculative securities. However, if the issuer’s capacity to fulfill its obligations weakens, serious uncertainties may appear.
(TR) C
(TR) B+
(TR) B
(TR) B-
Currently has the capacity to fulfill financial obligations, but highly sensitive to adverse economic and financial conditions. If securities; there is a risk of on-time payment. Financial protection factors can show high fluctuations according to the status of the economy, the sector, and the issuer.
(TR) C
(TR) CCC+
(TR) CCC
(TR) CCC-
Well below the category of investment. In danger, and economic, sectoral and financial conditions should have a positive development to fulfill its financial obligations. If securities; there are serious uncertainties about the timely payment of principal and interest.
(TR) D (TR) D Event of default. Company cannot meet its financial obligations or cannot pay the principal and/or interest of the relevant securities.

15
Disclaimer
This Credit Rating Report has been prepared by Saha Kurumsal Yönetim ve Kredi Derecelendirme A.Ş. (SAHA Corporate Governance and Credit Rating Services, Inc.) in collaboration with Teb Finansman A.Ş. and is based on information disclosed to public by Teb Finansman A.Ş. This report, conducted by SAHA A.Ş. analysts and based on their best intentions, knowledge base and experience, is the product of an in depth study of the available information which is believed to be correct as of this date. It is a final opinion about the overall credibility of the institutions and/or debt instruments they have issued. The contents of this report and the final credit rating should be interpreted neither as an offer, solicitation or advice to buy, sell or hold securities of any companies referred to in this report nor as a judgment about the suitability of that security to the conditions and preferences of investors. SAHA A.Ş. makes no warranty, regarding the accuracy, completeness, or usefulness of this information and assumes no liability with respect to the consequences of relying on this information for investment or other purposes. SAHA A,Ş, has embraced and published on its web site (www,saharating,com) the IOSCO (International Organization of Securities Commissions) Code of Conduct for Credit Rating Agencies and operates on the basis of independence, objectivity, transparency, and analytic accuracy. © 2015, Saha Kurumsal Yönetim ve Kredi Derecelendirme A.Ş. All rights reserved. This publication or parts thereof may not be republished, broadcast, or redistributed without the prior written consent of Saha Kurumsal Yönetim ve Kredi Derecelendirme A.Ş. and Teb Finansman A.Ş.