corporate finance week 4 – 17&19 oct. 2005 stock and company valuation – dividend growth...
TRANSCRIPT

CORPORATE FINANCEWeek 4 – 17&19 Oct. 2005
Stock and Company Valuation – Dividend Growth Model, Free Cash Flow Model
I. Ertürk
Senior Fellow in Banking
CORPORATE FINANCEIII
ESCP-EAP - European Executive MBA
25 Nov. 2005 p.m. London
Stock and Company Valuation – Dividend Growth Model, Free Cash Flow Model
I. Ertürk
Senior Fellow in Banking

Stocks & Stock Market
Book Value - Net worth of the firm according to the balance sheet.
Liquidation Value - Net proceeds that would be realized by selling the firm’s assets and paying off its creditors.
Market Value Balance Sheet - Financial statement that uses market value of assets and liabilities.
Stocks & Stock Market
Common Stock - Ownership shares in a publicly held corporation.
Secondary Market - market in which already issued securities are traded by investors.
Dividend - Periodic cash distribution from the firm to the shareholders.
P/E Ratio - Price per share divided by earnings per share.
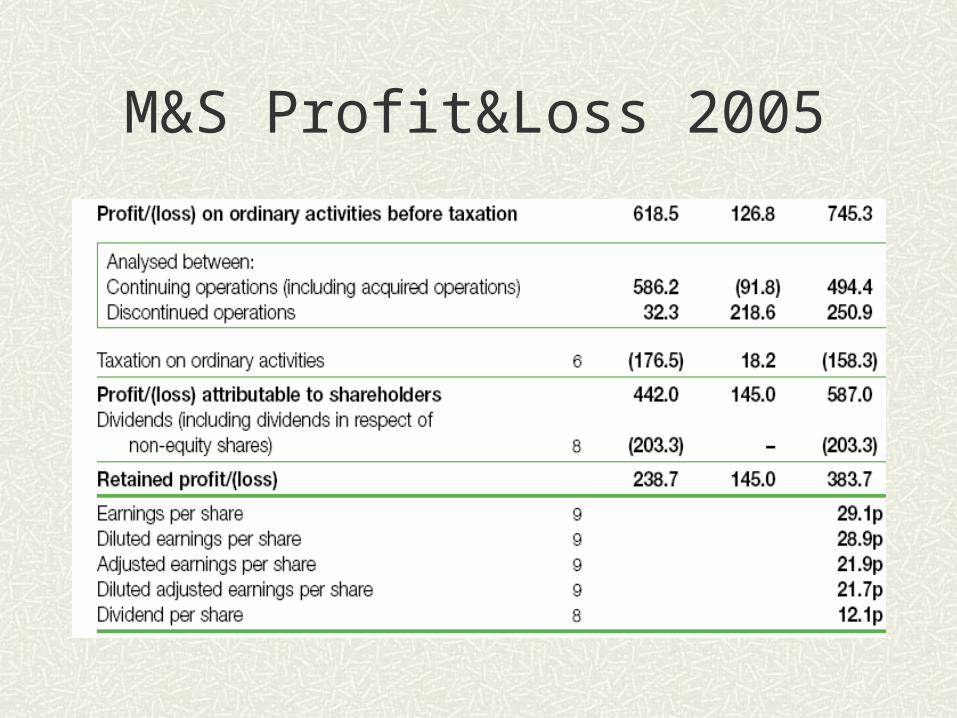
M&S Profit&Loss 2005

Dividends and company value
If a firm elects to pay a lower dividend, and reinvest the funds, the stock price may increase because future dividends may be higher.
Payout Ratio - Fraction of earnings (EPS) paid out as dividends
Plowback Ratio - Fraction of earnings (EPS) retained by the firm.
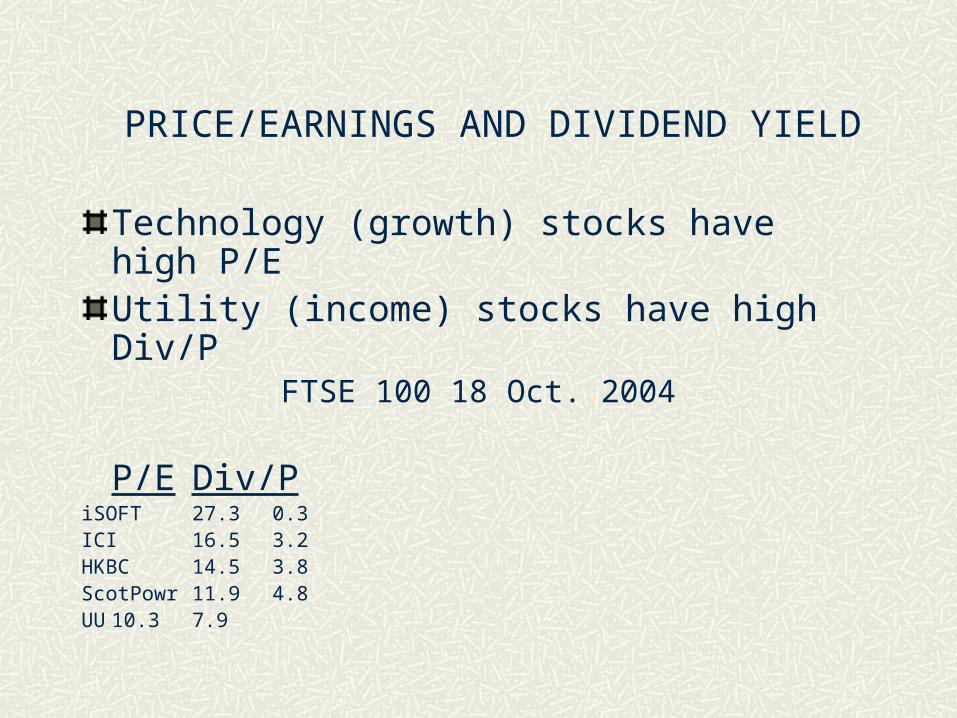
PRICE/EARNINGS AND DIVIDEND YIELD
Technology (growth) stocks have high P/EUtility (income) stocks have high Div/P
FTSE 100 18 Oct. 2004
P/E Div/PiSOFT 27.3 0.3ICI 16.5 3.2HKBC 14.5 3.8ScotPowr 11.9 4.8UU 10.3 7.9
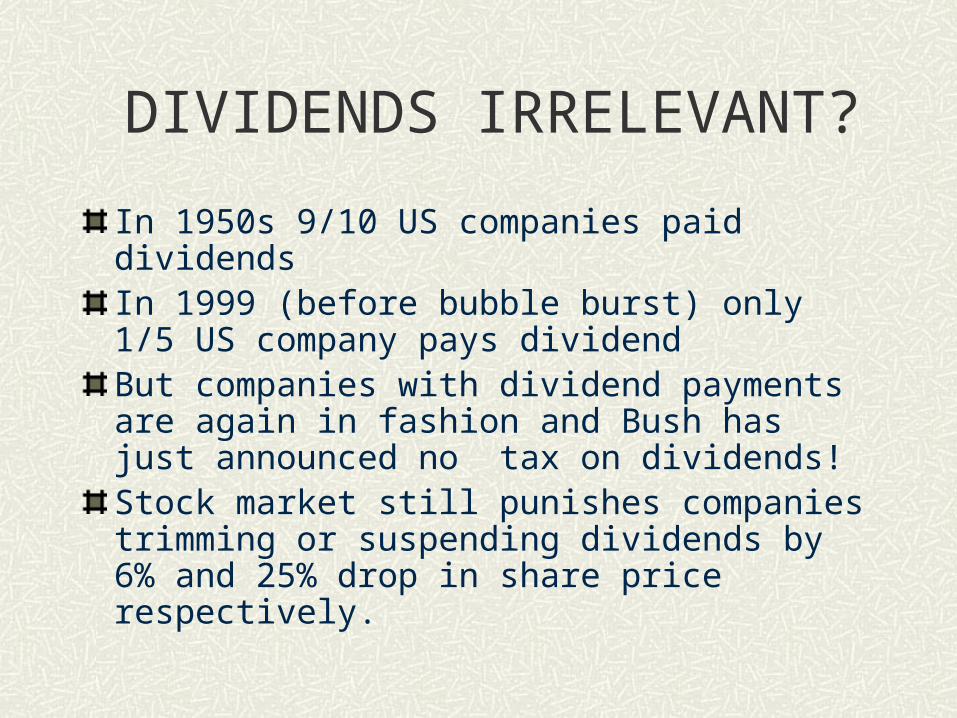
DIVIDENDS IRRELEVANT?
In 1950s 9/10 US companies paid dividendsIn 1999 (before bubble burst) only 1/5 US company pays dividendBut companies with dividend payments are again in fashion and Bush has just announced no tax on dividends!Stock market still punishes companies trimming or suspending dividends by 6% and 25% drop in share price respectively.
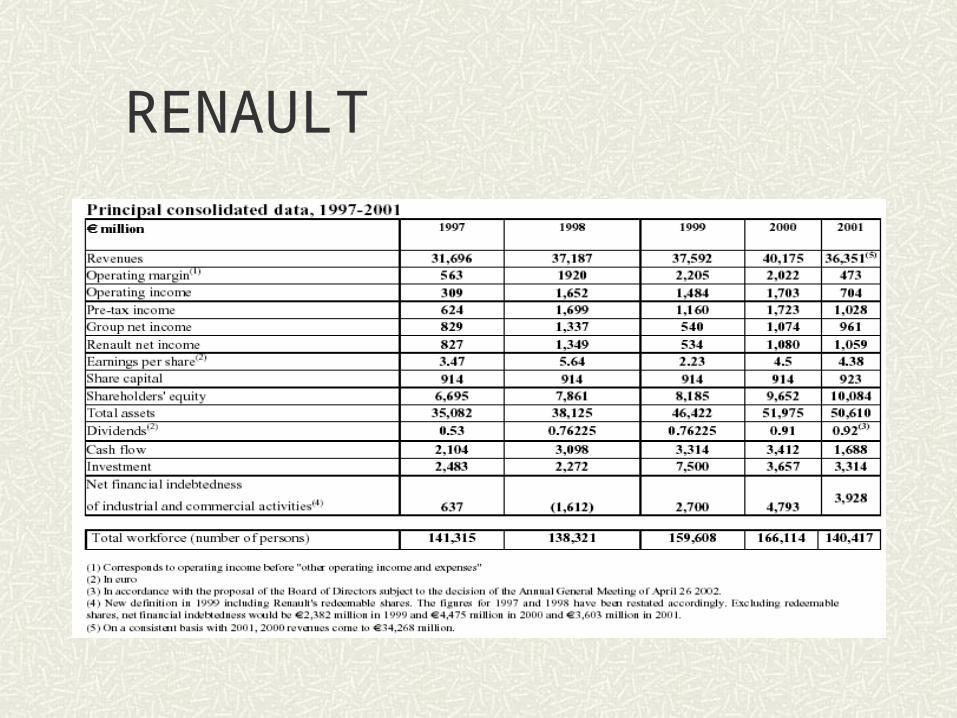
RENAULT

UCB 2003
EQUITY MARKET VALUE
CORPORATE EARNINGS AND FIRM VALUE
P/E MULTIPLE
PRICE EARNINGS MULTIPLE (RATIO)
PRICE PER SHARE
EARNINGS PER SHARE
USE OF EARNINGS IN COMPANY VALUATION
Security analysts Earnings multiplied by P/E
Theoretical value Discounted dividends -future cash flows-
(Gordon Growth Model)
How do we measure earnings? Accounting v.s. economic earnings (Enron!)
PRICE OF THE STOCK=PV(EXPECTED FUTURE DIVIDENDS)
If stock is held forever!
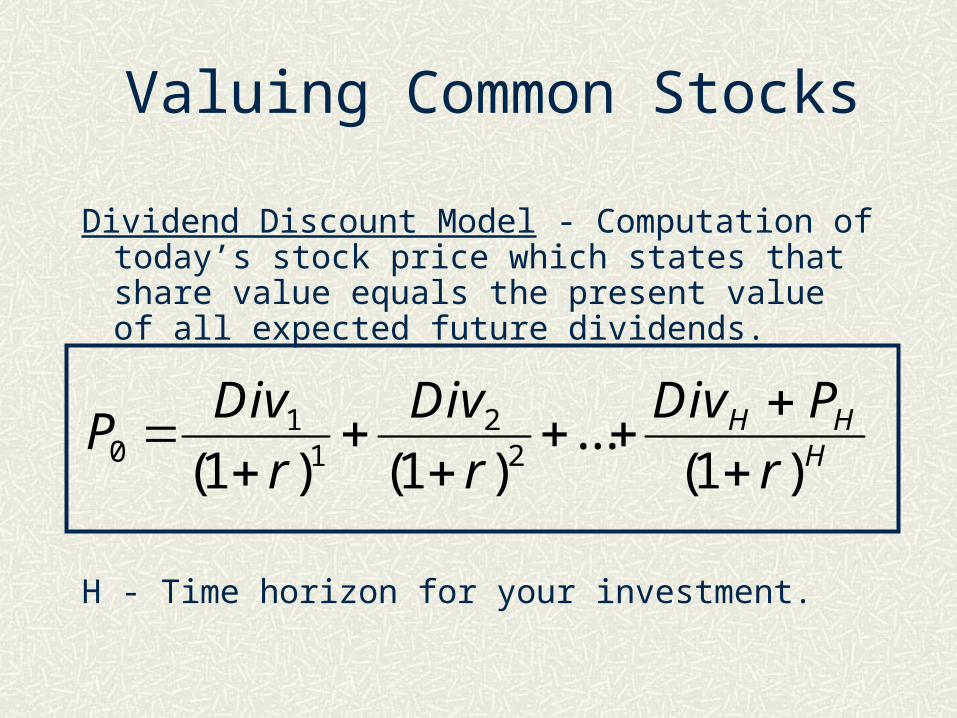
Valuing Common Stocks
Dividend Discount Model - Computation of today’s stock price which states that share value equals the present value of all expected future dividends.
H - Time horizon for your investment.
PDiv
r
Div
r
Div P
rH H
H01
12
21 1 1
( ) ( )
...( )
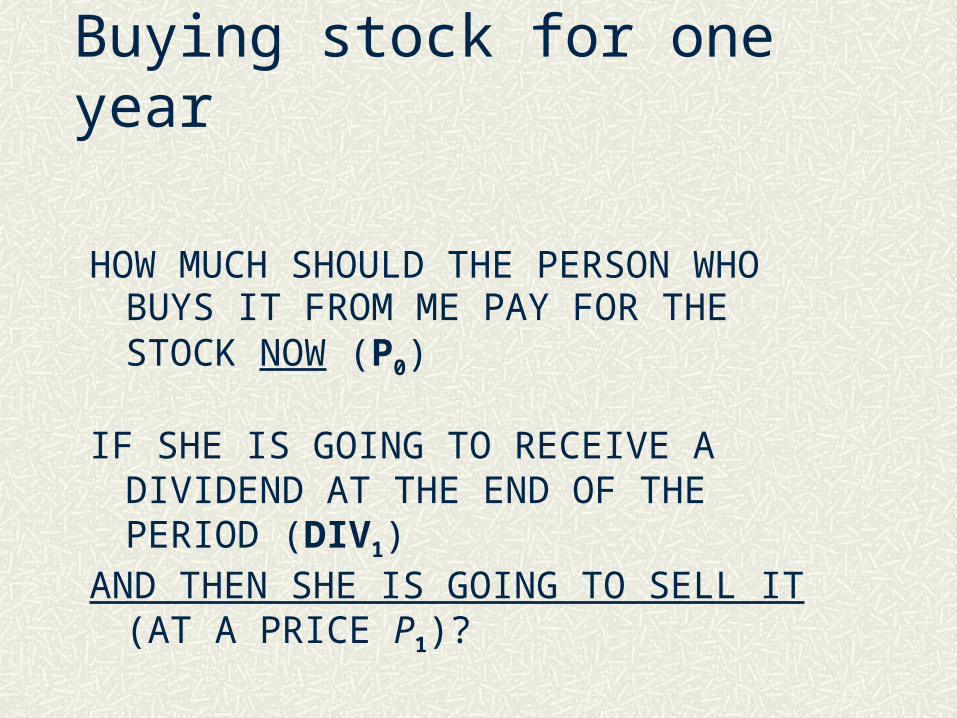
HOW MUCH SHOULD THE PERSON WHO BUYS IT FROM ME PAY FOR THE STOCK NOW (P0)
IF SHE IS GOING TO RECEIVE A DIVIDEND AT THE END OF THE PERIOD (DIV1)
AND THEN SHE IS GOING TO SELL IT (AT A PRICE P1)?
Buying stock for one year
22
221
221
11
)()( rP
rr
rrP
rP
1DIV
1DIV
11
DIVDIV
1DIV
1
0P
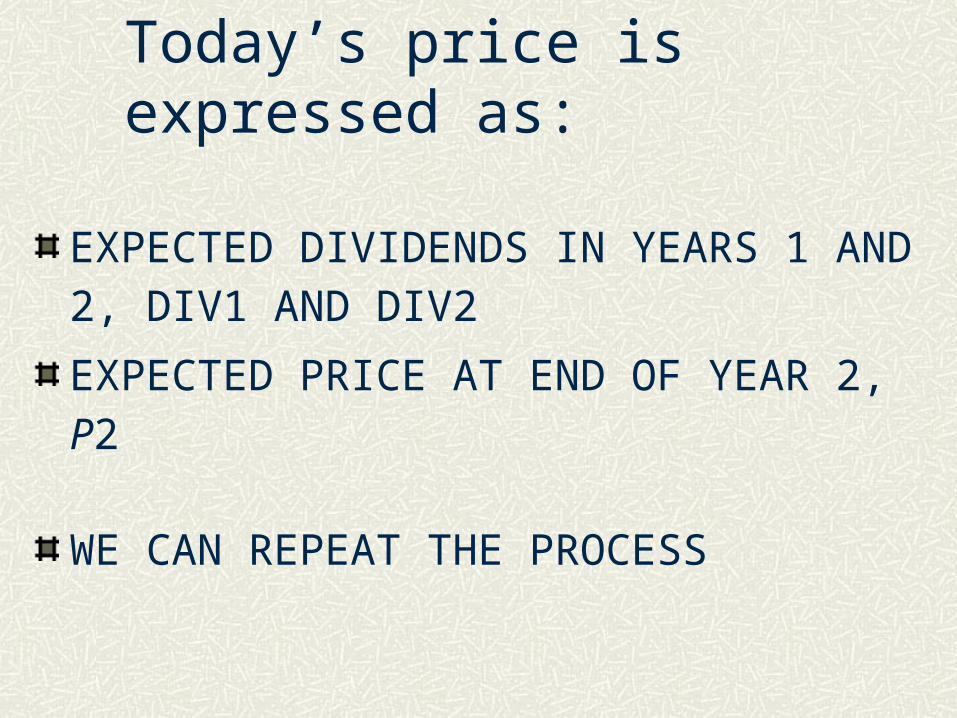
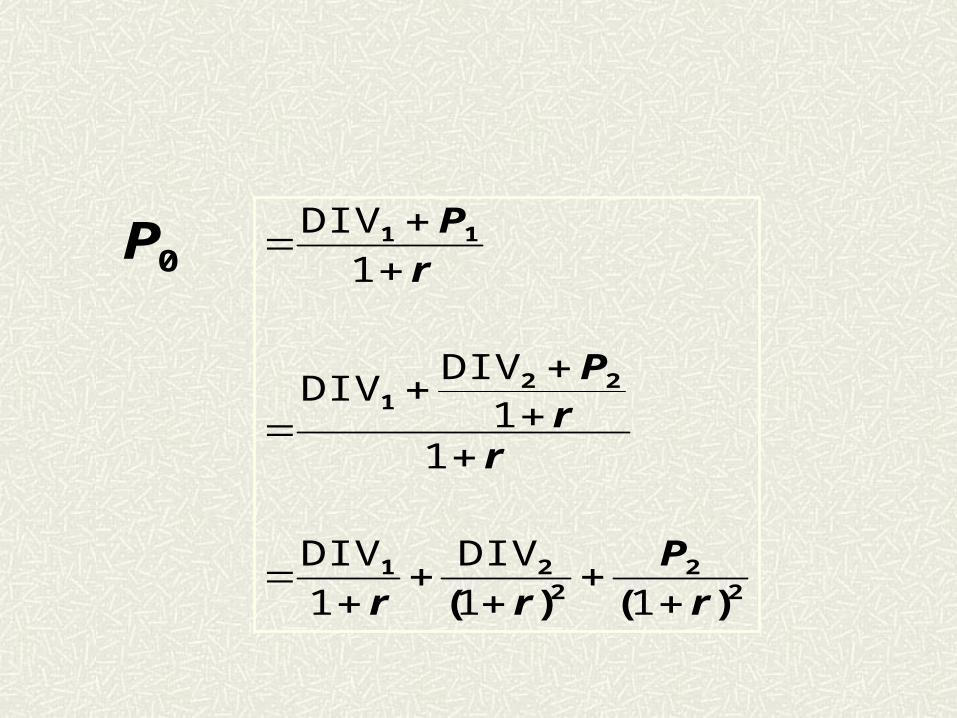
EXPECTED DIVIDENDS IN YEARS 1 AND 2, DIV1 AND DIV2
EXPECTED PRICE AT END OF YEAR 2, P2
WE CAN REPEAT THE PROCESS
Today’s price is expressed as:
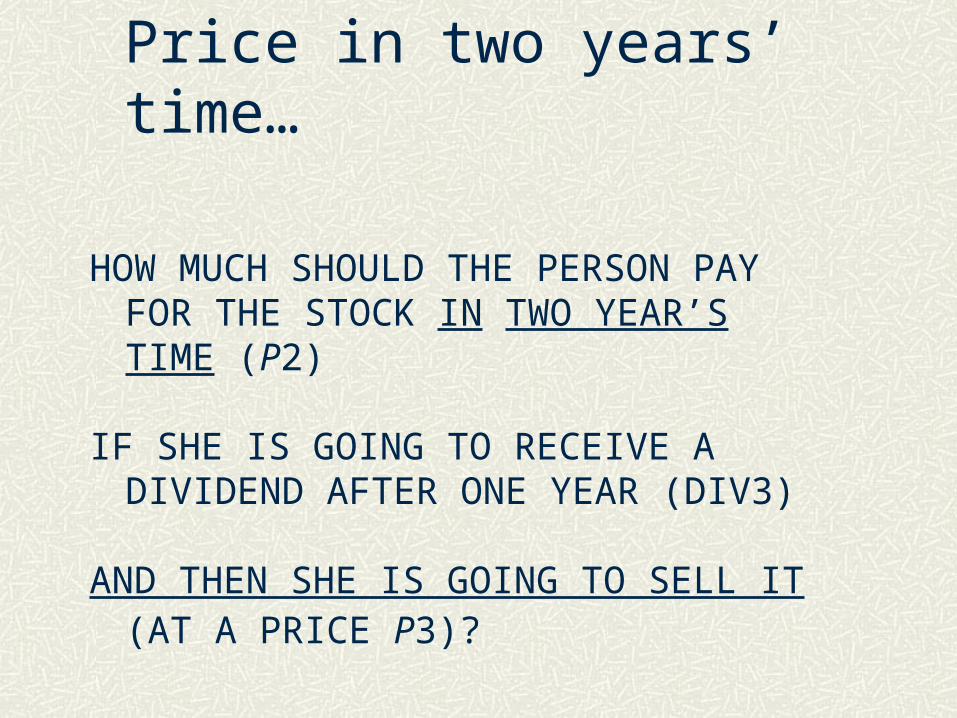
HOW MUCH SHOULD THE PERSON PAY FOR THE STOCK IN TWO YEAR’S TIME (P2)
IF SHE IS GOING TO RECEIVE A DIVIDEND AFTER ONE YEAR (DIV3)
AND THEN SHE IS GOING TO SELL IT (AT A PRICE P3)?
Price in two years’ time…

33
33
221
2
332
1
22
221
)()(DIV
)(DIVDIV
)()(
DIVDIV
)(DIV
)()(DIVDIV
rP
rrr
r1rP
r
rP
rr
1111
11
111P0
Pr r r
P
r01 2
233
H HH
DIV DIV
( )
DIV
( )......
DIV
( )
1 1 1 1
DIVHH(1 r)=
Pr
HH( )1
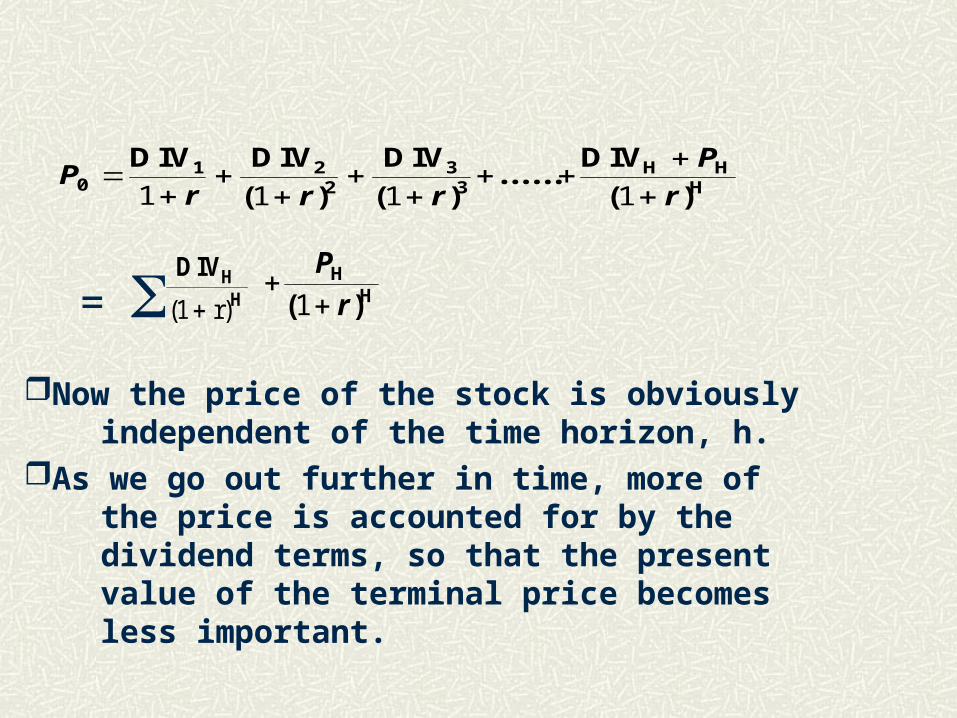
Now the price of the stock is obviously independent of the time horizon, h.As we go out further in time, more of the price is accounted for by the dividend terms, so that the present value of the terminal price becomes less important.

0%
25%
50%
75%
100%
0 1 2 3 4 10 20 50 100
Price Dividends
Horizon period
dividends increase by 10% a yearcapitalization rate is 15%
Present value of
With DCF dividends are higher percentage of theoretical price
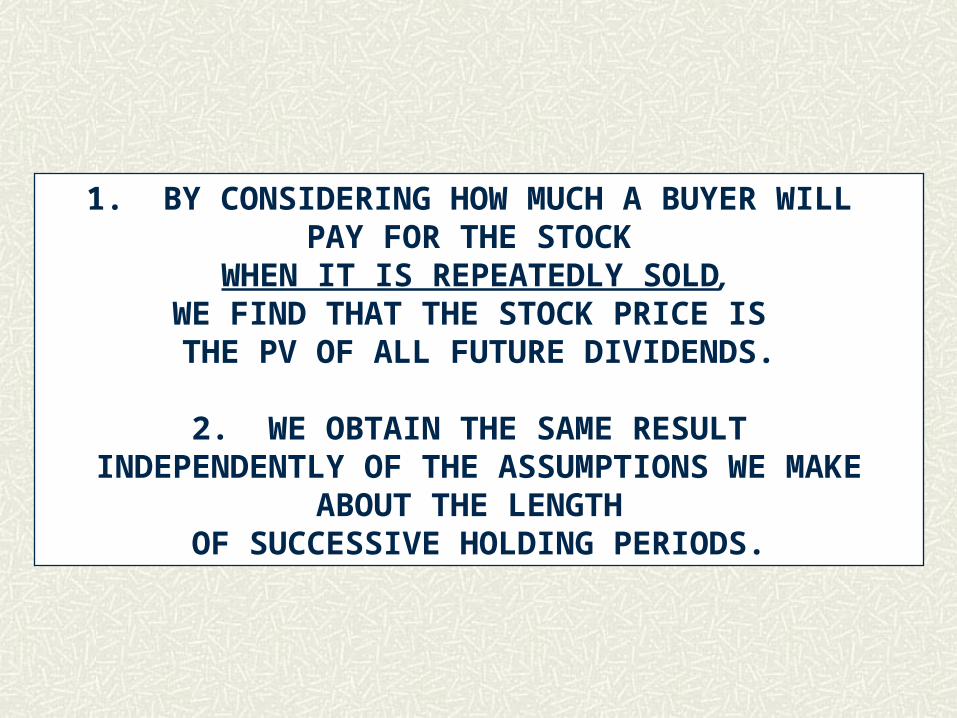
1. BY CONSIDERING HOW MUCH A BUYER WILL PAY FOR THE STOCK
WHEN IT IS REPEATEDLY SOLD, WE FIND THAT THE STOCK PRICE IS THE PV OF ALL FUTURE DIVIDENDS.
2. WE OBTAIN THE SAME RESULT INDEPENDENTLY OF THE ASSUMPTIONS WE MAKE
ABOUT THE LENGTH OF SUCCESSIVE HOLDING PERIODS.
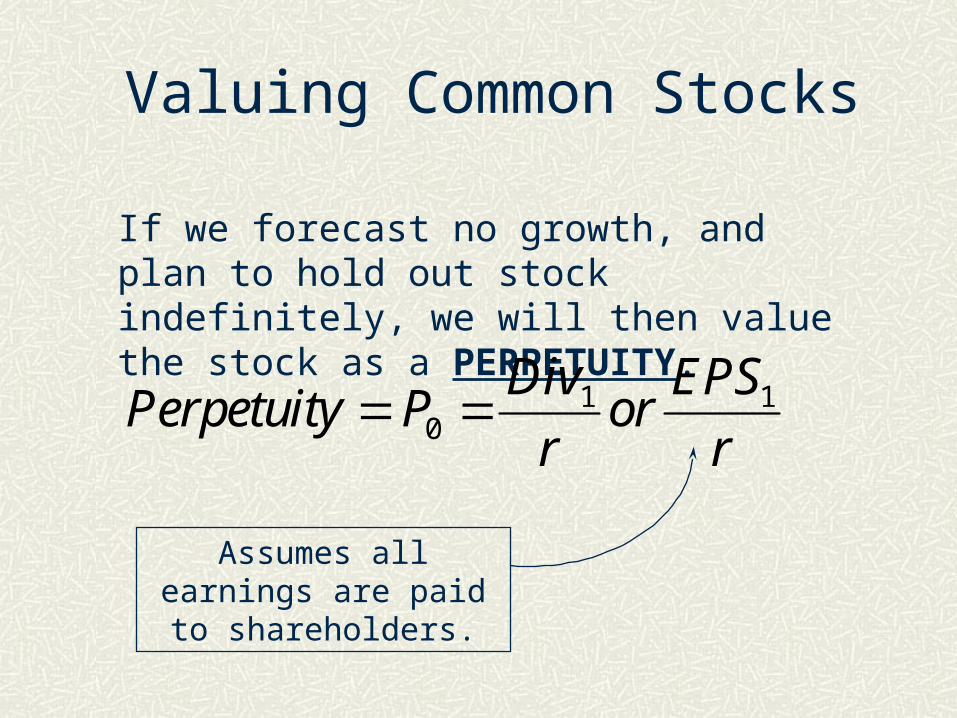
Valuing Common Stocks
If we forecast no growth, and plan to hold out stock indefinitely, we will then value the stock as a PERPETUITY.
Perpetuity PDiv
ror
EPS
r 0
1 1
Assumes all earnings are paid to shareholders.

Valuing Common Stocks
Constant Growth DDM - A version of the dividend growth model in which dividends grow at a constant rate (Gordon Growth Model).
Valuing Common Stocks
If a firm elects to pay a lower dividend, and reinvest the funds, the stock price may increase because future dividends may be higher.
Payout Ratio - Fraction of earnings paid out as dividends
Plowback Ratio - Fraction of earnings retained by the firm.
Valuing Common Stocks
Growth can be derived from applying the return on equity to the percentage of earnings plowed back into operations.
g = return on equity X plowback ratio“g” can also be estimated from historical
growth rates in:dividendseps (earnings per share)
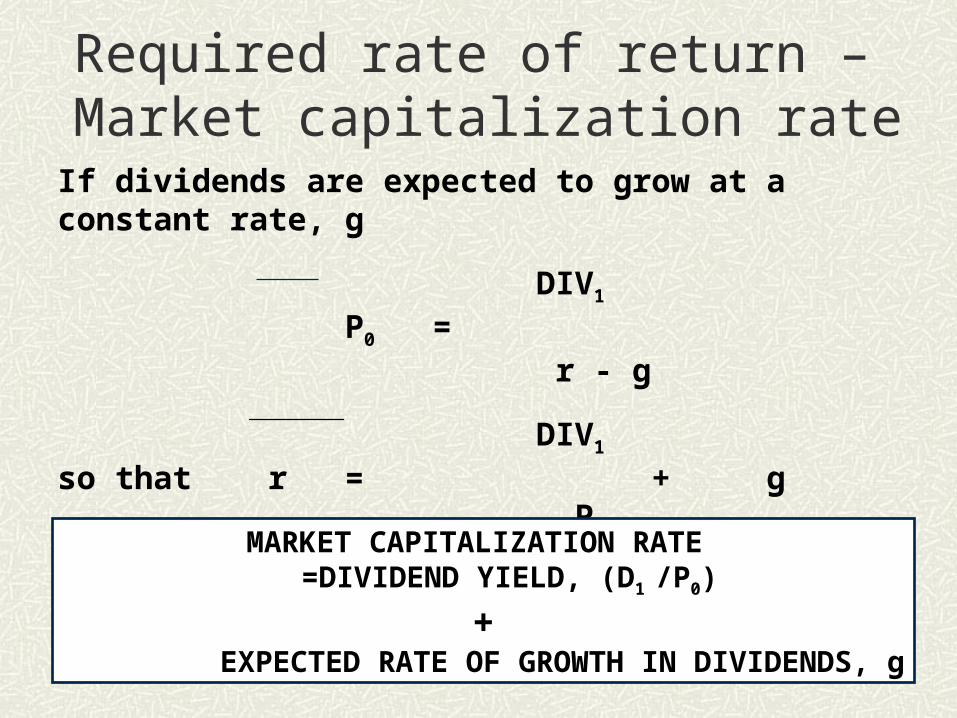
If dividends are expected to grow at a constant rate, g
DIV1
P0 = r - g
DIV1
so that r = + g P0MARKET CAPITALIZATION RATE
=DIVIDEND YIELD, (D1 /P0)
+ EXPECTED RATE OF GROWTH IN DIVIDENDS, g
Required rate of return –Market capitalization rate
Valuing Common Stocks
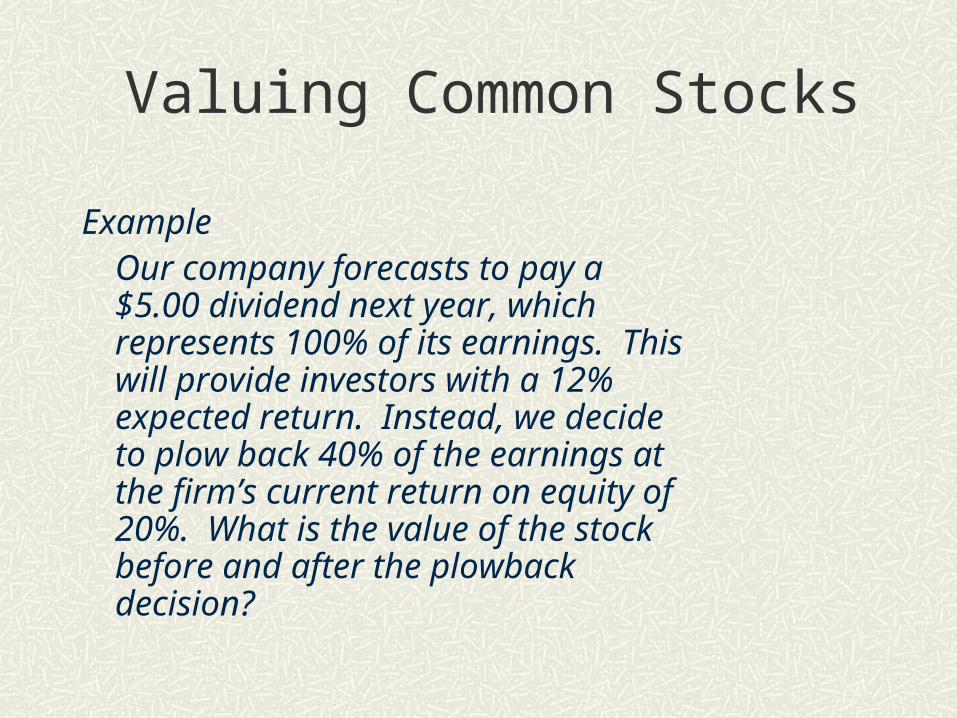
ExampleOur company forecasts to pay a $5.00 dividend next year, which represents 100% of its earnings. This will provide investors with a 12% expected return. Instead, we decide to plow back 40% of the earnings at the firm’s current return on equity of 20%. What is the value of the stock before and after the plowback decision?
Valuing Common Stocks
Example
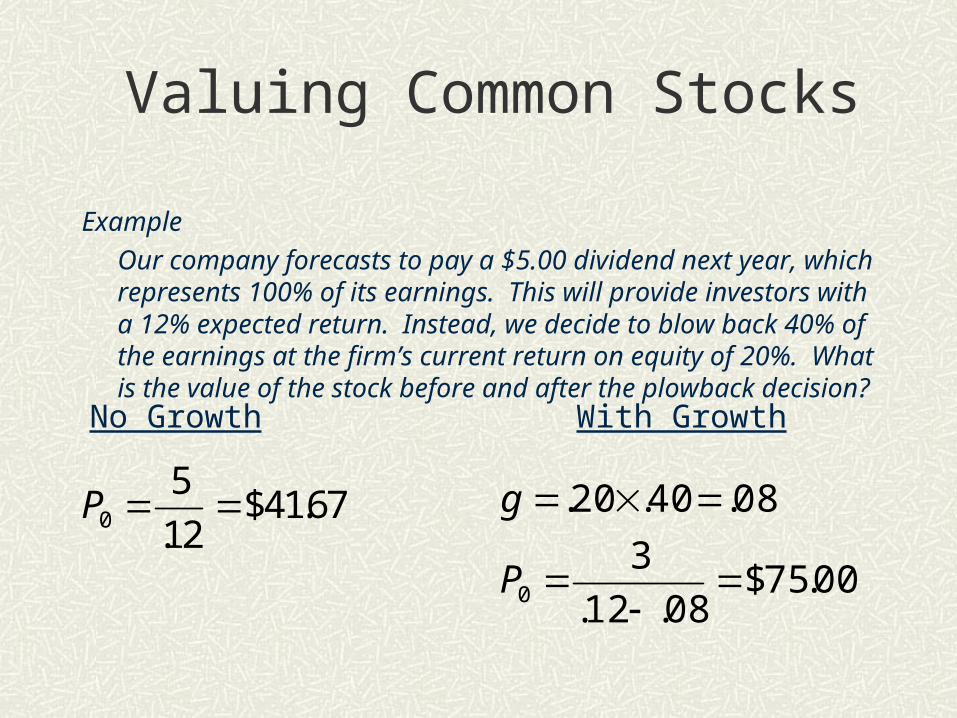
Our company forecasts to pay a $5.00 dividend next year, which represents 100% of its earnings. This will provide investors with a 12% expected return. Instead, we decide to blow back 40% of the earnings at the firm’s current return on equity of 20%. What is the value of the stock before and after the plowback decision?
P0
5
1267
.$41.
No Growth With Growth
00.75$08.12.
3
08.40.20.
0
P
g
Valuing Common Stocks
Example - continued
If the company did not plowback some earnings, the stock price would remain at $41.67. With the plowback, the price rose to $75.00.
The difference between these two numbers (75.00-41.67=33.33) is called the Present Value of Growth Opportunities (PVGO).
Valuing Common Stocks
Present Value of Growth Opportunities (PVGO) - Net present value of a firm’s future investments.
Sustainable Growth Rate - Steady rate at which a firm can grow: plowback ratio X return on equity.
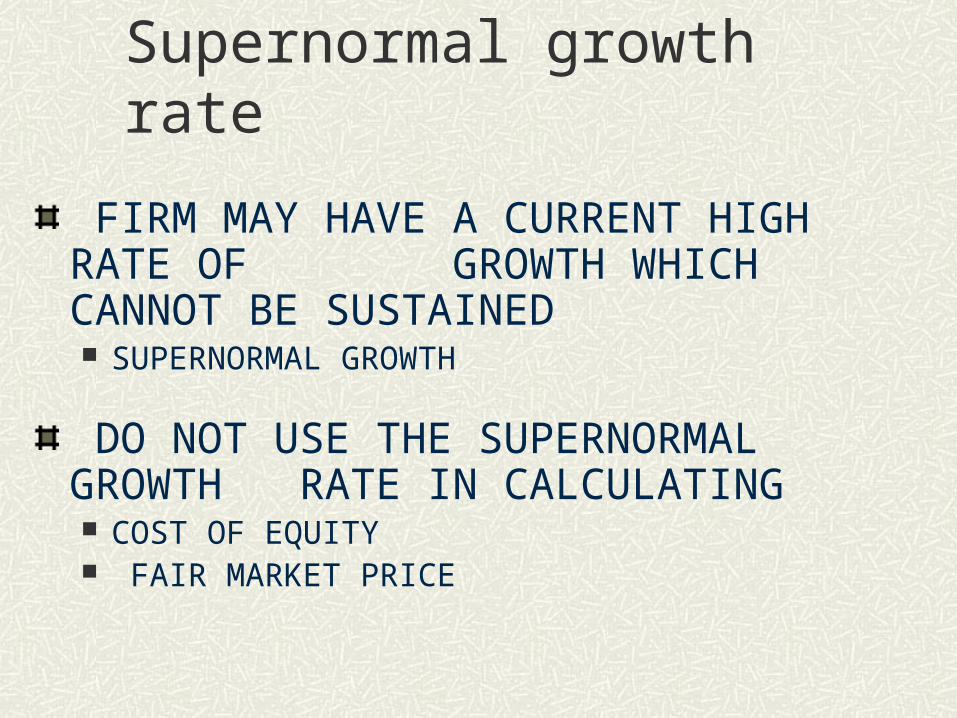
FIRM MAY HAVE A CURRENT HIGH RATE OF GROWTH WHICH CANNOT BE SUSTAINED SUPERNORMAL GROWTH
DO NOT USE THE SUPERNORMAL GROWTH RATE IN CALCULATING COST OF EQUITY FAIR MARKET PRICE
Supernormal growth rate
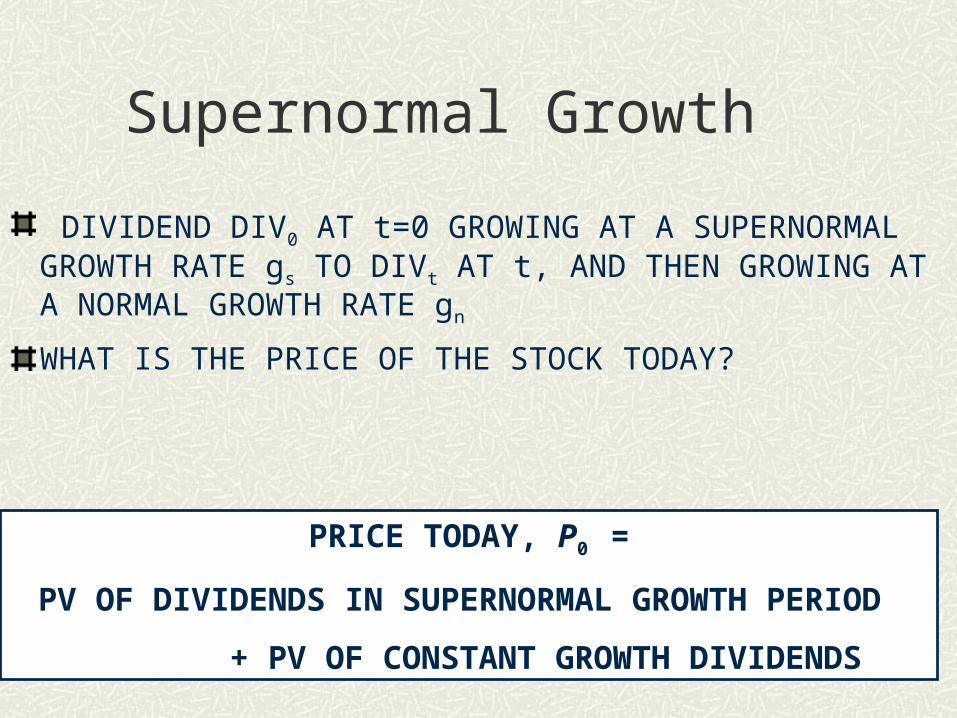
DIVIDEND DIV0 AT t=0 GROWING AT A SUPERNORMAL GROWTH RATE gs TO DIVt AT t, AND THEN GROWING AT A NORMAL GROWTH RATE gn
WHAT IS THE PRICE OF THE STOCK TODAY?
PRICE TODAY, P0 =
PV OF DIVIDENDS IN SUPERNORMAL GROWTH PERIOD
+ PV OF CONSTANT GROWTH DIVIDENDS
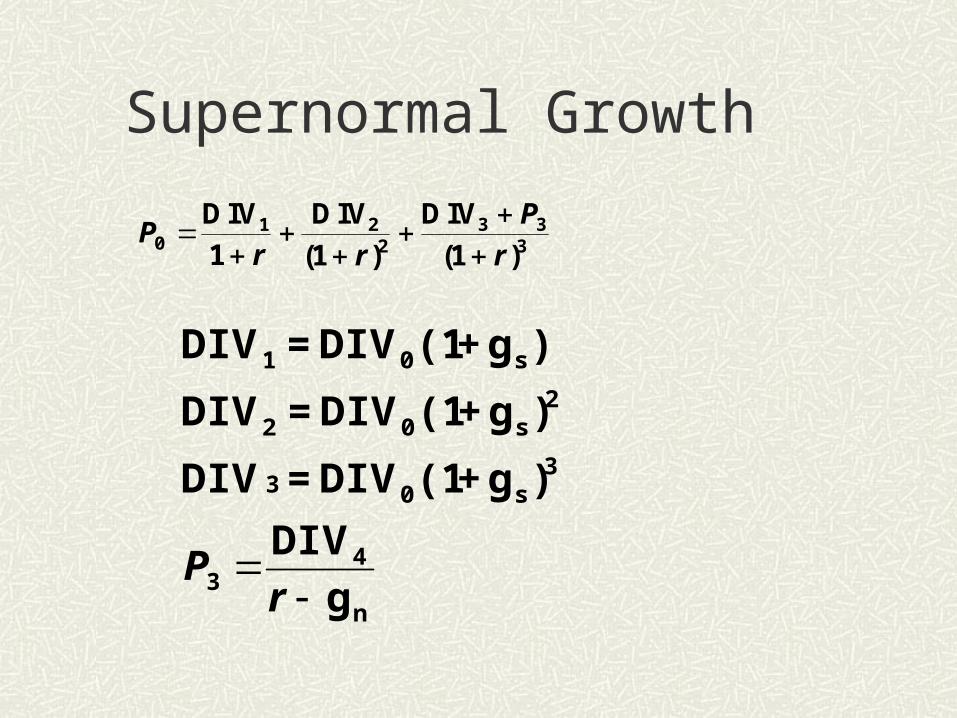
Supernormal Growth
Pr r
P
r01 2
23 3
3
DIV1
DIV
(1 )
DIV
(1 )
n
43
3s03
2s02
s01
gDIV
)g+(1DIV=DIV
)g+(1DIV=DIV
)g+(1DIV=DIV
r
P
Supernormal Growth
INCOME V.S. GROWTH STOCKS
Investors in utility stocks expect dividend income. Hence, a high payout ratio of about 40%-50% is normal.
Technology stocks can have zero payout ratio.
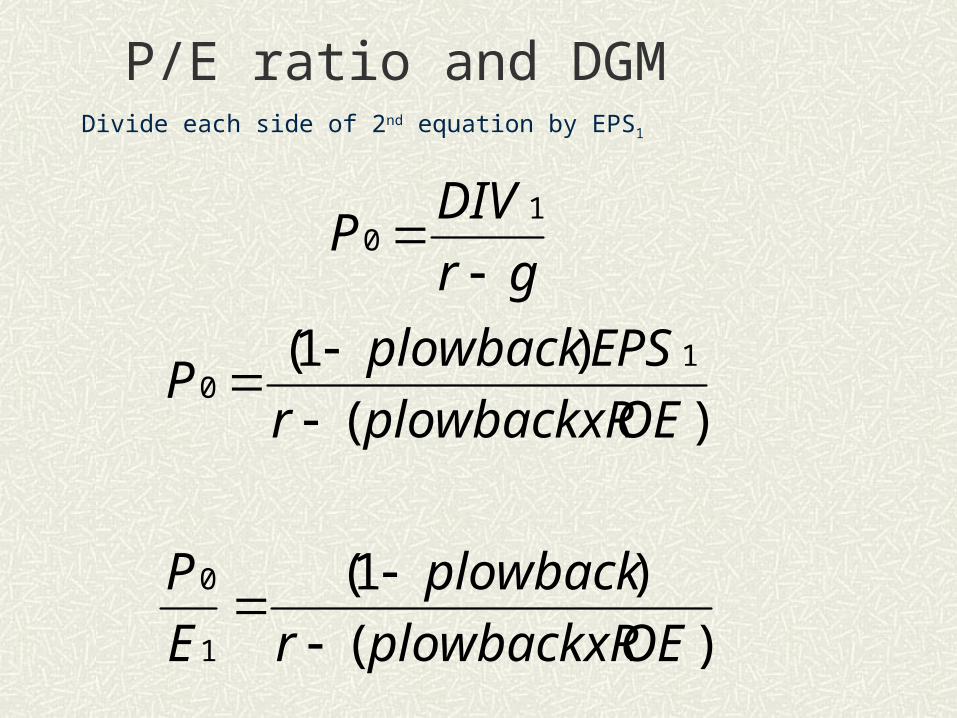
P/E ratio and DGMDivide each side of 2nd equation by EPS1
)(
)1(
)(
)1(
1
0
10
10
OEplowbackxRr
plowback
E
P
OEplowbackxRr
EPSplowbackP
gr
DIVP
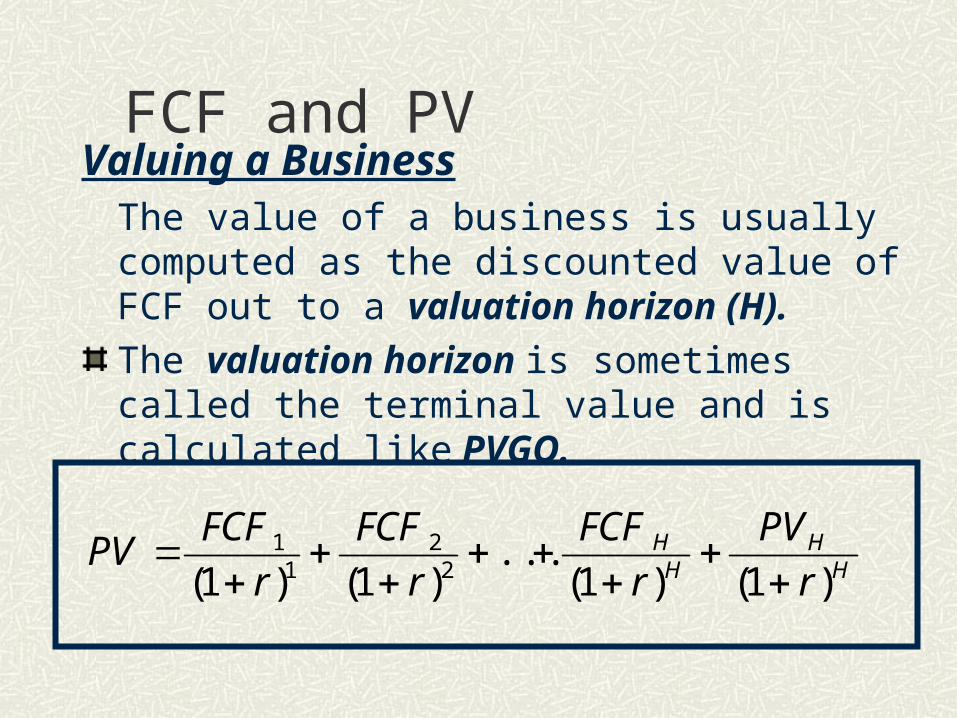
FCF and PVValuing a Business
The value of a business is usually computed as the discounted value of FCF out to a valuation horizon (H).
The valuation horizon is sometimes called the terminal value and is calculated like PVGO.
HH
HH
r
PV
r
FCF
r
FCF
r
FCFPV
)1()1(...
)1()1( 22
11
FCF and PV
Free Cash Flows (FCF) should be the theoretical basis for all PV calculations.FCF is a more accurate measurement of PV than either Div or EPS.The market price does not always reflect the PV of FCF.When valuing a business for purchase, always use FCF.
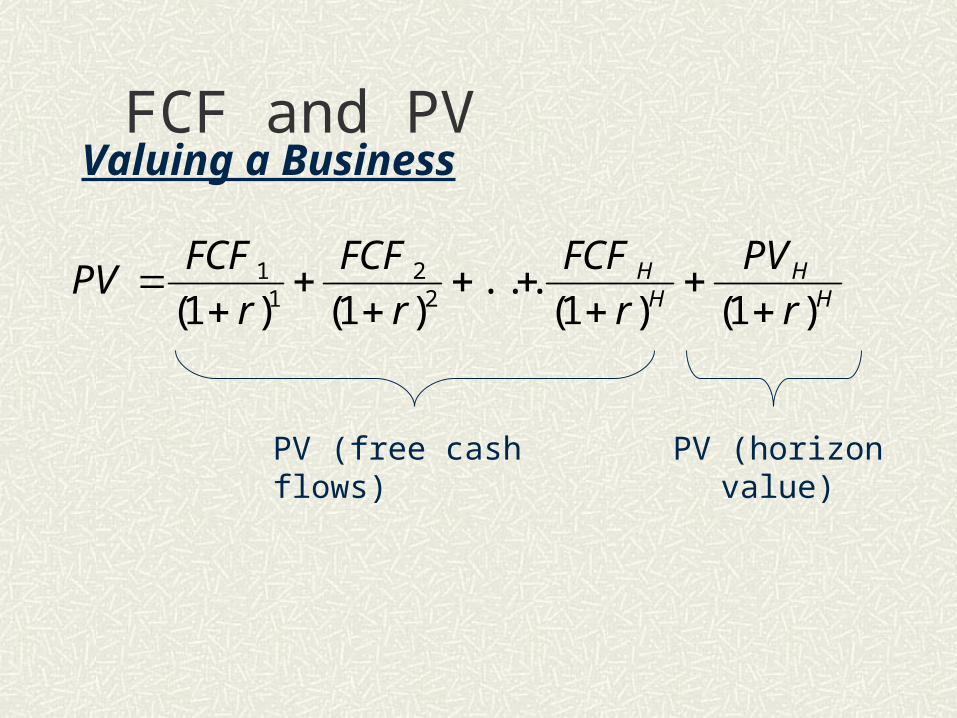
FCF and PVValuing a Business
HH
HH
r
PV
r
FCF
r
FCF
r
FCFPV
)1()1(...
)1()1( 22
11
PV (free cash flows) PV (horizon value)
FCF and PV
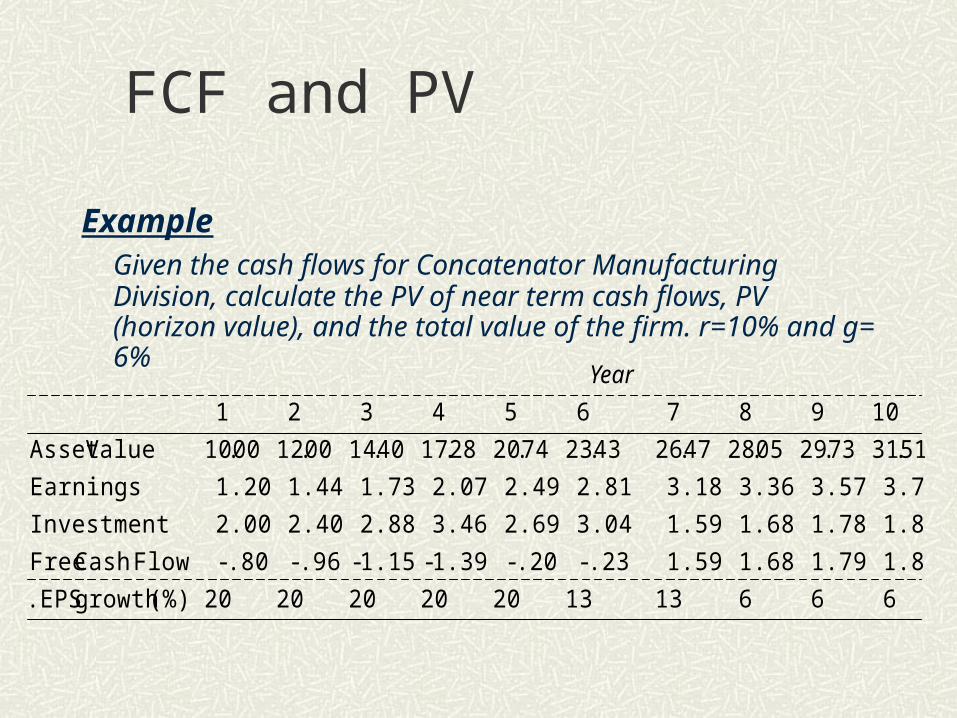
ExampleGiven the cash flows for Concatenator Manufacturing Division, calculate the PV of near term cash flows, PV (horizon value), and the total value of the firm. r=10% and g= 6%
66613132020202020(%) growth .EPS
1.891.791.681.59.23-.20-1.39-1.15-.96-.80- FlowCash Free
1.891.781.681.593.042.693.462.882.402.00Investment
3.783.573.363.182.812.492.071.731.441.20Earnings
51.3173.2905.2847.2643.2374.2028.1740.1400.1200.10ValueAsset
10987654321
Year
FCF and PV
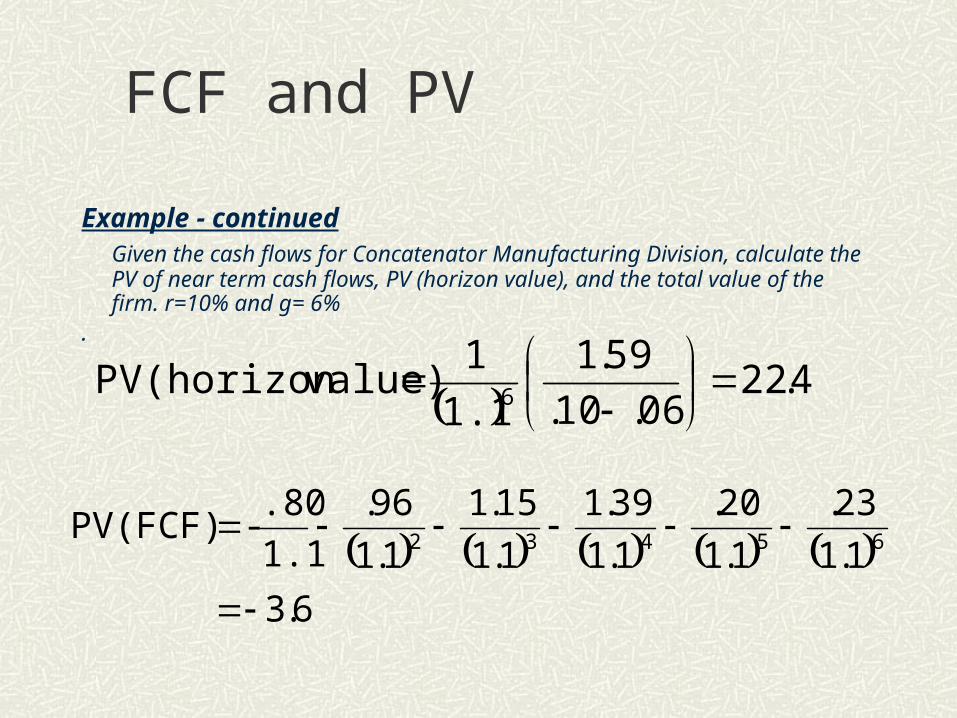
Example - continuedGiven the cash flows for Concatenator Manufacturing Division, calculate the PV of near term cash flows, PV (horizon value), and the total value of the firm. r=10% and g= 6%
.
4.2206.10.
59.1
1.1
1 value)PV(horizon 6
6.3
1.1
23.
1.1
20.
1.1
39.1
1.1
15.1
1.1
96.
1.1
.80-PV(FCF) 65432
FCF and PV
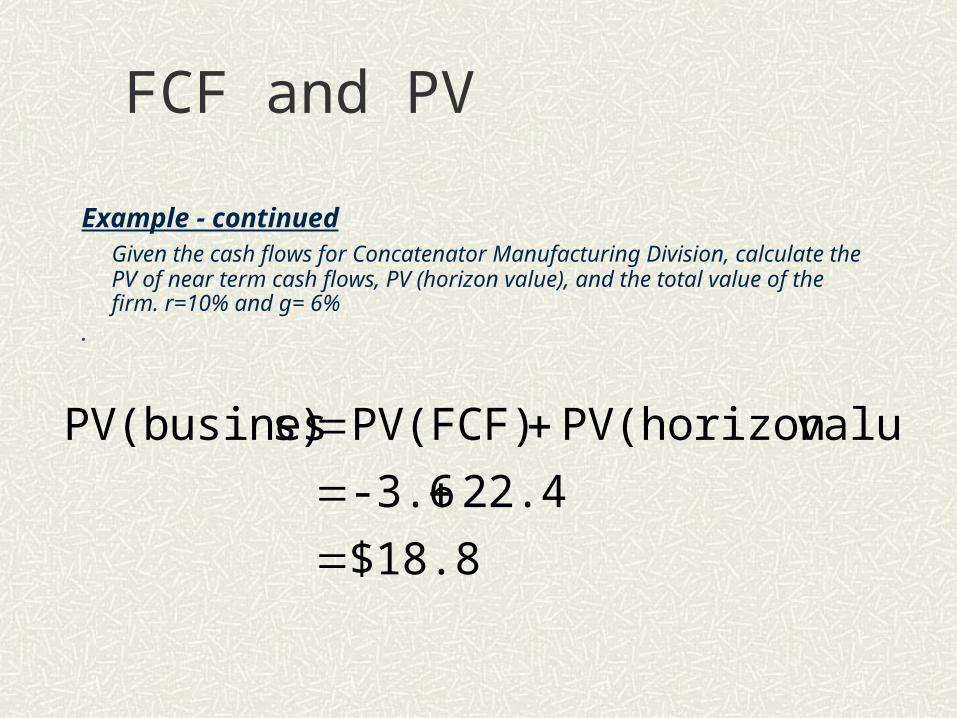
Example - continuedGiven the cash flows for Concatenator Manufacturing Division, calculate the PV of near term cash flows, PV (horizon value), and the total value of the firm. r=10% and g= 6%
.
$18.8
22.4-3.6
value)PV(horizonPV(FCF)s)PV(busines
Company Value
Enterprise Value
Equity Value
Equity Value = Enterprise Value – Debt