corporate finance lecture 8. announcements 2nd quiz 2nd quiz –opens at midnight tonight –valid...
Post on 21-Dec-2015
213 views
TRANSCRIPT
Corporate FinanceCorporate Finance
Lecture 8Lecture 8

AnnouncementsAnnouncements
2nd quiz2nd quiz– Opens at midnight tonightOpens at midnight tonight– Valid for 48 hoursValid for 48 hours– Closes at midnight of Thursday Closes at midnight of Thursday
2nd case : Boeing 7E72nd case : Boeing 7E7– Questions will be posted on May 8Questions will be posted on May 8– Delivery deadline: May 13Delivery deadline: May 13– Discussion: May 15Discussion: May 15
Topics coveredTopics covered
MM MM proposition without taxproposition without tax MM proposition with taxMM proposition with tax Cost of financial distressCost of financial distress
– Direct costDirect cost– Indirect costIndirect cost
Reducing cost of debtReducing cost of debt Integration of tax benefit and Integration of tax benefit and
financial distress cost of debtfinancial distress cost of debt
Modigliani and Miller Modigliani and Miller (MM) Proposition (no (MM) Proposition (no taxes)taxes) Proposition IProposition I
– Firm value is not affected by Firm value is not affected by leverageleverage
VVLL = = VVUU
Capital structure does not change Capital structure does not change firm valuefirm value
Assumptions of the Assumptions of the Modigliani-Miller ModelModigliani-Miller Model Homogeneous ExpectationsHomogeneous Expectations Homogeneous Business Risk ClassesHomogeneous Business Risk Classes Perpetual Cash FlowsPerpetual Cash Flows Perfect Capital Markets:Perfect Capital Markets:
– Perfect competitionPerfect competition– Firms and investors can borrow/lend at the Firms and investors can borrow/lend at the
same ratesame rate– Equal access to all relevant informationEqual access to all relevant information– No transaction costsNo transaction costs– No taxesNo taxes
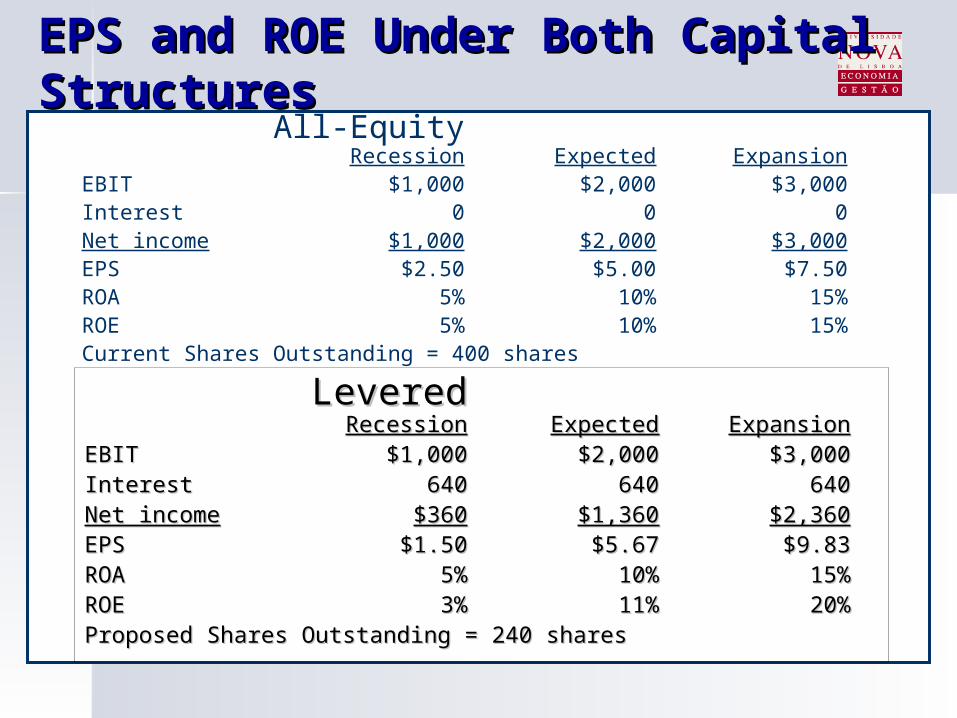
EPS and ROE Under Both Capital EPS and ROE Under Both Capital StructuresStructures
LeveredLeveredRecessionRecession ExpectedExpected ExpansionExpansion
EBITEBIT $1,000$1,000 $2,000$2,000 $3,000$3,000InterestInterest 640640 640640 640640Net incomeNet income $360$360 $1,360$1,360 $2,360$2,360EPSEPS $1.50$1.50 $5.67$5.67 $9.83$9.83ROAROA 5%5% 10%10% 15%15%ROEROE 3%3% 11%11% 20%20%Proposed Shares Outstanding = 240 sharesProposed Shares Outstanding = 240 shares
All-EquityRecession Expected Expansion
EBIT $1,000 $2,000 $3,000Interest 0 0 0Net income $1,000 $2,000 $3,000EPS $2.50 $5.00 $7.50ROA 5% 10% 15%ROE 5% 10% 15%Current Shares Outstanding = 400 shares
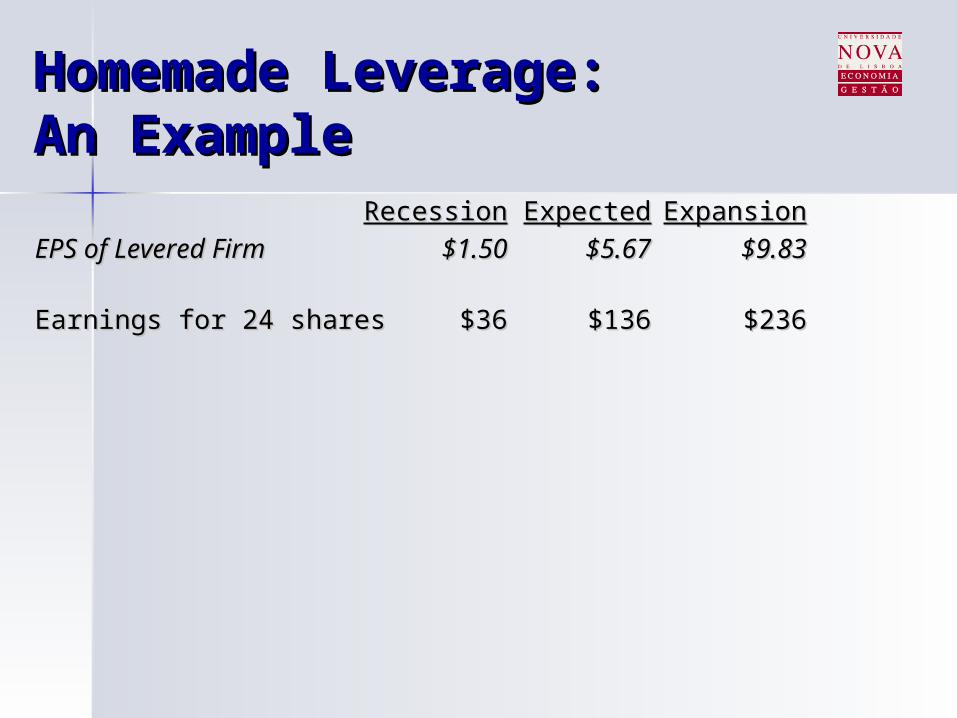
Homemade Leverage:Homemade Leverage:An ExampleAn Example
RecessionRecession ExpectedExpected ExpansionExpansion
EPS of Levered FirmEPS of Levered Firm $1.50$1.50 $5.67$5.67 $9.83$9.83
Earnings for 24 sharesEarnings for 24 shares $36$36 $136$136 $236$236
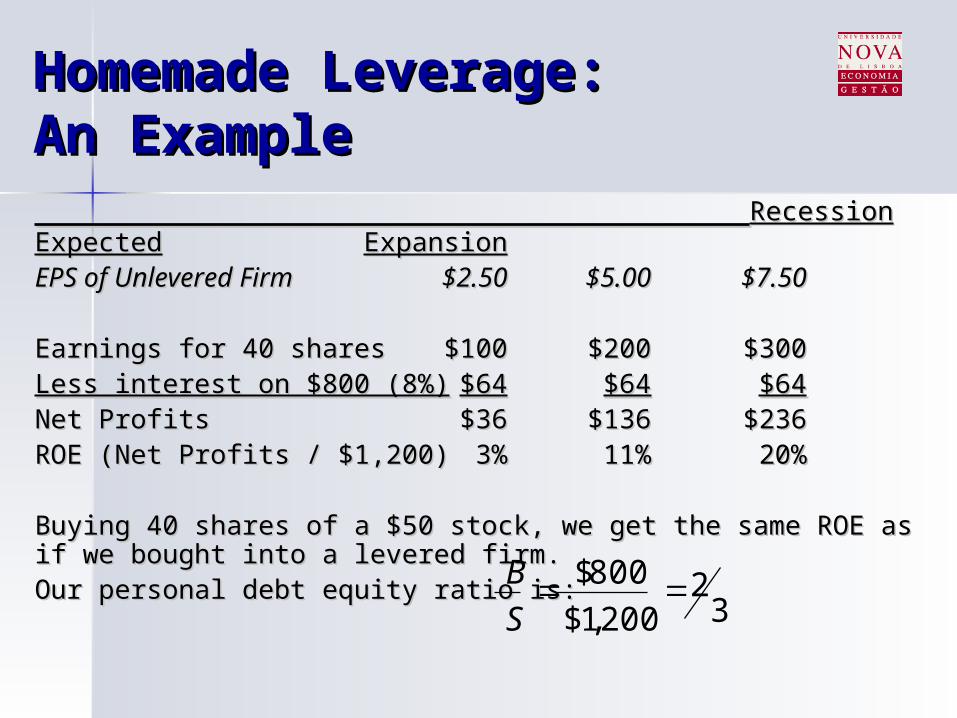
Homemade Leverage:Homemade Leverage:An ExampleAn Example RecessionRecessionExpectedExpectedExpansionExpansion
EPS of Unlevered FirmEPS of Unlevered Firm $2.50$2.50 $5.00$5.00 $7.50$7.50
Earnings for 40 sharesEarnings for 40 shares $100$100 $200$200 $300$300Less interest on $800 (8%)Less interest on $800 (8%) $64$64 $64$64 $64$64Net ProfitsNet Profits $36$36 $136$136 $236$236ROE (Net Profits / $1,200)ROE (Net Profits / $1,200) 3%3% 11%11% 20%20%
Buying 40 shares of a $50 stock, we get the same ROE as if we Buying 40 shares of a $50 stock, we get the same ROE as if we bought into a levered firm.bought into a levered firm.Our personal debt equity ratio is:Our personal debt equity ratio is:
32
200,1$
800$ S
B
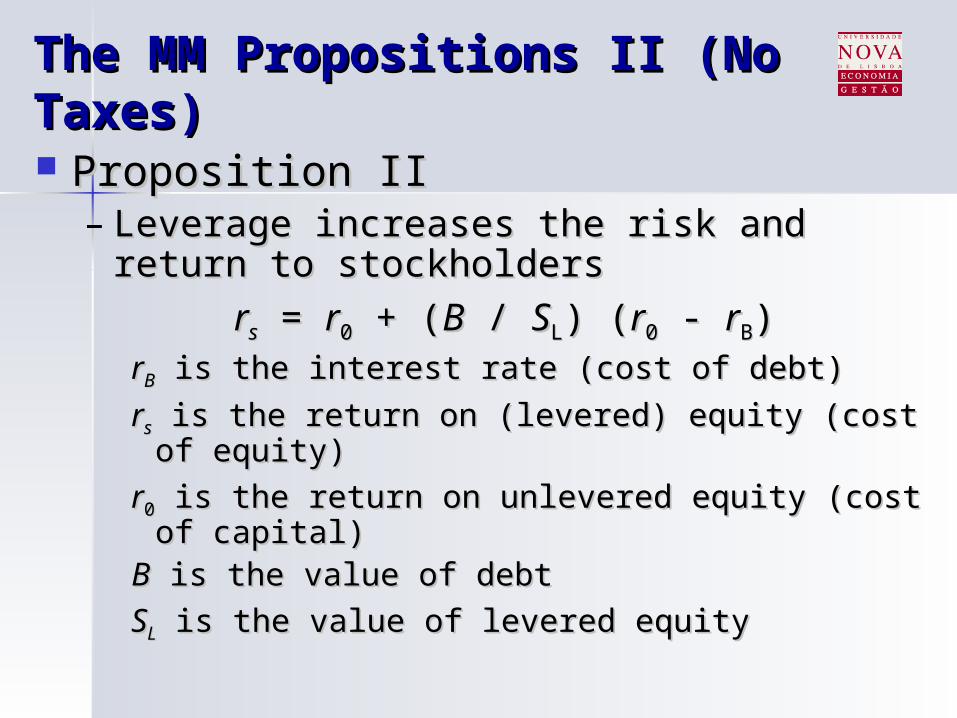
The MM Propositions II (No The MM Propositions II (No Taxes)Taxes) Proposition IIProposition II
– Leverage increases the risk and return to Leverage increases the risk and return to stockholdersstockholders
rrss = = rr00 + ( + (BB / / SSLL) () (rr00 - - rrBB))rrBB is the interest rate (cost of debt) is the interest rate (cost of debt)
rrss is the return on (levered) equity (cost of is the return on (levered) equity (cost of equity)equity)
rr00 is the return on unlevered equity (cost of is the return on unlevered equity (cost of capital)capital)
BB is the value of debt is the value of debt
SSLL is the value of levered equity is the value of levered equity
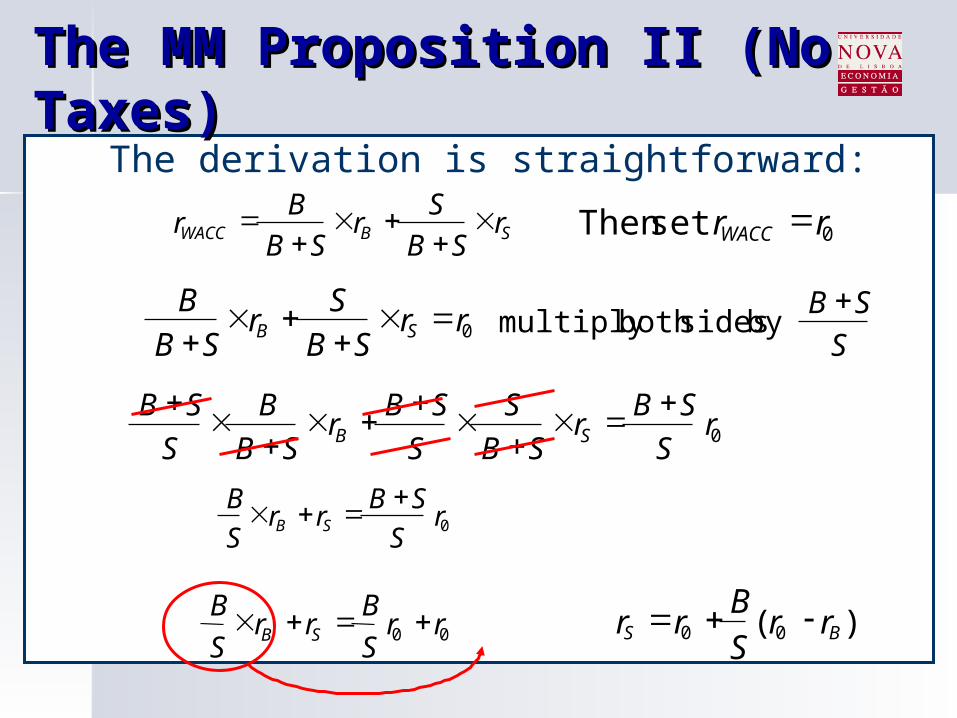
The MM Proposition II (No The MM Proposition II (No Taxes)Taxes)
The derivation is straightforward:
SBWACC rSB
Sr
SB
Br
0set Then rrWACC
0rrSB
Sr
SB
BSB
S
SB by sidesboth multiply
0rS
SBr
SB
S
S
SBr
SB
B
S
SBSB
0rS
SBrr
S
BSB
00 rrS
Brr
S
BSB
)( 00 BS rrS
Brr
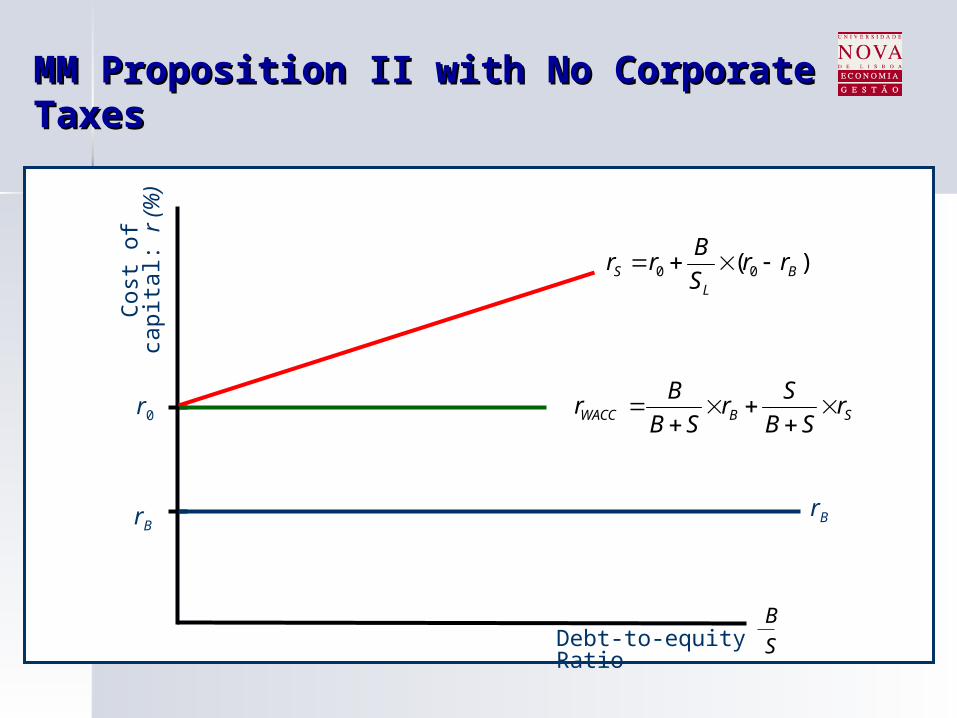
MM Proposition II with No Corporate MM Proposition II with No Corporate TaxesTaxes
Debt-to-equity Ratio
Cos
t of
capi
tal:
r (%
)
r0
rB
SBWACC rSB
Sr
SB
Br
)( 00 BL
S rrS
Brr
rB
S
B
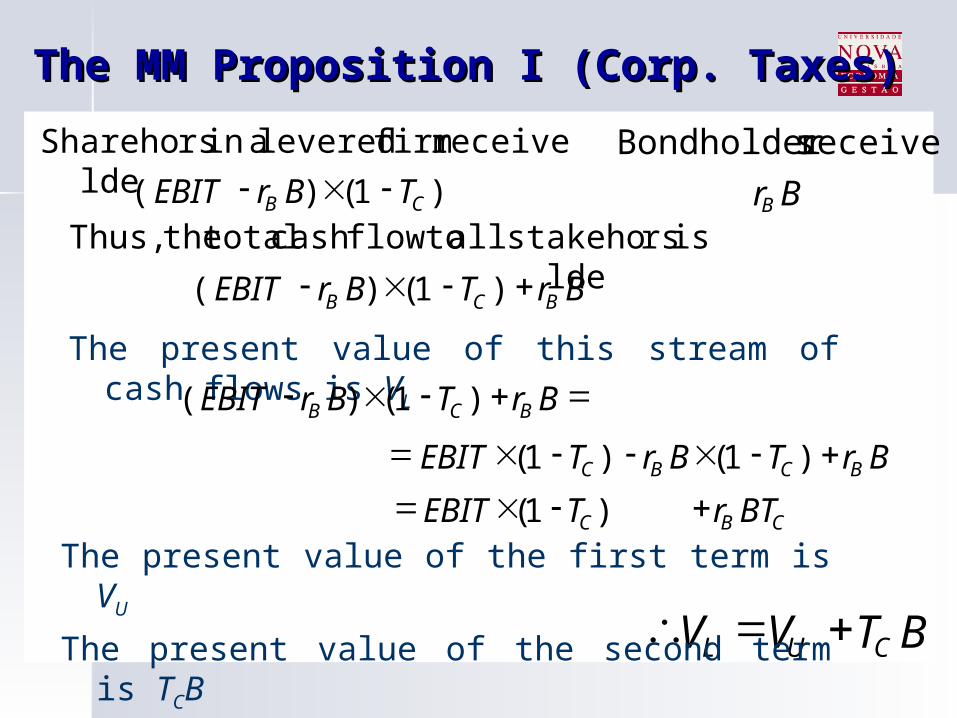
The MM Proposition I (Corp. Taxes)The MM Proposition I (Corp. Taxes)
BTVV CUL
)1()(
receive firm levered ain rsShareholde
CB TBrEBIT BrB
receive sBondholder
BrTBrEBIT BCB )1()(
is rsstakeholde all toflowcash total theThus,
The present value of this stream of cash flows is VL BrTBrEBIT BCB )1()(
The present value of the first term is VU
The present value of the second term is TCB
BrTBrTEBIT BCBC )1()1(
BTrTEBIT CBC )1(
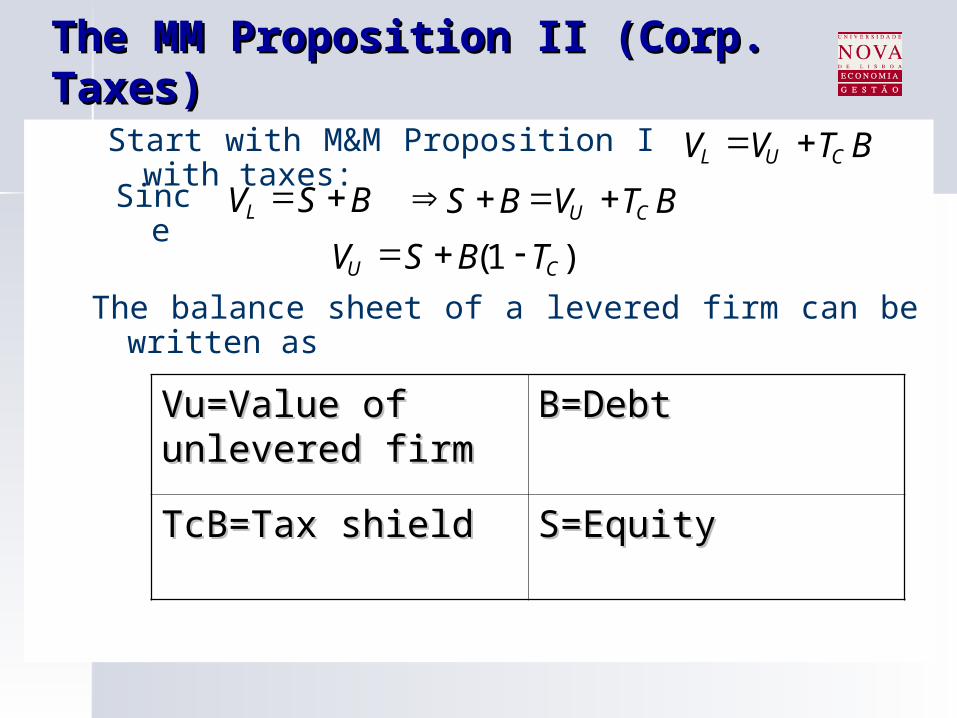
The MM Proposition II (Corp. The MM Proposition II (Corp. Taxes)Taxes)
Start with M&M Proposition I with taxes: BTVV CUL
Since BSVL
The balance sheet of a levered firm can be written as
BTVBS CU
)1( CU TBSV
Vu=Value of Vu=Value of unlevered firmunlevered firm
B=DebtB=Debt
TcB=Tax shieldTcB=Tax shield S=EquityS=Equity
The MM Proposition II (Corp. The MM Proposition II (Corp. Taxes)Taxes)
)()1( 00 BCS rrTS
Brr
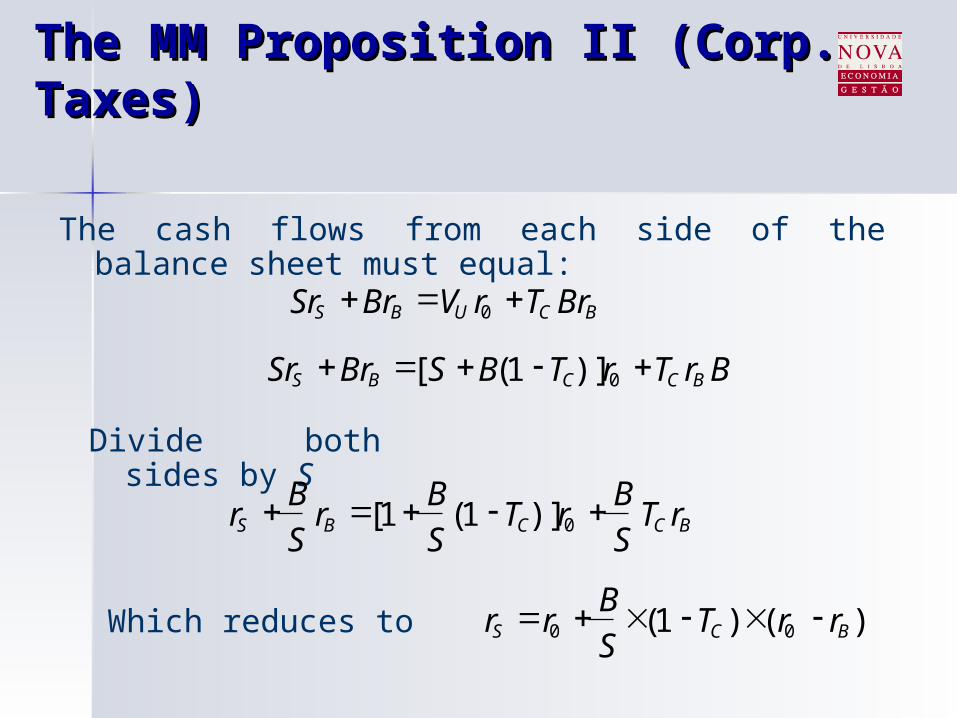
The cash flows from each side of the balance sheet must equal:
BCUBS BrTrVBrSr 0
BrTrTBSBrSr BCCBS 0)]1([
Divide both sides by S
BCCBS rTS
BrT
S
Br
S
Br 0)]1(1[
Which reduces to
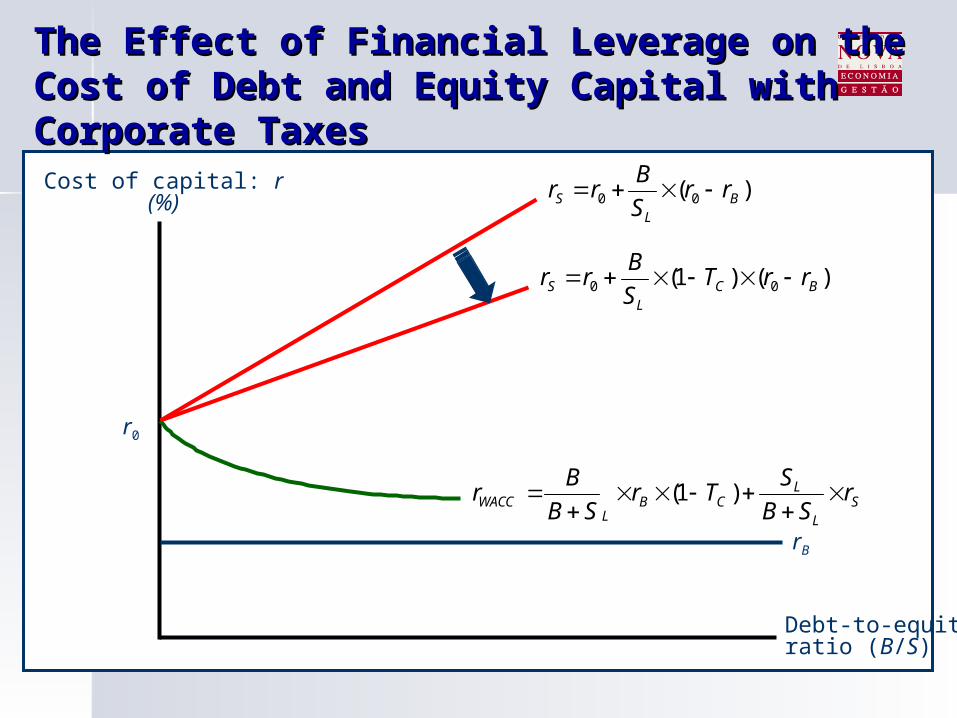
The Effect of Financial Leverage on the The Effect of Financial Leverage on the Cost of Debt and Equity Capital with Cost of Debt and Equity Capital with Corporate TaxesCorporate Taxes
Debt-to-equityratio (B/S)
Cost of capital: r(%)
r0
rB
)()1( 00 BCL
S rrTS
Brr
SL
LCB
LWACC r
SB
STr
SB
Br
)1(
)( 00 BL
S rrS
Brr
Total Cash Flow to Investors Under Total Cash Flow to Investors Under Each Capital Structure with Corp. TaxesEach Capital Structure with Corp. Taxes
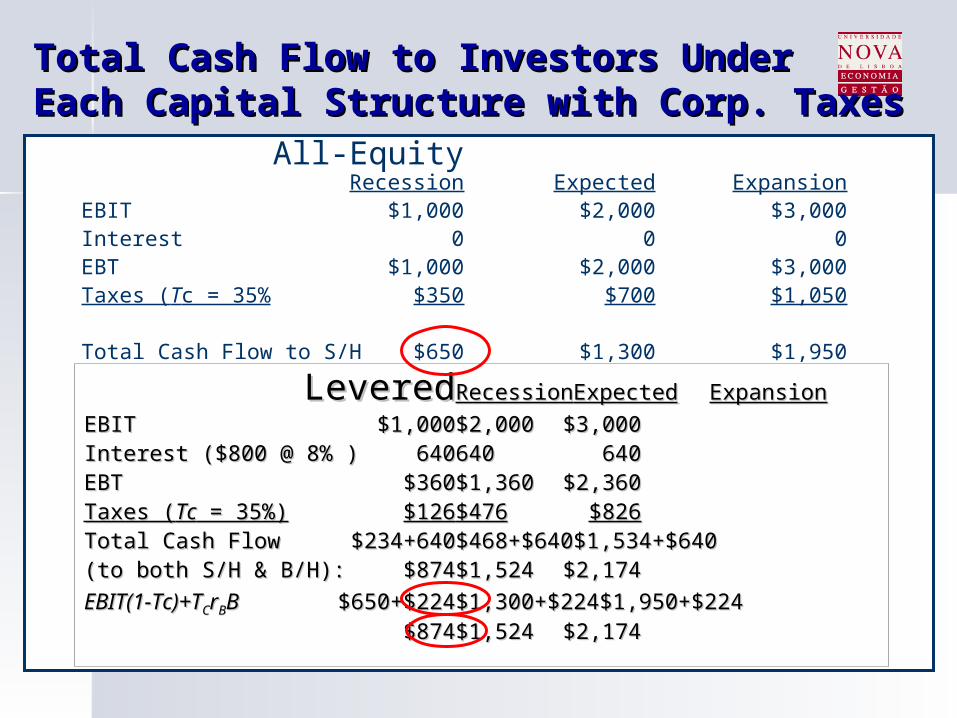
All-EquityRecession Expected Expansion
EBIT $1,000 $2,000 $3,000Interest 0 0 0EBT $1,000 $2,000 $3,000Taxes (Tc = 35% $350 $700 $1,050
Total Cash Flow to S/H $650 $1,300 $1,950
LeveredLeveredRecessionRecession ExpectedExpected ExpansionExpansion
EBITEBIT $1,000$1,000 $2,000$2,000 $3,000$3,000Interest ($800 @ 8% )Interest ($800 @ 8% ) 640640 640640 640640EBTEBT $360$360 $1,360$1,360 $2,360$2,360Taxes (Taxes (TcTc = 35%) = 35%) $126$126 $476$476 $826$826Total Cash Flow Total Cash Flow $234+640$234+640 $468+$640$468+$640 $1,534+$640$1,534+$640(to both S/H & B/H): (to both S/H & B/H): $874$874 $1,524$1,524 $2,174$2,174
EBIT(1-Tc)+TEBIT(1-Tc)+TCCrrBBBB $650+$224$650+$224 $1,300+$224$1,300+$224 $1,950+$224$1,950+$224$874$874 $1,524$1,524 $2,174$2,174
Tax effect of debtTax effect of debt
In a world without taxes, debt does not affect In a world without taxes, debt does not affect firm value.firm value.
When there are corporate taxes, the firm When there are corporate taxes, the firm value is positively related to its debt --Debt value is positively related to its debt --Debt reduces the firm’s tax liabilityreduces the firm’s tax liability
With taxes, the sum of the debt plus the With taxes, the sum of the debt plus the equity of the levered firm is greater than the equity of the levered firm is greater than the equity of the unlevered firm.equity of the unlevered firm.
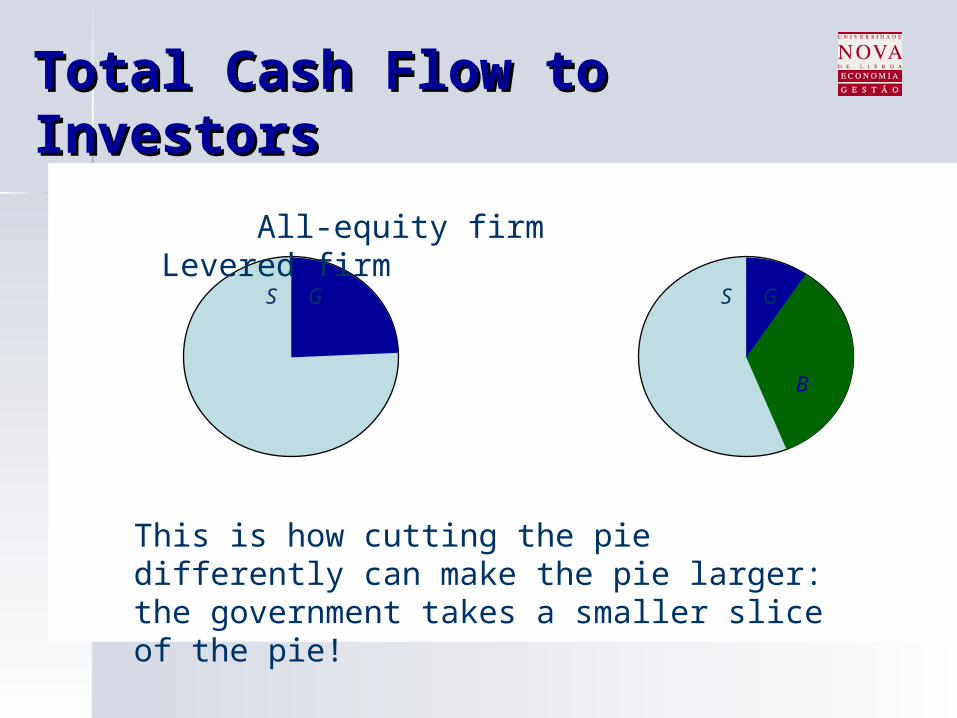
Total Cash Flow to InvestorsTotal Cash Flow to Investors
S G S G
B
All-equity firm Levered firm
This is how cutting the pie differently can make the pie larger: the government takes a smaller slice of the pie!
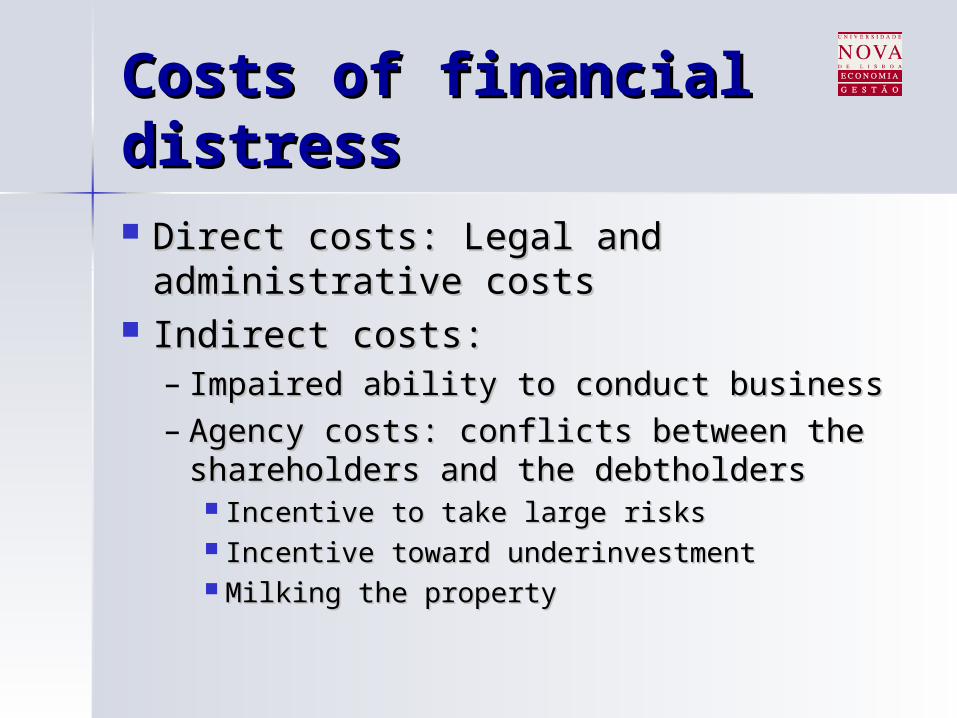
Costs of financial Costs of financial distressdistress Direct costs: Legal and Direct costs: Legal and
administrative costsadministrative costs Indirect costs:Indirect costs:
– Impaired ability to conduct businessImpaired ability to conduct business– Agency costs: conflicts between the Agency costs: conflicts between the
shareholders and the debtholdersshareholders and the debtholders Incentive to take large risksIncentive to take large risks Incentive toward underinvestmentIncentive toward underinvestment Milking the propertyMilking the property
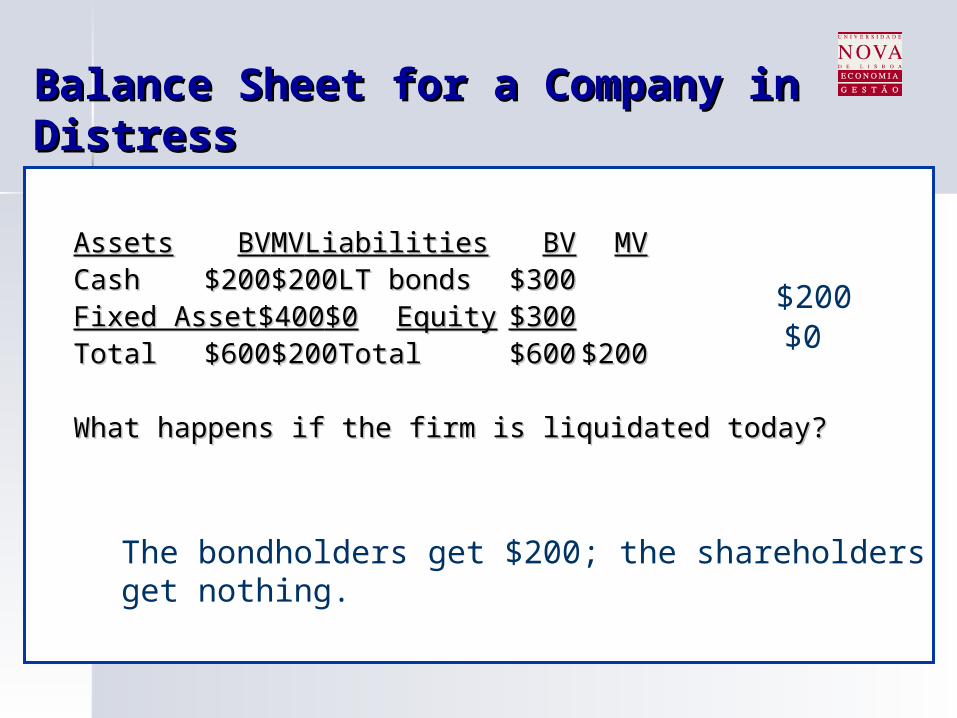
Balance Sheet for a Company in Balance Sheet for a Company in DistressDistress
AssetsAssets BVBV MVMV LiabilitiesLiabilities BVBV MVMVCashCash $200$200$200$200 LT bondsLT bonds$300$300Fixed AssetFixed Asset$400$400$0$0 EquityEquity $300$300TotalTotal $600$600$200$200 TotalTotal $600$600$200$200
What happens if the firm is liquidated today?What happens if the firm is liquidated today?
The bondholders get $200; the shareholders get nothing.
$200$0
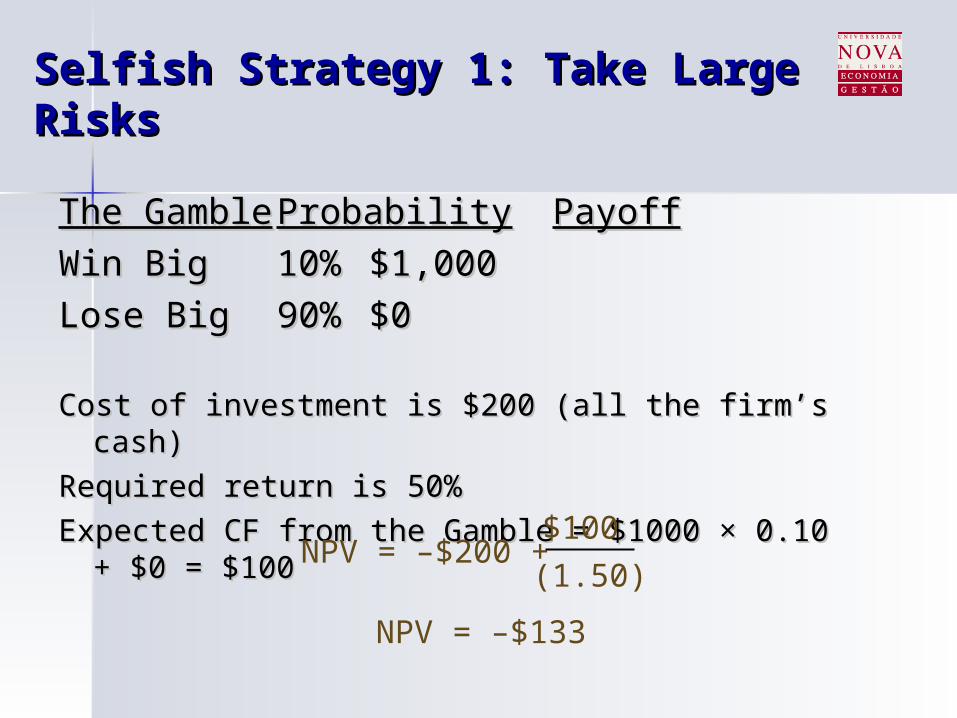
Selfish Strategy 1: Take Large RisksSelfish Strategy 1: Take Large Risks
The GambleThe Gamble ProbabilityProbabilityPayoffPayoff
Win BigWin Big 10%10%$1,000$1,000
Lose BigLose Big 90%90% $0$0
Cost of investment is $200 (all the firm’s cash)Cost of investment is $200 (all the firm’s cash)
Required return is 50%Required return is 50%
Expected CF from the Gamble = $1000 × 0.10 + Expected CF from the Gamble = $1000 × 0.10 + $0 = $100$0 = $100
NPV = –$200 + $100
(1.50)
NPV = –$133
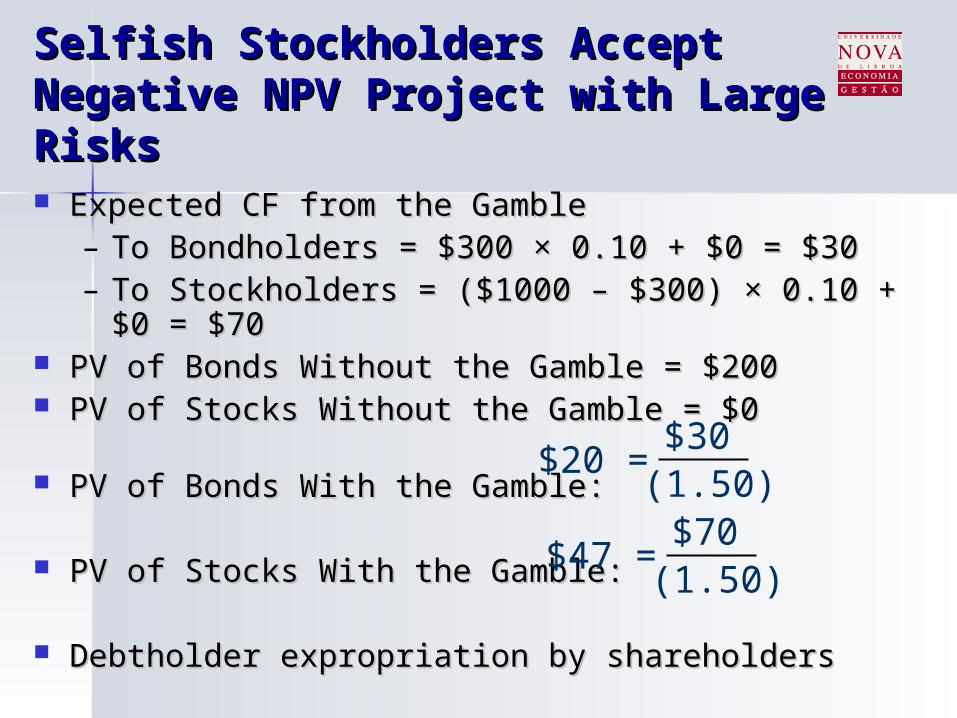
Selfish Stockholders Accept Selfish Stockholders Accept Negative NPV Project with Large Negative NPV Project with Large RisksRisks Expected CF from the GambleExpected CF from the Gamble
– To Bondholders = $300 × 0.10 + $0 = $30To Bondholders = $300 × 0.10 + $0 = $30– To Stockholders = ($1000 – $300) × 0.10 + $0 = To Stockholders = ($1000 – $300) × 0.10 + $0 =
$70$70 PV of Bonds Without the Gamble = $200PV of Bonds Without the Gamble = $200 PV of Stocks Without the Gamble = $0PV of Stocks Without the Gamble = $0
PV of Bonds With the Gamble:PV of Bonds With the Gamble:
PV of Stocks With the Gamble:PV of Stocks With the Gamble:
Debtholder expropriation by shareholdersDebtholder expropriation by shareholders
$20 =$30
(1.50)
$47 =$70
(1.50)
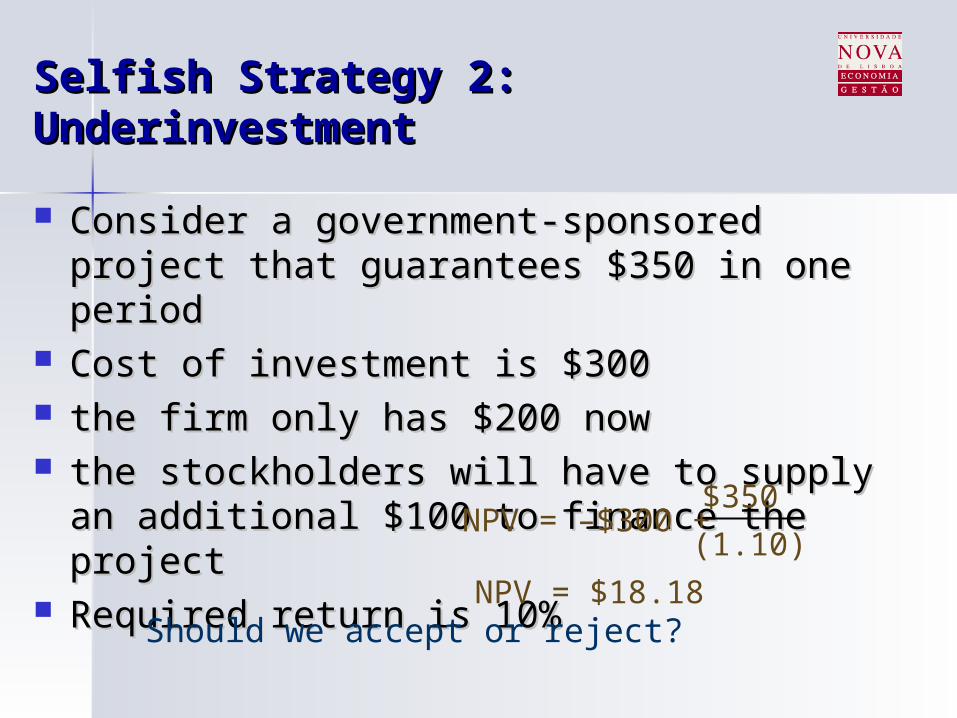
Selfish Strategy 2: UnderinvestmentSelfish Strategy 2: Underinvestment
Consider a government-sponsored project Consider a government-sponsored project that guarantees $350 in one periodthat guarantees $350 in one period
Cost of investment is $300 Cost of investment is $300 the firm only has $200 nowthe firm only has $200 now the stockholders will have to supply an the stockholders will have to supply an
additional $100 to finance the projectadditional $100 to finance the project Required return is 10%Required return is 10%
Should we accept or reject?
NPV = –$300 + $350
(1.10)
NPV = $18.18
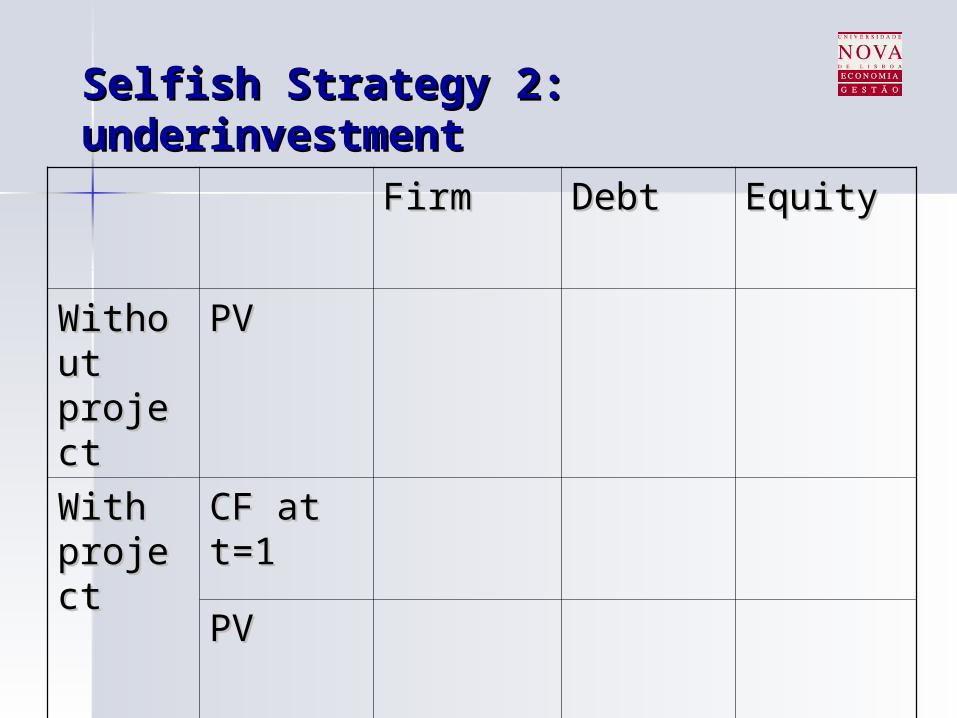
Selfish Strategy 2: Selfish Strategy 2: underinvestmentunderinvestment
FirmFirm DebtDebt EquityEquity
WithouWithout t projectproject
PVPV
With With projectproject
CF at CF at t=1t=1
PVPV
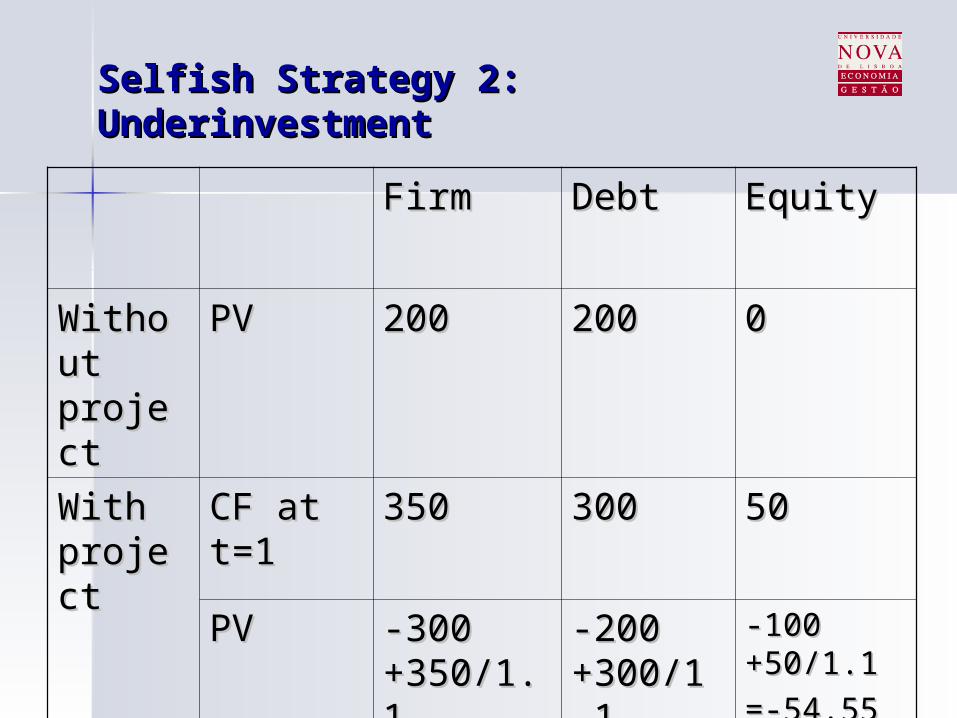
Selfish Strategy 2: UnderinvestmentSelfish Strategy 2: Underinvestment
FirmFirm DebtDebt EquityEquity
WithouWithout t projectproject
PVPV 200200 200200 00
With With projectproject
CF at CF at t=1t=1
350350 300300 5050
PVPV -300 -300 +350/1.+350/1.1 1 =18.18=18.18
-200 -200 +300/1.+300/1.1 1 =72.73=72.73
-100 -100 +50/1.1+50/1.1
=-54.55=-54.55
Selfish Strategy 3: Milking the PropertySelfish Strategy 3: Milking the Property
Liquidating dividendsLiquidating dividends Increase perquisites to Increase perquisites to
shareholders and/or managementshareholders and/or management
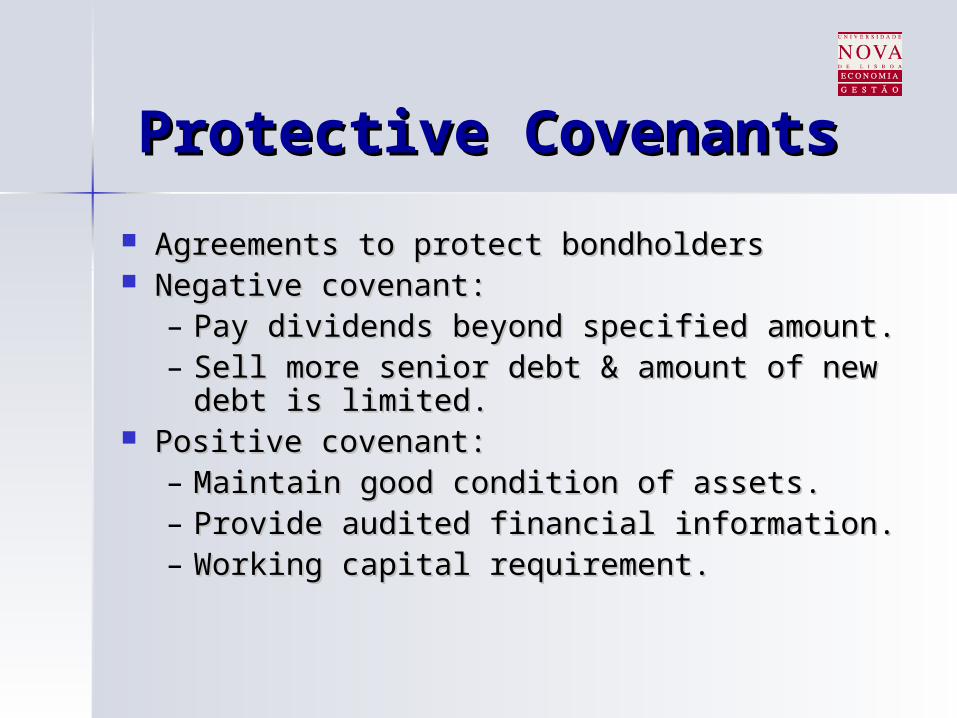
Protective CovenantsProtective Covenants
Agreements to protect bondholdersAgreements to protect bondholders Negative covenant: Negative covenant:
– Pay dividends beyond specified amount.Pay dividends beyond specified amount.– Sell more senior debt & amount of new Sell more senior debt & amount of new
debt is limited.debt is limited. Positive covenant: Positive covenant:
– Maintain good condition of assets.Maintain good condition of assets.– Provide audited financial information.Provide audited financial information.– Working capital requirement.Working capital requirement.
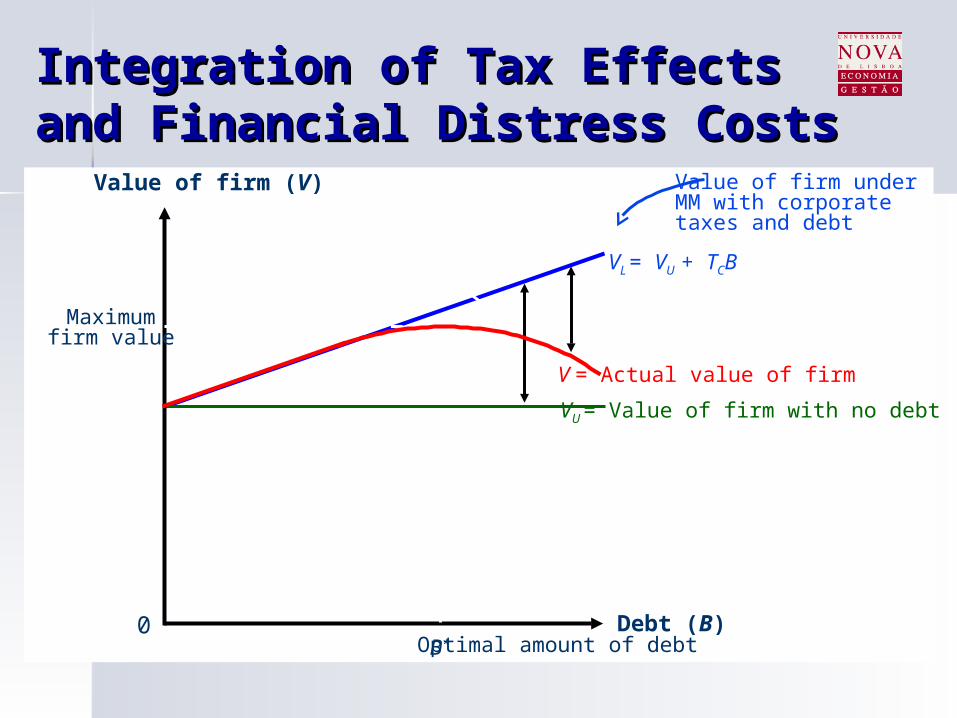
Integration of Tax EffectsIntegration of Tax Effectsand Financial Distress Costsand Financial Distress Costs
Debt (B)
Value of firm (V)
0
Present value of taxshield on debt
Present value offinancial distress costs
Value of firm underMM with corporatetaxes and debt
VL = VU + TCB
V = Actual value of firm
VU = Value of firm with no debt
B*
Maximumfirm value
Optimal amount of debt
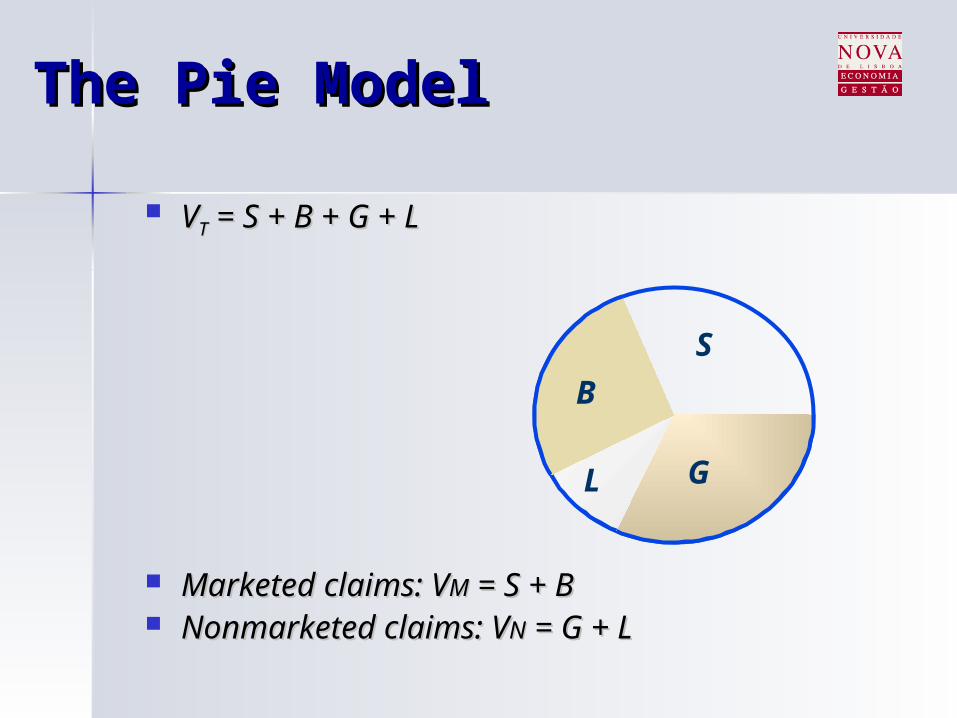
The Pie ModelThe Pie Model
VVTT = S + B + G + L = S + B + G + L
Marketed claims: VMarketed claims: VMM = S + B = S + B Nonmarketed claims: VNonmarketed claims: VNN = G + L = G + L
S
G
B
L
SignalingSignaling
The firm’s capital structure is The firm’s capital structure is optimized where the marginal subsidy optimized where the marginal subsidy to debt equals the marginal cost.to debt equals the marginal cost.
Investors view debt as a signal of firm Investors view debt as a signal of firm value.value.
A manager that takes on more debt A manager that takes on more debt than is optimal in order to fool than is optimal in order to fool investors will pay the cost in the long investors will pay the cost in the long run.run.