corporate & commercial 2016 legal benchmark report€¦ · corporate & commercial law firms...
TRANSCRIPT

Royal Bank of Scotland | Corporate & Commercial 1
2016 Legal Benchmark Report
Corporate & Commercial
Law firms need to avoid complacency

2016 Legal Benchmark Report NatWest | 2
The underlying climate is still positive, but there was a drop in confidence over firms’ ability to grow their revenue and profits
Foreword
For a fourth year, we have worked in collaboration with Robert Mowbray to produce this report focusing specifically on those legal firms operating within the SME sector and with revenues below £35m.
We’re always looking to enhance the value of the report for our customers and contacts. For 2016, we’ve incorporated comparison graphs highlighting changes across critical business indicators over the last four years. An additional element of the report examines the performance of legal firms compared to accountancy firms, given the synergies associated with the two professions.
This is the largest report to date, with contributions up by 15%. It now covers 390 firms, delivering robust regional and national data reference points. We’ve also incorporated predictive data representing anticipated performance in 2016, including feedback from
As head of NatWest’s professional services team, I am delighted to release our latest Law Firm Benchmarking report for 2016.
delegates who attended our series of legal conferences in October 2015.
Arguably 2014 was the first full year of sustained economic performance following the recession, and for many sectors, this stable environment and trend continued throughout 2015. This was replicated for the majority of legal firms, with fee income up by an average of 6% and profit per equity partner up by 8%.
Over the last two years, the combined improvement for the average firm has been a 5% improvement in revenue per fee earner and a profit per equity partner improvement of 27%.
Early indications suggest that 2016 could bring some performance challenge for many firms. Business levels witnessed in 2015 could be described as the new, post-recession norm, and many firms appear to be struggling to deliver growth levels achieved in the previous two years.
This was confirmed by delegates at our local conferences and while the underlying climate is still positive, there was a drop in confidence over firms’ ability to grow revenue and profits. If doubts exist over the ability to drive
up new matters, firms must consider the need to influence improved profitability via business efficiency and charge-out rates. This year’s findings suggest that average gearing is now 3.2x compared to 3.4x last year, highlighting the correlation between higher gearing and higher profits.
The 8% improvement in average charge-out rates to £162 is a positive sign indicating that clients will accommodate an element of fee uplift. This suggests that firms may wish to revisit their rate cards and must look to improve recorded chargeable hours, which appear to be firmly stuck at 1,000 per fee earner.
The report also references the risks associated with payment-related fraud and I would emphasise the need for firms to manage and implement robust internal governance standards to ensure that criminals do not undermine the positive financial standing many firms have worked hard to achieve in recent years. Remember, no bank will ever ask its customers to reveal their passwords or security codes.
We hope that this report will continue to assist those firms with a desire to improve their financial performance

NatWest | Corporate & Commercial 32016 Legal Benchmark Report NatWest | 3
and the motivation to understand how their firm compares against a national and regional peer group.
We remain committed to supporting legal firms in developing as successful businesses. Our specialist relationship managers understand the professional services sector and benefit from accredited, industry-led training. If you would like to speak to one of our team or attend our annual legal sector conference, please just contact me.
Finally, we would like to thank Robert Mowbray for once again sharing his sector knowledge and for his support in producing this report.
Firms must implement robust internal standards to ensure that criminals do not undermine their positive financial standing
Contents
Executive summary 4
Introduction 6
2016 predictions 10
Fees 12
Profit 16
Lock-up 24
Finance 26
Trends 32
Steve ArundaleHead of Commercial Professional Sectors, [email protected]

2016 Legal Benchmark Report NatWest | 4
Executive summary
£4k
This survey is a substantial review of law firms with fee income of up to £35m. It involved 390 firms employing 17,200 people across England, Wales and Scotland. The total income of the firms in the survey was £1.43bn.
Some of the more interesting findings of the survey were:
ProfitThe median profit per equity partner is £111,000, which is £4,000 higher than the figure from last year’s survey.
The median profit per equity partner in small firms of £68,000 is less than half of the median figure in large firms, which is £143,000.
The percentage increase in profits over last year is seven times greater in small firms than in large firms.
The median profit margin remained steady at 24%, which means it has settled down close to the long-term average of 25%. This suggests that the legal profession has now implemented the necessary changes to earn at historical levels. Are firms going to be happy with this level of profit?
The increase in profits has been driven primarily by an increase in the price that can be charged for each hour of time. Gearing is slightly down on last year, while hours recorded is flat. The recovered rate per hour has increased from £150 to £162 per hour, which
suggests that the much talked-about pricing pressures are beginning to ease or that firms are becoming more robust on pricing.
If firms could focus more on profitability and perform at the upper quartile point for gearing, recorded hours, recovered rate and margin, they would achieve a profit per equity partner of £409,000.
FeesMedian fees per fee earner were £144,000, with a lower quartile figure of £113,000, and an upper quartile figure of £200,000.
The median figure varies significantly by region with a high of £184,000 in London and a low of £122,000 in the South West.
The median fees per equity partner is £480,000 with the lower quartile point being £307,000 and the upper quartile point being £831,000.
Fees have grown by 6% since last year, which is considerably above inflation. There is again regional variation, with 10% growth in London, while the North East and North West achieved just 4%.
increase in median profit per equity partner on 2014
6%increase in fees on 2014, a figure above inflation
109days is the median lock-up period in 2015, up on 2014

NatWest | Corporate & Commercial 52016 Legal Benchmark Report NatWest | 5
Lock-upMedian lock-up is 109 days, a slight increase from last year. The upper quartile point is 70 days and the lower quartile point is 152 days.
As firms get larger, they’re finding it increasingly difficult to manage lock-up. Median lock-up for small firms is 84 days, for large firms it’s 120 days and for very large firms it’s 135 days.
FinanceLaw firms remain cautious about carrying debt and the median bank balance was £54,000.
Spare capacity in the overdraft is running at a median of 10% of annual fees, with little variance regardless of firm size. This suggests the median firm would run out of money in about 36 days if they received no further money from clients in that period.
Client money balances are typically 160% of annual billings. The firms in the survey hold about £2.3bn in client deposits. It’s clearly important that firms do everything possible to ensure that these funds are kept secure and continue to focus on security.
About the authorRobert Mowbray is a chartered accountant who has worked in and for professional firms since the 1980s. His book, Maximising the Profitability of Law Firms was the first book on law firm financials. He has been involved in a large number of surveys on the financial health of law firms, as well as surveys researching different aspects of law firm performance.
He is the author of the Law Firm Finance and Administration Handbook: A Practical Guide for COFAs and Finance Professionals, the first book to be published on the role of the COFA.
Each year, Robert works with about 80 law firms and helps them with anything to do with improving their financial performance. He has worked with close to 1,000 firms in over 35 countries worldwide. His clients range from the global elite, through major regional firms, to a large number of small firms and sole practitioners.
He is an owner of Taylor Mowbray, a business focusing exclusively on law firms, which he runs with Janet Taylor, an authority on the SRA Accounts Rules.

2016 Legal Benchmark Report NatWest | 6
Introduction
2015 was the second successive positive year for law firms, with most measures of performance continuing to improve, albeit more slowly than in 2014. As the economy grows, there are increasing examples of labour shortages emerging, which will put pressure on the salaries firms offer.
In some areas of the country, demand is exceeding supply for certain legal services, which means the downward pressure on price is starting to ease, as clients accept moderate increases. Having said that, more firms have failed and entered into administration, and we’ve seen the first law firm to float in the UK. As the legal sector recovers, there could be cash flow problems for firms, as they’ll need more capital to finance their growing working capital requirements, assuming they don’t start to retain some of their profits.
The more positive firms are now looking ahead and recognise that if they could increase fees by 10% to 15% without any real increase in expenses, then most of the additional fee income would be profit leading to very healthy results. This will only be achieved through intense focus on fee-earner productivity, which will mean concentrating on better capture
of time worked, getting smarter and more confident with fee arrangements and an improving ability to ensure clients don’t get nasty surprises over fees. Achieving these goals may require significant investment in training and systems.
While profitability is back to normal levels, firms should ask whether this is an acceptable level of profit. The median profit per equity partner is £111,000, which covers the salary for doing the job and the return to the investor. By the time that a fair notional salary has been deducted, the return to the investor does not look that good in most firms.
This is the fourth year of the survey and we were keen to continue with some of the reporting which has made it so popular, while adding some new elements to give readers something extra to consider. The report is based on contributions from 390 firms (an
increase on 338 in the last survey) using figures from their financial year ending in 2015. The combined fee income of the firms in the survey was £1.43bn. The combined profits were £341m covering 2,135 equity partners. The information is broken down into regions, as there is a significant difference in the performance of law firms across the UK.
It also analyses the performance of firms of different size to see if there is an optimum size of firm. There’s a new section showing the four-year trend for some of the key financial measures of performance. Another innovation is a section comparing the performance of law firms with accounting firms of a similar size.
The report provides median, lower quartile (LQ) and upper quartile (UQ) figures. Firms tend to talk about what they are good at and try to get even better at this, instead of focusing on

NatWest | Corporate & Commercial 72016 Legal Benchmark Report NatWest | 7
Partnerships remain popularTable 1 illustrates the split of legal firms taking part in this year’s survey by constitution. There are 144 limited liability partnerships (LLPs) compared to 143 partnerships. It’s perhaps surprising that there are still so many partnerships given that virtually all new firms now choose to establish themselves as either a company or an LLP.
Of all firms participating in the survey, 37% are LLPs, while in the very large firms category, this figure increases
to 57%. In Scotland and the Wales, Midlands and East of England region, there are still more partnerships than LLPs. There are definitely some firms that spend too much time worrying about whether they have got the right structure and not enough time on focusing on whether they are building a strong business.
Having said that, legal firms should take time periodically to reflect what other firms are doing and question whether they are operating with the right structure for their own firm.
Partnership LLP Company Sole Practitioner Total
London 17 22 10 6 55
South East 18 12 9 0 39
South West 15 31 12 3 61
Wales, Midlands, East of England 35 33 21 3 92
North East, North West 24 19 22 2 67
Scotland 34 27 13 2 76
Total 143 144 87 16 390
Very large firms 22 48 11 3 84
Firms by location
Table 1 Firms by constitution
areas of under-performance where improvements might more easily be achieved. When looking at the tables, it is perhaps best to concentrate on the areas where your firm is currently below the upper quartile figure and think about what needs to be done to generate better results.
Most of the information relates to the recently ended financial year. NatWest hosts a series of conferences each autumn for legal sector clients and contacts. Delegates at the 2015 events were asked to make predictions for 2016. This predictive data is included within the survey.
The map on this page shows an analysis of the firms in the survey by region and size. Three regions were grouped together to form Wales, Midlands and East of England as there were not enough firms from Wales (22 firms) and East of England (17 firms) for them to be analysed separately. The survey has divided the firms into two sizes. Those with annual fees of less than £1.5m are described as small, while those with fees in excess of £1.5m are classed as large.
The tables contain an extra line of data for “very large” firms, which are those with annual fees in excess of £5m. These have then been subdivided into small (annual fees between £5m and £8m) and large (firms with fees in excess of £8m). As with last year, the results for very large firms are also included in the figures for large firms.
� Small firms� Large firms
390 Total
84 Very large firms (% of total)
15(27)
23 (34)
47(62)
44
29
40(43) 52
19(49)
2027(44) 34
40
S36 30255 Client NatWest Ins date – AW% 100Campaign CNC Operator JONAS Page 8
Date 02.12.15 16:20 Title Press Trim (HxW) –Proof 5 File S36 30255 NTW Behind More TRADE 297x210 TA/SA 297x210mmAgency RBS 07 EA5903 Colour CMYK Spots – Bleed –
Account Team 1
Account Team 2
Producer
Client
Head of Art
Creative Director
Art Director
Copy Writer
To find out why more professional firms choose NatWest, search NatWest Professional Services or call 0800 694 0042
Relates to RBS Group which includes NatWest and Royal Bank of Scotland. Source: Primary banking relationship from Experian’s database (September 2015),
derived from filed accounts for businesses £2m-£1bn turnover.
Corporate and Commercial Banking
S36 30255 Client NatWest Ins date – AW% 100Campaign CNC Operator JONAS Page 7
Date 02.12.15 16:20 Title Press Trim (HxW) –Proof 5 File S36 30255 NTW Behind More TRADE 297x210 TA/SA 297x210mmAgency RBS 07 EA5903 Colour CMYK Spots – Bleed –
Account Team 1
Account Team 2
Producer
Client
Head of Art
Creative Director
Art Director
Copy Writer
Relates to RBS Group which includes NatWest and Royal Bank of Scotland. Source: Primary banking relationship from Experian’s database (September 2015),
derived from filed accounts for businesses £2m-£1bn turnover.
Corporate and Commercial Banking

NatWest | Corporate & Commercial 92016 Legal Benchmark Report NatWest | 9
S36 30255 Client NatWest Ins date – AW% 100Campaign CNC Operator JONAS Page 8
Date 02.12.15 16:20 Title Press Trim (HxW) –Proof 5 File S36 30255 NTW Behind More TRADE 297x210 TA/SA 297x210mmAgency RBS 07 EA5903 Colour CMYK Spots – Bleed –
Account Team 1
Account Team 2
Producer
Client
Head of Art
Creative Director
Art Director
Copy Writer
To find out why more professional firms choose NatWest, search NatWest Professional Services or call 0800 694 0042
Relates to RBS Group which includes NatWest and Royal Bank of Scotland. Source: Primary banking relationship from Experian’s database (September 2015),
derived from filed accounts for businesses £2m-£1bn turnover.
Corporate and Commercial Banking

2016 Legal Benchmark Report NatWest | 10
Predictions for 2016Larger firms are more optimistic about growth in profits and fees, but most forecast no improvement to lock-up levels in the next 12 months.
Fees
44%
Profit
In larger firms, 25% of people think fee income will grow by over 10% this year, while the equivalent figure is just 12% in small firms.
This indicates that large firms are more confident of maintaining healthy growth, a prediction at odds with the fact that growth has been consistent across all sizes of firm in the most recent year.
think fees will grow by 0-10%, which is a fall in confidence from 2015.
25% 12%
17% 8%
17% of large firms believe that profits per equity partner will increase by at least 10%, while the figure in small firms is half of that at 8%.
Just 40% of firms felt that profit sharing was linked to partner performance. This might be something that firms should go back and reconsider.
The lack of a policy that gives fee earners detailed advice on how all time should be recorded is one of the main reasons for under recording of time.
Time management
79% of delegates at the NatWest conference claim to have a detailed time-recording policy

NatWest | Corporate & Commercial 112016 Legal Benchmark Report NatWest | 11
Predictions for 2016
Lock-up% of people who thought lock-up would improve
Finance
2015 2016
which shows confidence falling in the ability to improve these statistics.
WIP days
Debtor days
WIP days
Debtor days
Once again, most delegates at the 2015 conferences thought there would be no change to lock-up levels,
43%44% 36%
38%
Comparing solicitors with accountants
Billable hours per day for both professions
4.4ONLY
Gearing in legal firms, compared to 3.00 in the accountancy sector
10%Solicitors generate 10% more fee income per equity partner
The revenue generated per fee earner is 5% higher for solicitors
3.2
This year, 9% of conference delegates thought that their bank balance would fall in the following year and this has dropped from 10% last year. This is interesting as the median bank balance has fallen in the last year, as per Table 18 (p27). The position may deteriorate further in the next year if firms continue to grow and fail to manage their lock-up more effectively.

2016 Legal Benchmark Report NatWest | 12
Fees
It’s possible to make more profit without increasing fees, by focusing on controlling or cutting expenditure. But when the economy is growing, it should also be possible to make more money by growing fee income.
Obviously, the growth must not arise from poor quality or unprofitable work. Profit is more important than growth, and there are too many firms making the mistake of thinking that if they grow, they’re bound to become more profitable.
One of the most widely used measures of performance in legal businesses is fees per fee earner, as it demonstrates the level of income being generated by each fee earner. This can then be compared to the salary cost of the fee earner to determine the multiple of salary costs which the fees generated represent.
Good law firms have always talked about the need to achieve fees equal to three times salary costs when budgeting in order to turn a healthy profit. If this can be done, and a further third is spent on overheads, then the equity partners will earn a tidy net profit of one-third.
If a multiple of three times salary cost is not achieved, then it will be difficult to achieve the same level of profits. If productivity can be increased and the multiple is higher than three, then clearly it should be possible to make even higher levels of profit than have been achieved historically.
Productivity on the riseTable 2 shows the fees per fee earner being generated in the firms that participated in the survey. The median figure overall is £144,000, which is an increase of £6,000, a 4% rise on the £138,000 figure reported last year. This suggests that there’s been an improvement in productivity which
should result in higher profits for firms and allow them to reward their fee earners with higher salaries. It’s no surprise to learn that for small firms, the median is lower at £128,000, while for large firms the figure stands at £162,000. And in very large firms, the median is £172,000.
The difference between the upper quartile figure across all firms, of £200,000, and the figure generated in the lower quartile, £113,000, equates to a 77% difference, which is even greater than last year. The gap indicates that there’s now a growing divide between firms that score well on this metric and those that don’t.

NatWest | Corporate & Commercial 132016 Legal Benchmark Report NatWest | 13
Once again, there are some significant regional differences. The overall median in London is £184,000, while the equivalent figure in the South West is £122,000. It’s important in all firms that there’s constant measurement between the fees generated per fee earner and the salary cost of that fee earner. The danger is that, as fees increase, the cost of the fee earners will grow at the same or an even faster rate, so there’ll be little or no improvement in profitability.
Fees per equity partner is another useful measure, as it combines the fees generated per fee earner with the number of fee earners working
for each equity partner to calculate the revenue generated by the equity partner and their team, as can be seen in the following formula: Fees per equity partner = Fees per fee earner x Gearing
New partners making impact Table 3 shows the fees generated per equity partner, and there’s considerable variation across regions and across the different sizes of firm.
The median figure across all firms was £480,000 compared to the median in the survey last year of £473,000, which represents a small 1.5% rise. Given that there was a larger increase
in fees per fee earner than in fees per partner, it suggests that firms have perhaps been appointing new partners which has held back the increase in fees per equity partner.
The median figure is £480,000 but the lower quartile figure is £307,000 and the upper quartile figure is £831,000. The upper quartile figure is therefore nearly three times that achieved at the lower quartile point. It’s important for firms to concentrate more on the billings of the partner and their team, rather than simply on the personal billings of the partner. If partners are too focused on achieving their own personal targets for billings then, not
Small Large Total
LQ Median UQ LQ Median UQ LQ Median UQ
London 144 160 278 158 187 345 153 184 335
South East 101 126 163 130 146 201 118 135 170
South West 93 116 142 112 129 179 102 122 163
Wales, Midlands, East of England 99 127 172 116 145 191 110 140 182
North East, North West 82 120 148 115 191 225 101 151 213
Scotland 109 128 161 99 153 198 105 131 184
Total 96 128 169 122 162 218 113 144 200
Very large firms 152 191 237 122 168 224 135 172 232
Small Large Total
LQ Median UQ LQ Median UQ LQ Median UQ
London 378 511 651 657 1,134 2,315 508 941 1,642
South East 249 340 490 525 555 770 349 523 610
South West 219 349 438 421 554 885 343 435 738
Wales, Midlands, East of England 197 292 436 426 554 762 288 454 639
North East, North West 216 293 416 508 999 1,738 335 532 1,281
Scotland 171 266 471 333 436 562 233 323 501
Total 217 319 486 437 612 1,115 307 480 831
Very large firms 529 1,089 1,786 555 931 1,463 552 963 1,712
Table 2 Fees per fee earner
Table 3 Fees per equity partner
£831kFees per equity partnerUpper quartile 2016Best performance Fees per equity partner (£’000s) 2013-2016
Lower quartile Upper quartile
262 676307 831

2016 Legal Benchmark Report NatWest | 14
Firms have had to look again at how they make money and become less reliant on the interest earned on client account
Real growth maintainedWhat has happened to total fees in firms since last year – has the growth that was seen last year been maintained? Given that the survey is comparing figures achieved in a year ending in 2015 with a year ending in 2014, it should be expected that growth has continued, as the economy itself improves. Table 4 shows what has happened to fee growth, and the overall median figure is growth of 6%, which continues to run at a higher rate than inflation, suggesting that real growth has indeed been maintained.
While the overall median shows growth of 6%, the lower quartile position was a drop of 1% in fee income and the upper quartile position was growth of 14%. The median for small firms was 6% growth; for large firms it was 6%; and for very large firms it was 7%, which demonstrates very consistent growth across all sizes of firm.
Median growth rates of about 6% can be seen but it’s interesting to see that this rises to 10% in London and Wales, Midlands and East of England, while the figure is lower in Scotland, where
surprisingly, the outcome might be that the team in total falls short of its target.
The London figures are consistently higher than other regions. In particular, the upper quartile figure for large firms in the capital, at over £2m, should be noted, as this is even higher than the upper quartile figures achieved for the very large firms. At the other end of the spectrum, the lower quartile figures in Wales, Midlands and East of England (£197,000) and Scotland (£171,000) show that there’s a very significant difference in this measure between the best and the worst firms.
The median figure of £480,000 implies that gearing averages 3.33 since, as has already been stated, the annual fees per fee earner are £144,000. The equivalent gearing figure in the survey last year was 3.43, which indicates that there’s been a small decrease in gearing. Fees per equity partner have therefore increased because of a small rise in productivity, which has more than offset the slightly smaller reduction in gearing.
it’s 5%, and in both the North East and North West, where it stands at 4%.
Less reliance on interestHistorically, prior to the economic slowdown, the annual profit at many legal businesses was often fairly close to the bank interest earned figure. In other words, the law firm would cover its expenses with the fees it earned, and the actual profit would come from the premium interest earned on client account.
But the last few years have seen significant falls in transactional work which has resulted in law firms holding less client money. This, coupled with the fall in interest rates, has meant that the amount of interest being earned has fallen to very low levels compared to the past. This has meant that numerous firms have had to look again at how they make money from legal services and become less reliant on the interest earned on client account.
Table 5 shows just how little is being earned in interest, with the median figure being 0.27% of fee income. Table 3 showed that fees per equity partner totalled £480,000 which suggests that the interest earned per partner at 0.27% of fee income would be £1,296, which would presumably be insufficient for most equity partners to live on.
It’s predicted that interest rates will start to rise again in 2016, and this should result in interest earned starting to rise again.
The figures suggest there has been an improvement in productivity, which should result in higher profits, allowing firms to reward their fee earners

NatWest | Corporate & Commercial 152016 Legal Benchmark Report NatWest | 15
Small Large Total
LQ Median UQ LQ Median UQ LQ Median UQ
London 99% 107% 117% 101% 110% 120% 100% 110% 120%
South East 102% 112% 123% 102% 105% 109% 102% 108% 112%
South West 99% 106% 112% 100% 106% 113% 100% 106% 113%
Wales, Midlands, East of England 95% 112% 122% 100% 109% 116% 98% 110% 118%
North East, North West 99% 105% 114% 97% 104% 110% 98% 104% 114%
Scotland 90% 104% 110% 100% 110% 113% 97% 105% 112%
Total 97% 106% 114% 100% 106% 114% 99% 106% 114%
Very large firms 97% 106% 117% 101% 108% 113% 100% 107% 116%
Small Large Total
LQ Median UQ LQ Median UQ LQ Median UQ
London 0.00% 0.08% 0.34% 0.00% 0.03% 0.90% 0.00% 0.04% 0.77%
South East 0.11% 0.60% 1.16% 0.49% 1.48% 2.43% 0.19% 0.97% 1.77%
South West 0.09% 0.27% 0.86% 0.07% 0.53% 0.98% 0.06% 0.52% 0.92%
Wales, Midlands, East of England 0.06% 0.29% 0.97% 0.26% 0.87% 1.42% 0.10% 0.67% 1.27%
North East, North West 0.00% 0.10% 0.53% 0.00% 0.31% 1.09% 0.00% 0.18% 0.97%
Scotland 0.00% 0.14% 0.30% 0.01% 0.12% 0.37% 0.00% 0.13% 0.33%
Total 0.00% 0.20% 0.62% 0.04% 0.43% 1.21% 0.01% 0.27% 1.01%
Very large firms 0.06% 1.01% 2.26% 0.04% 0.40% 0.97% 0.04% 0.66% 1.23%
Fee income: predicted percentage movements in 2016
>-20% -10-20% -0-10% zero +0-10% +10-20% >20%
Fees < £1.5 million
Fee income 1 3 8 32 44 11 1
Fees > £1.5 million
Fee income 1 2 4 21 48 20 5
Total
Fee Income 1 2 5 26 47 16 4
KEY QUESTIONS 1. What do we need to do to enable fee earners to become more productive?
2. Are we training our fee earners properly so that they maximise their fee-earning potential?
3. Are we confident about our pricing, and can we charge more if we get the service right for the client?
Table 4 Fees as a percentage of last year’s
Table 5 Interest received as a percentage of fees
At the autumn 2014 conferences, 56% of delegates anticipated that fees would rise by 0-10% during 2015. This proved to be an accurate prediction, as fees actually increased by 6% during the year. The predictions from the 2015 conferences for 2016 can be seen above, with 47% of delegates predicting that fees will rise by 0-10% this year.
Predictions from the NatWest conferences… what will happen in 2016?
6%The median growth rate for firms of all sizes across the UK during 2015
10%The median growth rate for firms of all sizes in London, Wales, the Midlands and East of England

2016 Legal Benchmark Report NatWest | 16
Profit
Profit is the most important measure, as it’s the profit that is shared among the partners. It’s amazing how many firms focus too much on fees earned and not enough on profit. Historically this has been because law firms have always found it easier to measure fees billed than to calculate the profit earned for different types of work, for individual matters and for different fee earners.
A common starting point for firms is to look at the profit available for all the equity partners as a percentage of fee income.
The historic rule of thumb is that good firms will make 33%, average firms will make 25% and under-performing firms will make less. Table 6 provides some feedback on current performance. In total, the upper quartile score is 33%, the median figure is 24% and the lower quartile figure is 15%, which is identical to last year, indicating that there has been no change in profitability.
These numbers reinforce the validity of the traditional model and show that
the legal profession is now performing in line with long-term trends. The challenge now is to improve margins even further, but the danger is that many firms will become complacent.
What’s of more interest in Table 6 are the significant regional variations. While the overall median figure is 24%, in London it’s 33%, and in Scotland it’s 28%; but in the North East, North West
and Wales, Midlands and the East of England, it stands at just 21%.
Size isn’t everythingSmall and large firms have a median margin of 24%, while very large firms have a median of 25%. It’s interesting that the margin remains fairly constant across all sizes of firm, supporting the view that the size of a firm is irrelevant to its ability to make profit. The most important thing is to ensure that the work being done is always carried out in the most profitable way.
A better way of looking at profit is to calculate it as a profit per equity partner. Some surveys now calculate
The most important thing is to ensure that the work being done is always carried out in the most profitable way

NatWest | Corporate & Commercial 172016 Legal Benchmark Report NatWest | 17
Small Large Total
LQ Median UQ LQ Median UQ LQ Median UQ
London 20% 27% 45% 21% 33% 44% 21% 33% 45%
South East 9% 22% 34% 13% 23% 31% 11% 22% 31%
South West 18% 27% 36% 23% 26% 30% 18% 26% 33%
Wales, Midlands, East of England 12% 23% 33% 14% 20% 28% 13% 21% 30%
North East, North West 12% 23% 36% 10% 19% 28% 11% 21% 30%
Scotland 15% 23% 38% 20% 31% 41% 16% 28% 40%
Total 14% 24% 35% 15% 24% 32% 15% 24% 33%
Very large firms 12% 23% 31% 18% 26% 35% 15% 25% 34%
Small Large Total
LQ Median UQ LQ Median UQ LQ Median UQ
London 95 130 236 200 310 666 153 268 504
South East 24 55 130 59 149 172 37 99 170
South West 50 71 141 113 141 212 70 115 186
Wales, Midlands, East of England 26 68 124 56 100 177 45 84 159
North East, North West 34 68 109 73 143 257 53 107 186
Scotland 35 65 111 85 135 192 48 84 143
Total 35 70 124 85 147 248 54 111 191
Very large firms 113 172 341 131 235 408 115 206 399
profits per partner, but as non-equity partners are not risk takers and are effectively just higher-paid fee earners, such a calculation is perhaps not as useful. Where the business in the survey is incorporated, we have used the number of shareholders to be the number of equity partners.
Table 7 shows that the median profit per equity partner across all firms is £111,000, with small firms achieving a median of £70,000 and large firms achieving a median of £147,000. In the very large firms, the smaller ones achieve a median of £172,000 while the larger ones achieve a median of £235,000. The gap between the
Table 6 Profit as a percentage of fees: size and location
Table 7 Profit per equity partner: size and location
largest (£235,000) and smallest firms (£70,000) is greater than threefold per equity partner at the median level.
The recovery goes onIn last year’s survey, the median figure was £107,000 and in the year prior to that it was £87,000, so the recovery to a figure in excess of £100,000 has been maintained. While the man in the street would say that £111,000 is a lot of money, it’s worth bearing in mind that this figure covers the salary of the equity partner for doing the job and the profit being earned from the business. One can argue forever about what is a fair salary for an equity partner, but once this figure has been
deducted from the profit per equity partner figure, the resultant true profit figure suddenly looks less impressive.
Not surprisingly, there are significant regional variations. The median figure for all firms is £111,000, but this drops to £84,000 in Scotland, and rises to £268,000 in London. The figure in the South East at £99,000 is lower than the figure in the North East and North West at £107,000.
It’s always interesting to look at the upper quartile figures to see what can be achieved. The figure for London at £504,000 is over three times the figure of £143,000 in Scotland.
£111kThe median profit per equity partner across all firms, a rise of £4,000 on the previous year

2016 Legal Benchmark Report NatWest | 18
1 EU-15: Austria, Belgium, Denmark, Finland, France, Germany, Greece, Ireland, Italy, Luxembourg, the Netherlands, Portugal, Spain, Sweden and the UK.
Profits outpace inflationTable 8 looks at how profits have changed since last year. The overall median increase is 8%. Small firms have fared much better at 21% while large firms have seen an increase of just 3%. The very large firms have seen an increase in profits of just 1%. While firms would like their profits to be going up faster, it’s good that they are going up faster than inflation and that they have stopped falling, which was the case in the first couple of years after the economic slowdown.
If overheads are now properly under control, then it’s not unreasonable to expect to see some further significant increases in profits once steady growth is achieved in fee income. Fees are up by 6% but profits have only increased by 8%. If the increase in fees arises from an increase in productivity, then profits would rise at 3-4 times the rate of the fees increase. This is why there needs to be a more focused emphasis on productivity.
A useful way of understanding and benchmarking profitability is with the model in the table below:
The first variable is called gearing or leverage. It represents the size of each team in the firm, including the equity partner. So, if a partner manages two fee earners they have gearing of three; while if they manage five fee earners they have gearing of six. Clearly, the larger the team, the more it can bill and the more profit it can make. The reason why gearing can not normally get too high is due to the complexity of the work. Only simple legal work can be done with huge gearing; more complicated work requires more supervision and experience.
The second variable is the annual recorded chargeable hours per fee earner. If everyone is busy and confident in recording their time, then the number will be high. If there’s a shortage of work, or if people are slack over their time recording, then the recorded hours will be lower. It’s
not surprising that the firms who pay the most seem to get the most hours recorded. When the first two variables are multiplied together, you’re calculating the annual hours generated by each partner through their team.
The third variable is the recovered rate per hour billed. The higher this rate can be, the greater the profit margin will be. If work is complex, it can demand a higher rate than if the work is routine. Some firms break this variable down into the recorded rate and the percentage of this rate that has been billed. In other words: Recovered rate per hour = recorded rate per hour x realisation % The multiple of the first three variables determines the fees billed by the partner in the year.
The final variable is the profit margin. This is the percentage of the fee which ends up as net profit. It is the efficiency with which a firm turns fees into profit. If it is efficient, the net profit margin will be high, but if not, the margin will drop and can become negative.
The numbers in the table show that to go from a PEP of about £100,000 to a PEP of about £500,000 doesn’t require a five-fold increase in all of the variables. Relatively small increases in one or more of the variables can deliver significant improvements in profitability. This is why firms should regularly benchmark against their competitors so that they can identify where they can most easily improve.
Firms should regularly benchmark against their competitors so they can identify where they can most easily improve
Small firm: PEP £96,000 Large firm: PEP £504,000
Gearing (or leverage) 4 5
x
Hours 1,000 1,000
x
Recovered rate/hour £120 £240
x
Profit margin 20% 30%
Understanding and benchmarking profitability

NatWest | Corporate & Commercial 192016 Legal Benchmark Report NatWest | 19
8%The median increase in profits by all firms
21%The median increase in profits by small firms
Small Large Total
LQ Median UQ LQ Median UQ LQ Median UQ
London 18% 25% 65% 1% 4% 28% 2% 10% 37%
South East 11% 25% 35% 1% 3% 5% 2% 7% 25%
South West 8% 21% 33% 1% 4% 13% 3% 9% 24%
Wales, Midlands, East of England 10% 22% 37% 1% 2% 5% 1% 5% 24%
North East, North West 5% 11% 30% 1% 6% 14% 2% 9% 19%
Scotland 7% 13% 30% 0% 1% 3% 1% 7% 23%
Total 8% 21% 35% 1% 3% 10% 2% 8% 25%
Very large firms 1% 3% 5% 0% 1% 1% 0% 1% 3%
Table 8 Profit per equity partner as a percentage of last year: size and location
Small Large Total
LQ Median UQ LQ Median UQ LQ Median UQ
London 2.00 3.00 4.00 3.11 4.38 7.00 2.76 4.00 6.59
South East 2.00 2.67 3.75 2.81 4.03 4.85 2.38 3.25 4.41
South West 2.00 2.50 3.75 2.69 4.00 6.83 2.33 3.00 5.00
Wales, Midlands, East of England 2.00 2.60 3.75 2.58 3.75 5.00 2.40 3.33 4.82
North East, North West 2.00 2.40 4.00 3.00 5.33 7.50 2.38 4.00 6.75
Scotland 1.19 1.88 3.25 1.96 2.66 5.68 1.36 2.19 4.25
Total 1.67 2.50 4.00 2.67 4.00 6.40 2.14 3.20 5.00
Very large firms 2.88 5.17 8.13 3.44 5.07 7.88 3.27 5.07 8.17
Table 9 Gearing (total fee earners/equity partners): size and location
Gearing falls backTable 9 shows how gearing varies with size of firm and by region. The median figure for all firms is 3.20, compared with a figure of 3.41 in last year’s survey. It’s disappointing to see this number falling back from last year, given that it should be possible to run with considerably higher numbers, as demonstrated by the very large firms. As work volumes pick up, many firms
will need to concentrate on getting this particular variable back up to a more sensible figure, as clients are not going to be willing to pay a partner to do the more routine work that needs to be done on a file.
The figure should not, however, be increased until everyone is working at capacity, as it’s always better if additional work can be resourced with the existing fee earners, before recruiting new people. Perhaps firms should look at employing some more business development professionals to help fee earners become more productive. Fee earners will never be fully productive if they have to spend
too much of their time doing business development activities.
It’s particularly interesting to see that the median figure in small firms is 2.50, while in large firms it’s significantly higher at 4.00. The figure gets even higher in the very large firms where the median is 5.07. Once again, there is a useful insight into what might be possible if the upper quartile figures are reviewed. In large firms, the upper quartile figure is 6.40, but this varies regionally and goes up to 7.50 in the North East and North West. This figure is over two times higher than the median for all firms of 3.20.
Fee earners will never be fully productive if they have to spend too much time doing business development activities

2016 Legal Benchmark Report NatWest | 20
Staffing ratios are clearly important and every firm needs to have the right mix of fee earning and non-fee earning staff.
Traditionally it wasn’t uncommon to find that firms had about the same number of fee earners as they did support staff. In recent times, while secretarial numbers have been falling, firms have found it necessary to recruit new people in business development, information technology and other management roles, so in aggregate maybe nothing has really changed.
This is very different to the picture seen in large accountancy firms, where fee earners account for 75% of the total headcount.
No economies of scaleTable 10 provides an update on the relationship between fee earners and non-fee earners.
Across all firms, 50% of people are fee earners – which clearly means that 50% are non-fee earners, reinforcing the traditional view of a 50/50 split. In the very large firms, 55% of people are fee earners, suggesting that they have achieved no real economies of scale. There’s no difference between small and large firms.
There are significant regional variations too, with London seeing a median figure of 67% fee earners, compared with Wales, Midlands and East of England at 44%.
A problem of under recordingFees will only be maximised if fee earners are recording all of their time. If clients can’t see the effort that has been put into their affairs, then they’re unlikely to pay for this effort. Full-time capture is the most basic thing for fee earners to do properly but most fee earners still massively under record their time. Different firms have different working cultures but most fee earners are asked to work a minimum of 7.5 hours per day. Given that when holidays (seven weeks including bank holidays) and weekends are taken into account, there are still 225 working days in a year, this suggests a capacity of 1,688 hours per year.
Fee earners will spend some time on business development, know-how and training, and may have some sick days, but equally they will often put in additional hours, either in the workplace or away from the office.
Fees will be maximised only if fee earners are recording all their time. If clients cannot see the effort being put into their affairs, they are unlikely to pay for it
Fee earners as a percentage of total headcount (median)� Small firms� Large firms
40 47
5050
50
50
46
56
56
59
70
48

NatWest | Corporate & Commercial 212016 Legal Benchmark Report NatWest | 21
Total
LQ Median UQ
London 784 1,062 1,250
South East 682 936 1,000
South West 1,000 1,115 1,724
Wales, Midlands, East of England 806 1,000 1,000
North East, North West 1,000 1,000 1,200
Scotland 550 750 750
Total 750 1,000 1,106
Very large firms 795 1,012 1,250
Too much time is being lostTable 11 shows the level of chargeable time being recorded and highlights that considerable time is being lost. The overall median figure of 1,000 hours per fee earner equates to 4.4 hours per working day.
This does not tally with how most fee earners tell you that they’re hard at work on client matters for most of every working day, and that this often continues when they leave the office, as it’s increasingly easy to work remotely with the help of technology.
There doesn’t appear to be much regional variance in the chargeable
hours figures, which remain very similar to last year. With increasing activity, it would have been expected that this figure would have risen. One possible explanation is that fee earners are still nervous about recording all of their time because they worry about the prospect of increased write-offs.
Clients continue to put all suppliers, including their legal firms, under pressure on fees. Indeed, commercial clients are often considerably better at negotiating fees than solicitors, many of whom have never really had to negotiate hard over fees until relatively recently. There continues
to be significant push back on charging by reference to hourly rates, and clients and the courts are now looking for more certain and creative ways of charging. It seems unlikely that this price pressure is going to disappear any time soon.
Table 11 Chargeable hours per fee earner
Small Large Total
LQ Median UQ LQ Median UQ LQ Median UQ
London 50% 50% 67% 57% 70% 81% 50% 67% 75%
South East 45% 50% 60% 38% 48% 54% 41% 50% 56%
South West 38% 56% 63% 42% 50% 61% 42% 53% 63%
Wales, Midlands, East of England 30% 40% 50% 33% 47% 53% 33% 44% 52%
North East, North West 40% 46% 57% 42% 56% 65% 40% 50% 63%
Scotland 33% 50% 55% 41% 59% 75% 36% 50% 63%
Total 38% 50% 57% 41% 52% 67% 40% 50% 63%
Very large firms 36% 50% 64% 49% 58% 70% 44% 55% 68%
Table 10 Fee earners as a percentage of total headcount
Clients continue to put all suppliers, including their legal firms, under pressure on fees. Indeed, commercial clients are often considerably better at negotiating hard over fees than solicitors
1198Chargeable hours per fee ownerUpper quartile 2013Best performance
Chargeable hours per fee owner (£’000s)change from 2013-2016
970 1198750 1106
Lower quartile Upper quartile

2016 Legal Benchmark Report NatWest | 22
1 EU-15: Austria, Belgium, Denmark, Finland, France, Germany, Greece, Ireland, Italy, Luxembourg, the Netherlands, Portugal, Spain, Sweden and the UK.
Small Large Total
LQ Median UQ LQ Median UQ LQ Median UQ
Total £116 £169 £216 £124 £162 £223 £118 £162 £224
Very large firms £141 £163 £213 £151 £210 £248 £148 £187 £235
Small Large Total
LQ Median UQ LQ Median UQ LQ Median UQ
Gearing 1.67 2.50 4.00 2.67 4.00 6.40 2.14 3.20 5.00
Hours 643 813 1,000 857 1,000 1,238 750 1,000 1,106
Recovered rate (£) 116 169 216 124 162 223 118 162 224
Margin % 14 24 35 15 24 32 15 24 33
Total PEP (£’000) 17 82 302 43 155 565 28 124 409
Very Large Firms
Gearing 2.88 5.17 8.13 3.44 5.07 7.88 3.27 5.07 8.17
Hours 992 1,238 1,410 722 928 1,077 795 1,012 1,250
Recovered rate (£) 141 163 213 151 210 248 148 187 235
Margin % 12 23 31 18 26 35 15 25 34
Total PEP (£’000) 49 240 757 68 257 737 58 240 816
Table 13 Profit per equity partner £’000, using median across all regions
Table 12 Recovered rate per hour by size of firm
A rise in recovered rateTable 12 illustrates the recovered rate per hour which is being achieved. The median recovered rate for all firms is £162, which represents an increase of £12 on the figure in last year’s survey. If the realisation rate were 80%, which is a common figure, this indicates there is a headline rate of £202 with a further £40 discount at the point of billing. Small firms have a median
figure of £169 while large firms have a median of £162.
The figure for very large firms is higher again at £187, but it’s surprising to see that the median for the largest firms is only £210. This can be explained by the fact that the very large firms have much higher levels of gearing, as seen in Table 10. As gearing increases, this will always tend to reduce the average recovered rate per hour.
Performance drives profitsTable 13 calculates what the PEP figure would be for firms of different size if they achieved lower quartile, median or upper quartile performance
for each of the four drivers of profitability. While it would be difficult to be the best at everything, it should be possible to achieve upper quartile performance at everything. The table shows that achieving upper quartile performance will deliver a PEP figure of over 10 times of what would be achieved at the lower quartile level in all sizes of firm.
It would be difficult to be best at everything, but it should be possible for firms to achieve upper quartile performance
£191kProfit per equity partnerUpper quartile 2016Best performance
Profit per equity partner (£’000s)change from 2013-2016
48 160
Lower quartile Upper quartile
54 191

NatWest | Corporate & Commercial 232016 Legal Benchmark Report NatWest | 23
>-20% -10-20% -0-10% zero +0-10% +10-20% >20%
Fees < £1.5 million
Profit per equity partner 1 1 11 41 39 7 1
Gearing 2 2 5 62 21 7 2
Hours 1 1 8 38 45 6 1
Recovered rate 1 3 6 60 25 3 1
Margin 1 1 11 41 38 6 1
Fee > £1.5 million
Profit per equity partner 1 2 4 38 39 13 4
Gearing 1 2 6 54 24 9 3
Hours 1 1 4 23 57 13 1
Recovered rate 1 3 10 44 38 5 0
Margin 1 1 11 41 38 6 1
Total
Profit per equity partner 1 1 7 39 39 10 3
Gearing 1 2 5 57 23 8 3
Hours 1 1 6 29 52 10 1
Recovered rate 1 3 8 51 32 4 1
Margin 1 1 11 41 38 6 1
The predictions for 2016 from the autumn 2015 conferences are shown above. The forecasts are similar to those made last year, and again there is more confidence that hours will go up rather than rates, which is not what happened in 2014.
The table highlights the fact that large firms are more confident than small firms about significant increases in profit. It shows 17% of large firms believe that profits per equity partner will increase by at least 10%, while the figure in small firms is just 8%. The fact that large firms have more confidence about their ability to increase profits substantially is interesting, given that Table 8 shows that the reverse has been true. These figures have halved since last year, showing that there is less confidence now than there was a year ago over the ability to deliver further significant gains in profit.
Delegates were asked if their firm had a time-recording policy that gives fee earners detailed advice on exactly how all time should be recorded. A lack of such a policy is one of the biggest
reasons for under recording of time. The survey showed that 79% of firms believe that they have a detailed policy. Given the poor levels of time being recorded, these firms must still be struggling to get their fee earners to comply with the time recording policy. Without full time recording, firms will fail to bill clients fairly or understand the true profitability of their work.
Another issue which will impact on long-term is whether a detailed business plan for the next three to five years is in place. Budgets are there to manage performance over the next year, but it is important to plan over longer periods, too. As the economy grows, it will be important for firms to make the right strategic decisions if they are to maximise their returns from this growth. Across all firms, 89% say they have a detailed business plan.
It is important that all partners are motivated to deliver marginal increases in profit. This will be achieved more easily if profits are shared in line with partner performance. It was interesting to see that just 40% of firms felt that
profit sharing was linked to partner performance. This could be an area that firms should reconsider.
KEY QUESTIONS 1. Have we benchmarked our performance against similar firms and have we identified where we are below the upper quartile point?
2. Are we under recording time and not showing clients the full extent of our efforts?
3. How can we get a better rate per hour for what we do; do we understand creative fees and client expectations on service?
4. Do we use matter planning tools which help us to understand the profitability of our work?
5. Do we have a clear strategy and are we making progress in getting it implemented?
6. Is profit sharing properly linked to performance and attainment of our strategic goals?
Predictions from the NatWest conferences… what will happen in 2016?
Table 14 Profit and profit drivers: percentage movements in 2016

2016 Legal Benchmark Report NatWest | 24
Lock up
The vast majority of legal businesses fail to manage lock-up effectively and, as a consequence, provide far too much credit to clients which in turn will potentially generate cash-flow problems. Having said that, lawyers are naturally cautious and do not like borrowing money.
The consequence of all of this is that firms will often require considerable capital from the partners and there will need to be some delay between generating profits and those profits being distributed to the partners. If cash flow could be improved, then there would be less pressure on the firm and lower levels of capital would be required.
Table 15 shows the amount of WIP days being carried in firms. This is a measure of how long it takes from the recording of an hour to the billing of that hour. The total median figure is 56 days (up from 55 days last year), while the upper quartile position is 28 days and lower quartile performance is 87 days. It is interesting to see how performance worsens as firms get larger. The median for small firms is 42 days, but for large firms it is 61 days. There is also some variance by
region with the South East doing equal best at 43 days while the North East and North West take 73 days.
The figures are consistently high and firms should begin to act, because when work volumes pick up, there is always a tendency to concentrate on finding the resources to get the work done and less focus on managing billing and WIP.
An increase in debtor days Table 16 provides feedback on debtor days. This is a measure of how many days it takes to get a bill paid from when it is issued. The median figure is 48 days, which is one day higher than last year. The figure falls to 29 days at the upper quartile level and rises to 71 days at the lower quartile level.
Once again, it is interesting to see how the larger firms perform worse. The median for small firms is 41 days, for large firms 50 days and for very large firms its is 63 days. While the very large firms tend to be more profitable than smaller firms, they are not as successful at managing cash flow.
This is probably because more people need to be managed, and perhaps more time should be spent training
fee earners on what they should be doing to manage cash flow more effectively and to get clients to settle their bills.
The culture of creditTable 17 provides statistics on total lock-up figures. This measures in days how long it takes from a fee earner recording an hour to the cash being received from the client. It can be seen that the total median figure is 109 days, which is the same as last year. There is considerable regional variance with the median in the North East and North West standing at 133 days, while in the South East the figure is just 82 days. There is no reason why so much credit should be given and it is simply a culture that has persisted in the legal profession for many decades.
For small firms, the figure is 84 days, for large firms it is 120 days and for very large firms it is 135 days. This evidence confirms yet again that larger firms struggle to manage cash flow compared to smaller firms.
All fee earners need to think about what they can do with their clients to increase money on account, accelerate billing and take a more active role in credit control.
Perhaps more time should be spent on training fee earners on managing cash flow more effectively and getting clients to settle their bills

NatWest | Corporate & Commercial 252016 Legal Benchmark Report NatWest | 25
Small Large Total
UQ Median LQ UQ Median LQ UQ Median LQ
London 14 38 58 36 62 97 32 54 84
South East 23 35 48 29 46 56 25 37 56
South West 25 38 62 36 46 71 29 41 67
Wales, Midlands, East of England 33 53 66 37 46 70 36 51 68
North East, North West 25 46 71 32 49 73 27 48 73
Scotland 18 41 68 35 57 73 27 49 71
Total 25 41 66 32 50 73 29 48 71
Very large firms 41 61 75 36 66 82 40 63 82
Small Large Total
UQ Median LQ UQ Median LQ UQ Median LQ
London 55 84 117 80 137 186 73 125 170
South East 47 63 104 72 94 109 51 82 107
South West 55 90 109 79 99 158 68 96 127
Wales, Midlands, East of England 73 113 143 103 126 165 87 123 162
North East, North West 70 113 138 105 141 210 83 133 210
Scotland 46 65 93 86 115 144 52 85 123
Total 50 84 126 87 120 165 70 109 152
Very large firms 85 120 168 113 145 173 103 135 170
Once again, most conference delegates thought there would be no change to lock-up levels, a fact which is reflected in the survey. At the 2014 conferences, 43% of respondents predicted they would improve their WIP days and 44% thought they would improve their debtor days. The equivalent figures from the 2015 conferences are 36% and 38%, which suggests confidence is falling in the ability to improve these statistics.
KEY QUESTIONS 1. Given that clients don’t want nasty shocks when they are billed, why do we wait so long before we talk about money?
2. Do fee earners have the necessary management information available to manage lock-up effectively?
3. Are the appropriate carrots and sticks in place to deliver improved lock-up?
4. Have fee earners been trained to manage lock-up effectively?
Predictions from the NatWest conferences… what will happen in 2016?
Table 15 WIP days
Table 16 Debtor days
Table 17 Total lock-up days
Small Large Total
UQ Median LQ UQ Median LQ UQ Median LQ
London 31 45 77 25 48 81 25 46 81
South East 12 37 48 30 46 63 22 43 61
South West 17 39 63 18 53 71 18 47 70
Wales, Midlands, East of England 27 58 82 47 70 112 44 66 101
North East, North West 29 52 97 47 81 122 39 73 119
Scotland 14 28 60 48 57 77 25 48 68
Total 18 42 79 39 61 98 28 56 87
Very large firms 35 47 77 47 77 113 42 58 99
Lock-up: percentage movements in 2016>-20% -10-20% -0-10% zero +0-10% +10-20% >20%
Fees < £1.5m
WIP days 1 1 5 65 24 2 1
Debtor days 1 2 6 63 21 6 1
Fees > £1.5m
WIP days 0 3 5 49 34 7 1
Debtor days 1 3 6 43 37 8 1
Total
WIP days 0 2 5 56 30 5 1
Debtor days 1 3 6 51 30 7 1

2016 Legal Benchmark Report NatWest | 26
Finance
Firms fail when they run out of money. Not making a profit is unlikely to cause the collapse of a firm in a hurry, but running out of money can cause immediate failure. All firms should therefore monitor their bank balance at all times and prepare regular cash flow forecasts to make sure that they can live within their agreed bank facilities.
Banks make money out of lending to businesses, but they’re unlikely to lend to a company on the verge of collapse if it comes knocking on their door. Law firms have always been fairly prudent operations and traditionally they don’t feel comfortable with too much debt.
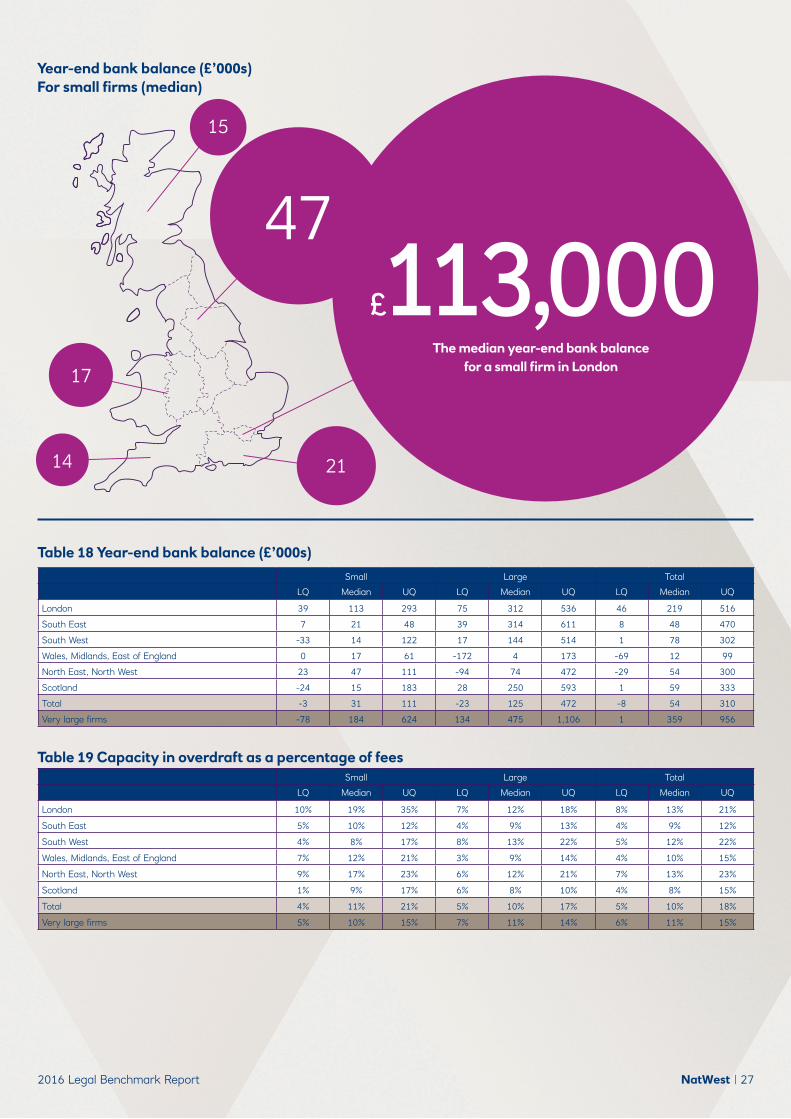
A fall in the balance Table 18 indicates the year-end bank balance of firms. The median balance is £54,000, down £2,000 on last year’s figure of £56,000. There’s some regional variation, with London firms holding £219,000 and firms in Wales, Midlands, East of England holding a balance of £12,000.
Firms bank on borrowingTable 19 looks at the capacity to borrow more money, compared to annual fees, when considering the year-end office account balance and the overdraft facility available. It’s interesting to see that the median figure, at 10% of fee income, represents about 37 days (40 days last year) of income.
The lower quartile point is about 18 days and the upper quartile point represents about 66 days of income. This highlights how quickly and easily many firms could find themselves insolvent if their lock-up deteriorates by even relatively small amounts.
Firms can easily become less reliant on bank finance if more partner capital is introduced and then retained. One simple way of benchmarking partner capital is to express it as a percentage of annual fees.
Given that the median firm has a total lock-up of 109 days, as Table 17 illustrates, this could be potentially financed by having partner capital equal to 30% of fees.
Law firms have always been prudent operations and traditionally they do not feel comfortable with too much debt
The figures highlight just how quickly and easily many legal firms could find themselves insolvent if their lock-up deteriorates by even relatively small amounts
NatWest | Corporate & Commercial 272016 Legal Benchmark Report NatWest | 27
Small Large Total
LQ Median UQ LQ Median UQ LQ Median UQ
London 39 113 293 75 312 536 46 219 516
South East 7 21 48 39 314 611 8 48 470
South West -33 14 122 17 144 514 1 78 302
Wales, Midlands, East of England 0 17 61 -172 4 173 -69 12 99
North East, North West 23 47 111 -94 74 472 -29 54 300
Scotland -24 15 183 28 250 593 1 59 333
Total -3 31 111 -23 125 472 -8 54 310
Very large firms -78 184 624 134 475 1,106 1 359 956
Small Large Total
LQ Median UQ LQ Median UQ LQ Median UQ
London 10% 19% 35% 7% 12% 18% 8% 13% 21%
South East 5% 10% 12% 4% 9% 13% 4% 9% 12%
South West 4% 8% 17% 8% 13% 22% 5% 12% 22%
Wales, Midlands, East of England 7% 12% 21% 3% 9% 14% 4% 10% 15%
North East, North West 9% 17% 23% 6% 12% 21% 7% 13% 23%
Scotland 1% 9% 17% 6% 8% 10% 4% 8% 15%
Total 4% 11% 21% 5% 10% 17% 5% 10% 18%
Very large firms 5% 10% 15% 7% 11% 14% 6% 11% 15%
Table 18 Year-end bank balance (£’000s)
Table 19 Capacity in overdraft as a percentage of fees
Year-end bank balance (£’000s)For small firms (median)
£113,000The median year-end bank balance
for a small firm in London
21
47
15
17
14

2016 Legal Benchmark Report NatWest | 28
Small Large Total
LQ Median UQ LQ Median UQ LQ Median UQ
London 10% 27% 60% 21% 31% 47% 19% 31% 49%
South East 10% 24% 41% 19% 30% 37% 14% 29% 39%
South West 10% 19% 30% 17% 31% 43% 12% 26% 41%
Wales, Midlands, East of England 13% 19% 35% 19% 28% 34% 17% 25% 35%
North East, North West 16% 35% 43% 22% 36% 46% 19% 35% 45%
Scotland 6% 24% 47% 27% 28% 41% 13% 28% 42%
Total 11% 24% 42% 20% 30% 42% 16% 28% 42%
Very large firms 22% 29% 39% 25% 35% 46% 24% 31% 43%
20 Partner capital as a percentage of fees
21 Percentage of partner capital borrowed Small Large Total
LQ Median UQ LQ Median UQ LQ Median UQ
London 0% 3% 22% 12% 41% 57% 3% 30% 57%
South East 0% 0% 30% 0% 20% 60% 0% 1% 56%
South West 5% 48% 117% 22% 58% 135% 13% 52% 126%
Wales, Midlands, East of England 14% 38% 134% 28% 72% 141% 21% 57% 137%
North East, North West 23% 36% 69% 23% 53% 103% 23% 48% 92%
Scotland 13% 32% 71% 36% 69% 129% 19% 43% 91%
Total 3% 32% 71% 16% 53% 117% 10% 44% 100%
Very large firms 19% 56% 131% 31% 57% 124% 25% 57% 131%
More capital in the NorthTable 20 illustrates the current partner capital as a percentage of fees, and the overall median figure is 28%. On this measure, North East and North West firms have more capital than in any other region, at 35% of annual fees. Small firms have a median figure of 24%, large firms have a median of 30% and very large firms currently have a median of 31% – this is in line with the higher levels of lock-up seen in larger firms in table 17.
Banks are more comfortable where the percentage of borrowings against partner equity is lower and where the partners can demonstrate that
they clearly have a level of personal financial commitment to the firm.
Exposed firms should rethinkTable 21 shows the percentage of bank borrowings (including borrowed partner capital) as a percentage of real partner capital. The lower quartile figure for small firms is 3%, showing that there is negligible debt while the median figure for all firms is 44%.
The median figure of 44% is up from 36% in the previous year and could suggest that capital accounts are being depleted with no strategy to retain profits, which would be a concern. The upper quartile figure for large
firms in Wales, Midlands and the East of England stands at 137%, showing borrowings which are in excess of real partner capital. Firms in this position should think again about their facilities, the amount of capital being provided by the partners, and the ability of the firm to manage lock-up, as their bank may become less happy to continue to provide so much finance in future.

NatWest | Corporate & Commercial 292016 Legal Benchmark Report NatWest | 29
Small Large Total
LQ Median UQ LQ Median UQ LQ Median UQ
London 29% 120% 366% 10% 22% 208% 10% 36% 269%
South East 115% 226% 369% 129% 248% 359% 113% 237% 361%
South West 80% 264% 457% 31% 190% 263% 45% 199% 369%
Wales, Midlands, East of England 148% 281% 428% 114% 176% 315% 121% 224% 373%
North East, North West 88% 172% 426% 0% 55% 149% 3% 91% 224%
Scotland 77% 135% 242% 29% 79% 259% 41% 132% 242%
Total 93% 200% 408% 24% 122% 269% 40% 160% 328%
Very large firms 13% 104% 235% 20% 75% 142% 20% 83% 187%
Many firms carry significant client account balances. While this money does not belong to it, the firm has been able to earn premium interest on such money held in general client account, over and above what the individual clients would have got had their money been held in client account. The returns in recent years have been considerably lower because of long-term low interest rates, but this might change in the future. The amount of money held is also an indicator of how busy a firm might be and the value of its transactions.
Called to account Table 22 shows the client bank balance at the year-end as a percentage of annual fees. The median figure for small firms, at 200%, is significantly higher than the median figure for large firms, at 122%. The median figure for very large firms is lower again at 83%. In three regions, the upper quartile figure is a little above 360%, representing 3.6 years of fee income.
The median figure for all firms is 160%, compared with 153% last year, with regional variations peaking at 237% in the South East. London has the lowest median figure of 36%, which might suggest that these firms are now doing less property work than some of the regional firms. Given that the survey covers firms with combined fees of £1.43bn, this suggests that if client money balances are 160% of fees, the total client money held will be around £2.29bn.
In recent years, returns from client account have been considerably lower because of long-term low interest rates
There have been some significant thefts from client account in recent months, and all firms should look again at their security measures in order to minimise the risk of this happening to them. Organised crime gangs have been operating more sophisticated phishing and vishing attacks on law firms who are known to have significant cash balances.
22 Client bank balance as a percentage of fees
Firms should look again at their security measures. Organised crime gangs have been operating more sophisticated phishing attacks on law firms
£2.3bnThe estimated total client money held by firms taking part in the survey

2016 Legal Benchmark Report NatWest | 30
>-20% -10-20% -0-10% zero +0-10% +10-20% >20%
Fees < £1.5m
Bank balance 1 1 5 50 31 10 3
Fees > £1.5m
Bank balance 3 2 6 40 31 14 5
Total
Bank balance 2 1 5 44 31 12 4
Predictions from the NatWest conferences… what will happen in 2016?
Last year, only 10% of conference delegates predicted that their bank balance would fall in the following year and this figure has dropped to 9% this year. This is interesting, as the median bank balance actually has fallen in the last year, as Table 18 indicates. The position may deteriorate even further over the next year if firms continue to grow and fail to manage their lock-up more effectively.
Firms’ bank balances: percentage movements in 2016KEY QUESTIONS1. Do we have sufficient capital to run the business now, and will we need more capital as the firm grows?
2. Is it time to look again at our legal structure and how capital is to be retained within the firm?
3. Is it right that we aim to fully distribute profits?
4. Do we need to think again about how quickly new partners are asked to contribute capital, and how quickly departing partners can extract their capital?
9%of firms predict that their bank balance will fall this year

NatWest | Corporate & Commercial 312016 Legal Benchmark Report NatWest | 31
Total median figures Accountants Solicitors
Fees per equity partner £435,000 £480,000
Fees per fee earner £137,000 £144,000
Profit per equity partner £108,000 £111,000
Profit as a percentage of fees 26% 24%
Total fee earners per equity partner 3.00 3.20
Chargeable hours per fee earner 1,000 1,000
Recovered rate per hour £119 £162
WIP days 42 56
Debtor days 75 48
Total lock-up days 120 109
In 2015, a similar survey to this one was conducted for accountancy firms of a similar size to those that take part in this survey of law firms. It was prepared in the same way as this report, and it’s interesting to compare the performance of law firms with accounting firms. It might be expected that the results would be very similar, as both professions are providing professional services to the same clients.
The results of the comparison can be seen in Table 23. Solicitors generate 10% more fee income per equity partner than accountants. The revenue generated per fee earner is 5% higher for solicitors and gearing in law firms is also higher at 3.20, compared to 3.00 in the accountancy sector.
Solicitors profit most The profit per equity partner is similar for both professions, but solicitors are ahead by £7,000 per partner. Perhaps more interestingly, the margin in accountancy firms at 26% is higher than in legal firms, where it is 24%.
Perhaps unsurprisingly, the expenses per equity partner in accountancy firms are lower, at £327,000, than in legal businesses, where the figure stands at £369,000. Given that accountants will often advise on cost management, it would be worrying if this result had not materialised.
Spending more money in the law firm did, however, result in a higher income figure, and this resulted in a slightly higher profit. Perhaps the lesson is that you need to invest to maximise income, productivity and profits.
Levels of chargeable time recorded are the same in both professions at 1,000 hours, which equates to just 4.4 hours per day. Both professions should think again whether everyone is recording all of their time properly. A lawyer recovers £162 per hour while an accountant recovers only £119 per hour. The two professions might like to debate whether this is because lawyers are providing a more complex service or because lawyers are more confident when discussing fees.
Whatever the reason, all professionals should maximise recovered revenue per hour, as this will boost revenue per fee earner and firm profitability.
Time to seek legal adviceLawyers beat accountants at total lock-up management by 11 days. Perhaps some accountants should take some advice on WIP and debtor management from lawyers, rather than the other way around?
It’s also notable that accountants are better than solicitors at getting bills out quickly, but that solicitors are better at collecting outstanding bills. This might have something to do with the fact that law firms offer debt recovery as a service to clients.
My career has been about trying to help professional firms improve their financial performance. Lawyers have always benchmarked against other lawyers, and accountants have looked to other accountants. I hope this report will encourage both professions to consider their own performance and strive to improve their results next year.
What can solicitors learn from accountants?
23 Comparing accountants with solicitors
£7kSolicitors earn £7,000 more in profit per equity partner than accountants

2016 Legal Benchmark Report NatWest | 32
Key trends at a glanceFrom fees to finances, track the rise and fall of the survey’s findings across the last four years and see which way the trends are moving
Fees
Lock-up
193180 181
200
144
113138
104
136
108132
101
2013 2014 2015 2016
LQ Median UQ
Fees per fee earner (£’000s)
2013 2014 2015 2016
LQ Median UQ
Fees per equity partner (£’000s)
676 680
835 831
480
307
473
298
425
275
393
262
2013 2014 2015 2016
LQ Median UQ
WIP days
82 84
9887
56
28
55
31
52
28
54
26
Debtor days
2013 2014 2015 2016
LQ Median UQ
6973 71
48
29
47
30
50
27 30
47
69
Total lock-up days
2013 2014 2015 2016
LQ Median UQ
148 153 152
70
107
76
104
69 77
109
146
109

NatWest | Corporate & Commercial 332016 Legal Benchmark Report NatWest | 33
Finances
2013 2014 2015 2016
LQ Median UQ
Partner capital as a percentage of fees
242526
282726
30
28
24
29
2726
Profits
2013 2014 2015 2016
LQ Median UQ
3331
24
12
23
15
Profit as a percentage of fees
33 33
23 24
15 15
2013 2014 2015 2016
LQ Median UQ
Profit per equity partner (£’000s)
107
190 191
55 544648
1118790
147160
Gearing
2013 2014 2015 2016
LQ Median UQ
3.41
5.21 5
2.142
3.22.883
4.764.38
2 2
Recorded chargeable hours per fee earner
2013 2014 2015 2016
LQ Median UQ
1106
970
880915
750
1000 1000
1198
1000 1000
Recovered rate per hour (£)
2013 2014 2015 2016
LQ Median UQ
103114107
118136
162
188
140150
189 191
224

2016 Legal Benchmark Report NatWest | 34
Conclusion
We have already detailed how important it is for all firms to benchmark themselves against their peers in order to assess how well they are performing and to identify how financial performance can be improved.
We hope that this report provides the robust data required to undertake effective benchmarking, and that it offers practical advice on how to interpret the outputs and implement strategies to deliver improved financial performance.
To aid you in this objective, the following table gives you the ability to examine your own firm’s performanceon a comparative basis against the upper quartile (UQ) output across total firms.
For some, the results may be worrying but will hopefully motivate the implementation of an action plan.For others, this exercise will serve to simply endorse the business plan and operational model already in place.
Research and methodologyWe analysed the financial data, representing the performance of 390 legal firms operating in the small-to-medium enterprise (SME) space, employing 17,200 people in total (including 1,807 partners), and
covering year-end 2015. The total for all regions in each table represents the aggregate figure for all participating firms, across all regions. Furtherdetails of the methodology of this report are available on request.
For the purposes of this report, those firms with fees of less than £1.5m are described as ‘small’, while those with fees in excess of £1.5m are described as ‘large’. The report also refers to ‘very large’ firms, those with fees in excess of £5m.
UQ Firm’s ratio Actions required
Fees per equity partner (£000s) 831
Fees per fee earner (£000s) 200
Profit as % of fees (%) 33
Profit per equity partner (£000s) 191
Chargeable hours (per year) 1106
Recovered rate per hour (£s) 224
LQ Firm’s ratio Actions required
WIP days 28
Debtor days 29
Total lock-up (days) 70
NatWest | Corporate & Commercial 352016 Legal Benchmark Report NatWest | 35
Want to know more?If you have any comments on the contents of this report or would like to have a discussion on any aspect of the legal profession more generally please contact: Steve Arundale, Head of Commercial Professional Sectors, NatWest
020 7672 1917 Calls may be recorded. Call charges may vary.
DisclaimerThe author, Robert Mowbray, is achartered accountant who has workedfor professional firms for more than 30years. Opinions expressed in thispublication are those of the author andnot necessarily those of NatWest or thepublisher.
The contents of this document are indicative and are subject to change without notice. This document is intended for your sole use on the basis that before entering into this, and/or any related transaction, you will ensure that you fully understand the potential risks and return of this, and/or any related transaction, and determine it isappropriate for you given yourobjectives, experience, financial andoperational resources, and otherrelevant circumstances. You shouldconsult with such advisors as you
deem necessary to assist you in making these determinations. NatWest will not act as your advisor or owe any fiduciary duties to you in connection with this, and/or any related transaction, and no reliancemay be placed on NatWest for advice or recommendations of any sort.
NatWest makes no representations or warranties with respect to the information and disclaims all liability for any use you or your advisors make of the contents of this document.
NatWest and its affiliates, connected companies, employees or clients may have an interest in financialinstruments of the type described in this document and/or related financialinstruments.
Such interest may include dealing, trading, holding, acting as market-makers in such instruments and may include providing banking, credit and other financial services to any company or issuer of securities orfinancial instruments referred toherein.
National Westminster Bank plc.Registered office: 135 Bishopsgate,London EC2M 3UR. Registered inEngland No. 929027. NatWest areauthorised by the Prudential RegulationAuthority and regulated by the Financial Conduct Authority and the Prudential Regulation Authority. A Royal Bank of Scotland Group company.