corporate climate responsibility
TRANSCRIPT

CorporateClimate Responsibilityextended application
to indirect emissions
Scope1
Scope2
Scope3

March 2016
Author:Meike Fink || Climate & Energy Project ManagerRéseau Action Climat (RAC-F)
Support:This publication was completed with the support of Ademe and the Ministry of the Environment, Energy and the Sea.The authors are solely responsible for the content of the document, which do not necessarily reflect the views of the financiers and companies analysed. The financiers cannot be held responsible for the use made of the information contained herein.
Layout: Christian Mattiucci
ISBN 978-2-919083-07-7

Introduction, summary and recommendations 5
Scope of the study 5
Summary of the study 6
Glossary 14
Report on greenhouse gas emissions and climate target Profiles of the different companies analysed 15
Climate targets of companies 16
Carbon reports of companiesCDP & Beges 18

5
Corporate Clim
ate R
esponsibility
Introduction, summary and recommendations
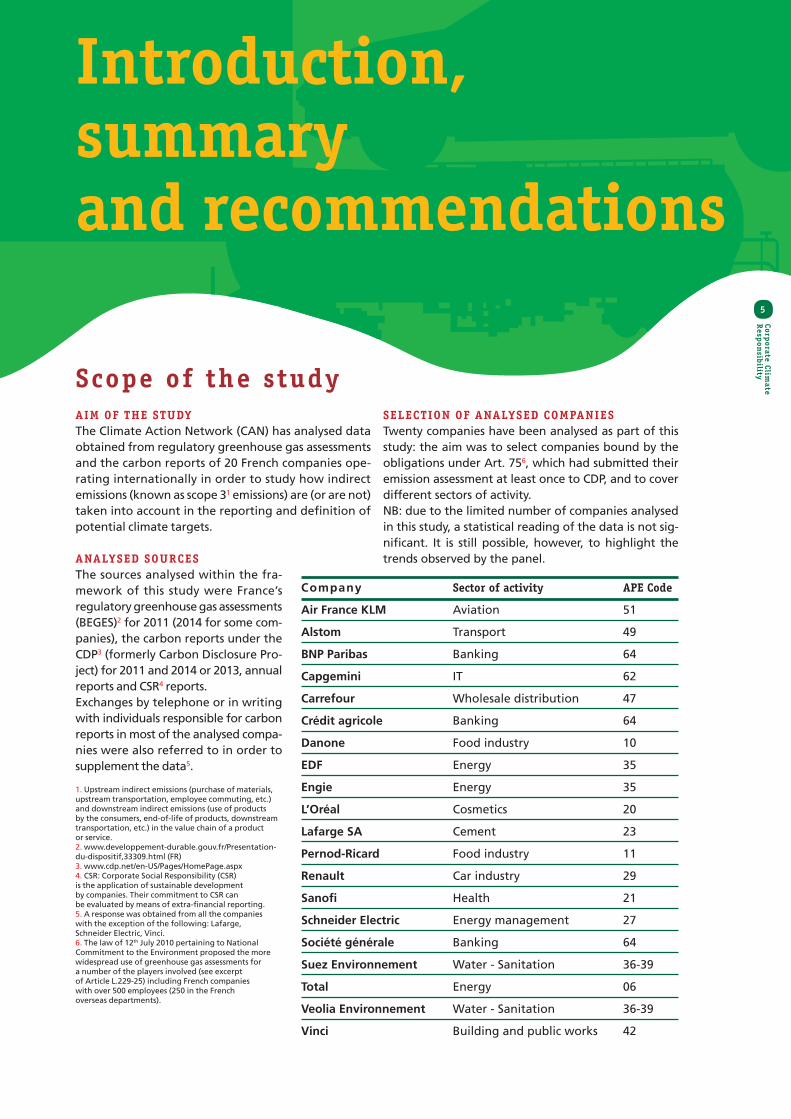
Scope of the studyAIM OF THE STUDYThe Climate Action Network (CAN) has analysed data obtained from regulatory greenhouse gas assessments and the carbon reports of 20 French companies ope-rating internationally in order to study how indirect emissions (known as scope 31 emissions) are (or are not) taken into account in the reporting and definition of potential climate targets.
ANALYSED SOURCESThe sources analysed within the fra-mework of this study were France’s regulatory greenhouse gas assessments (BEGES)2 for 2011 (2014 for some com-panies), the carbon reports under the CDP3 (formerly Carbon Disclosure Pro-ject) for 2011 and 2014 or 2013, annual reports and CSR4 reports.Exchanges by telephone or in writing with individuals responsible for carbon reports in most of the analysed compa-nies were also referred to in order to supplement the data5.
1. Upstream indirect emissions (purchase of materials, upstream transportation, employee commuting, etc.) and downstream indirect emissions (use of products by the consumers, end-of-life of products, downstream transportation, etc.) in the value chain of a product or service. 2. www.developpement-durable.gouv.fr/Presentation-du-dispositif,33309.html (FR)3. www.cdp.net/en-US/Pages/HomePage.aspx4. CSR: Corporate Social Responsibility (CSR) is the application of sustainable development by companies. Their commitment to CSR can be evaluated by means of extra-financial reporting.5. A response was obtained from all the companies with the exception of the following: Lafarge, Schneider Electric, Vinci.6. The law of 12th July 2010 pertaining to National Commitment to the Environment proposed the more widespread use of greenhouse gas assessments for a number of the players involved (see excerpt of Article L.229-25) including French companies with over 500 employees (250 in the French overseas departments).
Company Sector of activity APE Code
Air France KLM Aviation 51
Alstom Transport 49
BNP Paribas Banking 64
Capgemini IT 62
Carrefour Wholesale distribution 47
Crédit agricole Banking 64
Danone Food industry 10
EDF Energy 35
Engie Energy 35
L’Oréal Cosmetics 20
Lafarge SA Cement 23
Pernod-Ricard Food industry 11
Renault Car industry 29
Sanofi Health 21
Schneider Electric Energy management 27
Société générale Banking 64
Suez Environnement Water - Sanitation 36-39
Total Energy 06
Veolia Environnement Water - Sanitation 36-39
Vinci Building and public works 42
SELECTION OF ANALYSED COMPANIESTwenty companies have been analysed as part of this study: the aim was to select companies bound by the obligations under Art. 756, which had submitted their emission assessment at least once to CDP, and to cover different sectors of activity.NB: due to the limited number of companies analysed in this study, a statistical reading of the data is not sig-nificant. It is still possible, however, to highlight the trends observed by the panel.

6
What is the responsibility of companies as far as climate is concerned?According to a recent study, 78% of the world’s industrial
CO2 and methane emissions were produced in 2010 by only
90 companies, notably through the production and sale of
hydrocarbons and cement7. This distribution of greenhouse
gas (GHG) emissions points to the responsibility of producers
(companies) as regards climate issues. The GHG generated
by products sold to end users, such as fossil fuels for heating
and transport and cement for building houses, are taken into
account in the carbon assessment of production companies8.
In 2014, emissions linked to sales of fossil fuels accounted for 92% of Total’s global emissions (scope 1, 2 and 3). Another example which highlights the importance of the scope applied when assessing the responsibility of certain companies as regards climate issues is the following: if the total emissions produced by Crédit agricole are calculated taking into account emissions linked to funded activities, Crédit agricole alone produces the equivalent to one third of the emissions produced by mainland France9. By comparison, the direct emissions produced by Crédit agricole’s buildings and commuting by its employees accounts for only 0.4%.
The presentation of a company’s carbon impact is therefore
largely dependent on the scope of the analysis, which is
generally defined by the company itself. Nowadays, the
consideration of indirect emissions (scope 3) is recommended
but remains voluntary within the framework of statutory
greenhouse gas assessments in France10 and reports such as
the CDP (Carbon Disclosure Project 11) which are in themselves
voluntary mechanisms. The methods used in presenting
emissions within the framework of the CSR reports therefore
do not appear to be particularly regulated as regards scope
3 assessments12.
In order to interpret a company’s carbon report and to be able
to assess its aims in terms of reduction targets it is important to
consider the scope applied by the company in the evaluation
of its emissions. It is only possible to determine whether the
relevant emissions have been taken into account in the report
and in the definition of a company’s climate strategy if it presents
the overall impact of its activities on climate in its greenhouse
gas assessment.
This is a prerequisite in terms of being able to consider whether
a company’s greenhouse gas reduction target corresponds
to the aim of obtaining global warming levels well below 2°C,
or even 1.5°C13.
The significance of indirect emissionsWith the exception of certain sectors of activity, such as those
governed by the EU Emissions Trading System (EU ETS), for
which scopes 1 and 2 generally represent the most significant
emissions, scope 3 may easily soon represent 3 or 4 times
the emissions of scopes 1 and 2.
For example, the scope 3 emissions of Renaults, which draws up comprehensive reports on this scope, accounted for 99% of its reported emissions in 2014. However, the indirect emissions of Air France, which has also provided information on several scope 3 categories, only represent 8% as the majority of emissions are produced by kerosene combustion which is recorded under direct emissions in scope 1.
Summary of the study
Average emissions for scope 1, scope 2 and upstream scope 3 categories in 2015 Source: CDP (2015) “Committing to climate action in the supply chain” (4,000 companies analysed)
0
100 000
200 000
300 000
400 000
500 000
average of scope 1
average of scope 2
average of upstream scope 3
Intr
od
uct
ion
, su
mm
ary
an
d r
eco
mm
end
atio
ns

7
Corporate Clim
ate R
esponsibility
The analysis of the reports sent to the CDP concerning
4,000 emission assessments (for its 2015 report14) shows
that emissions upstream of the value chain are, on average,
equivalent to twice the level of scope 1 and 2 emissions produced
by a company. This difference may even be up to 7 times in the
case of companies specialising in the distribution of goods to
the end user. In its 2015 report, the CDP team noted that two-
thirds of the respondents publish emissions corresponding to at
least two scope 3 categories. It is quite surprising to note that
this rate increased from 29% to 63% between 2010 and 2015.
No analysis has been carried out, however, on the manner in
which companies take “relevant” categories into account in
the selection of the reported emission categories.
The graph above, corresponding to 2013, provides some initial
indications; it shows both the percentage of companies which
presented a report for every scope 3 category and the total
emissions for each category.
The category appearing the most in the companies’ reports
(70%) is that of business travel, which is fairly insignificant in
terms of climate impact. The “Use of sold products” category15,
reported by less than 30% of the companies, represents
10 times more emissions than the next most relevant category,
“Purchased goods and services”.
On a macroeconomic level, the analysis of the distribution of
emission levels for the 3 scopes16 for different sectors of activity,
in order to correspond to final demand in France in 200717
(below), reveals some very different “carbon profiles”. The
average scope 3 emission (emissions are not differentiated
according to the scope 3 categories but according to their
origin: notational or imported) is equivalent to 63%, which
confirms the significance of the latter.
7. Heede, Richard (2014) “Tracing anthropogenic carbon dioxide and methane emissions to fossil fuel and cement producers, 1854–2010”; Climatic Change (2014) 122:229–241This study also highlights the historical responsibility of these 90 companies. They were responsible for 63% of all emissions between 1751 and 2010.8. This is a way of presenting the extended responsibilities of a player. The end user is the “direct” player as far as his emissions are concerned and should of course be concerned about his carbon footprint! It is not enough simply to state that responsibility lies solely with the company supplying the fuel.9. Rose, Cochard, Courcier (2013) “Pour une approche catabolique de l’empreinte carbone induite des établissements financiers”, Jan-Mars 2013 Analyse financière N° 46 (FR)10. The law of 12th July 2010 pertaining to National Commitment to the Environment proposed the more widespread use of greenhouse gas assessments for a number of the players involved (see excerpt of Article L.229-25) including French companies with over 500 employees (250 in the French overseas departments assessments).11. www.cdp.net/en-US/Pages/HomePage.aspx12. A methodological guide intended to supplement the European Directive on CSR (2014/95/EU) is currently being examined.13. Text of the Paris agreement: https://unfccc.int/resource/docs/2015/cop21/eng/l09r01.pdf14. CDP (2015) “CDP Rapport sur le changement climatique 2015 – France et Benelux” www.cdp.net/CDPResults/CDP-France-Benelux-climate-change-report-2015-French.pdf (FR)15. Most of the emissions of this category stem from sales of fossil fuels to end customers. Intervention in this category will require public authorities to commit to developing alternative energy models, consumers to change their behaviour and companies to open out their business models to incorporate activities which are more in line with the energy transition.16. With the exception of indirect emissions from the combustion of fossil fuel for residential heating and the use of private cars, which are not reallocated to the car manufacturing industry.17. Emissions due to the production of exported goods are therefore not considered in this presentation.
Percentage of companies providing information on different scope 3 categories and emissions reported by categorySource: CDP (2013) Global 500 Climate Change Report 2013
0
1 000
5 00040
2 000
10
0
6 00050
3 000
20
7 000 60
4 000
30
8 000 70
9 000 80
% of respondingcompanies
Absolute emissions Millions tCO2e
Busi
ness
trav
el
Was
te g
ener
ated
in o
pera
tions
Purc
hase
d go
ods
and
serv
ices
Ups
trea
m tr
ansp
orta
tion
and
dist
ribut
ion
fuel
-and
-ene
rgy-
rela
ted
activ
ities
Empl
oyee
com
mut
ing
Dow
nstre
am tr
ansp
orta
tion
and
dist
ribut
ion
Use
of s
old
prod
ucts
Capi
tal g
oods
End
of li
fe tr
eatm
ent o
f sol
d pr
oduc
ts
Ups
trea
m le
ased
ass
ets
Dow
nstr
eam
leas
ed a
sset
s
Inve
stm
ents
Proc
essi
ng o
f sol
d pr
oduc
ts
Fran
chis
es
Oth
er (D
owns
trea
m)
Oth
er (U
pstr
eam
)
Emissions millions t CO2e
Percentage of companies

8
“Imported” emissions19
The studies conducted as part of the Global Carbon Project have shown that 70% of the decrease in emissions on European terri-tory between 1990 and 2012 have been “cancelled out” at 70% by the increase in imported emissions. According to these studies, only three countries account for two-thirds of these imported emissions: China, India and Brazil. The decline in industry and the development of the tertiary sector in Europe (which varies from one country to the next but is ongoing) is creating a growing need for imported finished and semi-finished products formerly produced in the domestic market. Thus, developed countries have managed overall to reduce greenhouse gas emissions on their ter-ritory while generating in return an increase in indirect emissions in the countries from which they obtain their supplies. Work on supply chains which are generally spread out all over the world is therefore becoming increasingly important20. Scope 3 emissions can therefore be divided up according to the activities concerned and their origin (domestic or imported).
Contribution of direct and indirect upstream emissions from the 30 most important sectors in terms of GHG impact of national consumption Source: Ademe (2007 data CGDD/SOeS)18
100 %
90 %
80 %
70 %
60 %
50 %
40 %
30 %
20 %
10 %
0 %Imported emissions
Indirect emissions (France)
Agric
ultu
re, H
untin
g, S
ervi
ces
Inst
rum
ent e
ngin
eerin
g
Chem
ical
indu
stry
Publ
ishi
ng &
Prin
ting
wor
k
Rese
arch
& D
evel
opm
ent
IT re
late
d ac
tiviti
es
Mac
hine
tool
pro
duct
ion
Fina
ncia
l int
erm
edia
tion
Real
est
ate
activ
ities
Heal
th &
Soc
ial w
ork
Hote
ls &
rest
aura
nts
Toba
cco
indu
stry
Educ
atio
n
Oth
er m
iner
al-e
xtra
ctin
g in
dust
ries
Wat
erw
ay-t
rans
port
Fina
ncia
l aux
iliar
ies
Rubb
er p
roce
ssin
g in
dust
ry
Coal
min
ing
Scope 2 (Electricity)
Scope 1 (Direct emissions)
Depending on the sector of activity and the specific features
of the companies, the scope 3 categories represent a varying
share in the global carbon footprint, and hence in the
greenhouse gas reduction strategy resulting from it.
Focusing only on emissions under the first two scopes gives a
company the advantage of being able to concentrate on its
own means of production, using more accessible, reliable data
and avoiding duplicate calculations on a larger scale (nationally
or worldwide), but there is also a risk of failing to address the
real issue and missing out on potential reduction targets.
If we take the example of the 3 banks analysed here (BNP Paribas, Crédit agricole and Société générale), none of them provides information about the emission categories financed through investments in their carbon reports.For a company wishing to implement a large-scale strategy to
reduce its climate impact, it is therefore crucial to analyse the
distribution of its emissions between the 3 emission categories
before considering defining relevant targets.
Quite often, an analysis of scope 3 emissions highlights strategic
issues and vulnerabilities linked to greenhouse gas emissions
or “carbon risks21”.
If a company is involved in upstream or downstream activities
which produce high levels of carbon emissions, any public policy
to reduce emissions norms, carbon price, etc.) may have a deep
impact on it, generally by changing its economic model due to
fluctuations in supply and demand and profitability. The best
Intr
od
uct
ion
, su
mm
ary
an
d r
eco
mm
end
atio
ns

9
Corporate Clim
ate R
esponsibility
way to anticipate this issue is to start working on reducing their
carbon footprint. The company therefore needs to involve its
producers, suppliers, carriers, etc. in order to develop or chose
low-carbon solutions (for example by choosing low-emission
agricultural production methods, low-carbon transport with
full vehicles, lighter packaging, etc.) but also to consider
working on their customers’ behaviour if this seems relevant
in terms of reduction potential.
Mixed results from the analysis of carbon reports and climate targetsAll the companies analysed by CAN declared to CDP22 that that
all or some of their scope 3 emissions were voluntary while
only 40% of the same companies did so within the French
statutory framework. However, while it is not mandatory,
the consideration of scope 3 emissions is recommended under
the statutory method23.
A further observation relates to whether or not the
relevant emission categories, which vary a great deal from
one company to the next but are generally moving in the
right direction, are taken into account The CDP comparison
between 2011 and 2014, for example, shows for the analysed
companies, an increase in reports on the relevant24 scope 3
categories. Therefore it is not simply the number of scope 3
categories appearing in the reports which is increasing but
also the relevance of emissions, which is progressing in the
right direction.
For example, between 2011 and 2014, L’Oréal extended its scope 3 report from 1 to 11 categories, including the two most relevant, namely “purchased products” and “use of sold products”. Reference should also be made to Sanofi which increased the number of reported scope 3 categories from 1 to 10 over the same period, taking the most relevant categories into account.
Due to the limited number of companies analysed in this
study, a statistical reading of the data is not significant. It is
still possible, however, to highlight the trends observed by
the panel.
According to CDP, the number of reported scope 3 categories
increased from 3 to 6 between 2011 and 2014. In 2011, 65%
of the companies had reported only 1 or 2 scope 3 categories
(frequently the professional travel category), a percentage
which dropped to 32% in 2014. That same year, 42% of the
companies provided information on between 9 and 11 scope 3
categories (the most frequently recorded categories being:
business travel, purchased goods and services, activities
relating to fuel and energy, downstream transportation and
distribution). It can therefore be noted that certain scope 3
categories are becoming increasingly dominant.
“Financed emissions25” a relevant category identified by the banking industry but absent from the report…The companies concerned about their indirect emission are not yet giving full priority to the categories relevant to their industry sector.It is interesting to note, for instance, that banks such as Crédit agricole, BNP Paribas and Société générale provide information on professional travel emissions and establish reduction policies without addressing the investment category in their assessment, which clearly is the most important category26… Aside from the global movement “Divest27” and various state-ments from the banking sector28 showing the growing awareness of the sector, we note that carbon reporting has not yet become a common practice.It is therefore important to distinguish between the calculation method and the purpose of quantification on the one hand and the maturity of internal discussions on the other:: generally, banks are aware of the impact of their investments and are starting to take action in order to reduce that of the financed emissions category (through partial withdrawal from coal financing for instance and the refocusing of investments, etc.)29. It would be particularly helpful to obtain a global monitoring tool to measure the decrease in financed emissions brought about as a result of these actions. This monitoring would make the impact of activities more transparent from an external point of view. The decree of Art 173 of Energy Transition Act, published on 31st December 201530 states the principles which should be met by the accounting methodologies applied to financed emissions. Financial institutions will be subjected to the obligation of repor-ting on the carbon footprint of this category as from the financial year beginning 1st January 2016.
18. Ademe (2013) “Connaissances approfondies de 10 secteurs d’activité prioritaire”; Ref : 7900 (FR)19. Climate Action network has published several studies on the subject which can be consulted on the Website www.rac-f.org20. “EU corporate action as driver for global emissions abattement […]”; Global Environnemental Change 23 (2013) 1795-1806), a study by Andrew Skelten from the Cambridge Centre for Climate Change Mitigation Research, also reveals that the sectors most affected by the outsourcing of carbon emissions are the building and public works industry, the car industry, the clothing industry, retailers, the food industry and services. The latter do not simply provide information on their emissions outside the EU, but also upstream on their EU-based suppliers. This evaluation highlights the close links between the different sectors and the importance of taking these links into account in order to tackle climate change.21. Ademe (2015) “Vidéo : La Finance et le Carbone” (FR) www.bilansges.ademe.fr/fr/accueil/actualite/detail/id/212°C Investing (2013) ”Des émissions financées aux indicateurs de performance climatique” (FR)2°C Investing (2013) “Landscaping carbon risk for Financial intermediaries”2°C Investing (2014) “Carbon Risk for Financial Institutions” http://2degrees-investing.org/fr/#!/page_Resources22. With the exception of Alstom Transport which has chosen no longer to provide information to CDP.23. MEEM (2015) “Méthode pour la réalisation des bilans d’émissions de gaz à effet de serre conformément à l’article L. 229-25” ; Version 3d – September 2015 www.developpement-durable.gouv.fr/Methode-d-etablissement-des-bilans,24300 (FR)24. Identification of relevant categories depending on sector profiles with sector guides available on the resource centre for GHG assessments website of ADEME: www.bilans-ges.ademe.fr/en/accueil/contenu/index/page/sectors-guidance/siGras/0 25. 2°C Investing publications, particularly: 2°C Investing (2013) ”Des émissions financées aux indicateurs de performance climatique” (FR)26. Only Crédit agricole has published the carbon footprint of its financed emissions, calculated according the P9XCA methodology. However, the results do not appear in its climate report.27. http://divestinvest.org/28. For instances, the speeches given by:• Mark Carney, Governor of the Bank of England and Chairman of the Financial Stability Board at Lloyd’s of London, on 29th September 2015: www.bankofengland.co.uk/publications/Pages/speeches/2015/844.aspx• François Villeroy de Galhau, Governor of the Banque de France, on 30th September 2015: www.youtube.com/watch?v=tzoEaQ254_029. Even if divestment from coal and reorientation strategies are not clearly linked to GHG emissions. Today’s driving forces for change are the risks linked to public image and profitability. (cf. coal collapsing).30. www.legifrance.gouv.fr/affichTexte.do;jsessionid=B7CFFF130C4D308A5D1AE0614ED12FEB.tpdila08v_1?cidTexte=JORFTEXT000031740341&dateTexte= (FR)

10
Only 40% of companies provided information on scope 3
categories in the 2011 French GHG assessment. Those that
did so provided information on their emissions relating to
5 categories on average with certain categories being referred
to in the majority of cases: business travel, purchased goods
and services, waste generated in operations, employee
commuting and amortisation of assets.
Between 2004 and 2011, the voluntary programme conducted
by the Ademe, the Bilan Carbone® allowed companies, in
France in particular, to become acquainted quite early on with
the concept of indirect emissions. On an international level,
the GHG Protocol only published methodological elements
for scope 3 in 2011 and 2013. The majority of companies on
the panel therefore stated in their reports to the CDP in 2011
that they used the Bilan Carbone® methodology. It may
have been expected, therefore, that more companies would
have provided information on scope 3 emissions within the
framework of the greenhouse gas assessment than in the
report to the CDP, but this has proven not to be the case.
When consulted on the difference between considering
scope 3 according to the Bilan Carbone® or CDP, the vast
majority of the companies explained that they experienced
difficulties with the consolidation method. They considered
that it was more difficult, time consuming and of little use to
extract indirect emissions from their activities based in France,
as a strictly administrative body, rather than consolidating all
of the indirect emissions of a group operating internationally.
Vinci, for example, owns 32 French subsidiaries bound by
the obligation of carrying out a GHG assessment pursuant
to Article 75 of the Grenelle II act. This explains in part the
company’s choice of focusing on the statutory scopes –
scopes 1 and 2.
Therefore, the lack of data on scope 3 in statutory assessments
would not imply a lack of sensitivity and awareness regarding
the issue of indirect emissions.
Admittedly, the reallocation of scope 3 emissions to a
company’s specific activities would imply an additional work
load31 but this may also prove useful in the establishment and
following-up of a plan of action.
The usefulness of this approach depends on the company
concerned and each scope 3 category. Choosing to calculate
the carbon impact of France-based activities is highly relevant
since this calculation allows for a comparison with the
company’s average and an identification of local solutions
to tackle issues specific to France. Moreover, some categories
such as employee commuting or downstream and upstream
transportation require solutions to be defined locally with
employees and suppliers of goods.
Therefore, there are clearly situations where a scope 3 carbon
reporting at country level is an advantage for a company.
A comprehensive report of this kind is essential due to the
climate emergency in order to achieve a successful GHG
emission reduction strategy which has to fall within the global
dynamic of France’s national low-carbon strategy32 defining
“carbon budgets” for France.
How to define a company’s greenhouse gas reduction targetsThe great diversity of companies, the specific features of
their production tools, their size, etc. make the definition
of greenhouse gas reduction targets difficult, even within a
particular branch... Besides, the threat of relocation makes a
unilateral approach even more difficult to implement. In the
case of sector-based targets, voluntary agreements are often
the only method used (as in the Netherlands33), this being
evidence of an almost generalised refusal of restrictive norms
or regulations from the companies which consider them an
impediment to commercial activities.
The same goes for the international negotiations on the
climate: scientists, particularly those on the IPCC, identified
the limits of the climate system and we know the maximum
carbon budgets that can be allocated in order to remain
within a particular climatic range. This information does not
however indicate how other emissions should be allocated.
Who should still be allowed to produce emissions and for how
long? It is important for companies operating worldwide, with
branches in several countries, to ascertain who is to decide on
such matters remains.
Even if methodological approaches are developing and
offering different choices on the allocation of the remaining
carbon budgets between the different sectors34, we are still
on a path where voluntary commitments remain predominant
but largely insufficient in relation to the climate emergency.
However, more and more companies (particularly multinational
companies) are establishing GHG emission reduction targets.
It is essential to ensure that the targets are in the line with a
scenario or carbon budget where the increase in temperature
remains below 2°C and even 1.5°C.
Currently, due to the absence of a global obligation, isolated
voluntary initiatives appear trying to bring an answer to urgent
issues such as: “How to define a greenhouse gas reduction
targets at the scale of an industrial sector?” or “How to take
into account the differences between companies of a same
sector in the definition of the effort to be provided?”
Unfortunately, the question of scope 3 indirect emissions is
often considered as secondary.
Intr
od
uct
ion
, su
mm
ary
an
d r
eco
mm
end
atio
ns

11
Corporate Clim
ate R
esponsibility
In any case, the setting-up of an international verification and
monitoring system is vital in order to control the consistency
of the companies’ commitments with the required ambitions.
The current targets of some of the analysed companies
take on different forms (in terms of intensity or absolute
value), use different scopes (scope 1, scope 3, every scope,
consideration or not of relevant categories), different base
years, varying boundaries (fixed boundaries targets, carbon
intensity targets, GDP unit targets, etc.). There clearly is a need
for standardisation and reference values so as to compare
individual commitments to sectorial ones (where existent) in
order to know whether the targets are consistent with a below
1,5°C scenario.
Therefore, it is vital to ask for the publication of an action
plan in line with the targets39. An equivalent to the INDCs40
should be established for multinational companies to gain
a global overview of the GHG reductions intended by the
private sector’s main players.
The « Science based target » project For instance, up until now, 116 companies have committed35 to set-ting up, in the next two years, greenhouse gas reduction targets “in line with climate science” as part of the “Science based target36” supported by different organisation (CDP, WWF, WRI, UN Global Compact). Moreover, their commitments has to focus on scope 3 emissions if they are significant. This commitment is currently on paper but are these voluntary initiatives really going to make any difference?This project highlights the issue of setting GHG emission reduction targets that respect each sector’s ability to take action and at the same time the global carbon constraint of a below 2°C scenario. It is unfortunate that scope 3 is excluded from the central methodology (even if they can be considered under another form presented in the Annex37) to avoid double counting (see box below).The project also offers methodological angles to decide whether some companies, in a specific sector, should provide more signifi-cant efforts towards a GHG emission reduction. Depending on the carbon intensity, on the geographical activities, etc., the targets can be adjusted.On the other hand, the methodology is still of poor help regarding heterogeneous sectors (such as the chemistry sector) and the accoun-ting of GHG other than CO2.At the moment, it is difficult to state the impact of this ambitious project and others dealing with the same issue.
Scope 2 and 3 || The question of double counting
The aim of such assessments is to be able (at least in theory) to add up the emissions of different companies without any double counting in order to control the compliance with a global car-bon budget and, in that respect, special attention must paid to scope 3. Indeed, the problem arises when we want to add up the emissions of several companies operating in the same value chain or in different sectors.The manufacturing of concrete for example can be accounted for both in the “heavy industry” sector and in the “construc-tion” sector. Emissions linked to the fuel combustion of trucks can be accounted for as direct emissions from the freight company running the truck and as indirect emissions from the car manu-facturer who sold it and from the oil company. Setting up clear allocation regulations is therefore paramount.However, analysing the emissions at the scale of a company is not subject to the same constraints since the heart of the analysis revolves around the company’s impact. This way two companies of a same sector can be compared with each other38.
31. According to APCC (Association des Professionnels en Conseil Climat Énergie et Environnement), a full greenhouse gas assessment costs a company between € 5 000 and € 20 000 depending on the complexity of its structure. www.apc-carbone.fr/bilan-ges/cout-dun-bilan-ges/ (FR)32. www.developpement-durable.gouv.fr/Strategie-nationale-bas-carbone.html (FR)33. These voluntary agreements show that this approach can result in the setting-up of ambitious greenhouse gas reduction targets. The ambition rely most of all on the will and commitments of the companies: http://iepd.iipnetwork.org/policy/long-term-agreement-energy-efficiency-eu-ets-enterprises-lee34. The IEA is showing in these scenarios the importance of various technology options in line with CO2 concentrations (in ppm) matching a 2°C climate trajectory, although without applying to industry sectors. Among these technology options we find Carbon Capture and Storage (CCS), criticised by many, among which Climate Action Network, for the lack of data on its economic and technical feasibility at a larger scale and on the long term. The SEImetrics (2°C Investing, CDP, WWF, Cired etc.), Science Based Targets (CDP, WWF, WRI, UN Global Compact) and Assessing low Carbon Transition Initiative (CDP, ADEME) projects are taking the subject further at the scale of an industry sector end even a company.35. http://sciencebasedtargets.org/companies-taking-action/36. http://sciencebasedtargets.org/ Supporters of the “Science based target” project offer different methods to define science-based targets. One of these methods defines emissions trajectories for different industry sectors (electricity production, cement, chemistry, aviation, etc.) until 2050 , based on the 2°C scenario of the International Energy Agency, IEA (who defines a maximum carbon budget to abide by in order to have a 66% chance to remain below a 2°C increase worldwide by 2100). 37. The “Science based target” project offers to implement scope 2 and 3 emissions reduction targets according to the trajectories of sectors appearing in their methodology and which resemble the most to these categories (for the business travel category they propose for instance to apply the passenger transportation trajectory).38. Ademe, Orse, ABC (2014) « Réalisation d’un bilan des émissions de gaz à effet de serre – secteur financier »www.bilans-ges.ademe.fr/docutheque/docs/guide-3-tomes.pdf (FR)Coslier, Finidori (2015) « Mesurer une méthodologie carbone en ligne avec les enjeux d’un scénario 2°C », Mirova (FR)39. Within the framework of Beges, companies are asked to publish a plan of action in line with their targets. In 2015, ADEME and CDP began an experiment called “ACT: Assessing low-Carbon Transition” aiming at analysing the integration of climate change into corporate strategies according to the industry sector, to the effort made towards a reduction of greenhouse gas (GHG) emissions and to their emission management. Of course, the project currently concerns less companies but it goes deeper into the analysis of the ambition of corporate climate commitments and their plan of action.40. Intended Nationally Determined Contributions (INDCs) is a term used to describe the national contributions towards greenhouse gas reduction which countries had to submit to the Secretariat of the UNFCCC in 2015.

12
A certain number of companies who have converted, sometimes
quite recently, (just before COP21) to “solution sellers” have
been and still are important polluters.
It is essential to look at what lies behind company communication
in order to decipher the GHG emission reduction targets in the
light of what should be done and to uncover green-washing
actions.
If all the member companies of the Action Agenda of
UNFCCC41 were really committed to reductions compatible
with a 2°C or even 1,5°C scenario, we could contemplate the
planet’s climate future more serenely…
Companies – Are they compatible with a 1,5°C world?More and more companies publish greenhouse gas emission
reduction targets but these targets are still not ambitious
enough compared to the reductions required to respect the
carbon budgets compatible with a 2°C or 1,5°C scenario.
It is illusory to think that companies voluntarily commit to
setting up ambitious targets while the governments’ are
insufficient to stay below the 2°C mark.
The “framework” agreement adopted in Paris is promising
the future generations to preserve the increase of the global
temperature below 2°C and even 1,5°C. However, the total of
national commitments (INDC42) submitted to UNFCCC in October
2015 show that we are headed towards a 3°C increase43…
Beyond the global agreement, individual commitments still
need to be analysed in depth in order for them to be revised
where insufficient. It is also vital to draw upon company
contributions, not only on a voluntary basis as is today, but also
in a joint effort under the framework of the global climate
agreement.
If we follow this line of reasoning to its conclusion, companies
should be asked to submit not only reduction targets, but also
reorientation strategies towards business sectors compatible
with ambitious climate pathways. For energy producers
relying heavily on fossil fuels this will mean a radical but,
ultimately, necessary change in their business.
Illusory? It certainly is in the short term but it also is the only
viable way reason dictates.
Engie and EDF’s commitment not to finance new coal power plants is a start but it leaves out the existing power plants: gas and, in CAN’s opinion, nuclear energy44 are two transitional sources of energy the phasing-out of which should be anticipated to avoid ending-up in a situation where gas power plants, built for an operating period of about 30 years, use the remaining carbon budget45…For that matter, this is illustrated by Total communicating about their shift from coal to gas and claiming that their increase in the share of gas used in their production, from 35% to 50% between 2005 and 2014, is an important improvement.
The majority of the highest-emitting companies are trapped
in their own activity and can therefore only reduce emissions
marginally without really breaking away from current business
and consumption models46.
Without significant change, they can only greenwash their
image. Indeed, a true environmental strategy sits at the very
opposite of their business model and would make them non-
profitable or, in the best case scenario, completely change
their activity which they are not necessarily ready to consider.
0 year1700 1750 18501800 1900 2000 21001950 2050 2150
-2 000
1 000
-1 000
5 000
2 000
6 000
3 000
7 000
4 000
8 000
9 000
10 000
CDIAC
RCP2.6
A need for change in Global Warming policies: link between historical CO2 emissions and IPCC’s 2°C pathway (RCP2.6)Source : ACT Initiative. Reconstruction of emissions based on historical emissions data from the Carbon Dioxide Information Analysis Center (CDIAC) and IPCC’s RCP 2.6 scenario (AR5).MtCO2
Intr
od
uct
ion
, su
mm
ary
an
d r
eco
mm
end
atio
ns

13
Corporate Clim
ate R
esponsibility
Example : Total’s flagship climate commitment, which has been fulfilled, was to halve their gas flaring on operating sites between 2005 and 2014. It allowed for a 5 Mt CO2 drop in Total’s global emissions which represents 0,8% of the emissions reported by Total to CDP in 2014.
Climate Action Network’s conclusion and recommendationsClimate Action Network’s analysis shows that half the
companies set GHG reduction targets encompassing only
scopes 1 and 2 (see table on page 16). Other companies like the 3 financial institutions (BNP Paribas, Crédit Agricole and Société Générale) set reduction targets on scope 3 but do not consider the most relevant category, that of financed emissions. Capgemini’s reduction targets do focus on scope 3 but only on part of the emissions reported in the greenhouse gas assessment for their activities in France. Units of measure are often very specific to a company’s activities, making the analysis complex. For instance, a reduction in gCO2/kwh for EDF or a reduction in kgCO2/pallet for Carrefour. Besides, Danone is the only company in the panel which has adopted targets on scope 3 and committed to reductions in absolute terms… but as from 2025 and without quantifiable target…Most companies are aware of the need to do something about
their emissions, particularly that of scope 3. This is due to
a growing awareness regarding risk management linked to
climate change which is seen as a threat to profitability at
various levels. Companies have to anticipate the emergence of
carbon pricing and of the impacts of climate change on their
activities (shortage in water to cool down nuclear reactors,
drought in the agricultural sector).
But this awareness is not enough to ensure that companies
set targets more ambitious and consistent with the climate
emergency. Companies operate in a very competitive
environment with very thin margins, leaving little room for
pioneering. Nonetheless, one may assume that today’s pioneers
will become tomorrow’s leaders. The role played by public policies
(regulation, taxation, public expenses, norms…) is consequently
essential to set boundaries and make things move faster.
The first crucial step towards an increased ambition in climate
commitments will be to reinforce the importance of scope 3
in companies’ reporting. CAN is thus in favour of making
scope 3 compulsory for the most relevant categories as quick
as possible so that companies subjected to this regulation can
have a complete outlook of the indirect emissions entailed by
their activities in France. This will also incite them to investigate
ways of reducing their emissions which are more adapted to
the local situation (compared to a unclear strategy defined a
the scale of a group).
Moreover, it will indeed be important to insist on an obligation
to report significant or relevant categories. In that respect, an
interesting evolution of ISO 14064-1, currently being revised, is
to be noted and which falls within this approach. This change
represents a break from the current reasoning which targets
predominantly scopes 1 and 2.
Article 173 of the Energy Transition Act47 adopted by France
in August 2014 is aiming at reinforcing scope 3 in companies’
carbon reporting48. Climate Action Network is calling in the
actors to seize this opportunity to make relevant categories
reporting compulsory in their CSR documents (and Greenhouse
Gas Assessments at the same time). This way, the diversity in
carbon profiles of the different industry sectors will be observed
while guaranteeing that carbon reporting do not leave aside
the most relevant categories for the setting-up of a climate
action plan.
The application decree49 of Article 173-VI specifies the
information to be published by financial institutions, insurance
companies, asset management companies, etc. regarding the
consideration of environmental criteria within their investment
policy (among others) and regarding the means implemented
to contribute to the energy and ecological transition.
The decree makes provision for a list of criteria to be met by
analysis methodologies (Art 1. III. 3b): they must for instance
measure past, current and future greenhouse gas emissions,
direct or indirect, linked to emitters associated with the
investment portfolio.
If an organisation affected by the decree wishes to accurately
evaluate the impact of companies part of its group of emitters,
the said companies must have published the specifics of their
own climate impact, including indirect emissions. By extension,
companies indirectly targeted by the decree are affected even
before the intended companies.
The decree also states that the chosen methodology should also
indicate the “consistency of the emitters’ investment spendings
with a low-carbon strategy.”
It is indeed essential that investments are made in activities in
harmony with the global energy transition required to remain
within a limited global carbon budget. The most frequent
investments being made into companies, it seems logical that
they have to “prove” on their side the consistency of their
activities with a low-carbon strategy. In November 2015, France
published the first three “carbon budgets” of the National
low-carbon strategy50 for the period going from 2015 to 1018,
from 2019 to 2023 and from 2024 to 2028. It is now up to the
companies to show that their strategy falls within the French
“carbon budgets”.
41. http://climateaction.unfccc.int/companies42. Intended Nationally Determined Contributions (INDCs) : www4.unfccc.int/submissions/indc/Submission%20Pages/submissions.aspx43. UNEP (2015) « UNEP’s Emissions Gap Report » http://drustage.unep.org/node/2087 http://climateactiontracker.org/44. Marignac, Yves (2015) « L’option nucléaire contre le changement climatique - Risques associés, limites et frein aux alternatives » www.rac-f.org/Nucleaire-une-fausse-solution-pour-le-climat (FR) 45. 2° C Investing (2012) “Connecting the dots between climate goals, portfolio allocation and financial regulation” http://2degrees-investing.org/IMG/pdf/climate_allocation_fin-regulation_2deginvesting_2012-2.pdf46. The sale of carbon intensive activities or creation of subsidiary companies as illustrated by e.on creating the Uniper subsidiary, in charge of fossil fuel related activities from January 2016, is obviously not a solution which does not change the global climate impact but allows for a “green” public image.47. www.legifrance.gouv.fr/affichTexte.do?cidTexte=JORFTEXT000031044385&categorieLien=id (FR)48. Art 173 3° III.-A complete article L. 225-37 of the French Commercial Code : companies must now report on the effects of their activities on climate change as well as on the effects of the use of the goods and services they produce.49. www.legifrance.gouv.fr/jo_pdf.do?id=JORFTEXT000031740341 (FR)50. www.developpement-durable.gouv.fr/Strategie-nationale-bas-carbone.html (FR)

14
Beyond a comprehensive and transparent carbon report on
the most relevant categories, it is vital to compel companies to
take on scope 3 GHG reduction targets and a plan of consistent
with a world below 1,5°C. To do so, benchmarks will have to be
formalised for each industry sector by authorised governmental
international organisations51 linked with carbon reporting.
Just waiting for companies voluntary commitments, such as
unilateral reduction targets, the establishment of internal
carbon pricing or the cut in coal financing, etc., to measure
up to what is at stake, is sure the close the door to a world
below 1,5°C.
CAN’S POSITIONCAN advocates an expansion of compulsory reporting to
relevant indirect emissions which better reflects the full climate
responsibility of a company and the reduction potential in
the value chain. This way, companies can define their targets
according to the full scope of their climate impact. To achieve
this, it will be important to make the report of relevant scope 3
categories compulsory as well as the setting-up of targets for
these categories which are consistent with a 1,5°C climate
trajectory along with a regular monitoring of these targets.
➜ Beges Bilan de gaz à effet de serre règlementaire (Regulatory greenhouse gas assessment) according to Art. 75 dated 12 July 2010 pertaining to National Commitment to the Environment.
➜ CDP CDP (formerly Carbon Disclosure Project until late 2012) is a non-profit organisation aiming at studying the impact of the main international companies listed on a stock exchange on climate change
➜ GES Greenhouse gas
➜ Scopes 1, 2 and 3 emissions52
• Direct GHG emissions (or SCOPE 1).Direct emissions emanating from stationary or mobile installations situated within the organisational scope, i.e.: emissions from sources owned or controlled by the organization, such as combustion from stationary and mobile sources, industrial processes excluding combustion, emissions from ruminants, biogas from landfill centres, refrigerant leakages, nitrogenous fertilizers, biomass, etc. • Indirect energy emissions (or SCOPE 2). Indirect emissions associated with the production of electricity, heat or steam imported for the activities of the organisation. • Other indirect emissions (or SCOPE 3). The other emissions indirectly produced by the activities of the organization which are not accounted for under Scope 2 but which are linked to the overall value chain, such as: the purchasing of raw materials, services or other products; employee travel; upstream and downstream transportation of goods; the management of waste generated by the activities of the organization; the use and end-of-life of sold products and services; the amortization of production goods and equipment, etc. The Ministry of Ecology’s guide on how to conduct GHG assessments defines the different scope 3 categories:
8. emissions linked to energy not included in the «direct GHG emissions» and «indirect GHG energy emissions» scopes9. purchasing of products and services10. amortization of assets 11. waste 12. upstream goods transportation 13. professional travel 14. upstream leasing assets 15. investments 16. transportation of visitors and clients 17. downstream goods transportation 18. use of sold products 19. end-of-life of sold products 20. downstream franchise 21. downstream leasing 22. home-work commuting 23. other indirect emissions
➜ Relevant emissions The relevance of an emission category must be defined regarding its contribution to global emissions, its strategic importance (public image, connections with stakeholders, place on the market, etc.), its vulnerability to “carbon risks and opportunities” (fluctuation in fossil fuel prices, exchange markets, restrictive regulation, regional agreements, disputes, etc.), and the levers available to the company to reduce emissions in this category53
Glossary
51. The LPAA (Lima Paris Action Agenda) led by the Secretariat of the UNFCCC could for instance propose such a platform.52. Definitions available on: http://www.bilans-ges.ademe.fr53. Ademe (2014) « Lignes directrices pour le développement d’un guide sectoriel bilan d’émission de gaz à effet de serre » www.ademe.fr/lignes-directrices-developpement-dun-guide-sectoriel-bilan-demission-gaz-a-effet-serre (FR)54. Please refer to the French version of this publication for more information on the carbon profiles of analysed companies.55. Green: emissions of the most relevant scope for the company’s sector have been reported.Red: emissions of the most relevant scope for the company’s sector have not been reported.
Intr
od
uct
ion
, su
mm
ary
an
d r
eco
mm
end
atio
ns

Air France KLM
Alstom Transport
BNP Paribas
Cap Gemini
Carrefour
Crédit Agricole
Danone
EDF
Engie
L’Oréal
Lafarge
Pernod Ricard
Renault
Sanofi
Schneider Electric
Société Générale
Suez Environnement
Total
Veolia Environnement
Vinci
Companies54 Most relevant scopes55 Most relevant scope 3 categories
Climate targets Climate targets on scope 3
1 2
3
1 2
3
1 2
3
1 2
3
1 2
3
1 2
3
1 2
3
1 2
3
1 2
3
1 2
3
1 2
3
1 2
3
1 2
3
1 2
3
1 2
3
1 2
3
1 2
3
1 2
3
1 2
3
1 2
3
1 2
3
1 2
3
1 2
3
scope 3
scope 3
scope 3
scope 3
scope 3
scope 3
scope 3
scope 3
scope 3
scope 3
scope 3
scope 3
scope 3
scope 3
scope 3
scope 3
scope 3
scope 3
scope 3
scope 3
scope 3
scope 3
1 2
3
beges
beges
beges
beges
beges
beges
beges
beges
beges
beges
beges
beges
beges
beges
beges
beges
beges
beges
beges
beges
CDP
CDP
CDP
CDP
CDP
CDP
CDP
CDP
CDP
CDP
CDP
CDP
CDP
CDP
CDP
CDP
CDP
CDP
CDP
CDP
Greenhouse gas emission reporting and climate targetsvarious profiles of companies

16
Crédit AgricoleTa r g e t Crédit agricole has committed to reduce its greenhouse gas emissions by 10% within the scope of the Bilan carbone by 2018, compared to 2015 levels. The tar-get concerns the head office and all the group’s subsidiary companies in France. This target covers 8 scope 3 categories but not the most relevant one, that of “investments” which, up until now, does not appear in the carbon reporting.
Air France KLMTa r g e t Air France KLM line up with IATA’s target of reaching a 50% decrease in CO2 emissions by 2050 compared to their 2005 level. This long term climate target only concerns scope 1. However, this target was not achieved, as between 2005 and 2014, emissions increased by 14%. No specific target was set on scope 3. Since 2014, the company has committed, through the Paris Climate Partnership Agreement, to reduce its emissions per passenger by 20% between 2011 and 2020. In 2014, they achieved a 6.3% decrease compared to the reference level (95 g CO2 / passenger). The scopes of this target are not specified but is probably scope 1 only.
EDFTa r g e t For its activities based in France, EDF has set both relative and absolute cli-mate targets:• relative target: to halve the specific direct emissions of its production facili-ties between 1990 and 2020, in order to reach 30 g CO2 / kWh in metropolitan France (target achieved and even largely exceeded in 2014); • absolute target: to reduce by 30%, over the same period, the global volume of its direct emissions (without constant perimeter, as EDF’s activities are quite stable and predictable compared to other companies).On a group-wide scale, EDF’s only climate target is to maintain the group’s direct CO2 emissions within the limit of 150 g / kWh. In 2012, 2013 and 2014, emissions were well below this limit (102 g CO2 / kWh in 2014).
BNP ParibasTa r g e t The group’s target is to reduce GHG emissions / employee by 10% in 2015 compared to 2012: i.e., from 3.21 t CO2 eq / employee to 2.89 by 2015. This target has been extended until 2020 with a target of 25%. There is no target in absolute terms. No quantifiable target has been set for the most relevant scope 3 category, that of financed emissions.
DanoneTa r g e t Danone has set a double commitment on different scopes: 1. The company wants to reduce its carbon intensity per product (in gCO2e/kg) by 50% per kilo produced between 2008 and 2020, within its direct scope of responsibility (scopes 1, 2 and some scope 3 categories, the purchase of agricultural products excepted). 2. Danone is aiming to reduce its greenhouse gas emission intensity by 50% between 2015 and 2030 (also in gCO2e/kg). It also committed its emissions in absolute terms before 2025.
Alstom TransportTa r g e t Alstom Transport did not set any emission reduction targets, but rather focuses on energy efficiency targets. In September 2015, the company committed to reduce energy consumption of its transport solutions by 20% by 2020 (compa-red to 2014) and to reduce the energy intensity of own operations (factories, offices, etc.) by 10%. Moreover, Alstom agreed on the target proposed by the International Union of Railways (IUC) in September 2014, aimed at reducing final energy consumption of railways operations by 50 % by 2030 and by 60% by 2050, compared to 1990 levels.
EngieTa r g e t Engie has set a reduction target aimed at reducing its CO2 e emission ratio by 10% between 2012 and 2020, only on scope 1.
Cap GeminiTa r g e t On 27 September 2015, Capgemini announced new commitments: the com-pany committed to reduce its CO2 e emissions, by 20%, from scopes 1, 2 and 3, in France by 2020 compared to 2012. This commitment only applies to some of the emissions reported in their regulatory greenhouse gas assessment. This 20%, when applied to the official figure given in their reference document (33 360 t CO2 e) results in a reduction of only 6 672 t CO2 e between 2012 and 2020, which represents only 6% of the company’s global emissions in France reported for the year 2013 in their carbon assessment.
LafargeTa r g e t Lafarge committed to reduce its industrial CO2 emissions by 33% per tonne of cement by 2020 compared to 1990 levels. This target only concerns scope 1, but it is the most relevant category for this company.Carrefour
Ta r g e t The Carrefour group has committed to reduce its CO2 e emissions by 40% by 2025 compared to 2010 (constant perimeter target) and by 70% by 2050. This target covers scopes 1 to 3 (only downstream transportation within scope 3), but the most significant scope 3 categories, purchased products and use of sold products, are not considered in the reporting nor in the reduction target.
Scope 1, 2 Scope 1, 2 et 3
X
Autres
Scope 1, 2
X
Scope 1, 2 et 3 Autres
Scope 1, 2
X
Scope 1, 2 et 3 Autres
Scope 1, 2 Scope 1, 2 et 3
X
Autres
Scope 1, 2 Scope 1, 2 et 3
X
Autres
Scope 1, 2 Scope 1, 2 et 3 Autres
X
Scope 1, 2
X
Scope 1, 2 et 3 Autres
Scope 1, 2 Scope 1, 2 et 3
X
Autres
Scope 1, 2
X
Scope 1, 2 et 3 Autres
Scope 1, 2 Scope 1, 2 et 3
X
Autres
Corporate climate targetsCo
rpor
ate
clim
ate
targ
ets

17
Corporate Clim
ate R
esponsibility
Société GénéraleTa r g e t On 18 November, Société générale committed to reduce their carbon footprint per “occupant” by 20% between 2014 and 2020. The 2014 reference document shows a 5% decrease in emissions per “occupant” between 2012 and 2014, but a 1% increase in absolute terms. This is explained by a 6% increase in the number of “occupants” over that same period.Five scope 3 categories are considered in their reduction target: Purchase of goods and products, Business travel, Fuel-and-energy related activities, Employee commuting and Downstream transportation and distribution. The Investment category is the most relevant, but it does not appear in their CDP and BEGES reporting. The company analysed this category using the ORSE/ABC/Ademe sector guide, but was not satisfied with the outcome, which was not published.
L’OréalTa r g e t In 2014, L’Oréal announced a new climate target aiming for a 60% reduc-tion, in absolute terms, by 2020 compared to 2005 which, unfortunately, only concerns scopes 1 and 2.
TotalTa r g e t Total’s commitment (which has been fulfilled) was to halve their gas flaring on operating sites between 2005 and 2014. It allowed, in 2014, for a 1.5 Mt CO2 drop in Total’s global emissions as reported to CDP, which represents 0.003% of their 2005 emissions.
RenaultTa r g e t Renault has committed to reduce its carbon footprint by 3% per year and per vehicle between 2010 and 2016 in every emission category (scopes 1 to 3) through an analysis of their models life cycle.
Suez EnvironnementTa r g e t On 1 October 2015 Suez Environnement announced new climate commitments. The company is aiming to reduce by 30%, on a group-wide scale, its scope 1 and 2 GHG emissions by 2030 compared to 2014.
Pernod RicardTa r g e t Over the period from 2009 / 2010 to 2019 / 2020, the group has committed to reduce scope 1 and 2 CO2 emissions of its production sites by 30%. This tar-get is expressed in emissions per unit produced. Two remarks: first, to reach the -30% target in 2019 / 2020, there is little effort to be made (-4%), even though the easiest reduction potential is supposed to have been already exploited, and second, the target does apply to scope 3 which accounts for 83% to 88% of recorded emissions.
VeoliaTa r g e t Veolia has set targets on scopes 1 and 2 only: improving the carbon performance of their combustion facilities by 5% between 2011 and 2015 and reaching a methane capture rate of at least 60% in landfill sites by 2020.
SanofiTa r g e t On a group-wide scale, Sanofi has committed to reduce its CO2 emissions (scopes 1 and 2) by 20% between 2010 and 2020. At the end of the year 2014, Sanofi had reduced its emissions by 15%. This is a constant perimeter reduc-tion target aimed at cancelling out any increase or drop in the company’s activities. In absolute terms, Sanofi’s CO2 emissions have dropped by 23% between 2010 and 2020.
VinciTa r g e t Vinci has committed to reduce their carbon intensity (in t CO2e per million euros of turnover) by 30% between 2009 and 2029 on scopes 1 and 2 only. The company is taking action on scope 3 categories, but it has not given any specific target.
Schneider ElectricTa r g e t Schneider Electric has set a -10% reduction target, between 2014 and 2017, on a specific scope 3 category: upstream and downstream transportation. The other climate targets only concern scopes 1 and 2: to stop using SF6 gas in the manufacture of Schneider Electric products by 2025 and to reduce their energy intensity by 3.5% per year.
Scope 1, 2 Scope 1, 2 et 3
X
Autres
Scope 1, 2
X
Scope 1, 2 et 3 Autres
Scope 1, 2
X
Scope 1, 2 et 3 Autres
Scope 1, 2 Scope 1, 2 et 3
X
Autres
Scope 1, 2
X
Scope 1, 2 et 3 Autres
Scope 1, 2
X
Scope 1, 2 et 3 Autres
Scope 1, 2
X
Scope 1, 2 et 3 Autres
Scope 1, 2
X
Scope 1, 2 et 3 Autres
Scope 1, 2
X
Scope 1, 2 et 3 Autres
Scope 1, 2 Scope 1, 2 et 3
X
Autres

18
Companies for which scopes 1 and 2 are the most significant
Companies for which scope 3 is the most significant
Most relevant scope 3 categories - considered
Most relevant scope 3 categories – not considered
No data reported (no reporting)
Air France KLM
Alstom
BNP Paribas
Cap Gemini
Carrefour
Crédit Agricole
Danone
EDF
Engie
L’Oréal
Lafarge
Pernod Ricard
Renault
Sanofi
Schneider Electric
Société Générale
Suez Environnement
Total
Veolia Environnement
Vinci
Total
30 254 523
sr
547 231
333 902
3 581 800
61 687
19 309 657
129 361 112
339 823 803
8 172 319
104 357 133
2 805 235
81 095 139
2 792 584
17 056 166
339 325
26 292 819
598 400 000
44 919 458
15 949 390
1 425 453 283
27 655 711
sr
60 450
8 250
1 629 800
9 573
561 353
65 389 122
131 154 736
58 453
93 291 277
273 314
597 018
607 807
84 053
32 483
6 073 654
44 300 000
26 224 550
2 117 037
68 075
sr
350 400
145 772
1 643 400
35 887
860 404
200 193
4 927 369
124 893
8 441 629
69 943
609 387
592 548
337 126
205 699
1 675 395
4 100 000
7 660 510
274 731
2 530 737
nr
136 381
179 880
308 600
16 227
17 887 900
63 771 797
203 741 698
7 988 973
2 624 227
2 461 978
79 888 734
1 592 229
16 634 987
101 143
18 543 770
550 000 000
11 034 398
13 557 622
65
nr
136 381
172 952
0
16 227
0
61 379
0
294 825
112 678
106 385
55 905
104 398
195 000
62 734
3 153
0
22 759
4 783
555 766
nr
0
0
0
0
13 680 000
2 968 847
0
1 667 000
0
1 617 427
12 968 133
449 179
5 700 000
29 459
569 541
0
929 903
240 824
0
nr
0
601
0
0
0
54 750
0
48 498
0
256
841 469
162 079
55 000
0
355 513
0
612 626
31 292
1 337 263
nr
0
3 789
0
0
0
22 314 555
17 626 102
32 864
0
82 317
140 132
236 569
90 000
4 045
77 631
0
8 029 011
0
Company Total Scope 1 Scope 2 Scope 3 Business Travel
Purchased Goods and Services
Waste generated
Fuel-and-energy related activities
CDP 2014 – in t CO2 eq
Corporate carbon reporting || CDP & BegesCo
rpor
ate
carb
on
repo
rtin
g

19
Corporate Clim
ate R
esponsibility
453 452
nr
0
0
0
0
0
62 543
0
124 742
0
377 038
634 709
54 992
140 000
0
766 070
0
61 065
24 000
176 624
nr
0
0
0
0
0
100 674
0
110 877
0
20 400
45 588
84 034
220 000
485
46 785
0
88 028
0
Included in upstream transportation
nr
0
0
308 600
0
3 040 000
4 333
0
230 969
2 511 549
81 244
336 342
45 990
494 987
4 420
124 097
0
642 061
0
0
nr
0
0
0
0
0
36 662 765
186 115 596
4 883 526
0
0
59 939 278
99 164
5 000 000
0
15 817 033
550 000 000
1 161 512
13 248 823
7 567
nr
0
0
0
0
0
1 541 951
0
91 701
0
173 283
2 338 859
223 016
140 000
0
77 631
0
100 059
7 900
0
nr
0
0
0
0
380 000
0
0
335 868
0
3 628
2 289 077
123 524
4 600 000
0
0
0
0
0
0
nr
0
0
0
0
0
0
0
0
0
0
0
0
0
0
0
0
0
0
0
nr
0
0
0
0
0
0
0
109 831
0
0
0
0
0
0
174 858
0
0
0
0
nr
0
0
0
0
0
0
0
0
0
0
0
0
0
0
0
0
0
0
Employee Commuting
Upstream transportation and distribution
Downstream transportation and distribution
Use of sold products
Amortisation of assets
End of life of products
Upstream leasing
Investments Transportation of visitors and clients

RAC-F Réseau Action Climat-France
is an organisation specialising in climate change issues bringing together 16 national organisations involved in environment, international solidarity, public transport users and alternative energy. RAC-F is the French representative of Climate Action Network (CAN) bringing together 900 organisations worldwide.
RAC-F’s missions:
➜ To provide information on climate change issues.
➜ To follow both governmental and local government measures and actions to combat climate change.
➜ To condemn lobbies and government attempting to slow down and weaken international commitments.
➜ To propose public policies consistent with France’s international commitments.
Climate Action Network groups together organisations involved in combatting climate change. The views and opinions expressed here are those of RAC-F.
Their partners cannot be held responsible for them.
Réseau Action Climat-France
Mundo-m,
47 avenue Pasteur,
93100 Montreuil,
France
Tel : 01 48 58 83 92
www.rac-f.org
Tw : @RACFrance
Facebook :
www.facebook.com/
ReseauActionClimat