corporate branding and consumer … branding and...a total of 250 valid respondents completed a...
TRANSCRIPT

ELK ASIA PACIFIC JOURNAL OF MARKETING AND RETAIL MANAGEMENT
ISSN 2349-2317 (Online); DOI: 10.16962/EAPJMRM/issn. 2349-2317/2015; Volume 6 Issue 4 (2015)
www.elkjournals.com
………………………………………………………………………………………………….
1
CORPORATE BRANDING AND CONSUMER LOYALTY IN THE TELECOMMUNICATION
INDUSTRY: A CASE STUDY OF BHARAT SANCHAR NIGAM LIMITED (BSNL) INDIA
DR. MAKARAND UPADHYAYA
Associate Professor, Department of
Management & Marketing, College Of
Business Administration, University of
Bahrain, Bahrain.
Email. [email protected]
ABSTRACT
Keywords: customer loyalty, Corporate branding, Telecommunication Industry
1. INTRODUCTION
The important role of branding has been
studied extensively as it relates to the
Telecommunication industry which is fast
growing in homogeneity. Technology and
innovation are becoming a standard.
Commoditization- It is growing more and
more difficult to differentiate service
offerings in this industry. Telecom operators
are finding it increasingly difficult to
distinctly differentiate their offering and
consumers are continuously looking out for
a differentiated reliable service they can
identify with. The popular view has been
that brand has positive impact on consumer
behavior. The effective branding strategies
In a fiercely competitive business environment such as the mobile services industry, it is a marketplace reality that
the ability of firms to attract and retain customers ultimately determines their growth and survival prospects. This
study, therefore, investigates how corporate branding in the form of brand name, brand logo, brand color, customer
satisfaction and the size of customer base of Bharat Sanchar Nigam Limited (BSNL) determine customer loyalty in
the telecommunication industry of India. A total of 250 valid respondents completed a questionnaire survey in the
ten regional capitals of India during the Spring break. The questionnaires were analyzed using SPSS and Pearson
correlation was used to establish the relationship between the dependent variable (customer loyalty) and
independent variables (brand name, brand logo, brand color, customer satisfaction and size of customer base). The
results of the empirical study reveal that brand name had the greatest impact on loyalty. Brand color and brand
logo also have a positive correlation on customer loyalty, while size of customer base had lower correlation on
customer loyalty. The results also show that customer satisfaction is a direct antecedent of customer loyalty. We
suggest that managers of Bharat Sanchar Nigam Limited (BSNL) should pay much attention on the color, logo and
customer satisfaction as their marketing strategy weapons, whiles consolidating the market size to prevent customer
switching to other competitors.
ELK ASIA PACIFIC JOURNAL OF MARKETING AND RETAIL MANAGEMENT
ISSN 2349-2317 (Online); DOI: 10.16962/EAPJMRM/issn. 2349-2317/2015; Volume 6 Issue 4 (2015)
2
and its subsequent influence on consumer
decision according to (Davies, Rosa, Rui, &
Stuart, 2001) depends on developing new
organizational norms, so that the brand
would report directly to the top of the
organization; creating new organizational
entities, such as responsible for branding;
motivation and reward system for
employees and effective internal
communication. According to (Aaker,
1991), measuring the influence of branding
strategies largely depends on brand loyalty
which is a measure of the attachment the
customer gives to a brand. (Aaker, 1991)
maintains that what influences customers
most include treating the customer right by
fulfilling customer expectation, staying
close to the customer through creating
customer culture, measuring and managing
customer satisfaction, creating switching,
and providing some unexpected extra
services for the customer. This assertion by
(Aaker, 1991) seems to suggest that
branding can be considered an effective tool
to influence consumer behavior only as a
supporting strategic tool. This makes it
difficult for one to understand the exact
influence branding has on consumer
behavior.
This study therefore aims at studying the
uncertainty surrounding the exact impact of
branding strategies of consumer purchase
preference in the mobile telecommunication
industry in India, with particular attention in
the Delhi metropolis.
2. EMPIRICAL LITERATURE
India’s Telecommunication Industry and
BHARAT SANCHAR NIGAM LIMITED
(BSNL) (marketing strategies)
The spread of mobile phone technology has
varied significantly between countries with
majority of mobile subscribers in the
developing countries (ITU World
Communication, 2013). In 2013, statistics
from the International Telecommunication
Union revealed that the penetration rate of
mobile phone subscribers is 86.2 per 100
inhabitants and the report also suggests that
there are now more mobile phone users in
the developing world than in the developed
world (ITU World Communication, 2013).
Moreover, customers are becoming harder to
please, they are smarter, more price
conscious, more demanding, less forgiving,
and they are approached by many more with
equal or better offers (Hamel, 1996; Kotler
& Keller, 2012). The challenge now is far
beyond producing satisfied customers as
competitors can do it too; the challenge is to
produce delighted and loyal customers
(Keller, Parameswaran, & Jacob, 2011;
Kotler & Keller, 2012).
In 1986, the telephone density of India was
0.26 per cent; this translate to 2.6 telephone
lines per every one thousand (1000) people,
including thirty-five pay phones in the entire
country out of which 32 were located in
Delhi, the national capital. This was one of
the lowest in Asia. In recent times, there is
one phone for every four Indianans
(www.voanews.com/ Report-Asia is the
fastest growing). This tremendous increase
in the telephone density has resulted from
the establishment of the National
Communication Authority Telecom
Regulatory Authority of India (TRAI), and
the subsequent deregulation of the
telecommunication industry. Deregulation
and reduced entry barriers into the Indian
Mobile telephone industry have led to
intense competition as the number of
operators swell-up to contend for market
shares (Frempong, 2002). Mobile Operators
are engaging various marketing strategies to
retain and attract new customers. There are
already six competitors in the industry,

ELK ASIA PACIFIC JOURNAL OF MARKETING AND RETAIL MANAGEMENT
ISSN 2349-2317 (Online); DOI: 10.16962/EAPJMRM/issn. 2349-2317/2015; Volume 6 Issue 4 (2015)
3
namely, Mobile Telecommunications
Network Bharat Sanchar Nigam Limited
(BSNL), Airtel, Vodafone, Idea, Aircel and
Reliance.
Bharat Sanchar Nigam Limited(BSNL),
2011), introduced a project known as the
mobile number portability, which means that
a subscriber can move from one mobile
network to another and still retain your
existing telephone number if they are
dissatisfied with any aspect of the services
provided by their current mobile network or
the customers just want to take advantage of
offers, features or pricing available on a
different network). According to ( BSNL),
2013) the number of data subscribers in
India increased at the end of august, 2013,
showing a growth rate of 2.1%. Also the
overall penetration rate in the country
increased from 40.0% to 40.7% as at the end
of August 2013.While the subscriber base
for mobile voice telephony has shown a
growth rate of 0.1% from 27,244,579
subscribers recorded in July 2013 to
27,511,659 as at the end August 2013. The
market share of mobile operators (telecom
voice) in India for the month of august 2013
is Bharat Sanchar Nigam Limited (BSNL)
46.31%, which is the market leader,
followed by Airtel 21.21%, 13.76%, Idea
12.24% Aircel 5.92% and at the bottom is
Reliance 0.57%.
In its bid to maintain the leading position in
India’s telecommunication, Bharat Sanchar
Nigam Limited (BSNL) has over the years
invested hugely in expansion works to
improve quality of service delivery. Figures
released by the (BSNL)) over the years from
the year 2010 indicates (BSNL) has the
highest number of subscribers.
The continued growth of (BSNL)’s market
share is also linked with continues
introduction of new products. (BSNL) was
the first telecommunication provider to
launch 3G technology system in India
making it a dominant player even at the
international level. As the first mobile phone
service providers to introduce the 3G service
in India gave it subscriber the opportunity to
transmit both data and voice on the network
at a greater speed. The strategy of
introducing new products and services into
the communication industry is believe to be
the contributor to (BSNL)’s high and
increasing subscribers over the years.
Moreover, (BSNL) has carved a positive
public image for itself through corporate
social responsibility and other sponsorship
initiatives.
3. METHODOLOGY
Research design
The study sought to explore the impact of
corporate branding on the sale of goods and
services in the telecommunication industry.
The use of questionnaire was therefore the
best instrument for this research. This
provided a means of acquiring primary data
that was quantified to be used in the analysis
process in order to draw conclusions based
on the sample. In designing the
questionnaire, question were kept short,
simple and clear to ensure proper
understanding of the questions and ease of
answering the questions.
A self-completion questionnaire with closed
questions was developed for primary data
collection. According to (Bryman & Bell,
2003), closed questions have some
advantages: it is easy to process answers; it
enhances the comparability of answers, and
makes them easier to show the relationship
between variables. The questionnaire was
composed of two parts and total 24
statements. The first part was about

ELK ASIA PACIFIC JOURNAL OF MARKETING AND RETAIL MANAGEMENT
ISSN 2349-2317 (Online); DOI: 10.16962/EAPJMRM/issn. 2349-2317/2015; Volume 6 Issue 4 (2015)
4
individual characteristics with two questions
by asking respondents’ gender and the name
of the mobile telecom operator they are
using currently. The second part contained
all four constructs as suggested by (Peng &
Wang, 2006). Several items on each
construct were developed and adopted from
relevant literatures. All of the items were
measured by using a five-point Likert-type
response scales, anchored at 5 strongly agree
and 1 strongly disagrees. The author and
research assistants personally administered
questionnaires to all participants and
received 250 valid responses out of 275
questionnaires in September – October
2014. They helped those who needed
assistance in understanding the questions.
The questionnaire had 3 part; the first part
consist of the demography of the
respondents, the second part finds out the
extent the respondent is uses
telecommunication network and the final
part also examined the extent to which
respondents can match the message or
concept to the brand, the extent to which
respondent has favorable opinions of the
brand and the likelihood of respondents
considering purchasing the service of a
brand.
The researcher also did interviews, including
face to face, and telephone interview. A
critical observation was also made as to the
subject matter of the research. Secondary
data was also used to assess the market
shares of the telecommunication networks.
Pre-testing was used as a valuable indicator
to find out the effectiveness of the
questionnaire. This involved selecting,
approaching and interviewing a small
segment in the same manner which was
followed in the full scale operation. It helped
the researcher to know whether the replies
or questionnaire responses provided the type
of information needed or respondents were
misinterpreting any of the questions. In
addition, results obtained in the pre-test
could suggest new ideas or questions worthy
of further examination. 50 questionnaires
were tested on a sample of 50 respondents in
order to eliminate any ambiguities and
improve clarity in all questions.
Data Collection
The target population were
telecommunication stakeholders including
staff, management, and subscribers. The
study sample consisted of 250 respondents,
comprising of 25 subscribers from the 10
regional capitals of India, as well as
interviews with some key managements and
staff from the headquarters of (BSNL).
A sample size of two hundred and fifty
(250) respondents was selected based on
Saunders et al 2007’s 95 percent confidence
level. Saunders et al 2007 indicates that for a
population size between 2000 and 5000, a
sample size that revolves around 250 will
indicate a 95% confidence level and a 5%
margin of error. A proportionate stratified
random sampling was also used. This
technique was chosen because the
population consisted of sub-groups of
suburbs in the metropolis. Finally, a simple
random method was used to select
respondents for each of the sub-groups.
Conscious effort was made to select only
literate people as respondents because of the
nature of the study, which required
minimum level of knowledge to appreciate
the study
The data collected was based on the impact
of corporate branding on consumer loyalty
in terms of the sale of goods and services in
the telecommunication industry in India
with (BSNL) as the case study. The main
source of data was from the selected tertiary
in the capitals of the ten regions of India.
ELK ASIA PACIFIC JOURNAL OF MARKETING AND RETAIL MANAGEMENT
ISSN 2349-2317 (Online); DOI: 10.16962/EAPJMRM/issn. 2349-2317/2015; Volume 6 Issue 4 (2015)
5
Primary data was mainly collected and
analyzed for the purpose of this research
through the use of questionnaires, as well as
secondary source was also incorporated.
Data Analysis Method and Measurements
Statistical Package for the social scientist
(SPSS) was the software used, to analyzed
the results for this research with the help of
this tool, data was presented as
proportions(%), Pie Chart, tables and graphs
to compare and analyzed the responses to
some of the questions asked.
The study employed a cross-sectional,
qualitative and quantitative approaches
which were appropriate for seeking the
opinion of the target population about a
phenomenon, with a researcher designed
questionnaire for data collection to answer
the research questions (Cooper & Schindler,
2006). This is a descriptive study into
customer loyalty among users of mobile
telecom services and the design is a
quantitative research. The research was
studied from customers’ point of view and
so the population was expected to involve
the people who are consuming mobile
services from the six mobile
telecommunication operators in the capital
city of India.
The decision about the size of the sample
was taken considering time and cost, the
need of precision and a variety of further
considerations (Bryman & Bell, 2003). Due
to the limit of time and costs, the population
was narrowed to mobile phone users in
Delhi. The sample selected was not bias
towards one particular group of users, the
units included people with diverse
demographics and employment status,
ranging from unemployed, traders, artisans,
professionals, students, public and civil
servants, among others. The sample used
was determined by connivance sampling.
From the hypothesis the independent
variables are brand logo, brand color, brand
name, size of subscribers and customer
satisfaction and the dependent variable is
customer loyalty.
4. DATA ANALYSIS AND
RESULTS
Statistical Analysis
The field data was processed by editing;
coding, classification and tabulation to
present a clearer view for analysis. The
coding was necessary for efficient analysis
of data. For this research, coding decisions
were taken at the designing stage of the
questionnaire.
The response categories in Likert scales
have a rank order and therefore could be
referred as ordinal because ordinal scale of
measurement is one that conveys order
(Jamieson, 2004).
Demographic Characteristics of
Respondents
The table below shows the summary
demographic characteristics of the
respondents.
(Refer Table 1 Here)
Table 1 above gives a summary of
respondents’ bio-data. Its displays that,
majority of the respondents contacted during
the study were males. 100 respondents
representing 40 were females and 150
representing 602% of the 250 respondents
interviewed were males. It is also reflected
on the table that, majority of the respondents

ELK ASIA PACIFIC JOURNAL OF MARKETING AND RETAIL MANAGEMENT
ISSN 2349-2317 (Online); DOI: 10.16962/EAPJMRM/issn. 2349-2317/2015; Volume 6 Issue 4 (2015)
6
interviewed had formal education. 73
(29.2%) of the people interviewed had
CERT/ DIP/ HND/ DBS education, 75
(30%) of the people interviewed had first
degree and 48 (19.2) had above first degree
education. And less than a quarter 54
representing 21.6% of the sample
interviewed had SHS and below education.
(Refer Table 2 Here)
Table 2 Table above shows the correlation
between Logo, Brand color, Brand name,
Size of subscribers, customer satisfaction
and customer loyalty. The result shows a
strong positive correlation between the
dependent variable and the independent
variable with exception of size of
subscribers. There is a strong positive
relationship between customer satisfaction
(Tariffs and Promotion) and customer
loyalty r = .992; r= .879 for brand logo and
customer loyalty, r= .727 for Brand Color
and customer loyalty, r= .201 for size of
subscribers and customer loyalty, r= .762 for
Brand name and customer loyalty. However,
the correlation between the size of
subscribers and customer loyalty was not
significant with r= .201. This finding
indicates that, an increase in customer
satisfaction, brand Logo, Brand Color and
brand name will lead to an increase in
customer loyalty. In otherwise, an increase
in the size of subscribers will not have a
considerable effect on customer loyalty.
Given this analysis, the alternative
hypothesis for H1, H2, H3, and H5 are
accepted against the null hypothesis.
There is a significant relationship between
Logo, Brand color, Brand name, and
customer satisfaction with customer loyalty
of BHARAT SANCHAR NIGAM
LIMITED( BSNL) India.
(Refer Table 3 Here)
Table 1: Model Summary
M
od
el
R R
Squ
are
Adjuste
d R
Square
Std.
Error of
the
Estimate
1 .98
4a
.984 .978 .078
ANOVA
Model Sums
of
Squar
es
Df. Mea
n
Squa
re
F Si
g.
1 Regression
129.178
Residual
1.491
Total
130.576
6 21.4
30
34
91.
99
1
.0
0
0b
243 .006
249
Dependent Variable: Customer Loyalty
Source: Field data
The above Table table depicts the summary
results of the regression model formulated
for the independent variables; Logo, Brand
name, Brand color, customer satisfaction
and size of subscribers as well as the
dependent variable Customer Loyalty. The
model derived a correlation coefficient of
R=.994 which indicates a strong linear
relationship between the criterion variable
which is customer loyalty and the predictor
variables Logo, Brand name, Brand color,
customer satisfaction and size of
subscribers. The coefficient of determination
derived ( = .989) indicating approximately
98% of the total variability in the criterion
variable is accounted for by the predictor
variables. In other words, Logo, Brand
name, Brand color, customer satisfaction

ELK ASIA PACIFIC JOURNAL OF MARKETING AND RETAIL MANAGEMENT
ISSN 2349-2317 (Online); DOI: 10.16962/EAPJMRM/issn. 2349-2317/2015; Volume 6 Issue 4 (2015)
7
and size of subscribers can explain
approximately 98% of the amount of
variation (either an increase or a decrease) in
customer loyalty of the telecommunication
industry. The calculated Adjusted R square
derived .988 indicates that, approximately
98% of the impacts on customer loyalty in
the BHARAT SANCHAR NIGAM
LIMITED( BSNL) Company is explained
by the model, whilst 2% variability in the
criterion variable is explained outside the
model. This shows that 2% of the factors
influencing customer loyalty in the
BHARAT SANCHAR NIGAM LIMITED(
BSNL) is explained by other factors like
social responsible and others rather than
Logo, Brand name, Brand color,
advertisement, customer satisfaction and
size of subscribers.
(Refer Table 4 Here)
Table 4 displays the coefficients of the
predictors of Customer Loyalty in the
( BSNL) telecommunication company.
Logo, Brand name, Brand color and
customer satisfaction were proved to be
significant predictors on Customer Loyalty
with the exception of size of Subscribers
(b=.053, t=3.912 p>.05), explains that the
size of subscribers of ( BSNL) is not a
significant predictor of customer loyalty and
that the slope of the size of subscribers on
customer loyalty is no different from zero.
The coefficients derived for the remaining
individual predictors disputes the Null
hypothesis that, the slopes of Logo, Brand
name, Brand color, Advertisement, and
customer satisfaction are equal to zero (Ho:
β=0) on the dependent variable and that, the
predictor variables cannot predict customer
Loyalty of the ( BSNL). This implies that,
the model displays Logo, Brand name,
Brand color, size of subscribers and
customer satisfaction as significant
predictors of customer loyalty in the (
BSNL) Company. β=.039, t= 2.643 for Logo
explains that approximately, ( BSNL) Logo
can predict 3% of the total variability in
customer loyalty when all other predictor
variables are constant and given an error rate
of .015. Also, β= .069, t=5.779 for Brand
Color implies that, approximately 6% of the
total variability in customer loyalty in (
BSNL) could be explain by the Brand Color
of the company given an error of .012 when
all variables are held constant. While β=
.058, t=5.489 for Brand Name implies that,
approximately the Brand Name of ( BSNL)
can have a 5% effect on customer loyalty
with an error of .010 when other predictor
variables are constant. Again, the beta
coefficient of Size of subscribers (.053, t=
3.912) implies that, approximately, 4% of
the total variability of customer loyalty in (
BSNL) could be explain by size of
subscribers given an error of .092 when all
other variables are constant. The beta
coefficient for customer satisfaction
(b=.812, t= 36.260) evinces that,
approximately 81% of the total variability in
customer loyalty of ( BSNL) could be
explain by customer satisfaction with an
error of .005, given that, all other variable
are held constant.
The results analyzed above goes to support
the perception that, Logo, Brand name,
Brand color, Advertisement and customer
satisfaction are positively related to
customer loyalty and that, as any of the
predictor variable increases, customer
loyalty also increases.
In other words, given a significance level of
.05, there exist enough evidence to conclude
that, the slopes of all the predictor variables
are not zero and that they are useful in
predicting customer loyalty in ( BSNL).
Comparison of the beta weights given by the
regression coefficients indicates that,

ELK ASIA PACIFIC JOURNAL OF MARKETING AND RETAIL MANAGEMENT
ISSN 2349-2317 (Online); DOI: 10.16962/EAPJMRM/issn. 2349-2317/2015; Volume 6 Issue 4 (2015)
8
customer satisfaction has greater effect in
explaining customer loyalty of the ( BSNL)
than does Brand name, Brand color,
advertisement and Logo. Again, Brand color
explains greater effect on customer Loyalty
compared to the Brand name, Advertisement
and logo of ( BSNL).
Similarly, the above analysis could
interpreted from a predictive standpoint, in
that, given a 95% confidence level, for every
single unit increase in ( BSNL) customer
satisfaction, the average customer retention
margin will increase between .159 and .177
when all other variable are constant. Again,
at 95% confidence, every single unit
increase of Brand color will increase the
average customer loyalty margin between
.045 and .092 with other variables been
constant. While at 95% confident, ( BSNL)
Brand Name increases the average customer
loyalty margin between .037 and .078
holding other variables constant. (See
Colum labeled 95.0 %.)
Given this analysis, the null hypothesis for
H5 is partially rejected in favor of
alternative hypothesis.
(Refer Table 5 Here)
5. CONCLUSION AND
RECOMMENDATIONS
Conclusion
This paper discusses the implications of the
research findings and making meanings to
the theories discussed. Recommendations,
conclusion, limitations and future research
directions are also made.
Corporate branding and customer loyalty
has become one instruments businesses use
in marketing their product. The competition
in the telecommunication industry in India is
very keen ( BSNL)), 2014, hence the players
in the industry are using several marketing
strategies to survive in the market (Grace &
O’Cass, 2003) and hence this study work
conducted a research to find the relationship
between corporate branding and customer
loyalty of ( BSNL). Even though the study
limited itself on (BSNL), the findings have
implications on the other stakeholders in the
industry.
The variables under corporate branding
(logo, color, size of subscribers, customer
satisfaction and brand name) were subjected
to hypothesis test, and the results matched
with existing theories and empirical research
findings (Barsky, 1995; Besterfield, 1994)
and (Kanji & Moura, 2002), before
recommendations were made.
The results showed a positive correlation
between logo, color, and brand name of
( BSNL) and customer loyalty, which
follows the research findings of (Frempong,
2013) in a similar research. This means that,
corporate bodies can use branding as a tool
to market their product and stay in the game,
in the midst of stiffer competition, since
customer loyalty relates positive to the
branding (Kotler & Keller, 2012). There was
a lower correlation between the size of the
subscribers and customer loyalty, signifying
that, companies should not rely too much on
the size of the market as a tool to market
their product. This findings though negates
the economics of scale theories, yet it holds
in the telecommunication industry in India,
as the statistics on the market share of
individual companies in the industry depicts
( BSNL), 2014.

ELK ASIA PACIFIC JOURNAL OF MARKETING AND RETAIL MANAGEMENT
ISSN 2349-2317 (Online); DOI: 10.16962/EAPJMRM/issn. 2349-2317/2015; Volume 6 Issue 4 (2015)
9
In all, there was a significant positive
relationship between customer satisfaction
and customer loyalty, which means that, the
corporate bodies in as much to use branding
as a marketing tool, should try to satisfy
their customers, based on their basic needs
(competitive pricing, good network, and
customer service) by (Aydin & Ozer, 2005).
Implications/Recommendations
This research provides both theory
development for academics and practical
implication for corporate bodies marketing.
Theoretical Implications: Based on previous
marketing research theories (Kotler &
Keller, 2012). (Frempong, 2013) regarding
branding and competitive marketing, this
study showed clear relationship between the
branding variables (logo, name, slogan,
color) and quality customer loyalty. In the
nutshell, this research support the theory of
positive relationship between branding and
customer loyalty.
Practical Implications: The findings of this
research also provider important evidence
for marketing managers in dealing with
competition and cost cutting marketing
strategies. It is helpful for marketers
understand the effectiveness of relationship
corporate branding and customer loyalty
from both demand and supply sides.
The ( BSNL) company in India, should
capitalized on the love Indian community
have for the color yellow, and paint
commercial buildings such as markets,
drinking bars and food joints with their color
and logo.
Customer services should by improved
alongside serving the specific needs of the
people, rather than banking on the fact that,
(BSNL) has the highest number of
subscribers in the country, since the impact
of the market size had little impact on
customer loyalty.
Firms in using branding as a tool to improve
customer base and sales should also
innovate in their branding approach, bearing
in mind the significance of innovation since
commitment to innovation leads to
competitive advantages among other factors.
6. LIMITATIONS AND FUTURE
RESEARCH
This study investigates the relationship
between corporate branding and customer
loyalty using survey method. Looking at the
variables of branding, the researcher was
limited in selecting only few, because of
time constraints and data source limitations.
Customer loyalty is very subjective, hence
very difficult to measure, this called for the
use of self-intuitions and simulations. Due to
stiffer competition in the
telecommunications in India, for the fear of
trade secrete leakage, managements were
not ready to release certain information,
forcing the researcher to rely heavily on
secondary data from the National
Communication Authority’s website, which
was not up to date.
There were, and still few local literature on
the subject matter, for most literature on
branding and customer loyalty were on
developed countries where their markets are
well developed, so inferring from such
literatures were not too relational.
This study was into corporate branding and
customer loyalty, but it did not go further to
customer retentions, there is therefore the
need to investigate what happen to the loyal
customers in the future, will they continue to
patronize the products based on the
branding? So the researcher propose

ELK ASIA PACIFIC JOURNAL OF MARKETING AND RETAIL MANAGEMENT
ISSN 2349-2317 (Online); DOI: 10.16962/EAPJMRM/issn. 2349-2317/2015; Volume 6 Issue 4 (2015)
10
corporate branding, customer loyalty and
retention.
REFERENCES
Aaker, D. . (1991). Managing brand equity:
capitalizing on the value of a brand
name. New York: The Free Press.
Aydin, S., & Ozer, G. (2005). The Analysis
of Antecedents of Customer Loyalty in
the Turkish Mobile Telecommunication
Market. Eur. J. Marketing, 39(7-8),
910–925.
Barsky, J. (1995). World-class customer
satisfaction. Burr Ridge, IL: Irwin
Professional.
Besterfield, D. H. (1994). Quality Control.
Englewood Cliffs, NJ: Prentice-Hall.
Bryman, A., & Bell, E. (2003). Business
Research Methods. Oxford University
Press Inc., New York.
Cooper, D. R., & Schindler, P. S. (2006).
Business Research Methods (9th ed.).
NY: McGraw-Hill.
Davies, G., Rosa, C., Rui, V. da S., & Stuart,
R. (2001). The Personification
Metaphor as a Measurement Approach
for Corporate Reputation. Corporate
Reputation Review, 4(2), 113–127.
http://doi.org/ISSN: 1363-3589
Frempong, G. (2002). Telecommunication
Reforms- India’s Experience. Denmark.
Frempong, G. (2013). Telecommunication
Reforms-India’s Experience. Denmark.
Grace, D., & O’Cass, A. (2003). An
Exploratory of Service Brand
Associations. Journal of Service
Marketing, 17.
Hamel, G. A. (1996). Competing for the
Future. Harvard Business Press.
ITU World Communication. (2013). The
World in 2013, ICT facts and figures.
Jamieson, S. (2004). How to (ab) use them.
Blackwell Publishing Ltd., Medical
Education, 38, 1212–1218.
Kanji, G., & Moura, P. (2002). Kanji’s
business scorecard. Total Quality
Management, 13(1), 13–27.
Keller, K. L., Parameswaran, M. G., &
Jacob, I. (2011). Strategic Brand
Management: Building, Measuring, and
Managing Brand Equity. Pearson
Education India.
Kotler, P., & Keller, K. L. (2012).
Framework for Marketing
Management. Pearson Education
India.
NCA. (2011). National Communication
Authority , Annual Report. Delhi.
Retrieved from
http://www.nca.org.gh/73/70/Annual-
Reports.html
NCA. (2013). National Communication
Authority Annual Repport. Delhi.
Retrieved from
http://www.nca.org.gh/73/70/Annual-
Reports.html
NCA. (2014). National Communication
Authority, Annual Report. Delhi.
Retrieved from
http://www.nca.org.gh/73/70/Annual-
Reports.html
Peng, L. Y., & Wang, Q. (2006). Impact of
Relationship Marketing Tactics
(RMTs) on Switchers and Stayers in a
Competitive Service Jndustry. Journal
of Marketing Management, 22, 25–59.

ELK ASIA PACIFIC JOURNAL OF MARKETING AND RETAIL MANAGEMENT
ISSN 2349-2317 (Online); DOI: 10.16962/EAPJMRM/issn. 2349-2317/2015; Volume 6 Issue 4 (2015)
11
List of Tables:
Table 2: Summary of Respondents’ Demography
N = 250 Variables Frequency Percentage
Gender Male 150 60.0
Female 100 40.0
Total
250 100
Age groupings 30 years and below 107 42.8
Above 30 years 143 57.2
Total
250 100
Educational Statue
High school and
below 54 21.6
Cert/Dip/HND/DBS 73 29.2
On First Degree 75 30
Above First Degree 48 19.2
Total 250 100
Table 3: Hypothesis Testing- Descriptive Statistics and Pearson Correlations
Variables N Mean SD 1 2 3 4 5
1. Customer Loyalty 250 4.07 0.708
2. Logo 250 4.05 0.401 0.871**
3. Brand Color 250 3.87 0.631 0.721** 0.133
4.Brand Name 250 4.03 0.721 0.760** 0.038 0.267
5. Size of Subscribers 250 3.13 1.05 0.202 0.103 0.011 0.265
6.Customer Satisfaction 250 4.07 0.51 0.993** 0.012 0.312 0.031 0.086
Note: Significance at: **p ≤0.01 (2-tailed)
Table 4: Model Summary

ELK ASIA PACIFIC JOURNAL OF MARKETING AND RETAIL MANAGEMENT
ISSN 2349-2317 (Online); DOI: 10.16962/EAPJMRM/issn. 2349-2317/2015; Volume 6 Issue 4 (2015)
12
Model R R Square Adjusted R Square Std. Error of the Estimate
1 .984a .984 .978 .078
ANOVA
Model Sums of
Squares
Df. Mean Square F Sig.
1 Regression 129.178
Residual 1.491
Total 130.576
6 21.430 3491.991 .000b
243 .006
249
Dependent Variable: Customer Loyalty
Source: Field data
Table 5: Coefficients Predicted
Model
Unstandardized
Coefficients
Standardized
Coefficients T Sig. 95.0%
Confidence
Interval for B
B Std.
Error
Beta Lower
Bound
Upper
Bound
1
(Constant) -.293 .038 -7.773 .000 -.367 -.218
Brand Logo .039 .015 .039 2.643 .009 .010 .069
Brand Color .069 .012 .069 5.779 .000 .045 .092
Brand Name .058 .010 .058 5.489 .000 .037 .078
Size Of Subscribers .053 .014 .053 3.912 .109 .027 .080
Customer Satisfaction .768 .005 .812 6.260 .000 .159 .177
a. Dependent Variable: Customer Loyalty
b. b. Predictors: (Constant), Brand Logo, Brand Color, Brand Name, Size of Subscribers,
Customer Satisfaction (Promotion and tariff)
ELK ASIA PACIFIC JOURNAL OF MARKETING AND RETAIL MANAGEMENT
ISSN 2349-2317 (Online); DOI: 10.16962/EAPJMRM/issn. 2349-2317/2015; Volume 6 Issue 4 (2015)
13
Source: Field data
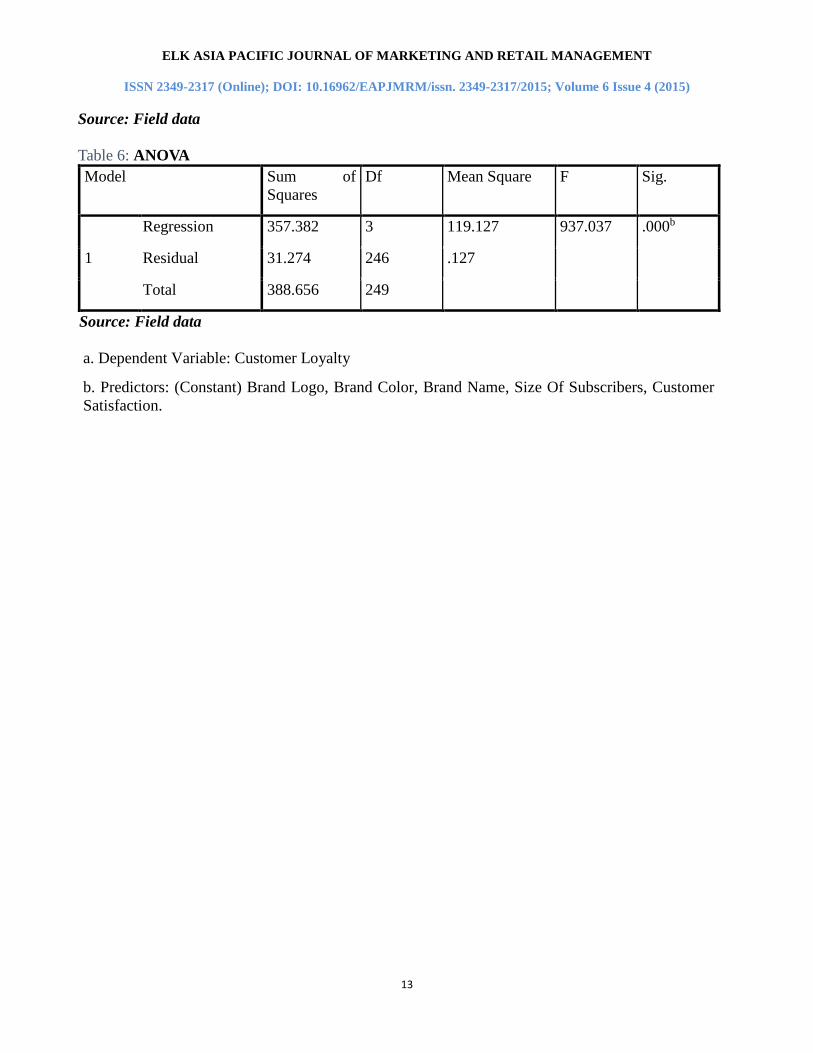
Table 6: ANOVA
Model Sum of
Squares
Df Mean Square F Sig.
1
Regression 357.382 3 119.127 937.037 .000b
Residual 31.274 246 .127
Total 388.656 249
Source: Field data
a. Dependent Variable: Customer Loyalty
b. Predictors: (Constant) Brand Logo, Brand Color, Brand Name, Size Of Subscribers, Customer
Satisfaction.